- 1 Laboratory of Brain and Cognition, National Institute of Mental Health, National Institutes of Health, Bethesda, MA, USA
- 2 Helen Wills Neuroscience Institute, University of California, Berkeley, CA, USA
It is well known that people take advantage of prior knowledge to bias decisions. To investigate this phenomenon behaviorally and in the brain, we acquired fMRI data while human subjects viewed ambiguous abstract shapes and decided whether a shape was of Category A (smoother) or B (bumpier). The decision was made in the context of one of two prior knowledge cues, 80/20 and 50/50. The 80/20 cue indicated that upcoming shapes had an 80% probability of being of one category, e.g., B, and a 20% probability of being of the other. The 50/50 cue indicated that upcoming shapes had an equal probability of being of either category. The ideal observer would bias decisions in favor of the indicated alternative at 80/20 and show zero bias at 50/50. We found that subjects did bias their decisions in the predicted direction at 80/20 but did not show zero bias at 50/50. Instead, at 50/50 the subjects retained biases of the same sign as their 80/20 biases, though of diminished magnitude. The signature of a persistent though diminished bias at 50/50 was also evident in fMRI data from frontal and parietal regions previously implicated in decision-making. As a control, we acquired fMRI data from naïve subjects who experienced only the 50/50 stimulus distributions during both the pre-scan training and the fMRI experiment. The behavioral and fMRI data from the naïve subjects reflected decision biases closer to those of the ideal observer than those of the prior knowledge subjects at 50/50. The results indicate that practice making decisions in the context of non-equal prior probabilities biases decisions made later when prior probabilities are equal. This finding may be related to the “anchoring and adjustment” strategy described in the psychology, economics, and marketing literatures, in which subjects adjust a first approximation response – the “anchor” – based on additional information, typically applying insufficient adjustment relative to the ideal observer.
Introduction
When making decisions, people take advantage of available prior knowledge to bias their choices (Green and Swets, 1966). This common-sense behavior increases the chance that decisions will be correct. In the laboratory, researchers study the effects of prior knowledge on decision bias by asking subjects to make choices in the context of two or more prior knowledge conditions. For example, consider a prior knowledge condition indicating that Alternative 1 has an 80% and Alternative 2 has a 20% chance of being the correct choice; we will call this an 80/20 prior knowledge condition. In many experiments (Green and Swets, 1966; Healy and Kubovy, 1978, 1981; Maddox, 2002), subjects trained and tested on an 80/20 prior knowledge condition are also trained and tested on the inverse condition: 20/80, in which Alternative 1 has an 20% and Alternative 2 has an 80% chance of being the correct choice. In some cases the 50/50 condition, in which each alternative has a 50% chance of being the correct choice, is also tested. Under such experimental conditions, the performance of human subjects approximates that of the ideal observer, who would bias decisions in favor of the indicated alternatives at 80/20 and 20/80 and exhibit zero bias at 50/50 (Green and Swets, 1966; Healy and Kubovy, 1978, 1981; Maddox, 2002).
Inverse prior knowledge conditions are convenient for counterbalancing experimental factors in the laboratory. In the real-world, however, inverse prior knowledge conditions are rarely experienced during a time period as short as that of a typical experiment. In a more common real-world scenario, a certain prior knowledge condition can be relevant to a decision at one time, indicating that a bias is then appropriate, but cease to be relevant to a decision at a later date. People often fail to adopt the appropriate bias of zero in the later decision, presumably because they have difficulty ignoring the previously learned but no longer relevant prior knowledge. This phenomenon is familiar to us all. In fact, although decision researchers use the word bias to refer to an optimizable quantity, the common English usage connotes an undesirable influence that ideally should be set aside. Thus, the typical laboratory approach of inverting prior knowledge conditions within subjects does not adequately reflect real-world constraints.
To address this problem experimentally, we probed the behavioral and fMRI responses of human subjects viewing ambiguous abstract shapes and deciding whether a shape was of Category A (smoother) or B (bumpier). The decision was made in the context of one of two prior knowledge cues, 80/20 and 50/50. The 80/20 cue meant that upcoming shapes had an 80% probability of being of one category, e.g., B, and a 20% probability of being of the other; we refer to the 80 and 20% categories as indicated and contraindicated respectively. The 50/50 cue meant that upcoming shapes had an equal probability of being of either category. Subjects learned the meaning of the cues in pre-scan training runs. During training, the 80/20 and 50/50 cues were accompanied by 80/20 and 50/50 target distributions, respectively; the training distributions were created by manipulating the prior probability of occurrence of the physical targets themselves, rather than changing the category boundary. No subject experienced inverse prior knowledge conditions; for example, a subject who learned that 80/20 indicated Category A never had to relearn the task with a 20/80 cue contraindicating Category A. We found that subjects’ decisions made in the context of both the 80/20 cue and the 50/50 cue were biased in the direction indicated by the 80/20 cue. In the 50/50 condition, the magnitude of the bias was diminished relative to the 80/20 condition, but failed to reach the zero bias predicted for the ideal observer. The persistent bias suggested that even when the chance of either target type was equal, the targets were processed at some level by the prior knowledge subjects as indicated or contraindicated. Therefore, we predicted that, in some brain areas, differences in fMRI activation elicited by indicated vs. contraindicated targets in the 80/20 runs would be persistent, though perhaps diminished, in the 50/50 runs. This hypothesis found confirmation in fMRI data from frontal and parietal regions previously implicated in decision-making. As a control, we acquired fMRI data from naïve subjects who experienced only the 50/50 stimulus distributions during both the pre-scan training and the fMRI experiment. The behavioral and fMRI data from these naïve subjects reflected decision biases closer to those of the ideal observer than those of the prior knowledge subjects at 50/50. These findings have important implications for understanding decision-making under ambiguity in real-world conditions.
Materials and Methods
Participants
In this study, we acquired fMRI and behavioral data from 58 subjects, all of whom provided informed consent before the experiment. All procedures were approved by the National Institute of Mental Health Institutional Review Board. All subjects were right-handed and had normal or corrected-to-normal vision. Here we present the data from 45 subjects (22 male) of mean age 25 years (range 20–41). Data from the remaining subjects were excluded because of a report that uncomfortably dry eyes prevented the subject from focusing on the stimuli, a broken shim coil, unacceptably low estimates of d′ or patterns of random button presses that led to poor fits to psychometric functions.
Stimuli and Task
Targets were distorted circles (Wilkinson et al., 1998) whose sinusoidal modulation ranged linearly from 4 to 22% of the mean radius, with step size 0.5%. The smoothest target was defined as the Category A prototype, and the bumpiest as the Category B prototype (Figure 1). Distributions of Category A and B shapes were Gaussian and overlapping (Healy and Kubovy, 1981; Maddox, 2002). The overlapping distributions made intermediate targets ambiguous, so that the targets alone would not contain sufficient information for subjects to classify them with perfect accuracy. The distorted circle stimuli were created in MATLAB (Version 7.31) according to and adapted from equations from Wilkinson et al. (1998). The shape contour of each stimulus, r(θ), was created by sinusoidally modulating the radius of a circle:

where r and θ (in radians) are the polar coordinates of the contour, rmean is its mean radius and A, ω, φ are, respectively, the amplitude (expressed as a proportion of the radius), radial frequency, and phase of the modulation. Setting A to 0 defines a perfect circle. The cross-sectional profile of each stimulus, c, was modified by blurring the shape contour exponentially:

where r is the set of all distances between the central point and the image edge, r(θ) is as defined in Eq. 1, and σ determines the peak spatial frequency of the output image (peak spatial frequency = √2 / πσ). The color of the distorted circles was converted to black and the background was converted to gray. Stimuli were presented with the Presentation software (Version 10.22) and projected onto a translucent screen placed at the foot of the scanner bed. Subjects viewed a reflection of the back-projected stimuli.
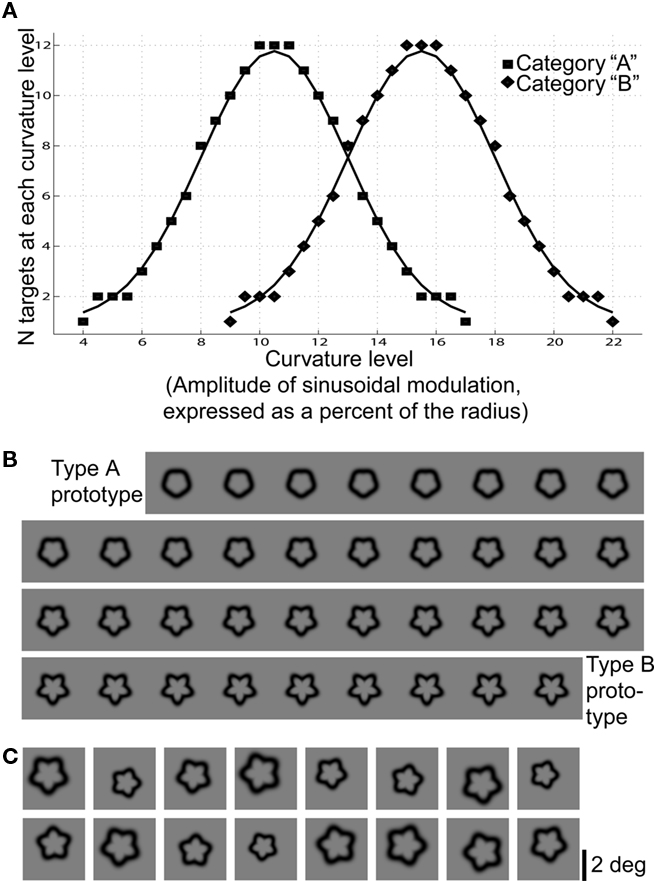
Figure 1. Target distributions and visual appearance. (A) The distributions of Category A and B shapes shown during all fMRI runs were Gaussian and overlapping. Curvature levels between 9 and 17% of the radius were ambiguous, i.e., shapes of these curvature levels could be of either category. (B) The visual appearance of all curvature levels used. Neighboring shapes were difficult or impossible to discriminate from one another, preventing subjects from using a visual memorization strategy to perform the task. (C) In the experiment, the shapes were jittered in size, position, and orientation, as in the examples shown here.
The task (Figure 2) was to decide whether a shape was Category A or B. The shapes were presented one at a time with random sizes, orientations, and locations to encourage the use of stimulus shape to make decisions and to prevent subjects from relying on retinotopic location or spatial attention in order to perform well. No part of any shape subtended more than two radial degrees, and the location of the fixation cross was inside each shape. Before each shape a cue was presented; the same cue was used throughout each run. To ensure that the subject did not forget the prior knowledge condition during the run, the cue was repeated at the beginning of each trial.

Figure 2. Trial structure during training and scanning. For decision trials, subjects were instructed to decide whether each target was of Category A or B. For catch trials, subjects were instructed to continue fixating and await the next trial. A small fixation dot was present during the stimulus epoch of each trial and during the delay and response epochs of both decision and catch trials.
Before entering the scanner, 22 subjects underwent behavioral training that included explicit prior knowledge cues, 80/20 and 50/50. The indicated target category – that is, the category indicated by 80 in the 80/20 training runs – was A for 8 subjects and B for 14 subjects. In the training, two 80/20 and two 50/50 runs were interleaved. For each subject, the order was 50/50 run 1, 80/20 run 1, 50/50 run 2, 80/20 run 2. The 80/20 training runs were comprised of 80% indicated (i.e., having curvature smoother than the mean sinusoidal modulation of 13% if the indicated category was A, or bumpier than 13% if the indicated category was B) and 20% contraindicated targets. The 50/50 runs were comprised of 50% of each target type. Thus, during training, the explicit prior knowledge cues reflected the implicit prior probability distributions of the targets. Subjects received feedback after each training trial. These 22 subjects were informed explicitly that the target distributions were 80/20 and 50/50, and their understanding of this concept was confirmed by their answers to questions during pre-training instruction. For these subjects, the scanning runs differed from training runs in three respects. First, all scanning runs were comprised of 50% indicated and 50% contraindicated targets, such that the targets in each 80/20 run were identical to the targets in a 50/50 run. This control ensured that differences between prior knowledge conditions could be attributed only to the cue and not to stimulation differences. Second, subjects did not receive feedback during scanning. Third, one-third of the trials in each scanning run were catch trials, in which a blank screen took the place of the target and subjects were instructed to make no response. The inclusion of catch trials permitted us to obtain estimates of activity during decisions vs. catch trials within each priors cue condition.
The remaining 23 subjects underwent pre-scan behavioral training at the 50/50 distribution only and experienced the sham cue (OO/OO) during both the training and the fMRI experiment. These naïve subjects were never exposed to the 80/20 distributions experienced during training by the prior knowledge subjects, and were not informed explicitly that the underlying distributions were always 50/50. In other respects, the instructions, training, and fMRI experiment were identical for the naïve subjects and the prior knowledge subjects.
The order of trial types (Category A target, Category B target or catch trial) for the scanning runs was determined by assigning each run a different ternary m-sequence. M-sequences are efficient in terms of signal per time, especially for relatively short scan durations, and are exactly counterbalanced over time, minimizing any uncontrolled adaptation or expectation effects (Sutter, 2001; Burac?as and Boynton, 2002). M-sequences were generated using code written by G. Burac?as (Burac?as and Boynton, 2002). Each run-length m-sequence was length 34 − 1 = 80, consisting of 27 Category A stimulus trials, 27 Category B stimulus trials, and 26 catch trials; thus 33% of the trials were catch trials. Each trial lasted 2.5 s. A blank grayscale screen was shown for 10 s at the beginning of each run to allow the magnetic field to reach equilibrium and for 12.5 s at the end of each run to allow for the delay in the hemodynamic response. The cue was 50/50 on six runs and 80/20 on six runs, with the cue type alternating pseudorandomly from run to run.
Imaging Data Acquisition and Preprocessing
All MRI data were collected on a GE 3-Tesla scanner with a GE whole-head 8-channel coil. For fMRI we used an echo-planar imaging (EPI) sequence with repetition time (TR) = 2.5 s per shot (=2.5 s per acquired brain volume), echo time (TE) = 30 ms, field of view 22 cm by 22 cm, resolution 64 × 64 voxels per slice (in-plane voxel size 3.4 mm × 3.4 mm), and slice thickness 3.0 mm. Each fMRI brain volume consisted of 38 axial slices. For anatomical images we used an magnetization prepared rapid acquisition gradient echo (MP-RAGE) sequence with field of view 24 cm by 24 cm, 128 locations per slab and slice thickness 1.2 mm. Unless otherwise noted, preprocessing and subsequent analysis of the MRI data was performed with the AFNI software package (Cox, 1996; Cox and Hyde, 1997). Italics indicate AFNI function names. The first four brain volumes of every fMRI run were removed and brain volumes were time-shifted to account for the acquisition time of each slice. Data from each run were registered and motion-corrected using 3dvolreg. Each subject’s T1-weighted anatomical dataset was warped via 12-parameter affine transform to a single template volume (the N27 “Colin” brain) in Talairach space using @auto_tlrc.
ROI Identification
To identify regions of interest (ROIs), we first estimated fMRI responses in the 80/20 runs to the presentation of targets indicated and contraindicated by the 80/20 cue. Two sequences of 0s and 1s, where the 1s represented indicated and contraindicated targets respectively, were convolved with a model hemodynamic function using waver to create the regressors for the analysis. Other inputs to the GLM were the estimates of head motion produced by 3dvolreg. The GLM analysis was performed using 3dDeconvolve. Outputs were voxelwise beta weights representing the percent signal change vs. baseline attributable to each regressor. Signal variability attributable to head motion estimates was assigned to the baseline. A random effects analysis (random effect of subject) was performed on the betas produced by the individual GLMs. using 3dAnova2 to calculate the mean responses to indicated and contraindicated targets and to obtain indicated vs. contraindicated differences.
From the group analysis results, a mask was derived identifying voxels where indicated vs. contraindicated differences, as well as either the indicated or contraindicated mean activity levels, exceeded uncorrected p < 0.01. Taking account of the mean activity levels ensured that the results would reflect differences between activations, not differences between deactivations. The smoothness of each group analysis result was calculated using 3dFWHMx with an input of s = m/t, where m is the coefficient or mean value and t is the t-statistic. A cutoff for significant cluster size (corrected p-value 0.05) was determined using AlphaSim with inputs of derived smoothness, connectivity 5.9 mm (the distance between voxel vertices), and a p-value of 0.01 (the uncorrected p-value). Clusters exceeding cutoff were identified using 3dmerge. Talairach coordinates for the ROIs were determined by affine registration to the TT-N27 brain template, and Brodmann area equivalents were derived from the Talairach–Tournoux atlas (TT-Daemon).
Tuning Curves
To derive tuning curves from the within-ROI data, we sorted the trials by curvature level into nine bins ranging from smoothest to bumpiest. We performed a separate GLM analysis for each subject and prior knowledge condition, estimating fMRI responses to the presentation of targets within each bin. Nine sequences of 0s and 1s, where the 1s represented targets in a given bin, were convolved with a model hemodynamic function using waver to create the regressors for the analysis. Other inputs to the GLM were the estimates of head motion produced by 3dvolreg. The GLM analysis was performed using 3dDeconvolve. Outputs were voxelwise beta weights representing the percent signal change vs. baseline attributable to each regressor. Signal variability attributable to head motion estimates was assigned to the baseline.
For each subject, the ROIs derived from the contraindicated vs. indicated analysis on the 80/20 data were converted to individual brain space. The betas corresponding to each subject’s fMRI responses to each of the nine curvature bins at 80/20 and 50/50, respectively, were sampled from and averaged within each individual ROI. The grand means and SE across subjects were calculated for each bin and prior knowledge condition, and the results were plotted as tuning curves across the dimension of curvature bins.
Results
Behavior
The behavioral data acquired during fMRI data acquisition indicate that training with the prior knowledge cues induced a decision bias during the fMRI experiment. In this paper we refer to subjects trained that the 80/20 cue indicated smoother targets as Group A prior knowledge subjects and to subjects trained that the 80/20 cue indicated bumpier targets as Group B prior knowledge subjects. During the fMRI experiment, Group A (or B) prior knowledge subjects responded “A” (or “B”) for a given shape during the 80/20 runs more often than did the naïve subjects making decisions about the same shapes (Figure 3; orange for Group A prior knowledge, red for Group B prior knowledge, black for naïve). The decision bias observed in the prior knowledge subjects during 80/20 runs was retained (although diminished in magnitude) when the cue was 50/50. That is, during the fMRI experiment, Group A (or B) prior knowledge subjects responded “A” (or “B”) for a given shape during the 50/50 runs more often than did the naïve subjects making decisions about the same shapes (Figure 3; light blue for Group A prior knowledge, dark blue for Group B prior knowledge, black for naïve). The magnitude of the persistent bias at 50/50 was diminished relative to the magnitude of the bias at 80/20. In Figure 3, the diminishment is shown as a shift to the left or right between the 80/20 curves and 50/50 curves within each prior knowledge subject group (orange to light blue for Group A, red to dark blue for Group B). If the bias had diminished to zero in the 50/50 runs for the prior knowledge subjects, this would have appeared as overlapping report curves in the naïve subjects and in the 50/50 runs from all prior knowledge subjects, but such was not the case.
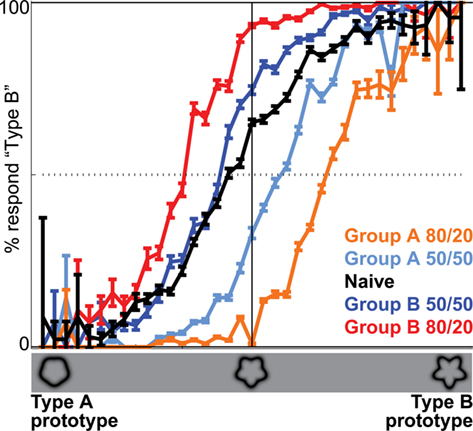
Figure 3. Priors training biases decision reports at 50/50 relative to naïve subjects. Orange and light blue: reports from Group A subjects, who were trained on both 80/20 and 50/50 stimulus distributions and who learned that 80/20 meant 80% probability of A and 20% probability of B. Black: reports from naïve subjects, who were trained on the 50/50 stimulus distributions only and who were not explicitly informed of the probability ratio. Red and dark blue: reports from Group B subjects, who were trained on both 80/20 and 50/50 stimulus distributions and who learned that 80/20 meant 80% probability of B and 20% probability of A. The dotted horizontal line indicates chance performance. The shift in the curves from orange to red indicates that given the same target, Group A subjects responded “A” more often than Group B subjects when the cue was 80/20. The shift in the curves from light to dark blue indicates that given the same target, Group A subjects also responded “A” more often than Group B subjects when the cue was 50/50. The black curve is intermediate to the light and dark blue curves, indicating that the naïve subjects’ responses were intermediate to the Group A and B subjects’ responses at 50/50.
Criterion values for all subject groups and prior conditions, as well as criterion values expected from the ideal observer, are presented in Table 1. Subjects in the 80/20 condition set their criterion values closer to the optimal value for 50/50 than would the ideal observer, as is seen in the Figure 3 curves. Table 1 also demonstrates that the converse was true: Subjects in the 50/50 condition set their criterion values closer to the optimal value for 80/20 than would the ideal observer. Thus, it appears that previous experience not only prevented subjects from setting aside previously learned non-zero biases when a zero bias would have been appropriate, but also prevented subjects from attaining adequate non-zero bias when a condition with a smaller optimal bias had been previously learned.
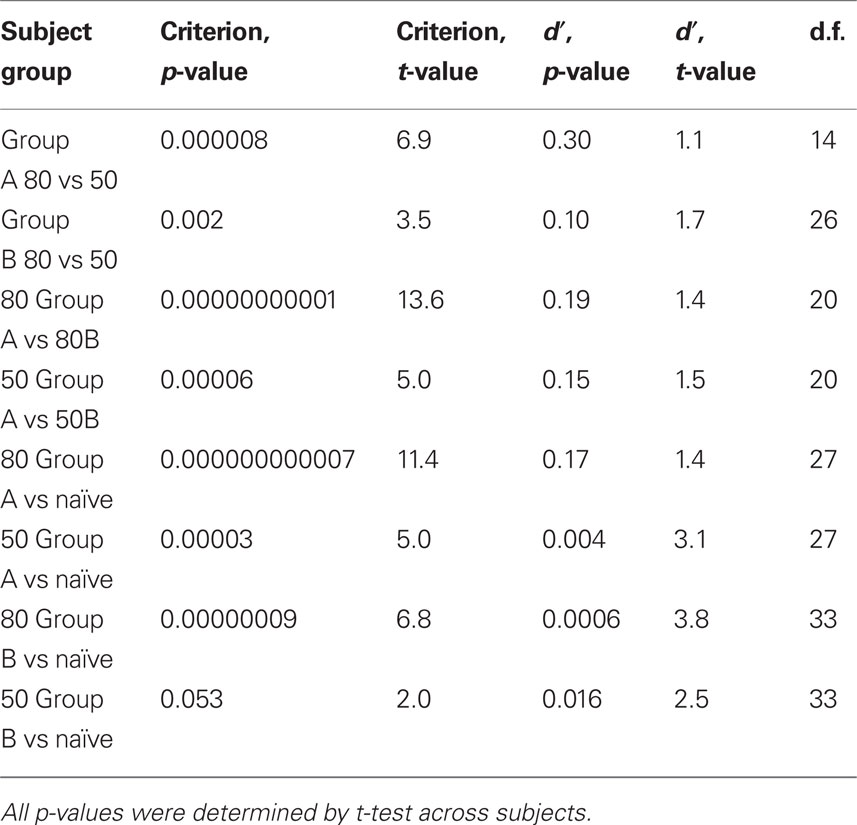
We performed t-tests to test for significance of the differences between mean criterion values across subject groups and prior knowledge conditions (Table 2). In most cases, the differences were highly significant (p < 0.0001). The differences did not attain significance in only one case, naïve vs. Group B 50/50 (p > 0.14).
The persistent bias at 80/20 was evident not only in the response categories but also in the response times (RTs). RTs in the prior knowledge subjects were faster, even at 50/50, for indicated than contraindicated targets (Figure 4, diamonds vs. squares). For the Group A prior knowledge subjects, the p-values by paired t-test for differences between indicated vs. contraindicated RTs were less than 0.00001 at 80/20 and less than 0.05 at 50/50. For the Group B prior knowledge subjects, the p-values by paired t-test for differences between indicated vs. contraindicated RTs were less than 0.00001 at 80/20 and less than 0.01 at 50/50.
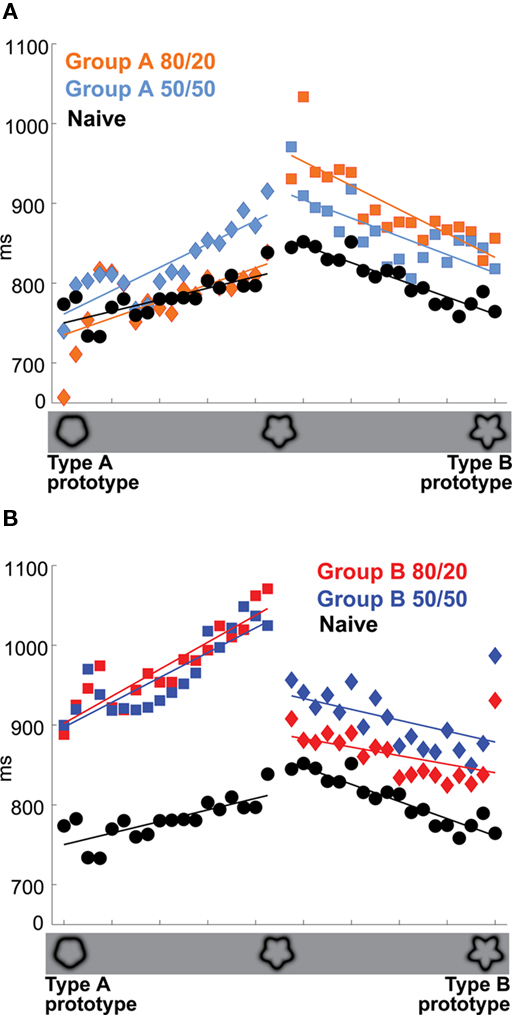
Figure 4. Priors training slows response time at 50/50 relative to naive subjects. (A) Group A vs. naive subjects. Colors and x-axis are as in Figure 3. Diamonds: Targets indicated as likely in the 80/20 training. Circles: Targets presented to naive subjects. Responses to indicated targets were faster than responses to contraindicated targets, even when the cue was 50/50: p < 0.00001 at 80/20, p < 0.05 at 50/50. (B) Group B vs. naive subjects. Format as in (A); p < 0.00001 at 80/20, p < 0.01 at 50/50. All p-values were determined by paired t-test.
fMRI Activity
The persistent though diminished behavioral bias at 50/50 suggested that even when the chance of either target type was equal, the targets were processed at some level by the prior knowledge subjects as indicated or contraindicated. Therefore, we predicted that, in some brain areas, differences in fMRI activation elicited by indicated vs. contraindicated targets in the 80/20 runs would be persistent, though perhaps diminished, in the 50/50 runs. This general prediction led to three hypotheses. The first hypothesis was that in brain regions with a different pattern of fMRI activation to indicated vs. contraindicated targets in the prior knowledge subjects at 80/20, a similar though perhaps diminished pattern would be observed in the prior knowledge subjects at 50/50. The second hypothesis was that the observed indicated vs. contraindicated pattern would be consistent across both the Group A and the Group B prior knowledge subjects. This hypothesis predicts a reversed pattern of fMRI activation to smoother vs. bumpier targets in Group B relative to Group A, because the indicated/contraindicated targets were smoother/bumpier for Group A and bumpier/smoother for Group B. The third hypothesis was that the fMRI activations in the naïve subjects, plotted in terms of smoother vs. bumpier targets, would be intermediate to those of the Group A vs. Group B prior knowledge subjects in the 50/50 runs.
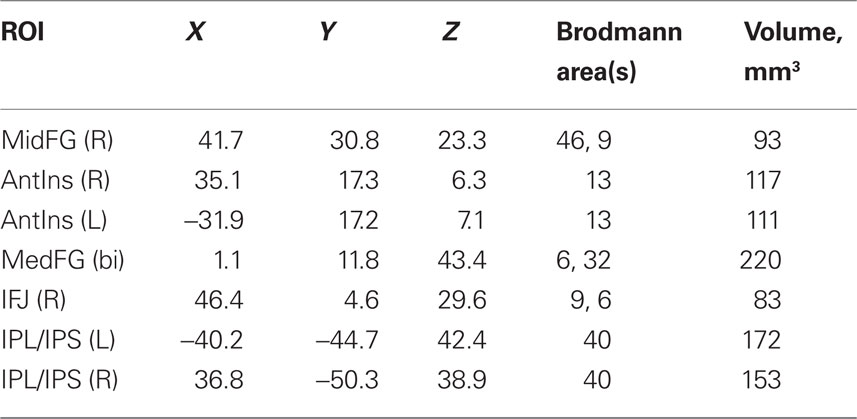
To test these predictions, we first identified ROIs where a subtraction between the activation to the set of all indicated targets at 80/20 vs. the activation to the set of all contraindicated targets at 80/20 produced significant results. After correction for multiple comparisons, the surviving clusters were right middle frontal gyrus (MFG), bilateral inferior frontal junction (IFJ), bilateral medial frontal gyrus (MedFG), bilateral anterior insula (AI), and bilateral inferior parietal lobule and intraparietal sulcus (IPL/IPS), as illustrated in Figure 5. For coordinates, Brodmann area equivalents and ROI volumes, see Table 3.
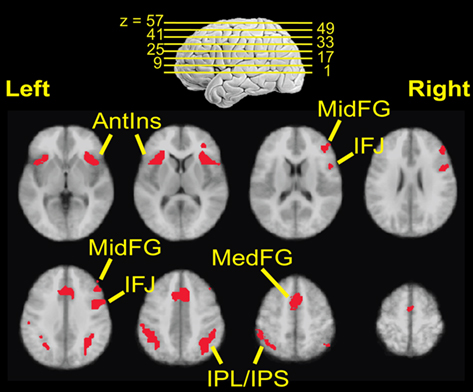
Figure 5. Regions of interest locations. Locations are defined from observations of a significant difference in fMRI signal between indicated and contraindicated targets in the 80/20 prior knowledge condition.
We then plotted the within-ROI data from both cue conditions in the prior knowledge subjects and from the naïve subjects as tuning curves along the dimension of target curvature (Figure 6). To produce the tuning curves, the targets were first sorted by curvature level into nine bins. Activations were then calculated for each individual subject via a multiple regression analysis, with nine regressors each representing all of the targets in one bin. For the prior knowledge subjects the multiple regression analysis was performed twice, once for the 80/20 data and once for the 50/50 data. Within each individual subject, cue condition and ROI, the average activation elicited by each target bin was calculated. These results were averaged across subjects to obtain within-ROI grand means and SE. By plotting grand means and SE, we obtained within-ROI tuning curves along the dimension of smooth to bumpy target curvature.
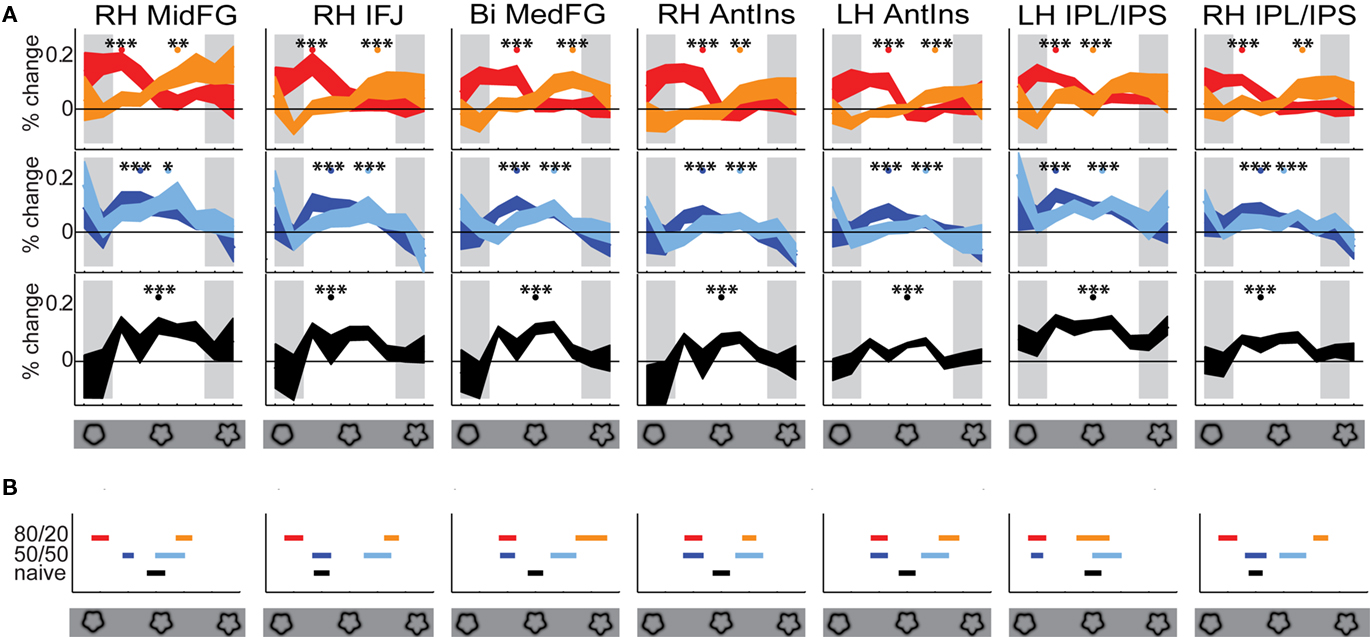
Figure 6. Frontal and parietal selectivity at 80/20 for contraindicated shapes is persistent at 50/50. (A) Colors and x-axis are as in Figure 3. Curvature levels were binned into 9 bins; the curves show mean within-ROI fMRI signal level vs. baseline at each bin. Shading indicates ±1 SE across subjects. Gray shading indicates bins in which the targets were not ambiguous. Colored dots above the curves show the median curvature level, across subjects, of the maximum fMRI response within the ambiguous portion of the stimulus set. Stars indicate significance levels of the difference between the activity at these levels vs. the mean activity level across all ambiguous bins, calculated by one-tailed t-test; ***p < 0.001; **p < 0.01; *p < 0.05. The estimated significance levels indicate that the peaks are in fact peaks; that is, the curves are not flat. (B) Colors are as in (A); x-axis represents the ambiguous portion of the stimulus set. The median curvature levels of the maximum fMRI responses from (A) are grouped together here for easy comparison. Error bars represent ±1 SE across subjects. In all ROIs, the 50/50 Group A and B medians fell on the same side of the midpoint as the 80/20 Group A and B medians respectively. In no ROI did the naïve median fall outside the range between the Group A and B medians at 50/50.
The 80/20 tuning curves for each ROI are plotted in Figure 6A. Within the parts of the 80/20 tuning curves corresponding to ambiguous targets, every tuning curve peaked at a contraindicated bin (bumpier for Group A subjects, smoother for Group B subjects). In every ROI, the 80/20 activation magnitude at that bin was significantly (p < 0.0001 via one-tailed t-test across subjects) greater than the mean 80/20 activation across all bins. To test our first and second hypotheses – namely, that a similar though perhaps diminished pattern of fMRI activation would be observed in the prior knowledge subjects at 50/50 relative to 80/20, and that the pattern of fMRI activation to smoother vs. bumpier targets would be reversed in Group B relative to Group A at both 80/20 and 50/50 – we then examined the 50/50 tuning curves from Group A and Group B (Figure 6A, middle). The results were consistent with our hypotheses. Within the parts of the 50/50 tuning curves corresponding to ambiguous targets, every tuning curve peaked at a contraindicated bin (bumpier for Group A subjects, smoother for Group B subjects), and in every ROI, the 50/50 activation magnitude at that bin was significantly (p < 0.01 via a t-test across subjects) greater than the mean 50/50 activation across all bins.
To further quantify these observations, we identified the peak ambiguous bin in each individual prior knowledge subject at 80/20 and at 50/50. The across-subject medians of these values are plotted in Figure 6B. Consistent with our hypotheses, in all ROIs the 50/50 Group A and B medians fell on the same side of the midpoint as the 80/20 Group A and B medians respectively.
To test our third hypothesis – namely, that the fMRI activations in the naïve subjects, plotted in terms of smoother vs. bumpier targets, would be intermediate to those of the Group A vs. Group B prior knowledge subjects in the 50/50 runs – we then examined the tuning curves from the naïve subjects (Figure 6A, bottom, and Figure 6B, black). Consistent with our hypothesis, in no ROI did the naïve median fall outside the range between the Group A and B medians at 50/50. Thus, the results supported each of our three hypotheses, confirming that the signature of a persistent though diminished bias at 50/50 was evident in the fMRI data from the identified frontal and parietal ROIs.
We also searched for overall differences in activation across all targets between prior knowledge subjects at 80/20 vs. 50/50, between prior knowledge subjects at 80/20 vs. naïve subjects, and between prior knowledge subjects at 50/50 vs. naïve subjects. However, in none of these comparisons did a cluster anywhere in the brain survive correction for multiple comparisons. We conclude that the persistent bias at 50/50 did not occur because the 80/20 training caused parts of the brain to be more or less active overall in the prior knowledge subjects than in the naïve subjects. Instead the 80/20 training induced a dynamic pattern in the frontal and parietal data that was retained in the 50/50 condition and not experienced by the naïve subjects.
Discussion
This study produced three main findings. (1) After subjects were trained on an 80/20 prior knowledge condition, they continued to exhibit a decision bias in favor of the learned indicated alternative, even when explicitly informed that the current prior knowledge condition was 50/50. At 50/50, the bias diminished in magnitude relative to 80/20 but did not reach zero. This observation held both for Group A subjects, who were trained that the 80/20 cue indicated an 80% chance of Category A, and for Group B subjects, who were trained that the 80/20 cue indicated an 80% chance of Category B. Thus, the behavioral data demonstrate compellingly that even when subjects were made explicitly aware that the condition was 50/50 – i.e., that the appropriate bias was zero – they were not able to set aside the previously learned bias. (2) In a network of frontal and parietal brain regions, the largest activity levels were evoked during decisions about contraindicated targets close to the extreme contraindicated prototype at 80/20, and about contraindicated targets closer to the midpoint at 50/50. Like the behavioral data, this observation held for both Group A and Group B subjects. (3) Behavioral and fMRI results from naïve subjects, who experienced only the 50/50 stimulus distributions during both the training and the experiment, were intermediate to results from the Group A and Group B subjects. Our observations indicate that the effects of a previously learned prior knowledge condition on decision behavior and frontoparietal fMRI activity do not disappear when that prior knowledge condition no longer applies, as would be predicted by simple signal detection models of decision-making. Instead, the behavior and brain activity reflect persistency of the contraindicated vs. indicated classifications learned in the earlier prior knowledge training.
These findings may be related to the “anchoring and adjustment” strategy described in the psychology, economics, and marketing literatures. Anchoring and adjustment is often observed in subjects choosing a value, for example a price, from a continuum of possible values. In this strategy, subjects adjust a first approximation response – the “anchor” – based on additional information, typically applying insufficient adjustment relative to the ideal observer. Anchoring and adjustment has been observed in numerous experimental and real-world scenarios (Kahneman and Tversky, 1973; Payne et al., 1992), but the underlying brain mechanism is unknown. The anchor in such scenarios appears to be analogous to the 80/20 bias in our study. In both cases, when new information renders an earlier response irrelevant, subjects respond with a behavioral change in the appropriate direction but of less than optimal magnitude. We suggest that the underlying brain mechanism in anchoring and adjustment scenarios may be similar to that observed here. Specifically, in this study we identified a network of frontal and parietal regions as persistently selective for the previously learned classification contraindicated by prior knowledge. We predict that the same regions can be shown to be persistently selective for many other kinds of previously learned classifications, including the classic anchoring and adjustment example – a previously experienced price.
The frontal and parietal regions we identified are consistent with human fMRI and monkey neurophysiology studies of the experimental factors we manipulated. The MFG and the parietal ROIs overlap ROIs previously identified in human subjects as responding during decision tasks using stimuli and behavioral responses of various modalities (Milham et al., 2003; Grinband et al., 2006; Huettel et al., 2006; Preuschoff et al., 2008). These regions have also been shown to exhibit preferential responses to unexpected stimuli (McCarthy et al., 1997; Huettel et al., 2002; Derrfuss et al., 2005; Melcher and Gruber, 2006); in the current study, the appearance of contraindicated stimuli may be unexpected. The AI, MedFG, and IFJ have been implicated in measures of cognitive control such as task-switching and Stroop (Derrfuss et al., 2004, 2005), as well as in risk and risk prediction (Preuschoff et al., 2008), predicted perception (Summerfield et al., 2008), and ambiguity (Grinband et al., 2006). Each phenomenon may be related to the current study. Changing between prior knowledge conditions may have engaged similar structures as task-switching; the subjects may have experienced incorrect behavior, or the potential for incorrect behavior as aversive (although no feedback during the scanning or explicit reward at any time was used) and thus risky; the prior knowledge conditions may have led subjects to predict that they would experience certain perceptions; and the majority of the shape stimuli were ambiguous. Neurons in lateral prefrontal cortex (White and Wise, 1999; Roberts and Wallis, 2000; Wallis and Miller, 2003; Amemori and Sawaguchi, 2006; Muhammad et al., 2006) are involved in the selection and control of action based on abstract rules or task strategy during perceptual decisions, a phenomenon that was presumably occurring as our subjects took account of the prior knowledge cues. Neurons in LIP (cf. our IPL/IPS) are involved in evidence integration (Huk and Shadlen, 2005; Kiani et al., 2008) and probability of reward (Platt and Glimcher, 1999; Yang and Shadlen, 2007). Evidence integration, or evaluation, certainly occurred in our paradigm, and while subjects received no feedback during the scanning or explicit reward at any time, they may have experienced correct behavior or the potential for correct behavior as intrinsically rewarding. Thus, it is not surprising that these regions were the ones that emerged in our study of the effects of prior knowledge on perceptual decisions about ambiguous targets. Within these regions, our study adds the new observation that selectivity induced by previously learned prior knowledge conditions is persistent even when those conditions no longer apply.
Conflict of Interest Statement
The authors declare that the research was conducted in the absence of any commercial or financial relationships that could be construed as a potential conflict of interest.
Footnotes
References
Amemori, K., and Sawaguchi, T. (2006). Rule-dependent shifting of sensorimotor representation in the primate prefrontal cortex. Eur. J. Neurosci. 23, 1895–1909.
Burac?as, G. T., and Boynton, G. M. (2002). Efficient design of event-related fMRI experiments using m-sequences. Neuroimage 16, 801–813.
Cox, R. W. (1996). AFNI: software for analysis and visualization of functional magnetic resonance neuroimages. Comput. Biomed. Res. 29, 162–173.
Cox, R. W., and Hyde, J. S. (1997). Software tools for analysis and visualization of FMRI data. NMR Biomed. 10, 171–178.
Derrfuss, J., Brass, M., Neumann, J., and von Cramon, D. Y. (2005). Involvement of the inferior frontal junction in cognitive control: meta-analyses of switching and Stroop studies. Hum. Brain Mapp. 25, 22–34.
Derrfuss, J., Brass, M., and von Cramon, D. Y. (2004). Cognitive control in the posterior frontolateral cortex: evidence from common activations in task coordination, interference control, and working memory. Neuroimage 23, 604–612.
Grinband, J., Hirsch, J., and Ferrera, V. P. (2006). A neural representation of categorization uncertainty in the human brain. Neuron 49, 757–763.
Healy, A. F., and Kubovy, M. (1978). The effects of payoffs and prior probabilities on indices of performance and cutoff locations in recognition memory. Mem. Cogn. 6, 544–553.
Healy, A. F., and Kubovy, M. (1981). Probability matching and the formation of conservative decision rules in a numerical analog of signal detection. J. Exp. Psych. Hum. Learn. Mem. 7, 344–354.
Huettel, S. A., Mack, P. B., and McCarthy, G. (2002). Perceiving patterns in random series: dynamic processing of sequence in prefrontal cortex. Nat. Neurosci. 5, 485–490.
Huettel, S. A., Stowe, C. J., Gordon, E. M., Warner, B. T., and Platt, M. L. (2006). Neural signatures of economic preferences for risk and ambiguity. Neuron 2, 765–775.
Huk, A. C., and Shadlen, M. N. (2005). Neural activity in macaque parietal cortex reflects temporal integration of visual motion signals during perceptual decision making. J. Neurosci. 25, 10420–10436.
Kiani, R., Hanks, T. D., and Shadlen, M. N. (2008). Bounded integration in parietal cortex underlies decisions even when viewing duration is dictated by the environment. J. Neurosci. 28, 3017–3029.
Maddox, W. T. (2002). Toward a unified theory of decision criterion learning in perceptual categorization. J. Exp. Anal. Behav. 78, 567–595.
McCarthy, G., Luby, M., Gore, J., and Goldman-Rakic, P. (1997). Infrequent events transiently activate human prefrontal and parietal cortex as measured by functional MRI. J. Neurophysiol. 77, 1630–1634.
Melcher, T., and Gruber, O. (2006). Oddball and incongruity effects during Stroop task performance: a comparative fMRI study on selective attention. Brain Res. 1121, 136–149.
Milham, M. P., Banich, M. T., and Barad, V. (2003). Competition for priority in processing increases prefrontal cortex’s involvement in top-down control: an event-related fMRI study of the Stroop task. Cogn. Brain Res. 17, 212–222.
Muhammad, R., Wallis, J. D., and Miller, E. K. (2006). A comparison of abstract rules in the prefrontal cortex, premotor cortex, inferior temporal cortex, and striatum. J. Cogn. Neurosci. 18, 974–989.
Payne, J. W., Bettman, J. R., Coupey, E., and Johnson, E. J. (1992). A constructive process view of decision making: multiple strategies in judgment and choice. Acta Psychol. 80, 107–141.
Platt, M. L., and Glimcher, P. W. (1999). Neural correlates of decision variables in parietal cortex. Nature 400, 233–238.
Preuschoff, K., Quartz, S. R., and Bossaerts, P. (2008). Human insula activation reflects risk prediction errors as well as risk. J. Neurosci. 28, 2745–2752.
Roberts, A. C., and Wallis, J. D. (2000). Inhibitory control and affective processing in the prefrontal cortex: neuropsychological studies in the common marmoset. Cereb. Cortex 10, 252–262.
Summerfield, C., and Koechlin, E. (2008). A neural representation of prior information during perceptual inference. Neuron 59, 336–347.
Sutter, E. E. (2001). Imaging visual function with the multifocal m-sequence technique. Vision Res. 41, 1241–1255.
Wallis, J. D., and Miller, E. K. (2003). From rule to response: neuronal processes in the premotor and prefrontal cortex. J. Neurophysiol. 90, 1790–1806.
White, I. M., and Wise, S. P. (1999). Rule-dependent neuronal activity in the prefrontal cortex. Exp. Brain Res. 126, 315–335.
Wickens, T. D. (2002). Elementary Signal Detection Theory. New York: Oxford University Press, 24–28.
Wilkinson, F., Wilson, H. R., and Habak, C. (1998). Detection and recognition of radial frequency patterns. Vision Res. 38, 3555–3568.
Keywords: choice, experience, expectation
Citation: Hansen KA, Hillenbrand SF and Ungerleider LG (2011) Persistency of priors-induced bias in decision behavior and the fMRI signal. Front. Neurosci. 5:29. doi: 10.3389/fnins.2011.00029
Received: 15 December 2010;
Accepted: 23 February 2011;
Published online: 08 March 2011.
Edited by:
Paul Glimcher, New York University, USAReviewed by:
Christopher Summerfield, Oxford University, USAIfat Levy, Yale University School of Medicine, USA
Copyright: © 2011 Hansen, Hillenbrand and Ungerleider. This is an open-access article subject to an exclusive license agreement between the authors and Frontiers Media SA, which permits unrestricted use, distribution, and reproduction in any medium, provided the original authors and source are credited.
*Correspondence: Kathleen A. Hansen, Laboratory of Brain and Cognition, National Institute of Mental Health, National Institutes of Health, Building 10 Room 4C104, Bethesda, MD 20892, USA. e-mail:aGFuc2Vua2FAbWFpbC5uaWguZ292

 Sarah F. Hillenbrand2

