- 1 Laboratory of Brain–Computer Interfaces, Institute for Knowledge Discovery, Graz University of Technology, Graz, Austria
- 2 Department of Psychology, University of Graz, Graz, Austria
A new approach in motor rehabilitation after stroke is to use motor imagery (MI). To give feedback on MI performance brain–computer interface (BCIs) can be used. This requires a fast and easy acquisition of a reliable classifier. Usually, for training a classifier, electroencephalogram (EEG) data of MI without feedback is used, but it would be advantageous if we could give feedback right from the beginning. The sensorimotor EEG changes of the motor cortex during active and passive movement (PM) and MI are similar. The aim of this study is to explore, whether it is possible to use EEG data from active or PM to set up a classifier for the detection of MI in a group of elderly persons. In addition, the activation patterns of the motor cortical areas of elderly persons were analyzed during different motor tasks. EEG was recorded from three Laplacian channels over the sensorimotor cortex in a sample of 19 healthy elderly volunteers. Participants performed three different tasks in consecutive order, passive, active hand movement, and hand MI. Classifiers were calculated with data of every task. These classifiers were then used to detect event-related desynchronization (ERD) in the MI data. ERD values, related to the different tasks, were calculated and analyzed statistically. The performance of classifiers calculated from passive and active hand movement data did not differ significantly regarding the classification accuracy for detecting MI. The EEG patterns of the motor cortical areas during the different tasks was similar to the patterns normally found in younger persons but more widespread regarding localization and frequency range of the ERD. In this study, we have shown that it is possible to use classifiers calculated with data from passive and active hand movement to detect MI. Hence, for working with stroke patients, a physiotherapy session could be used to obtain data for classifier set up and the BCI-rehabilitation training could start immediately.
1 Introduction
According to the World Health Organization (WHO) 15 million people suffer a stroke every year, with one third of them left permanently disabled (Mackay and Mensah, 2004). One of the major consequences of stroke is impairment of motor function, such as hemiparesis or hemiplegia of the upper limbs. Recovery of hand function is of importance for mastering activities of daily living but stroke rehabilitation is limited with 30 to 60% of patients being unable to use their more affected arm (Kwakkel et al., 1999).
A new approach in motor rehabilitation after stroke is the usage of motor imagery (MI; Sharma et al., 2006; Vries and Mulder, 2007). As we know from former studies MI activates the motor system in a similar way as motor execution (ME). Both, the preparation of a movement and MI are accompanied by a desynchronization of the m-rhythm (10–12 Hz) in the electroencephalogram (EEG) over motor cortical areas event-related desynchronization (ERD), especially in the hemisphere contralateral to the used arm (Pfurtscheller and Neuper, 1997). After the termination of a movement a synchronization within the b-frequency band (13–30 Hz) can be observed, the so-called event-related synchronization (ERS) or b-rebound (Pfurtscheller et al., 1996). MI offers the opportunity to access the motor system at all stages of stroke recovery and induce activation of sensorimotor networks that were affected by lesions (Sharma et al., 2006). Up to now there are already some studies which reported a positive effect of MI on stroke rehabilitation outcome (Johnson-Frey, 2004; Gaggioli et al., 2005; Butler and Page, 2006; Page et al., 2007).
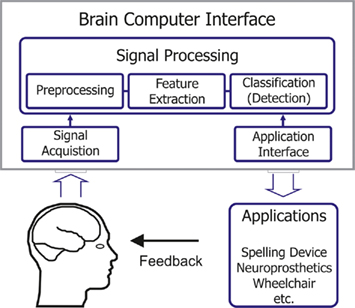
Although this new rehabilitation approach seems promising there are two main problems accompanying this new technique. Firstly, as MI is a pure mental process without any motor output, the therapists have no information about the compliance of the patients. Secondly, the patients have no feedback about their MI performance. These problems could be addressed by using a brain–computer interface (BCI). With a BCI electroencephalographic activity or other physiological measures of brain function can be translated into control commands for different applications (see Figure 1; Wolpaw et al., 2002). By means of a BCI the user can be provided with feedback of the actual activation state of the cortex and can be forced to intentionally activate certain cortical areas to support and reinforce plastic changes in the damaged brain (Birbaumer et al., 2008; Daly and Wolpaw, 2008).
A main component of the BCI is the signal processing part consisting of preprocessing, feature extraction and classification (see Figure 1; Pfurtscheller et al., 2006). For using BCI as tool for a feedback training a fast and easy acquisition of a reliable classifier to detect the appropriate activation patterns is indispensable. Up to now the usual procedure for training a classifier was to record EEG during MI without giving feedback in a first screening, evaluation or calibration measurement and use these data to calculate a classifier (Kalcher et al., 1996; Guger et al., 2000; Blankertz et al., 2008; McFarland and Wolpaw, 2008; Neuper et al., 2009). For a MI based BCI feedback training it would be advantageous if we could give appropriate feedback from the very beginning. So, new strategies for setting up a classifier are needed. There are already some approaches using adaptive methods (Vidaurre et al., 2011) or subject independent classifiers (Fazli et al., 2009) but here many electrode positions are required.
As known from previous work the activation patterns (ERD/ERS) of the motor cortex are similar not only during ME and MI but also during passive movement (PM; Pfurtscheller and Neuper, 1997; Alegre et al., 2002; Müller et al., 2003). According to this it should be possible to use data from ME or PM to set up a classifier for the detection of MI. Müller-Putz et al. (2008b, 2010) and Solis-Escalante et al. (2010) already showed that it is possible to use data from foot ME to set up a reliable classifier for the detection of foot MI.
In the present study we explore, whether a similar strategy could be applied to data from active and passive hand movements. We expect that due to the similarity of the brain activation patterns for PM, ME, and MI, the ERD of MI can be classified reliably. Besides that, a side goal of this study concerns the investigated sample. Since the probability to suffer a stroke rises with age (Asplund et al., 2009) and BCI studies are mostly conducted with young participants (students) we want to investigate the ERD/ERS patterns of brain activation over the motor cortex during passive hand movements, hand ME, and MI in elderly participants. In the literature there are hardly any studies about age and movement-related ERD/ERS. For ME Derambure et al. (1993) report a less focused and more widespread ERD during the preparation of a movement in elderly persons. To our knowledge, concerning PM and MI, there is no study reporting about age effects on ERD/ERS pattern. Referring to the finding of Derambure et al. (1993) we expect to find a more widespread ERD for the preparation of ME. For PM and MI we expect the same as PM and MI reveal similar ERD/ERS patterns and recruit the same cortical network as ME.
2 Materials and Methods
2.1 Participants
Nineteen elderly volunteers took part in this investigation, 10 females and 9 males. They were aged from 40 to 78 (M = 53.89; SD = 12.62), with no history of neurological or psychiatric disease and had normal or corrected-to-normal vision. All participants were right handed (M = 10.82; SD = 6.96; measured by the Hand Dominanz test Steingrüber and Lienert, 1971). They gave informed consent and were paid for participating in the investigation. The study was approved by the local ethics committee (Medical University of Graz) and is in accordance with the ethical standards of the Declaration of Helsinki. Four participants had to be excluded from data analysis due to artifacts in the EEG.
2.2 Experimental Paradigm
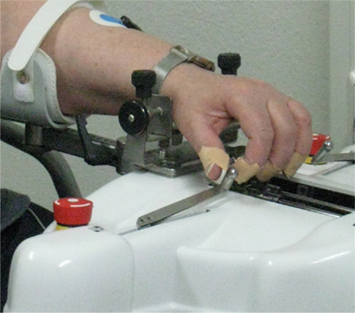
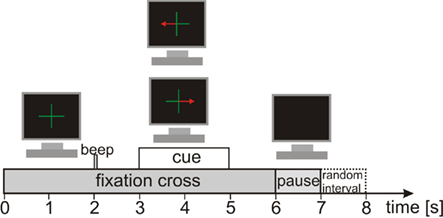
The participants performed three different tasks. The first task was PM of the left or right hand. These PMs were conducted with the Amadeo® (Tyromotion GmbH, Austria), a mechatronic finger rehabilitation device (Tyromotion GmbH, Austria), which was already used in stroke rehabilitation (Scherer et al., 2006). The Amadeo® is a finger/hand orthosis, which ergonomically simulates a grasping movement (see Figure 2; for more details about the device see http://www.tyromotion.com). This grasping movement lasted about 2 s and in each trial the Amadeo® performed the movement once. The second task was active hand movement (ME). Here the participants were instructed to perform the same hand movement as the Amadeo® did in the first task. The third task for the participants was to only imagine the same movement (MI) as they did in the tasks before. As the hand orthosis could not be attached to both hands at the same time the PM task had to be conducted separately for left and right hand. Therefore, two runs with 30 trials were performed separately for every hand. For the ME and MI task three runs à 40 trials were performed for left and right hand (both within one run) in randomized order. This resulted in 60 trials per hand for every task. One trial lasted 7 s (see Figure 3) resulting in an absolute measurement time of about 45 min. At the beginning of a trial a green fixation cross appeared for 6 s in the middle of a black screen. At second 2 an acoustic cue appeared for 70 ms, to catch the attention of the participant to the visual cue appearing at second 3. The visual cue consisted of a red arrow pointing to the left or to the right indicating which hand would be moved (PM task) or which hand should be used for the task (ME and MI). Every time the visual cue appeared, the hand orthosis or the participants immediately performed the task. At second 5 the visual cue and at second 6 the fixation cross disappeared for a pause time of 1 s followed by a random intertrial interval of 0 to 1 s. All data was recorded on the same day.
2.3 Data Acquisition and Processing
Electroencephalogram was recorded from 15 Ag/AgCl scalp electrodes (Easy Cap, Germany) over the motor cortex (orthogonal derivation of C3, Cz, C4) referenced to the left mastoid, ground at the right mastoid. The signals were acquired with a g.BSamp amplifier (Guger Technologies, Austria) with 500 Hz sample rate, 0.5 Hz high-pass, and 100 Hz low-pass filter and a sensitivity of 100 μV. An additional 50 Hz notch filter was used. To control for movement artifacts the electromyogram (EMG) of the musculus extensor carpi radialis of the left and right arm was recorded.
2.3.1 Preprocessing and calculation of ERD/ERS
From the 15 monopolarly recorded channels three Laplacian channels were calculated (C3, Cz, C4) by subtracting the mean of the four surrounding channels (Hjorth, 1975). The EEG data of the three Laplacian channels were manually corrected for artifacts using the biosignal analysis software g.BSanalyze (Guger Technologies, Austria). Trials with artifacts were discarded. If more than 40% of the trials had to be discarded the participant was excluded from further analysis due to lack of data.
Event-related desynchronization and ERS are defined as the percentage of power decrease (ERD) or power increase (ERS) in a defined frequency band in relation to a reference interval (in this study 0.5 to 1.5 s; Pfurtscheller and Lopes da Silva, 1999). To evaluate relative changes in the activation of the motor cortex during passive and active movement and during MI the ERD/ERS maps (Graimann et al., 2002) for frequency bands between 2 and 30 Hz were calculated. To that end, sinusoidal wavelets were used to assess changes in the frequency domain by calculating the spectrum within a sliding window, squaring, and subsequent averaging over the trials (Delorme and Makeig, 2004). The statistical significance of the ERD/ERS values was determined by applying a t-percentile bootstrap algorithm (Davison and Hinkley, 1997) with a significance level of a = 0.01. In the ERD/ERS maps statistically significant ERD values were plotted as orange dots and significant ERS values were plotted as blue dots.
2.3.2 Feature extraction and classification
As it is a main goal to see the quality of classifiers trained on PM-, ME-, and MI-data, classifiers were calculated (by means of a linear discriminant analysis) with data from passive hand movement, active hand movement and MI for detecting MI compared to rest (see Figure 4). Up to three relevant bandpower features were individually selected for each participant by means of distinction sensitive learning vector quantization algorithm (Pregenzer et al., 1996) and evaluation of ERD/ERS maps applied on the PM- and ME-data. Here, the features were the band powers in certain frequency bands at certain points in time, recorded on certain channels. As an example, a possible feature selection consisted of frequency bands 16–18 Hz at channel C4 and 14–16 Hz at channel Cz. Frequency bands were chosen to be at least 2 Hz wide. These features were then used to train the classifiers.
For later comparison, six different linear classifiers (LDA) were generated to classify ERD: one classifier for each class (left and right), each generated with three different data sets (PM, ME, and MI). So two classifiers were trained on PM data, one on left and one on right hand PM data, two classifiers were trained on left and right hand ME data and two classifiers were trained on left and right hand MI data. The classifiers were set up to classify the ERD pattern of the respective active class against a rest class. This rest class was obtained by using one sample every 100 ms within a time window between 4 s before the cue until the time of cue presentation. For the active class one sample every 100 ms from the time of cue presentation until the end of the trial were used (see Figure 4). During the classifier generation the best classification time was tested with a 10 × 10 cross validation for varying times within the trials in steps of 100 ms. The best times were updated sequentially by varying either the time of the active class or the time of the rest class. Only after no more updates were necessary, the timing information was used to calculate the final classifiers which were stored for future analysis. After these classifiers were created they were used to check whether the ERD pattern of newly recorded MI data could successfully be classified by weighting the same characteristics that proved significant during the offline analysis. To simulate an online cue-based experiment, the LDA output was calculated by multiplying the logarithmized and moving average filtered band power of the selected frequency bands and channels with the weights of the classifier. This output was triggered at the beginning of each trial to average the classification results. The bias of the classifiers was adapted to fit to the new data after simulating all trials, i.e., the bias was changed in order to obtain an averaged classifier output of zero for the same number of rest trials and active MI trials. This adapting is also carried out during online experiments if a classifier noticeably prefers one class to the other (Shenoy et al., 2006). During the whole time of a trial, the percentage of classification for each sample was averaged for every subject. This percentage should be small before the presentation of the cue (rest class) and start growing afterward. To avoid euphemized values due to peaks, 10% of the highest percentage numbers during the active class time period and the lowest 10% during the rest class period were removed (see Figure 5).
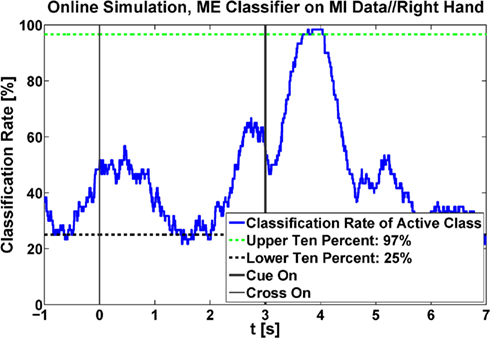
Figure 5. Classification accuracy during the time of a whole trial for one exemplary subject. Here, a classifier, generated with data recorded during ME, was applied on MI data. The upper 10% during active MI and the lower 10% during rest were removed and the remaining highest/lowest values were kept as classification rates to avoid unrealistically high results due to peaks.
2.4 Statistical Analysis
2.4.1 Analysis of classification accuracies
To investigate differences in the offline performance of the calculated classifiers an ANOVA for repeated measures with the main factors “classifier” (with the levels “PM,” “ME,” and “MI”) and “hand” (“left,” “right”) and the dependent variable “classification accuracy” was performed. Whenever the sphericity assumption was violated Greenhouse-Geisser corrected values were used for further analysis. In case of statistically significant main factors or interactions a Newman–Keuls posttest was performed.
2.4.2 Analysis of movement-related brain patterns
To investigate differences in the neurophysiological response according to the different tasks (PM, ME, and MI) the calculated ERD/ERS values (see Section 2.3.1) were averaged over two time epochs. The first time epoch (move) corresponds to the time, while the movement or movement imagination was performed (second 3.2–5 of the trial). The second time epoch (postmove) corresponds to the time after the termination of the movement or movement imagination (second 5–6.5 of the trial). The mean logarithmic bandpower values for the reference interval (0.5–1.5 s) and the mean ERD/ERS values for the two time epochs “move” and “postmove” were calculated for frequency bands between 4–30 Hz (4–6, 6–8, 8–10, 10–12, 12–16, 16–20, 20–24, 24–30 Hz) for each electrode position (C3, Cz, C4). For a statistical analysis of the ERD/ERS values a 3 × 2 × 2 ANOVA for repeated measures with the within subject factors “position”(C3, Cz, C4), “hand” (left versus right), and “phase” (“move,” “postmove”) was calculated for every task. The statistical analysis of the ERD/ERS values were performed separately for every task due to the differences in the measurement procedure. Whenever the sphericity assumption was violated Greenhouse-Geisser corrected values were used for further analysis. In case of statistically significant main factors or interactions a Newman–Keuls posttest was performed.
3 Results
3.1 Classification Accuracies
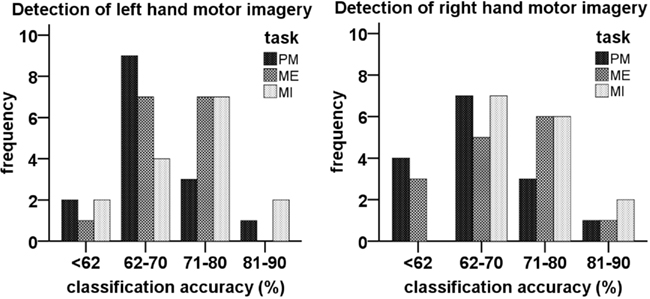
Figure 6 shows the classification accuracies for detecting MI (against rest) of the classifiers obtained from data of the different tasks. The mean performance of every classifier was above random (>62.5%; Müller-Putz et al., 2008a). The mean accuracies and SD for every classifier can be seen in Table 1. The ANOVA revealed a significant difference in the classification accuracies obtained by the different classifiers [F(2,28) = 5.35; p < 0.05] but only between PM (M = 67.58; SD = 7.57) and MI (M = 71.53; SD = 8.38).

Table 1. Mean and SD of classification accuracies in detecting motor imagery for classifiers calculated with data of different tasks.
3.2 Movement-Related Brain Patterns
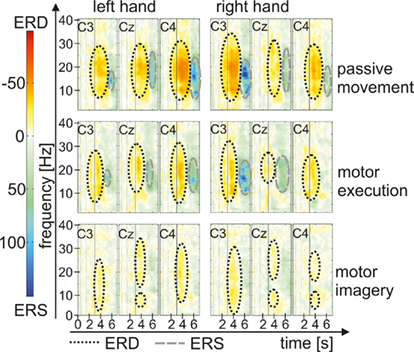
In Figure 7 grand average maps (15 participants) of PM, ME, and MI are plotted for the left and right hand. The ERD/ERS pattern for the different motor tasks show ERD during movement or movement imagination, especially in a- and b-frequency bands, which turns to an ERS after termination of movement. Interestingly the patterns are most pronounced during PM followed by ME and weakest during MI. ERD in the PM task seems to last some time after termination of movement before the ERS appears, whereas in the ME task ERS starts as soon as the movement stopped. After MI only weak ERS can be observed.
3.2.1 Passive movement
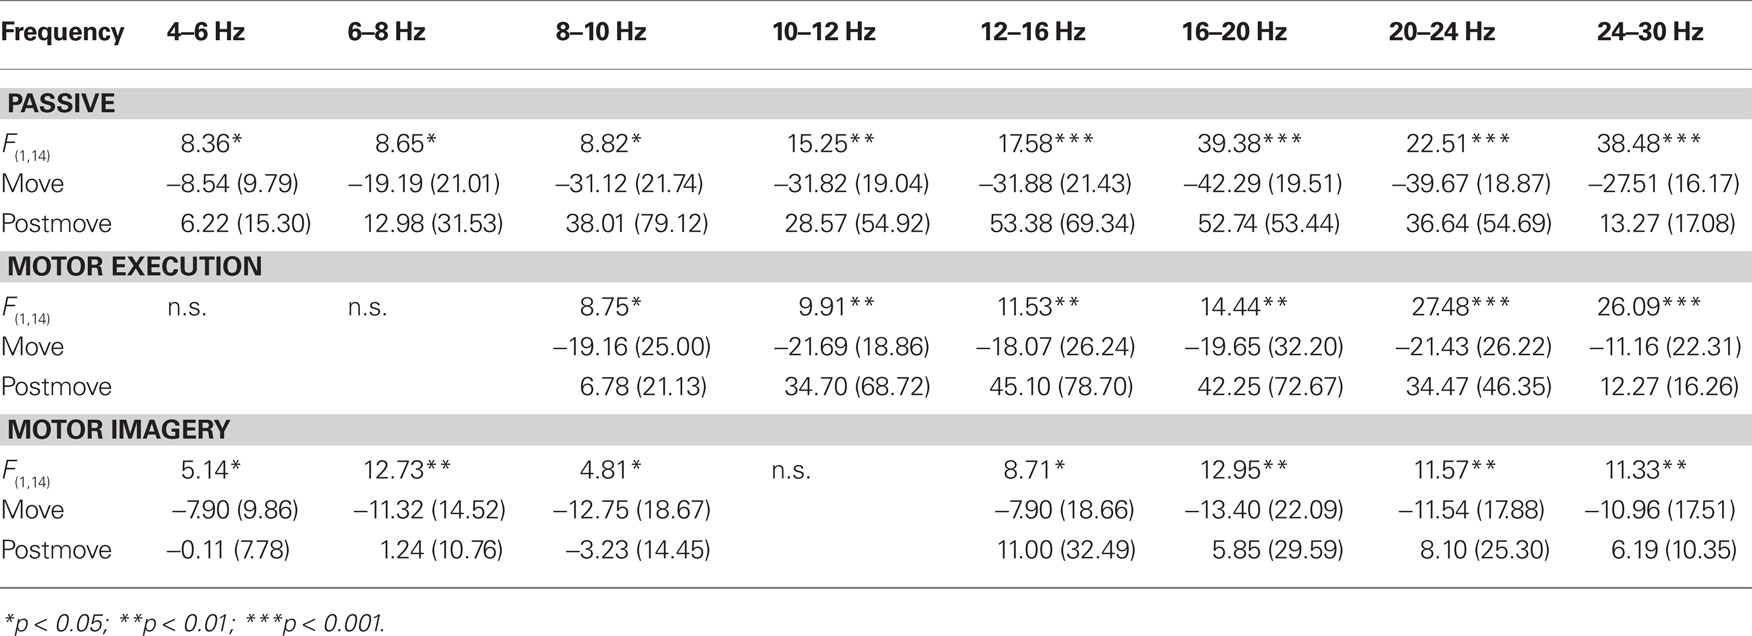
The statistical analysis of the ERD/ERS values of the PM task revealed a significant main effect “phase” in every frequency band from 4 up to 30 Hz. The movement phase was associated with an ERD whereas during the post-movement phase an ERS can be observed (see Table 2). In addition to this a significant threefold interaction “hand × position × phase” emerged in nearly all frequency bands from a- up to the b-band (8–10, 10–12, 12–16, 16–20, 24–30 Hz). For 24 to 30 Hz during PM of the left hand the ERD is significantly stronger at C4, contralateral to the moved hand as compared to C3. For PM of the right hand and in all other frequency bands the interaction shows that during movement there’s no significant difference in the strength of the ERD at the different positions, whereas the upcoming ERS after the termination of the movement has a lateralized pattern depending on which hand was moved. The ERS of the area contralateral to the passively moved hand was stronger as the ERS of the other positions. So for right hand the ERS at the left sensorimotor area (C3) and for left hand the ERS at the right sensorimotor area (C4) was significantly stronger. For right hand movement this effect can be found in all frequency band, where the interaction was significant, whereas for left hand movement the lateralization is only significant in the frequency bands from 8 to 10 Hz and from 24 to 30 Hz (see Table 3).
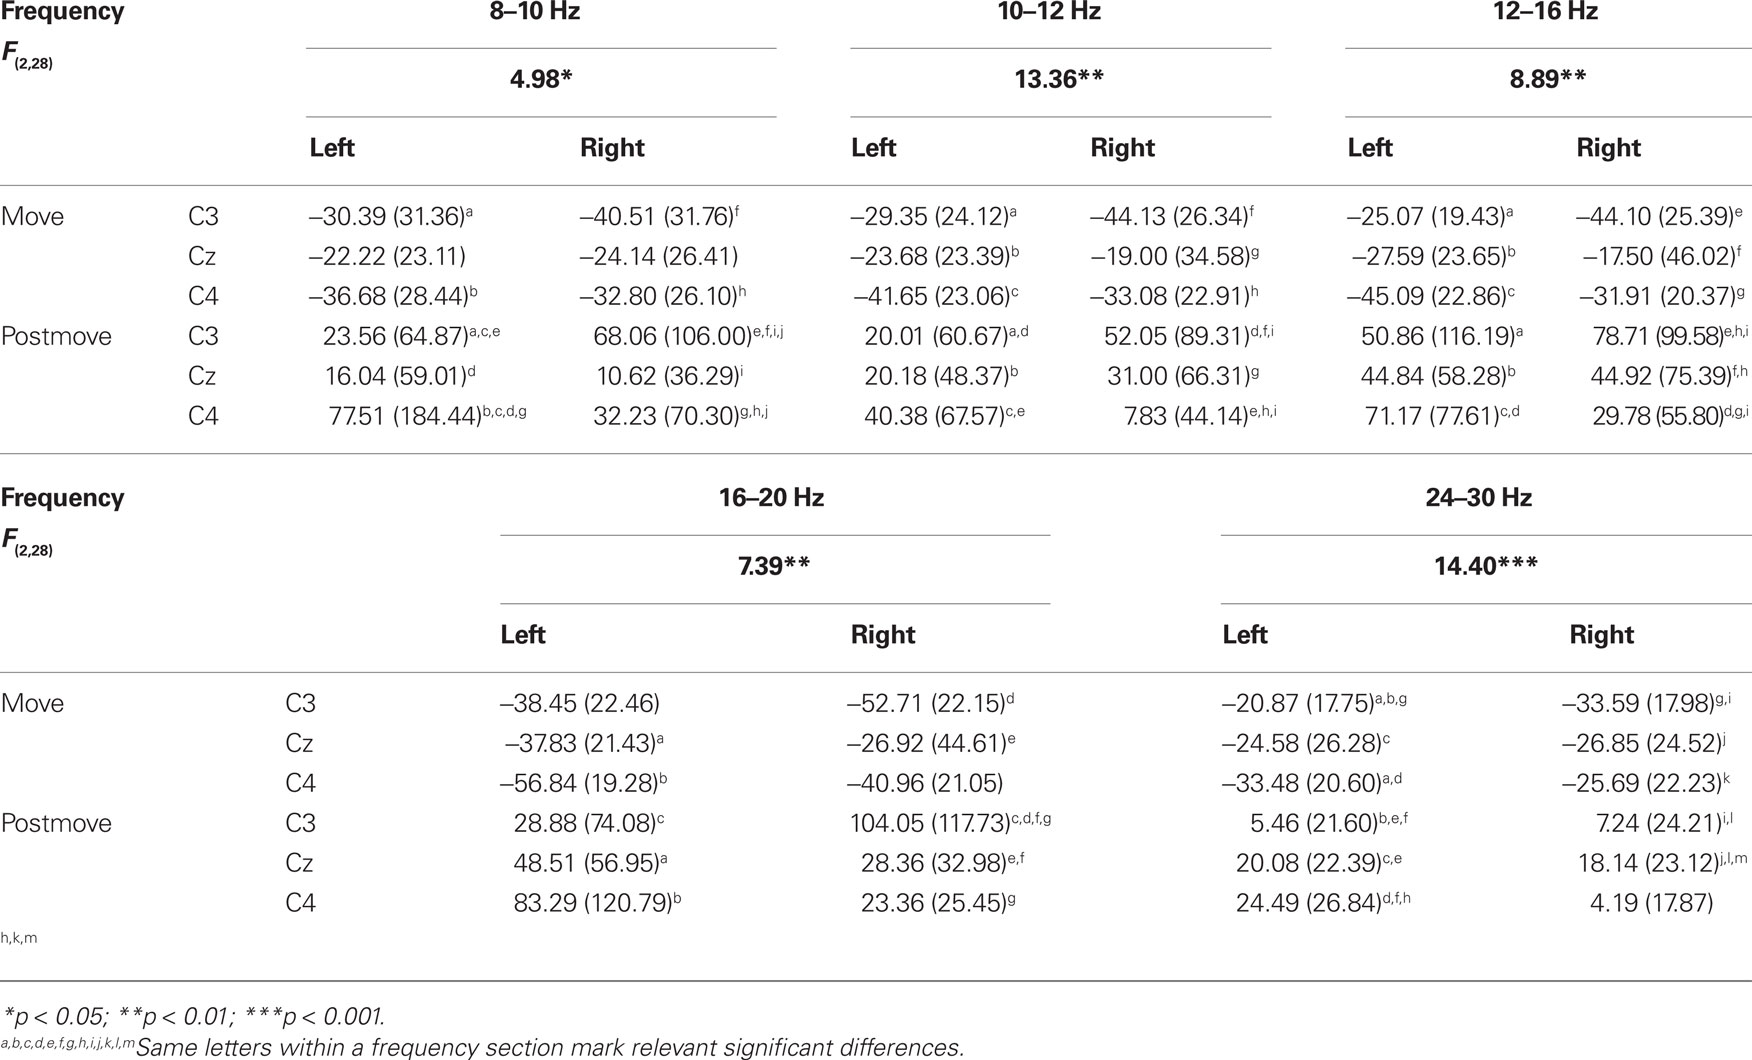
Table 3. F-values, mean, and SD of ERD/ERS values for the significant interaction “hand × phase × position” in passive movement task.
3.2.2 Motor execution
The statistical analysis of the ERD/ERS values of the ME task revealed a significant main effect “phase” in the a- and b-frequency bands (8–10, 10–12, 12–16, 16–20, 20–24, 24–30 Hz) with an ERD during movement and a post-movement ERS (see Table 2). In addition to this an interaction between “hand” “position” and “phase” can be observed in some frequency bands (8–10, 12–16, 16–20, 20–24, 24–30 Hz; see Table 4). Comparable to the results for the PM task there is a lateralized activation pattern for ERS in the post-movement phase especially after right hand movement, with a stronger ERS contralateral to the moved hand. After left hand movements this can only be observed in frequency bands from 8 to 10, 20 to 24, and 24 to 30 Hz.
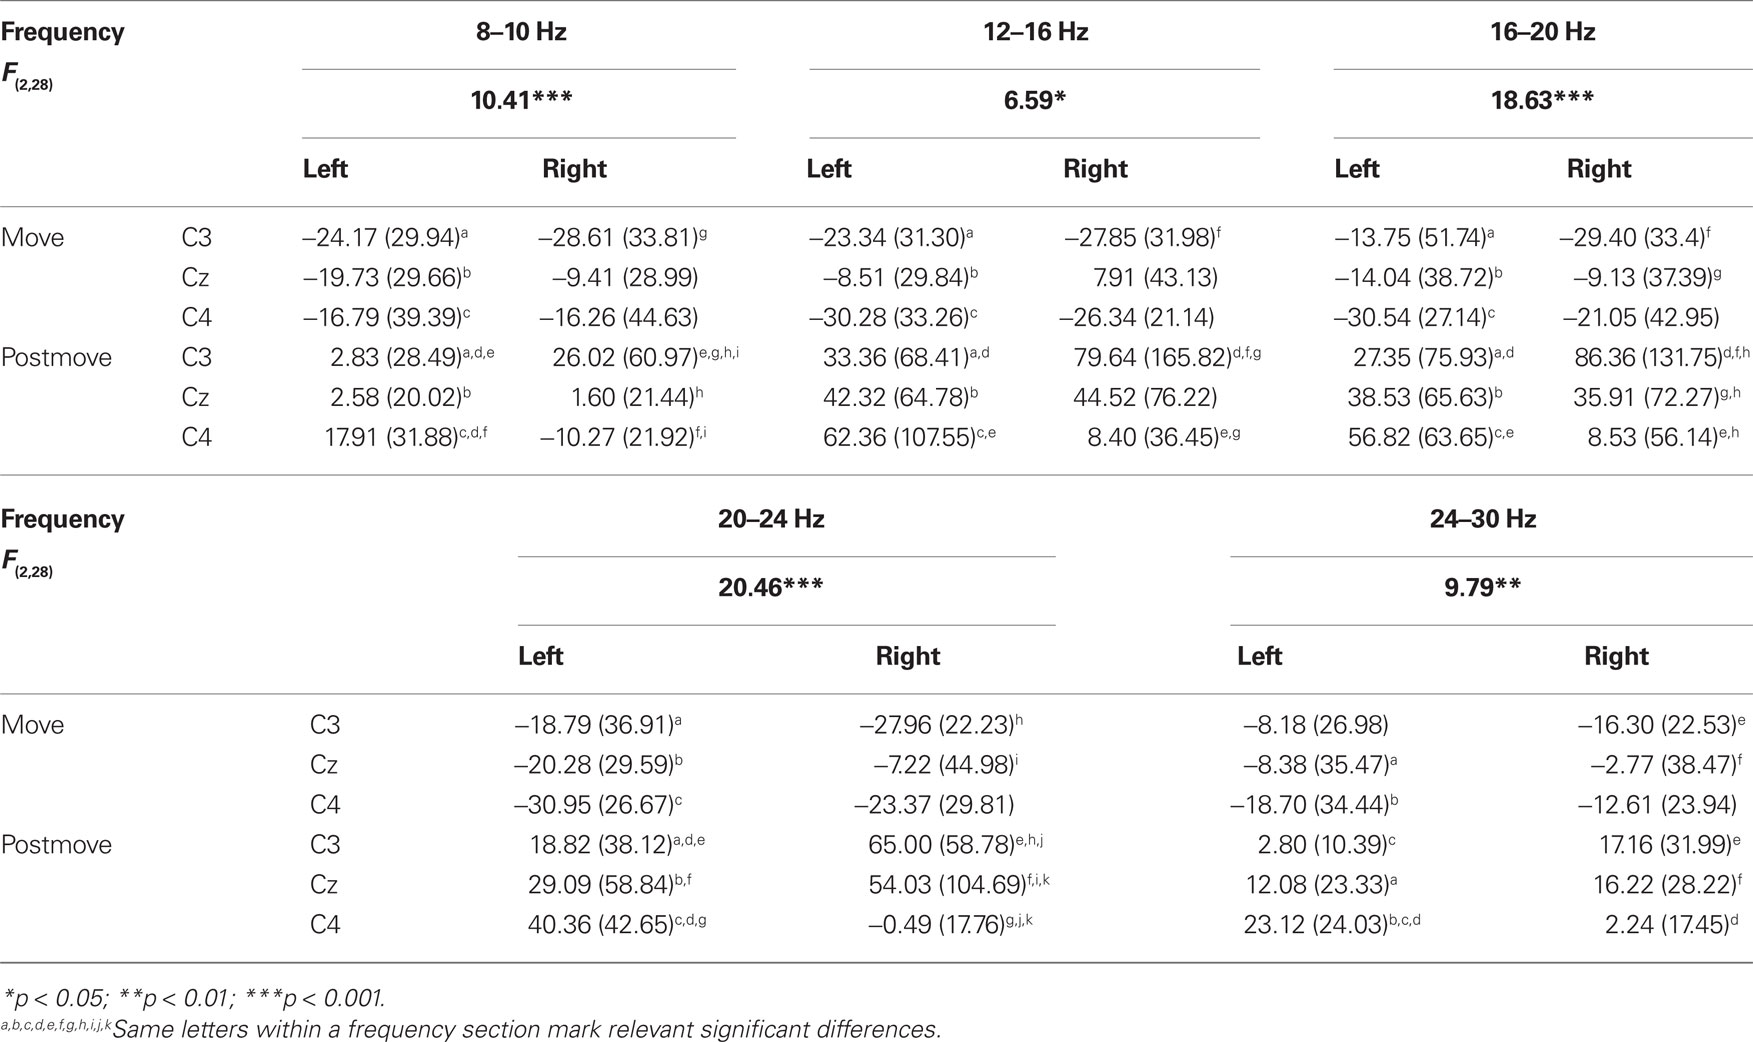
Table 4. F-values, mean, and SD of ERD/ERS values for the significant interaction “hand × phase × position” in motor execution task.
3.2.3 Motor imagery
The statistical analysis of the ERD/ERS values of the MI task revealed similar results as for the PM and the ME task with a significant main effect “phase” in every frequency band (4–6, 6–8, 8–10, 12–16, 16–20, 20–24, 24–30 Hz) except from 10 to 12 Hz, where the significance level was just missed (p = 0.066). Again the movement phase is accompanied by a significant ERD whereas after the termination of the movement a smaller ERD (4–6, 8–10 Hz) or an ERS emerges (see Table 2). In addition to the main effect “phase” a significant threefold interaction “hand × phase × position” can be found in some frequency bands (6–8, 10–12, 12–16, 20–24, 24–30). The type of this threefold interaction differs from the results in the PM and the ME task and is not consistent over the different frequency bands (see Table 5). In the frequency bands 10 to 12 and 12 to 16 Hz differences between the sensorimotor areas emerge only during movement but not after the termination of movement. For right hand MI the ERD of the corresponding area (C3) is stronger as compared to the other positions (Cz and C4). For left hand MI differences between the positions emerge only in the frequency band from 12 to 16 Hz but do not show a lateralized pattern. In both sensorimotor areas (C3 and C4) the ERD is stronger as compared to Cz, so a bilateral activation can be found. For the frequency band 20 to 24 Hz there are no differences between the different positions during MI. After the termination of the MI the ERS over Cz is stronger as the ERS or slight ERD over C3 and C4.
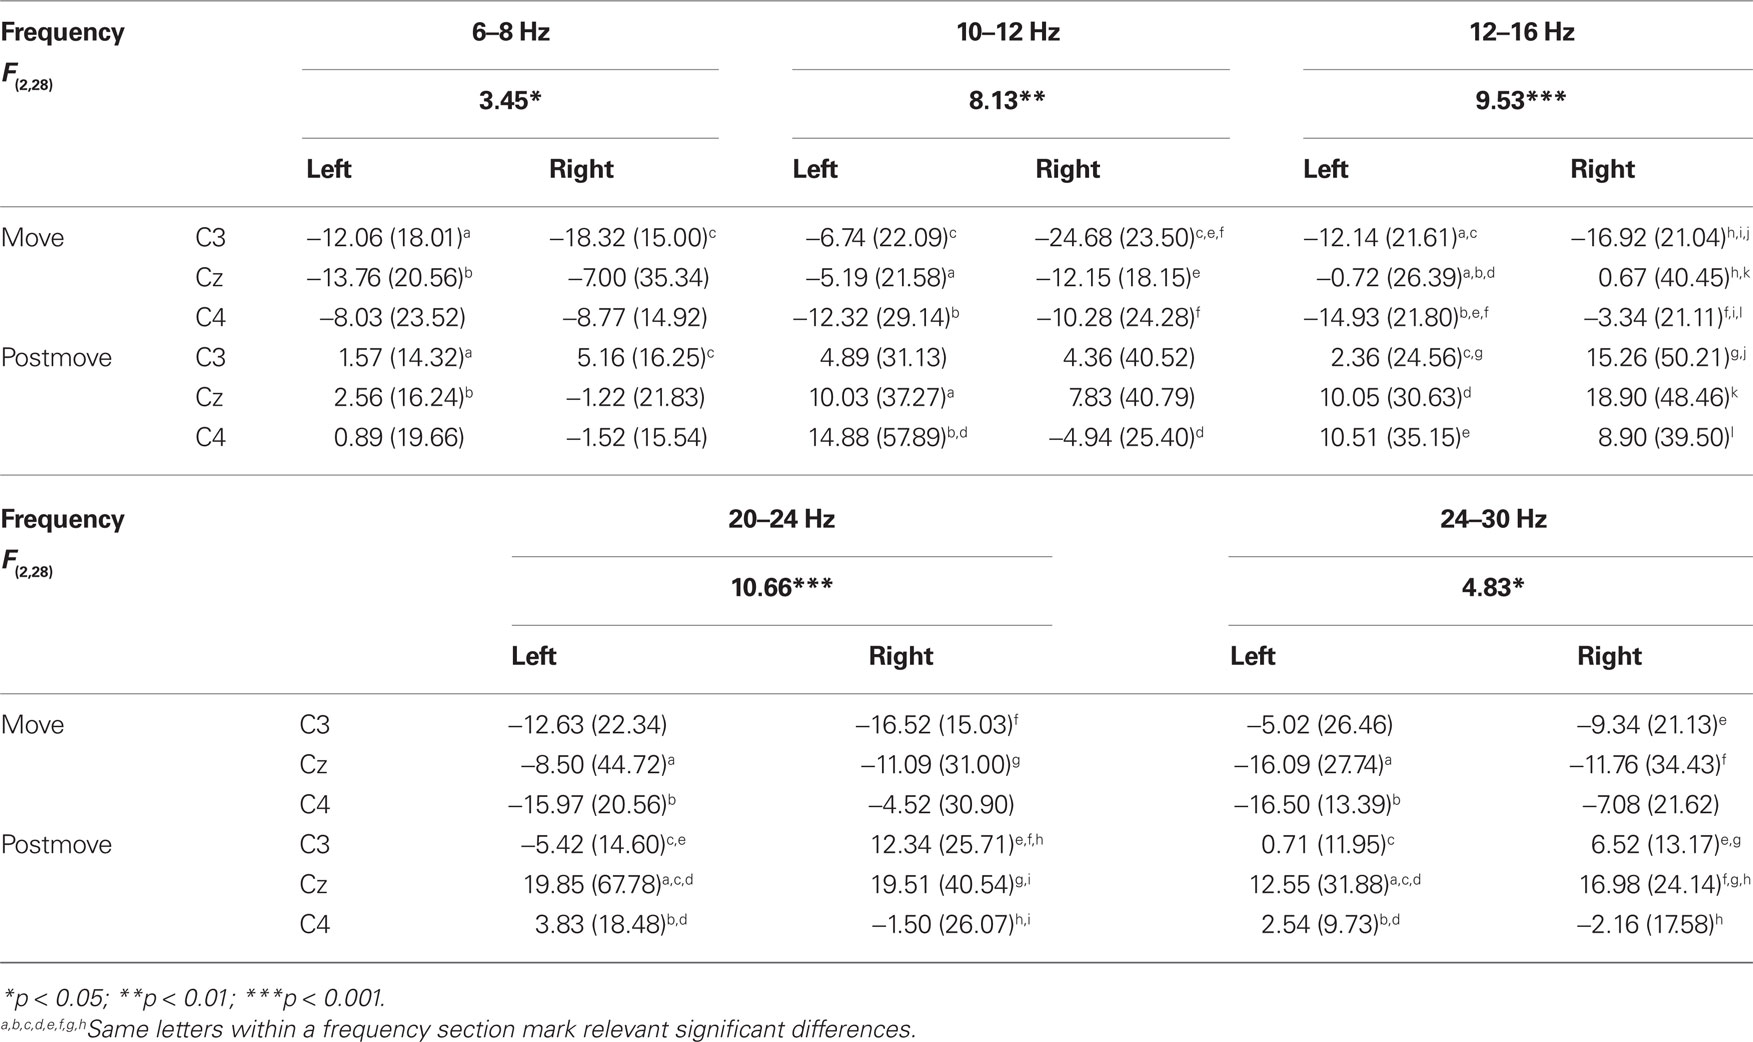
Table 5. F-values, mean, and SD of ERD/ERS values for the significant interaction “hand × phase × position” in motor imagery task.
In summary we found differences between movement and post-movement phase in all three tasks, with ERD during movement and ERS or weaker ERD after termination of movement. A difference between PM and MI and ME and MI was found for the ERS pattern after termination of movement, which is lateralized in PM and ME but not in MI.
4 Discussion
4.1 Classification of Motor Imagery
The main objective of this study was to investigate whether data from (PM) or active hand movement (ME) can be used to detect hand MI. The results suggest, that this is possible. All of the classification results achieved an accuracy above random. The classifiers calculated from PM- and ME-data did not differ significantly from each other regarding the performance in detecting MI. The classifiers calculated from hand ME data did not even differ from the classifiers calculated from hand MI data although the classifiers calculated from MI data were favored due to the fact that for these classifiers the data for classifier calculation and testing its ability to detect MI descend from the same data block. For the classifiers calculated from PM and ME the data used for classifier calculation differs from the data used for testing the classifier. The classifier based on PM data reached a significantly lower classification accuracy as the classifier based on MI data. Nevertheless the classifier based on PM data showed an acceptable performance, which did not differ significantly from performance of the classifier based on ME data. We could show in this study that it is possible to use classifiers calculated with data from passive hand movement and hand ME to detect MI with reasonable accuracy. Up to now this has only been shown with foot ME and foot MI (Müller-Putz et al., 2008b, 2010; Solis-Escalante et al., 2010).
The advantage of using passive hand movement or hand ME in respect to the classifier calculation for a MI based stroke BCI is based on the fact that PM and ME are part of the normal rehabilitation measures. So, if a MI based stroke BCI is used for rehabilitative purposes, EEG data can be recorded during a normal physiotherapy session and these data can be used for setting up a classifier. BCI-rehabilitation training can immediately start with feedback sessions. As the sample in our study were healthy elderly participants the next step is to use this approach for gaining a classifier in stroke patients.
4.2 Movement-related Brain Patterns
If a BCI is used for rehabilitative purposes not only the classification accuracy but also the physiological validity of the reinforced brain patterns is of importance. An additional aim was the investigation of the brain patterns during the different motor tasks in the elderly participants.
4.2.1 Passive movement
For passive robot-assisted movements the activation pattern was typical for hand movements, with a stronger ERD contralateral to the used hand and an ERS after the termination of the movement. In contrast to the findings in younger participants (Alegre et al., 2002; Müller et al., 2003) these effects occurred not only in a- and lower b-frequency bands but more widespread from u- up to the upper b-frequencies (6–30 Hz).
There are three main points in which the present study differs from the studies by Müller et al. (2003) and Alegre et al. (2002). Firstly, the age of the sample, secondly, the device for the PM and thirdly, the type of the movement. Regarding the age of the sample, the age range in the present study is from 40 to 78 years, which is quite broad, so no clear conclusions can be drawn. Concerning the used devices for the PM Müller et al. (2003) used functional electrical stimulation and in the study by Alegre et al. (2002) the experimenter used a pulley system to passively move the participants hands. Hence every study used a different device for performing the PM, but we do not know how this influences the results. Regarding the type of the movement Müller et al. (2003) and Alegre et al. (2002) recorded PM of the wrist, whereas in the present study mostly the fingers are moved. Analyzing how different types of PM and different devices for performing these PM influence sensorimotor EEG changes are beyond the scope of this study.
4.2.2 Motor execution
The brain activation during the ME task revealed a significant effect of “phase” in the a- and b-frequencies with an ERD during the movement and an ERS after the movement. The ERD during the movement emerged independent from the moved hand over the whole motor cortex with slightly stronger values in both hand motor representation areas (C3 and C4). However, the ERS, which occurred after the termination of the movement, showed a lateralized pattern with stronger ERS contralateral to the moved hand and a weaker ERS or slight ERD over the hand motor representation area ipsilateral to the moved hand, especially after movement of the right hand. The bilateral occurrence of the ERD during the movement of the hand and also the pattern of the post-movement ERS are comparable to the patterns found in younger people (Pfurtscheller et al., 1998, 2003; Neuper et al., 2006). Another common finding in younger participants is the lateralized ERD during the preparation of a movement, with an ERD contralateral to the moved hand before movement onset (Neuper et al., 2006). This effect cannot be observed in the present sample of elderly participants. There is an ERD before movement onset, but it occurs not only contralateral to the moved hand but also ipsilateral. This finding is consistent with results from Derambure et al. (1993) and Labyt et al. (2004), who found a smaller and more lateralized ERD in younger participants compared to a more bilateral and widespread ERD in elderly participants during the preparation of movements.
4.2.3 Motor imagery
The pattern found during MI were weaker as for PM and ME, especially the ERS in the post-movement phase. A weak ERS emerged only in b-frequency bands after termination of MI, whereas in lower frequencies the ERD of the movement phase continues in an attenuated form. Possibly some of the participants had difficulties in stopping the MI promptly. In contrast to the results for the PM and ME task, where a lateralized ERS pattern accompanied the post-movement phase, the interaction between “hand,” “phase,” and “position” showed a lateralized pattern of ERD during the imagination phase especially for right hand MI in a- and b-frequency components. Left hand MI was associated with a more bilateral activation of the motor cortex. So the EEG patterns for the MI task showed the typical pattern which was already found in former studies (Pfurtscheller and Neuper, 1997; Müller et al., 2003; Neuper et al., 2009).
In summary the results of the classifier and the results of the movement-related brain patterns support each other. In all three tasks during movement phase ERD can be found in a- and b-frequencies. Due to the similarity of the ERD patterns during movement phase the discriminant frequency bands of the three tasks are comparable and classification of MI above random level with classifiers trained on data of PM or ME is possible.
5 Conclusion
The results of this study confirm former findings concerning the activation pattern of the motor cortex in elderly persons. The preparation of hand movements is accompanied by a less lateralized and more widespread activation, not only in terms of spatial distribution but also in terms of frequency domain. Furthermore, the activation pattern of the motor cortex was also described for passive hand movements and hand MI. Concerning the classification of MI we could extend the findings from Müller-Putz et al. (2008b, 2010) and Solis-Escalante et al. (2010), who used foot ME data to calculate classifiers for detecting foot MI. Our results suggest, that this approach can be applied to hand ME and hand MI. In addition we could show, that also robot-assisted PM can be used for classifier calculation, which is of interest for BCI in stroke rehabilitation. The advantage of this approach is that PM and ME are part of the normal stroke rehabilitation. For working with stroke patients, a physiotherapy session would be used to obtain data for training a classifier and the BCI-rehabilitation training could start immediately. After this promising results the next step is to test this approach in stroke patients.
Conflict of Interest Statement
The authors declare that the research was conducted in the absence of any commercial or financial relationships that could be construed as a potential conflict of interest.
Acknowledgments
The authors thank Hannah Hiebel for help with data recording. This work is supported by the European ICT Program Project TOBI FP7-224631. This paper only reflects the authors’ views and funding agencies are not liable for any use that may be made of the information contained herein.
References
Alegre, M., Labarga, A., Gurtubay, I. G., Iriarte, J., Malanda, A., and Artieda, J. (2002). Beta electroencephalograph changes during passive movements: sensory afferences contribute to beta event-related desynchronization in humans. Neurosci. Lett. 331, 29–32.
Asplund, K., Karvanen, J., Giampaoli, S., Jousilahti, P., Niemelä, M., Broda, G., Cesana, G., Dallongeville, J., Ducimetriere, P., Evans, A., Ferrières, J., Haas, B., Jorgensen, T., Tamosiunas, A., Vanuzzo, D., Wiklund, P.-G., Yarnell, J., Kuulasmaa, K., and Kulathinal, S. (2009). Relative risks for stroke by age, sex, and population based on follow-up of 18 European populations in the MORGAM project. Stroke 40, 2319–2326.
Birbaumer, N., Murguialday, A. R., and Cohen, L. (2008). Brain-computer interface in paralysis. Curr. Opin. Neurol. 21, 634–638.
Blankertz, B., Losch, F., Krauledat, M., Dornhege, G., Curio, G., and Müller, K. R. (2008). The Berlin Brain-Computer Interface: accurate performance from first-session in BCI-naïve subjects. IEEE Trans. Biomed. Eng. 55, 2452–2462.
Butler, A. J., and Page, S. J. (2006). Mental practice with motor imagery: evidence for motor recovery and cortical reorganization after stroke. Arch. Phys. Med. Rehabil. 87, S2–S11.
Daly, J. J., and Wolpaw, J. R. (2008). Brain-computer interfaces in neurological rehabilitation. Lancet Neurol. 7, 1032–1043.
Davison, A. C., and Hinkley, D. V. (1997). Bootstrap Methods and Their Application. Cambridge, MA: Cambridge University Press.
Delorme, A., and Makeig, S. (2004). EEGLAB: an open source toolbox for analysis of single-trial EEG dynamics including independent component analysis. J. Neurosci. Methods 134, 9–21.
Derambure, P., Defebvre, L., Dujardin, K., Bourriez, J. L., Jacquesson, J. M., Destee, A., and Guieu, J. D. (1993). Effect of aging on the spatio-temporal pattern of event-related desynchronization during a voluntary movement. Electroencephalogr. Clin. Neurophysiol. 89, 197–203.
Fazli, S., Popescu, F., Danóczy, M., Blankertz, B., Müller, K.-R., and Grozea, C. (2009). Subject independent mental state classification in single trials. Neural Netw. 22, 1305–1312.
Gaggioli, A., Morganti, F., Meneghini, A., Alcaniz, M., Lozano, J. A., Mon-tesa, J., Sáez, J. M. M., Walker, R., Lorusso, I., and Riva, G. (2005). The virtual reality mirror: mental practice with augmented reality for post-stroke rehabilitation. Annu. Rev. Cyber Ther. Telemed. 3, 199–205.
Graimann, B., Huggins, J. E., Levine, S. P., and Pfurtscheller, G. (2002). Visualization of significant ERD/ERS patterns in multichannel EEG and ECoG datas. Clin. Neurophysiol. 113, 43–47.
Guger, C., Ramoser, H., and Pfurtscheller, G. (2000). Real-time EEG analysis with subject-specific spatial patterns for a brain-computer interface (BCI). IEEE Trans. Neural Syst. Rehabil. Eng. 8, 447–450.
Hjorth, B. (1975). An on-line transformation of EEG scalp potentials into orthogonal source derivations. Electroencephalogr. Clin. Neurophysiol. 39, 526–530.
Johnson-Frey, S. H. (2004). Stimulation through simulation? Motor imagery and functional reorganization in hemiplegic stroke patients. Brain Cogn. 55, 328–331.
Kalcher, J., Flotzinger, D., Neuper, C., Gölly, S., and Pfurtscheller, G. (1996). Graz brain-computer interface II: towards communication between humans and computers based on online classification of three different EEG patterns. Med. Biol. Eng. Comput. 34, 382–388.
Kwakkel, G., Kollen, B. J., and Wagenaar, R. C. (1999). Therapy impact on functional recovery in stroke rehabilitation: a critical review of the literature. Physiotherapy 85, 377–391.
Labyt, E., Szurhaj, W., Bourriez, J.-L., Cassim, F., Defebvre, L., Desteé, A., and Derambure, P. (2004). Influence of aging on cortical activity associated with a visuo-motor task. Neurobiol. Aging 25, 817–827.
Mackay, J., and Mensah, G. (2004). Atlas of Heart Disease and Stroke. Genf: World Health Organization.
McFarland, D. J., and Wolpaw, J. R. (2008). Sensorimotor rhythm-based brain-computer interface (BCI): model order selection for autoregressive spectral analysis. J. Neural Eng. 5, 155–162.
Müller, G. R., Neuper, C., Rupp, R., Keinrath, C., Gerner, H. J., and Pfurtscheller, G. (2003). Event-related beta EEG changes during wrist movements induced by functional electrical stimulation of forearm muscles in man. Neurosci. Lett. 340, 143–147.
Müller-Putz, G., Kaiser, V., Solis-Escalante, T., and Pfurtscheller, G. (2008a). “Execution for training and imagination for actual control,” in Neuromath Workshop COST BM0601, Stockholm.
Müller-Putz, G. R., Scherer, R., Brunner, C., Leeb, R., and Pfurtscheller, G. (2008b). Better than random? A closer look on BCI results. Int. J. Bioelectromagn. 10, 52–55.
Müller-Putz, G. R., Kaiser, V., Solis-Escalante, T., and Pfurtscheller, G. (2010). Fast set-up asynchronous brain-switch based on detection of foot motor imagery in 1-channel EEG. Med. Biol. Eng. Comput. 48, 229–233.
Neuper, C., Scherer, R., Wriessnegger, S., and Pfurtscheller, G. (2009). Motor imagery and action observation: modulation of sensorimotor brain rhythms during mental control of a brain-computer interface. Clin. Neurophysiol. 120, 239–247.
Neuper, C., Wörtz, M., and Pfurtscheller, G. (2006). “ERD/ERS patterns reflecting sensorimotor activation and deactivation,” in Event-Related Dynamics of Brain Oscillations, Chapter 14, Vol. 159, Progress in Brain Research, eds C. Neuper, and W. Klimesch (Amsterdam: Elsevier), 211–222.
Page, S. J., Levine, P., and Leonard, A. (2007). Mental practice in chronic stroke: results of a randomized, placebo-controlled trial. Stroke 38, 1293–1297.
Pfurtscheller, G., Graimann, B., and Neuper, C. (2006). “EEG-based brain-computer interface systems and signal processing,” in Encyclopedia of Biomedical Engineering, Vol. 2, ed. M. Akay (New Jersey, NJ: John Wiley and Sons), 1156–1166.
Pfurtscheller, G., and Lopes da Silva, F. H. (1999). Event-related EEG/MEG synchronization and desynchronization: basic principles. Clin. Neurophysiol. 110, 1842–1857.
Pfurtscheller, G., and Neuper, C. (1997). Motor imagery activates primary sensorimotor area in humans. Neurosci. Lett. 239, 65–68.
Pfurtscheller, G., Stancák, A. Jr., and Neuper, C. (1996). Post movement beta synchronization: a correlate of an idling motor area? Electroencephalogr. Clin. Neurophysiol. 98, 281–293.
Pfurtscheller, G., Wörtz, M., Supp, G., and da Silva, F. H. L. (2003). Early onset of post-movement beta electroencephalogram synchronization in the supplementary motor area during self-paced finger movement in man. Neurosci. Lett. 339, 111–114.
Pfurtscheller, G., Zalaudek, K., and Neuper, C. (1998). Event-related beta synchronization after wrist, finger and thumb movement. Electroencephalogr. Clin. Neurophysiol. 9, 154–160.
Pregenzer, M., Pfurtscheller, G., and Flotzinger, D. (1996). Automated feature selection with a distinction sensitive learning vector quantizer. Neurocomputing 11, 19–29.
Scherer, R., Kollreider, A., Ram, D., Hölzl, J. S., and Grieshofer, P. (2006). “Roboterunterstützte Rehabilitation der Hand nach Schlaganfall,” in Proceedings der Gemeinsamen Jahrestagung der Deutschen, der österreichischen und der Schweizerischen Gesellschaften für Biomedizinische Technik, Zurich.
Sharma, N., Pomeroy, V. M., and Baron, J.-C. (2006). Motor imagery: a backdoor to the motor system after stroke? Stroke 37, 1941–1952.
Shenoy, P., Krauledat, M., Blankertz, B., Rao, R. P., and Müller, K.-R. (2006). Towards adaptive classification for BCI. J. Neural Eng. 3, 13–23.
Solis-Escalante, T., MüllerPutz, G., Brunner, C., Kaiser, V., and Pfurtscheller, G. (2010). Analysis of sensorimotor rhythms for the implementation of a brain switch for healthy subjects. Biomed. Signal Process. Control 5, 15–20. doi: 10.1016/j.bspc.2009.09.002
Vidaurre, C., Sannelli, C., Müller, K. R., and Blankertz, B. (2011). Machine-learning based co-adaptive calibration for brain-computer interfaces. Neural Comput. 23, 791–816.
Vries, S., and Mulder, T. (2007). Motor imagery and stroke rehabilitation: a critical discussion. J. Rehabil. Med. 39, 5–13.
Keywords: stroke rehabilitation, motor imagery, passive movement, motor execution, brain–computer interface, pattern classification
Citation: Kaiser V, Kreilinger A, Müller-Putz GR and Neuper C (2011) First steps toward a motor imagery based stroke BCI: new strategy to set up a classifier. Front. Neurosci. 5:86. doi: 10.3389/fnins.2011.00086
Received: 27 October 2010; Accepted: 21 June 2011;
Published online: 05 July 2011.
Edited by:
Nicholas Hatsopoulos, University of Chicago, USAReviewed by:
Klaus R. Mueller, Technical University, GermanyJeong-Woo Sohn, University of Pittsburgh, USA
Copyright: © 2011 Kaiser, Kreilinger, Müller-Putz and Neuper. This is an open-access article subject to a non-exclusive license between the authors and Frontiers Media SA, which permits use, distribution and reproduction in other forums, provided the original authors and source are credited and other Frontiers conditions are complied with.
*Correspondence: Vera Kaiser, Laboratory of Brain–Computer Interfaces, Institute for Knowledge Discovery, Graz University of Technology, Krenngasse 37, Graz 8010, Austria. e-mail:dmVyYS5rYWlzZXJAdHVncmF6LmF0


