 Peter Kochunov1,2,3*
 David C. Glahn3,4
 Thomas E. Nichols5
 Anderson M. Winkler4
 Elliot L. Hong1
 Henry H. Holcomb1
 Jason L. Stein6
 Paul M. Thompson6
 Joanne E. Curran2 Melanie A. Carless2 Rene L. Olvera7 Matthew P. Johnson2 Shelley A. Cole2 Valeria Kochunov3 Jack Kent2 and John Blangero2
- 1 Maryland Psychiatric Research Center, University of Maryland School of Medicine, Baltimore, MD, USA
- 2 Southwest Foundation for Biomedical Research, San Antonio, TX, USA
- 3 Research Imaging Institute, The University of Texas Health Science Center at San Antonio, San Antonio, TX, USA
- 4 Department of Psychiatry, Yale University and Olin Neuropsychiatric Research Center, Connecticut, CT, USA
- 5 Department of Statistics and Warwick Manufacturing Group, University of Warwick, Coventry, UK
- 6 Laboratory of Neuro Imaging, University of California Los Angeles School of Medicine, Los Angeles, CA, USA
- 7 Department of Psychiatry, University of Texas Health Science Center at San Antonio, San Antonio, TX, USA
Objectives: The thickness of the brain’s cortical gray matter (GM) and the fractional anisotropy (FA) of the cerebral white matter (WM) each follow an inverted U-shape trajectory with age. The two measures are positively correlated and may be modulated by common biological mechanisms. We employed four types of genetic analyses to localize individual genes acting pleiotropically upon these phenotypes. Methods: Whole-brain and regional GM thickness and FA values were measured from high-resolution anatomical and diffusion tensor MR images collected from 712, Mexican American participants (438 females, age = 47.9 ± 13.2 years) recruited from 73 (9.7 ± 9.3 individuals/family) large families. The significance of the correlation between two traits was estimated using a bivariate genetic correlation analysis. Localization of chromosomal regions that jointly influenced both traits was performed using whole-genome quantitative trait loci (QTL) analysis. Gene localization was performed using SNP genotyping on Illumina 1M chip and correlation with leukocyte-based gene-expression analyses. The gene-expressions were measured using the Illumina BeadChip. These data were available for 371 subjects. Results: Significant genetic correlation was observed among GM thickness and FA values. Significant logarithm of odds (LOD ≥ 3.0) QTLs were localized within chromosome 15q22–23. More detailed localization reported no significant association (p < 5·10−5) for 1565 SNPs located within the QTLs. Post hoc analysis indicated that 40% of the potentially significant (p ≤ 10−3) SNPs were localized to the related orphan receptor alpha (RORA) and NARG2 genes. A potentially significant association was observed for the rs2456930 polymorphism reported as a significant GWAS finding in Alzheimer’s disease neuroimaging initiative subjects. The expression levels for RORA and ADAM10 genes were significantly (p < 0.05) correlated with both FA and GM thickness. NARG2 expressions were significantly correlated with GM thickness (p < 0.05) but failed to show a significant correlation (p = 0.09) with FA. Discussion: This study identified a novel, significant QTL at 15q22–23. SNP correlation with gene-expression analyses indicated that RORA, NARG2, and ADAM10 jointly influence GM thickness and WM–FA values.
Introduction
The human cerebrum is a complex, multi-compartmental structure whose anatomy and function are influenced by individual genetic variations (Thompson et al., 2001; Glahn et al., 2007). Understanding the genetic mechanisms that control inter-subject cerebral variability is critical for deciphering the brain’s normal and pathological function. Recent discoveries of genetic factors that can increase the likelihood of developing neurodegenerative disorders such as dementias has emphasized the need to identify genes that influence integrity of cerebral tissue (Glahn et al., 2007; Meyer-Lindenberg, 2010; Stein et al., 2010a). Magnetic resonance imaging (MRI) facilitates the in vivo assessment of cerebral atrophy and structural integrity. Statistical genetic methods have been developed to measure the genetic modulation of inter-subject variability. By combining neuroimaging with genetics clinical investigators have promoted a better understanding of cortical variability (Walsh, 2000; Farnham et al., 2004; Gaitanis and Walsh, 2004; Jones et al., 2004; Edenberg et al., 2005; Klein et al., 2005; Kamarajan et al., 2006; Brouwer et al., 2010; Kochunov et al., 2010a; Joshi et al., 2011) and neurodegenerative processes (Biffi et al., 2010; Joshi et al., 2011).
We hypothesized that some of the genetic factors responsible for the integrity of cortical gray matter (GM) are also responsible for the integrity of cerebral white matter (WM). To test this hypothesis we identified genetic sources of shared covariance in indices of GM and WM integrity measured in a well-characterized population of Mexican Americans (Mitchell et al., 1996; Olvera et al., 2010). Integrity of the GM and WM compartments was assessed using the thickness of cortical GM and the fractional anisotropy (FA) of cerebral WM. GM thickness is calculated as the distance from the outer cortical surface to the inner cortical WM–GM boundary (Fischl and Dale, 2000), or a related symmetric measure (Lerch and Evans, 2005; Aganj et al., 2009). GM thickness is an indirect measure of a complex cortical architecture that is sensitive to cortical myelination, synaptic pruning, and cell density (Huttenlocher and Dabholkar, 1997). Integrity of cerebral WM was assessed using FA of water diffusion, measured from diffusion tensor imaging data. FA describes the directional selectivity of the random diffusion of water molecules (Beaulieu, 2002). WM–FA values are sensitive to various tissue properties including myelin content, intra-voxel axonal crossing, and axonal fiber density and diameter (Beaulieu, 2002). Though gray and WM measures are highly heritable (h2 = 0.4–0.8; p < 10−6) the extent to which these different measures are influenced by overlapping genetic factors is unknown (Brouwer et al., 2010; Kochunov et al., 2010a; Winkler et al., 2010; Chiang et al., 2011).
Gray matter thickness and FA values follow an inverted U-shape trajectory with age (Sowell et al., 2003; Gogtay et al., 2004; Salthouse, 2009; Kochunov et al., 2010b). The two measurements have a positive linear relationship across the lifespan (Kochunov et al., 2011). Age-related changes in cerebral myelination are thought to be the putative biological mechanisms responsible for the shape of their age-trajectories and the relationship between them (Sowell et al., 2003; Gogtay et al., 2004). Histological studies that compared GM thickness measured from MRI with those from the corresponding myelin-stained sections observed that the MR signal was sensitive to intra- and inter-layer myelination and the intra- and inter-layer density of glial cells. Likewise, inter-subject differences in the regional WM FA values have been reported to be predominantly due to the regional inter-subject differences in myelination levels and density of the glial cells (Song et al., 2005; Madler et al., 2008). Age-related changes in regional axonal myelin, reflected by changing FA values in WM, are likely to be similar to age-related changes in cortical myelin (Abe et al., 2002; Gao et al., 2009).
In our current study we attempted to localize chromosomal sites and identify individual genes that jointly influence these quantitative traits using bivariate genetic analyses. For correlated traits bivariate genetic analyses can reveal genetic factors that contribute jointly to both traits and can greatly increase the power of genetic discovery compared to univariate analyses (Amos and Laing, 1993; Schmitz et al., 1998; Amos et al., 2001). We performed analyses in this well-characterized population of Mexican Americans where we have demonstrated significant heritability (h2 = 0.4–0.6; p < 10−6) of cortical GM thickness (Winkler et al., 2010) and FA values (Kochunov et al., 2010a).
Materials and Methods
Subjects
The Genetics of Brain Structure and Function study recruited, among others, active participants from the San Antonio Family Heart Study (SAFHS; Mitchell et al., 1996) for brain imaging and neurocognitive assessment (Olvera et al., 2010). Analyzes were performed on data from 712 subjects in total (274 men/438 women). The Mexican American individuals are from large extended pedigrees selected randomly from the community. Subjects ranged in age from 19 to 85 years of age (47.9 ± 13.2 years) and were members of 73 families (9.7 ± 9.3 individuals/family; range 2–49). Subjects were excluded if they had MRI contraindications, history of neurological illnesses, stroke, or any other major neurological event. All experiments were performed with IRB approval from the University of Texas Health Science Center at San Antonio (UTHSCSA). All participants provided written informed consent on forms approved by the Institutional Review Boards at the University of Texas Health Science Center San Antonio and Yale University.
MR Imaging
Imaging data were collected using a Siemens 3T Trio scanner located at the Research Imaging Institute, UTHSCSA.
T1-weighted imaging
This study used an MRI protocol specifically optimized for GM thickness measurements (Kochunov and Davis, 2009). The average GM thickness of the human cerebral cortex is approximately 2.5 mm, but varies regionally from 1.8–3.2 mm. High spatial resolution is necessary for accurate mapping of inter-subject GM thickness differences (Fischl and Dale, 2000). Our protocol was designed to collect data to resolve the cortical ribbon across the cortex using an isotropic spatial resolution of 0.8 mm (voxel volume = 0.5 mm3). T1-weighted contrast was achieved using a magnetization prepared sequence with an adiabatic inversion contrast-forming pulse (scan parameters: TE/TR/TI = 3.04/2100/785 ms, flip angle = 11°). A retrospective motion correction technique (Kochunov et al., 2006) was used to reduce artifacts related to subject motion.
Diffusion tensor imaging
Diffusion tensor images were collected using a single-shot, echo-planar, single refocusing spin-echo, T2-weighted sequence with a spatial resolution of 1.7 mm × 1.7 mm × 3.0 mm. The sequence parameters were: TE/TR = 87/8000 ms, FOV = 200 mm, axial slice orientation with 50 slices and no gaps, 55 isotropically distributed diffusion-weighted directions, two diffusion weighting values (b = 0 and 700 s/mm2) and three b = 0 images. These parameters were calculated using an optimization technique that maximizes the contrast to noise ratio for FA measurements (Jones et al., 1999).
Data Processing
Processing of T1-weighted images
The processing of the T1-weighted images is summarized in Figure 1; see (Kochunov et al., 2007) for details. Briefly, the processing consisted of removing non-brain tissues, global spatial normalization, and radio frequency (RF) inhomogeneity correction. Non-brain tissues, such as skin, muscle, and fat, were removed using an automated skull stripping procedure and images were corrected for RF inhomogeneity (Smith et al., 2004). Next, images were imported into a freely distributed, structural analysis package, BrainVisa1 and processed using its cortical extraction and parcellation pipelines, as described by Kochunov et al. (2005). This pipeline extracts the pial and GM/WM interface surfaces, performs extraction, labeling, and verification of sulcal surfaces as described by Mangin et al. (2004). It segments the cortical landscape into 14 cortical regions using the primary sulcal structures (Cachia et al., 2003). For the frontal lobe, these regions are included: superior (S. Frontal), intermediate (M. Frontal), inferior frontal (I. Frontal), and pre-central gyri (Pre. Central). Parietal lobe was segmented into the post-central gyrus (Post. Central) and superior and inferior parietal lobules (S. and I. Parietal; Table 2). The temporal lobe was segmented into superior (S. Temp), intermediate and inferior temporal gyri (M. I. Temp), and the fusiform gyrus (Fusiform). Occipital lobe was segmented into lateral (L. Occipt) and medial occipital areas (M. Occipt). The limbic lobe was segmented into the cingulate and hippocampal gyri.
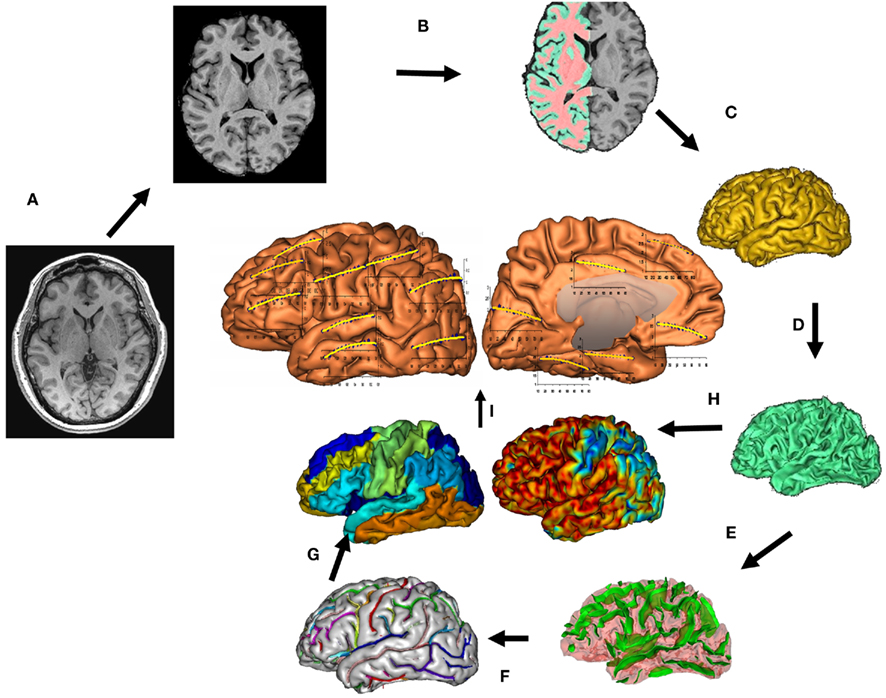
Figure 1. T1-weighted image processing pipelines. A T1-weighted image is skull-stripped, globally spatially normalized, and RF-inhomogeneity corrected (A). Next, cerebral hemispheres and cerebellum and identified and tissue classified (B). Cortical surfaces for GM and WM are calculated (C,D) and a homotopic erosion operation and crevasse detector are used to reconstruct sulcal surface as the medial surface of the two opposing gyral banks (E). The sulcal identification pipeline uses a congregation of 500 artificial neural network-based pattern classifiers to identify (F) sulcal landmarks, and to perform gyral segmentation of the cortex (G). GM thickness for 14 cortical regions (I), was calculated as the distance between the pial (C) and GM/WM interface surfaces (H).
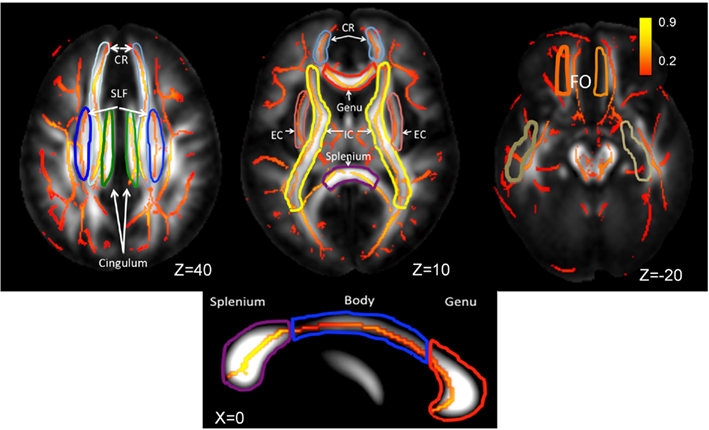
Figure 2. Skeletonized, average FA values are shown on the population average FA image. WM-tract labels for nine major tracts are taken from the Johns Hopkins DTI WM atlas. The average FA values were calculated for the following tracts: CR, corona radiata; SLF, superior longitudinal fasciculus, cingulate; EC, external capsule; IC, internal capsule, FO, fronto-occipital and the genu, body, and splenium of corpus callosum. The population-wise average FA values are color coded on the skeleton of the tract. The location of the axial slices (the Z-coordinate) is provided in the Talairach reference frame. The three segment of corpus callosum are shown on the mid-sagittal slice (Talairach X = 0).
Measurements of cortical gray matter thickness
Gray matter thickness is commonly defined as the distance from the outer cortical surface to the inner cortical WM–GM boundary (Figures 1D,H). Computationally, cortical thickness is determined by measuring the distance between two polygonal meshes, one representing the pial cortical surface and the other the white–gray interface. Multiple GM thickness measurement algorithms have been proposed to deal with the complex topography of the cerebral cortex. We used a GM thickness measurement tool distributed as a plug-in for BrainVisa2. This tool uses a “normal-average” algorithm that has been reported to be a good compromise between accuracy and performance (Lerch and Evans, 2005). The GM thickness is measured as the Euclidean distance from an inner mesh vertex to the outer mesh along the direction normal to the inner mesh polygon. The measurement is repeated, inward, along the direction normal the outer mesh and the two distances are averaged (Kochunov et al., 2008). The consistency of the distance measurements is ensured by verifying that the line connecting the two surfaces does not intersect other polygons, inner or outer, along the way. GM thickness measurements were averaged for individual cortical areas for both hemispheres; the whole-brain GM thickness measurement was obtained by averaging all gyral GM thickness measurements.
Processing of diffusion-weighted images
Details for the processing of DTI scans are discussed elsewhere (Kochunov et al., 2007). In short, the tract-based spatial statistics (TBSS) software (Smith et al., 2006) was used for multi-subject analysis of FA images. FA images were created by fitting the diffusion tensor to the raw diffusion data (Smith, 2002). All FA images were non-linearly aligned to a group-wise, minimal-deformation target (MDT) brain (Kochunov et al., 2001). Next, individual FA images were averaged to produce a group-average anisotropy image. This image was used to create a group-wise skeleton of WM tracts, which encodes the medial trajectory of the WM fiber-tracts. Finally, FA values from each image were projected onto the group-wise skeleton of WM structures. This step helps account for residual misalignment among individual WM tracts. FA values are assigned to each point along a skeleton using the peak value found within a 20-mm distance perpendicular to the skeleton. The FA values vary rapidly perpendicular to the tract direction but very slowly along the tract direction. By assigning the peak value to the skeleton, this procedure effectively maps the center of individual WM tracts onto the skeleton.
Tract-based analysis
Whole-brain average FA values were calculated by averaging values for the entire WM skeleton. Average FA values were calculated for nine major WM tracts (Table 1) as described elsewhere (Kochunov et al., 2010b). Briefly, the population-based, 3D, DTI cerebral WM tract atlas developed at the John Hopkins University (JHU) and distributed as part of the FSL software package (Wakana et al., 2004) was used to calculate population average diffusion parameter values along the nine major WM tracts (Table 1; Figure 3). The JHU atlas was non-linearly aligned to the MDT brain and labels for individual tracts were transferred to the MDT brain using nearest-neighbor interpolation. Per-tract average values were calculated by averaging the values along the tracts for both hemispheres. The overall average FA values were calculated by averaging values for the entire WM skeleton.
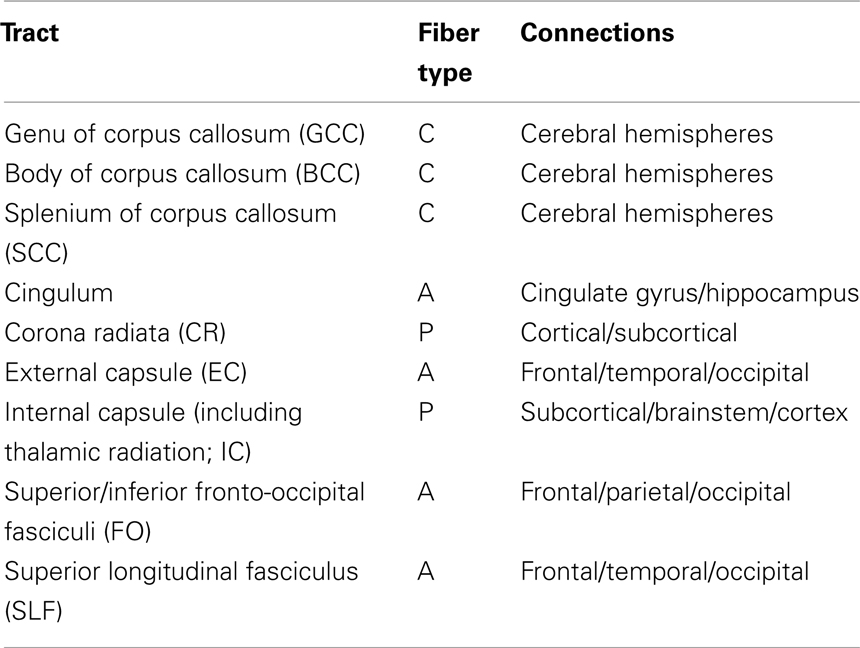
Table 1. Cerebral white matter tracts.
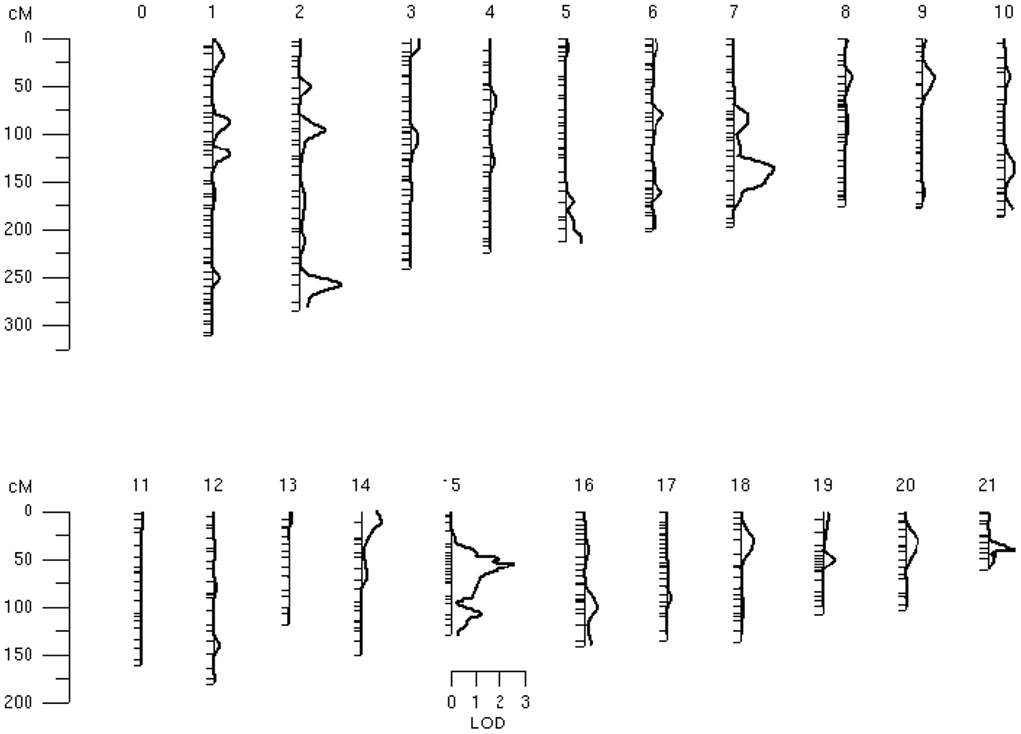
Figure 3. Bivariate linkage analysis results for the GM thickness of the superior parietal lobule and FA values of the body of corpus callosum.
Genotyping
Linkage markers
Details of the genotyping procedure are described elsewhere (Kammerer et al., 2003) After DNA was extracted from lymphocytes, fluorescently labeled primers from the MapPairs Human Screening set (versions 6 and 8; Research Genetics, Huntsville, AL, USA) and PCR were used to amplify 417 microsatellite markers spaced at approximately 10-cM intervals across 22 autosomes. An automated DNA sequencer (ABI Model 377 with Genescan and Genotyper software; Applied Biosystems, Foster City, CA, USA) was used. The average heterozygosity index for these markers was approximately 0.76. The sex-averaged marker map was confirmed by deCODE genetics and markers not on this map were placed by interpolation based on physical location (Goring et al., 2007).
Association markers
The DNA for all subjects was processed using one million single nucleotide polymorphism (SNP) genotypes using the Illumina Human1M-Duo BeadChip microarray. All SNP genotypes were checked for Mendelian consistency using the program SimWalk2 (Sobel and Lange, 1996). Maximum likelihood techniques that account for pedigree structure were used to estimate allelic frequencies, taking pedigree structure into account (Boehnke, 1991). To avoid excluding individuals with missing SNP data from the analysis, we employed likelihood-based imputation with the MERLIN software package (Abecasis et al., 2002; Burdick et al., 2006).
Gene-expression measurements
Gene-expression measurements, collected 17 years ago (from 1991 to 1995), were available for 371 (150/221 males/females; average age = 47.8 ± 12.9 years) of our subjects. The details of gene-expression measurements are discussed elsewhere (Goring et al., 2007). Total RNA was isolated from lymphocyte samples using a modified procedure of the QIAGEN RNeasy 96 protocol for isolating total RNA from animal cells using spin technology (QIAGEN, Inc.). Its integrity was verified and anti-sense RNA was synthesized, amplified and purified. Hybridization of anti-sense RNA was carried out using Illumina’s BeadChip 6 × 2 protocol. Samples were scanned on the Illumina BeadArray 500GX Reader. Expression levels were z-normalized to make the expression phenotypes comparable among individuals and across transcripts (Goring et al., 2007). This minimized the influence of overall signal levels, which may reflect RNA quantity and quality rather than true individual differences. The z-normalization was performed on the abundance values of all transcripts within individuals using decile percentage bins of transcripts, grouped by average log-transformed raw signals across individuals. This was followed by a linear regression against the individual-specific average log-transformed raw signal and its squared value. Finally, each transcript’s residual expression scores were normalized by using an inverse Gaussian transformation across individuals to ensure the data normality (Goring et al., 2007).
Genetic Analyses
Four sets of analyzes were performed to ascertain the magnitude of shared genetic variance between the GM thickness and FA and localize genetic factors that jointly influence whole-brain average and regional measurements. First, we formally estimated the significance of the phenotypic, genetic, and environmental correlation between both traits with a bivariate correlation analysis (Almasy et al., 1997; Almasy and Blangero, 1998). Further, we used bivariate whole-genome linkage analyses to formally localize chromosomal regions that jointly influenced the traits that showed a significant phenotypic correlation. Finally, gene-level localization was performed using SNP association and gene-expression analyses to identify putative genes located within chromosomal regions located under quantitative trait loci (QTL) peaks. All analyzes were performed using the SOLAR software package3 with age, sex, age × sex, age2, age2 × sex included as covariates.
Quantitative trait linkage analysis
Quantitative genetic analyses were performed using a variance-components, maximum likelihood method implemented in SOLAR (Almasy and Blangero, 1998). Bivariate quantitative trait linkage analyses of GM–FA trait pairs were performed to localize potentially pleiotropic QTLs (Almasy et al., 1997). Bivariate QTL analysis was chosen over the simpler, univariate linkage analysis on an arithmetic combination of two traits approach, because bivariate genetic analyses can greatly increase the power of genetic discovery compared to the univariate approach (Amos et al., 2001). Linkage significance was assessed by comparing the likelihood of a model with QTL-specific partial heritabilities estimated simultaneously for both traits to a null model in which both partial heritabilities were constrained to zero. Significance p-values from the 2 degree of freedom (df) bivariate linkage tests were converted to 1 df-equivalent LOD scores to aid comparison with univariate linkage results. We chose LOD scores of 2.0 and 3.0 as the thresholds for “suggestive” (likely to occur one or fewer times by chance in a genome scan) or significant scores (genome-wide p-value = 0.05), respectively.
Single nucleotide polymorphism association analyses
Single nucleotide polymorphism association analyses were performed for chromosomal regions located under the QTL peaks. SNP genotype values were represented as 0, 1, or 2 copies of the minor allele (or, for missing genotypes, the weighted covariate based on imputation). The significance of association was calculated by comparing the model that included the SNP value with the null models that incorporated standard polygenic effects and fixed covariates. The SNP genotype values were included as covariates in the variance-components mixed models for measured genotype analyses (Boerwinkle and Sing, 1986). The critical p-value, corrected for multiple comparisons, was computed based on the effective number as suggested in (Moskvina and Schmidt, 2008).
Results
Phenotypic correlation analyses between whole-brain average GM thickness and FA values reported that the two traits were significantly and positively correlated (rP = 0.27; p < 10−7). The positive sign of the phenotypic correlation coefficient suggested that the same genetic factors associated with higher FA values were linked to progressively higher GM thickness values. There are 126 possible GM–FA pairs between the 14 regional GM thickness values and nine regional FA values (Table 2). 114 out of 126 GM–FA correlation analyses showed a significant (p < 0.05) phenotypic correlation (rp), and 101 of the 126 were significant when corrected for multiple comparisons (p < 0.0004, Bonferroni correction for 126 tests).
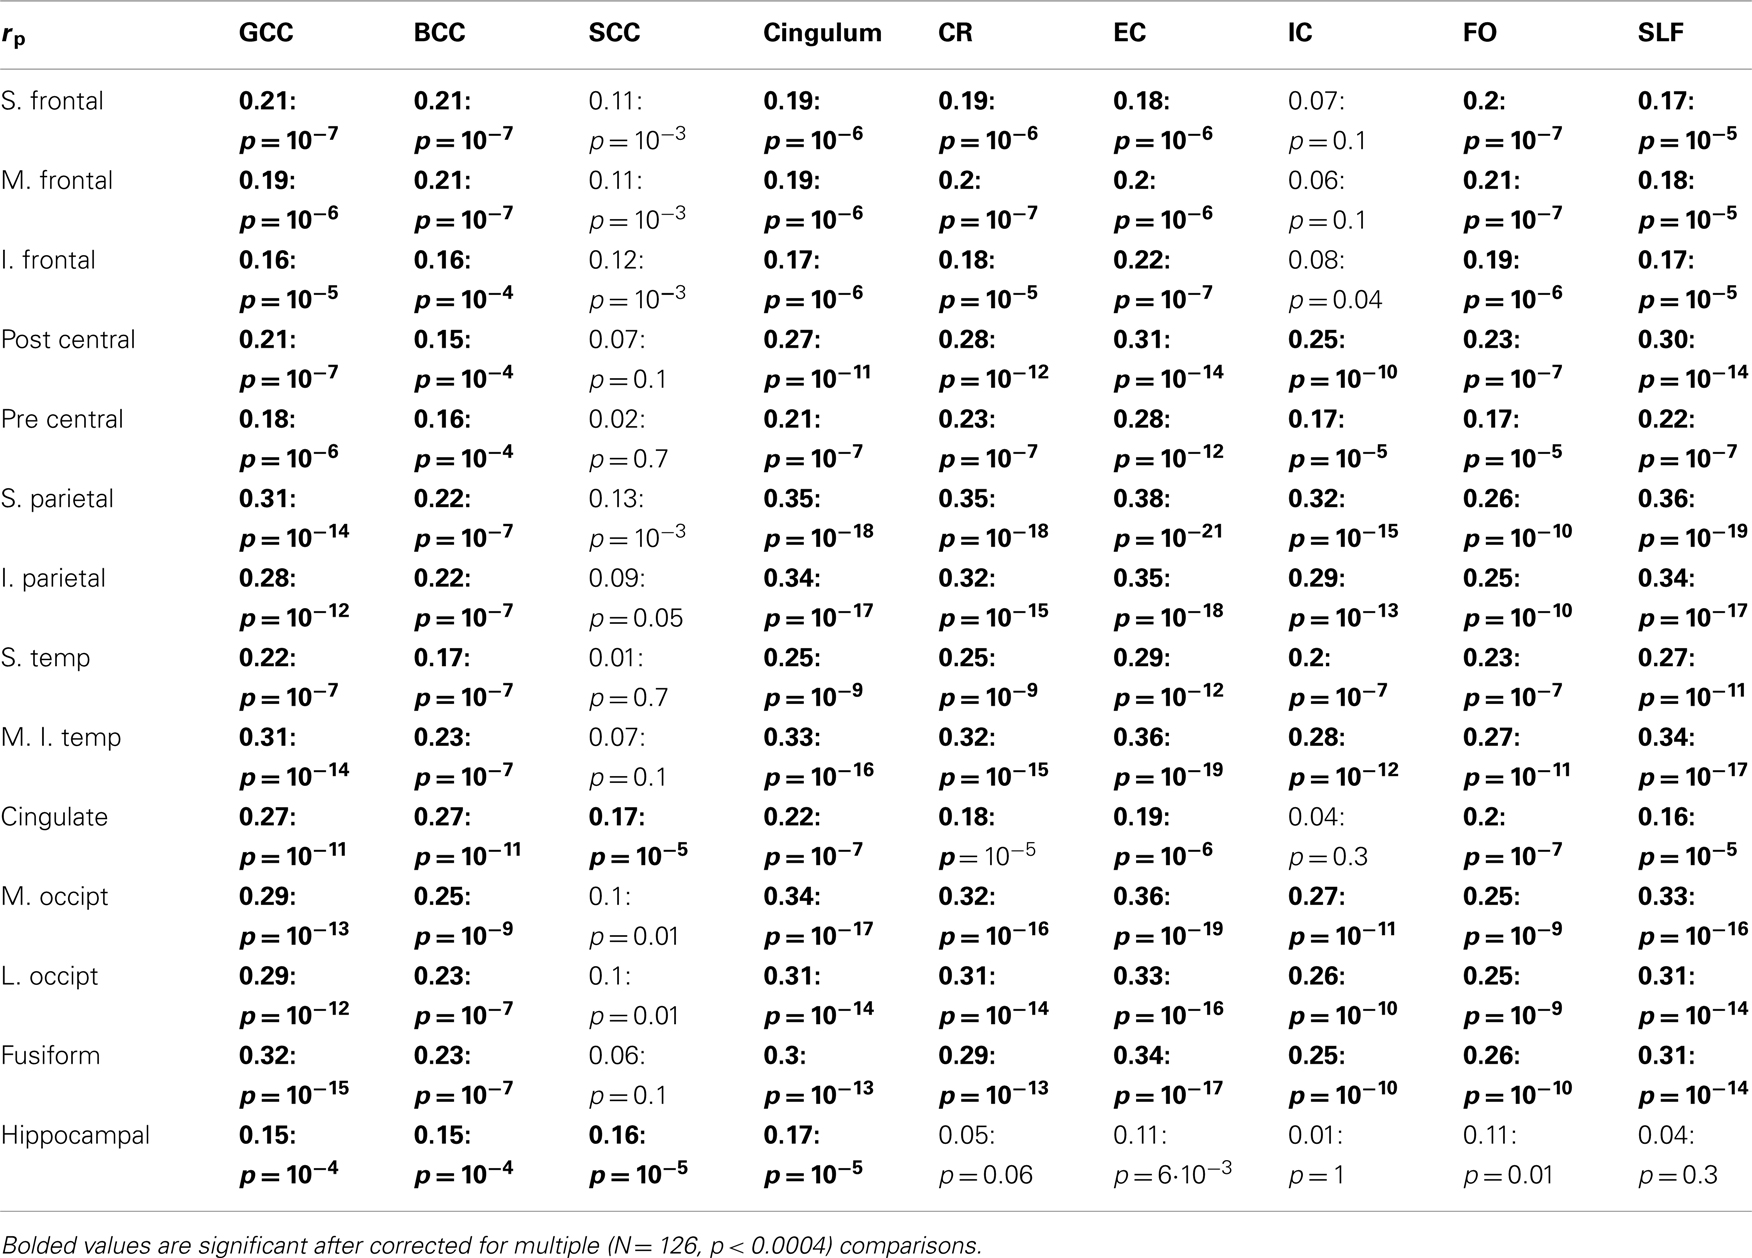
Table 2. Phenotypic, corrected for age and sex, correlation coefficients between regional GM thickness values, and by tract FA measurements.
Bivariate whole-genome QTL analysis of whole-brain average GM thickness and FA value produced a single peak of suggestive (LOD = 2.56) significance on the q-arm of chromosome 15 (ch15:54) located at 15q22–23. Regional, bivariate QTL analysis was limited to the chromosome 15 and performed for 101 trait pairs that showed significant phenotypic correlation (Table 2). This analysis produced 13 significant (LOD > 3.0) and 51 suggestive (LOD > 2.0) linkage peaks on the chromosome 15q22–23 (Table 3). The highest LOD (LOD = 4.51) score was observed for the GM thickness values of the superior parietal lobule and FA values of the body of CC (Figures 3 and 4, Table 3, top). Assuming that a LOD ≥ 3.0 criterion controls the risk of one or more false positives over all chromosomes at level 0.05, then 101 analyses should generate no more than 5.05 false positives, on average; thus 13 positive results is more than twice the number of positive results expected by chance. The locations of significant LOD peaks were flanked by markers rs12901270 and rs1574119 (15q22–23; Table 4; Figure 4).
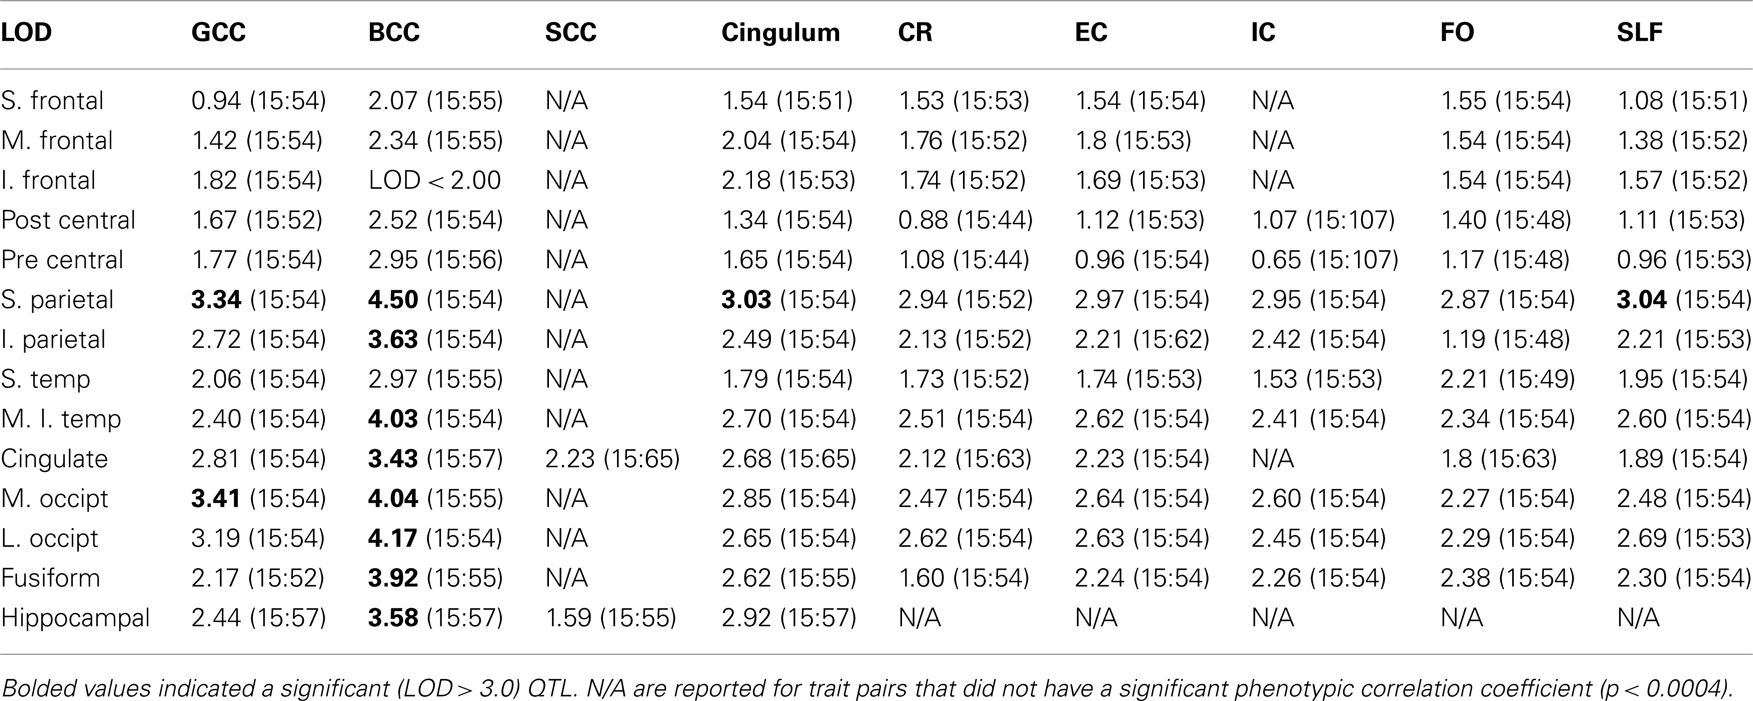
Table 3. Logarithm of Odds (LOD) values and location of the peak [chromosome: location (cM)] for traits.
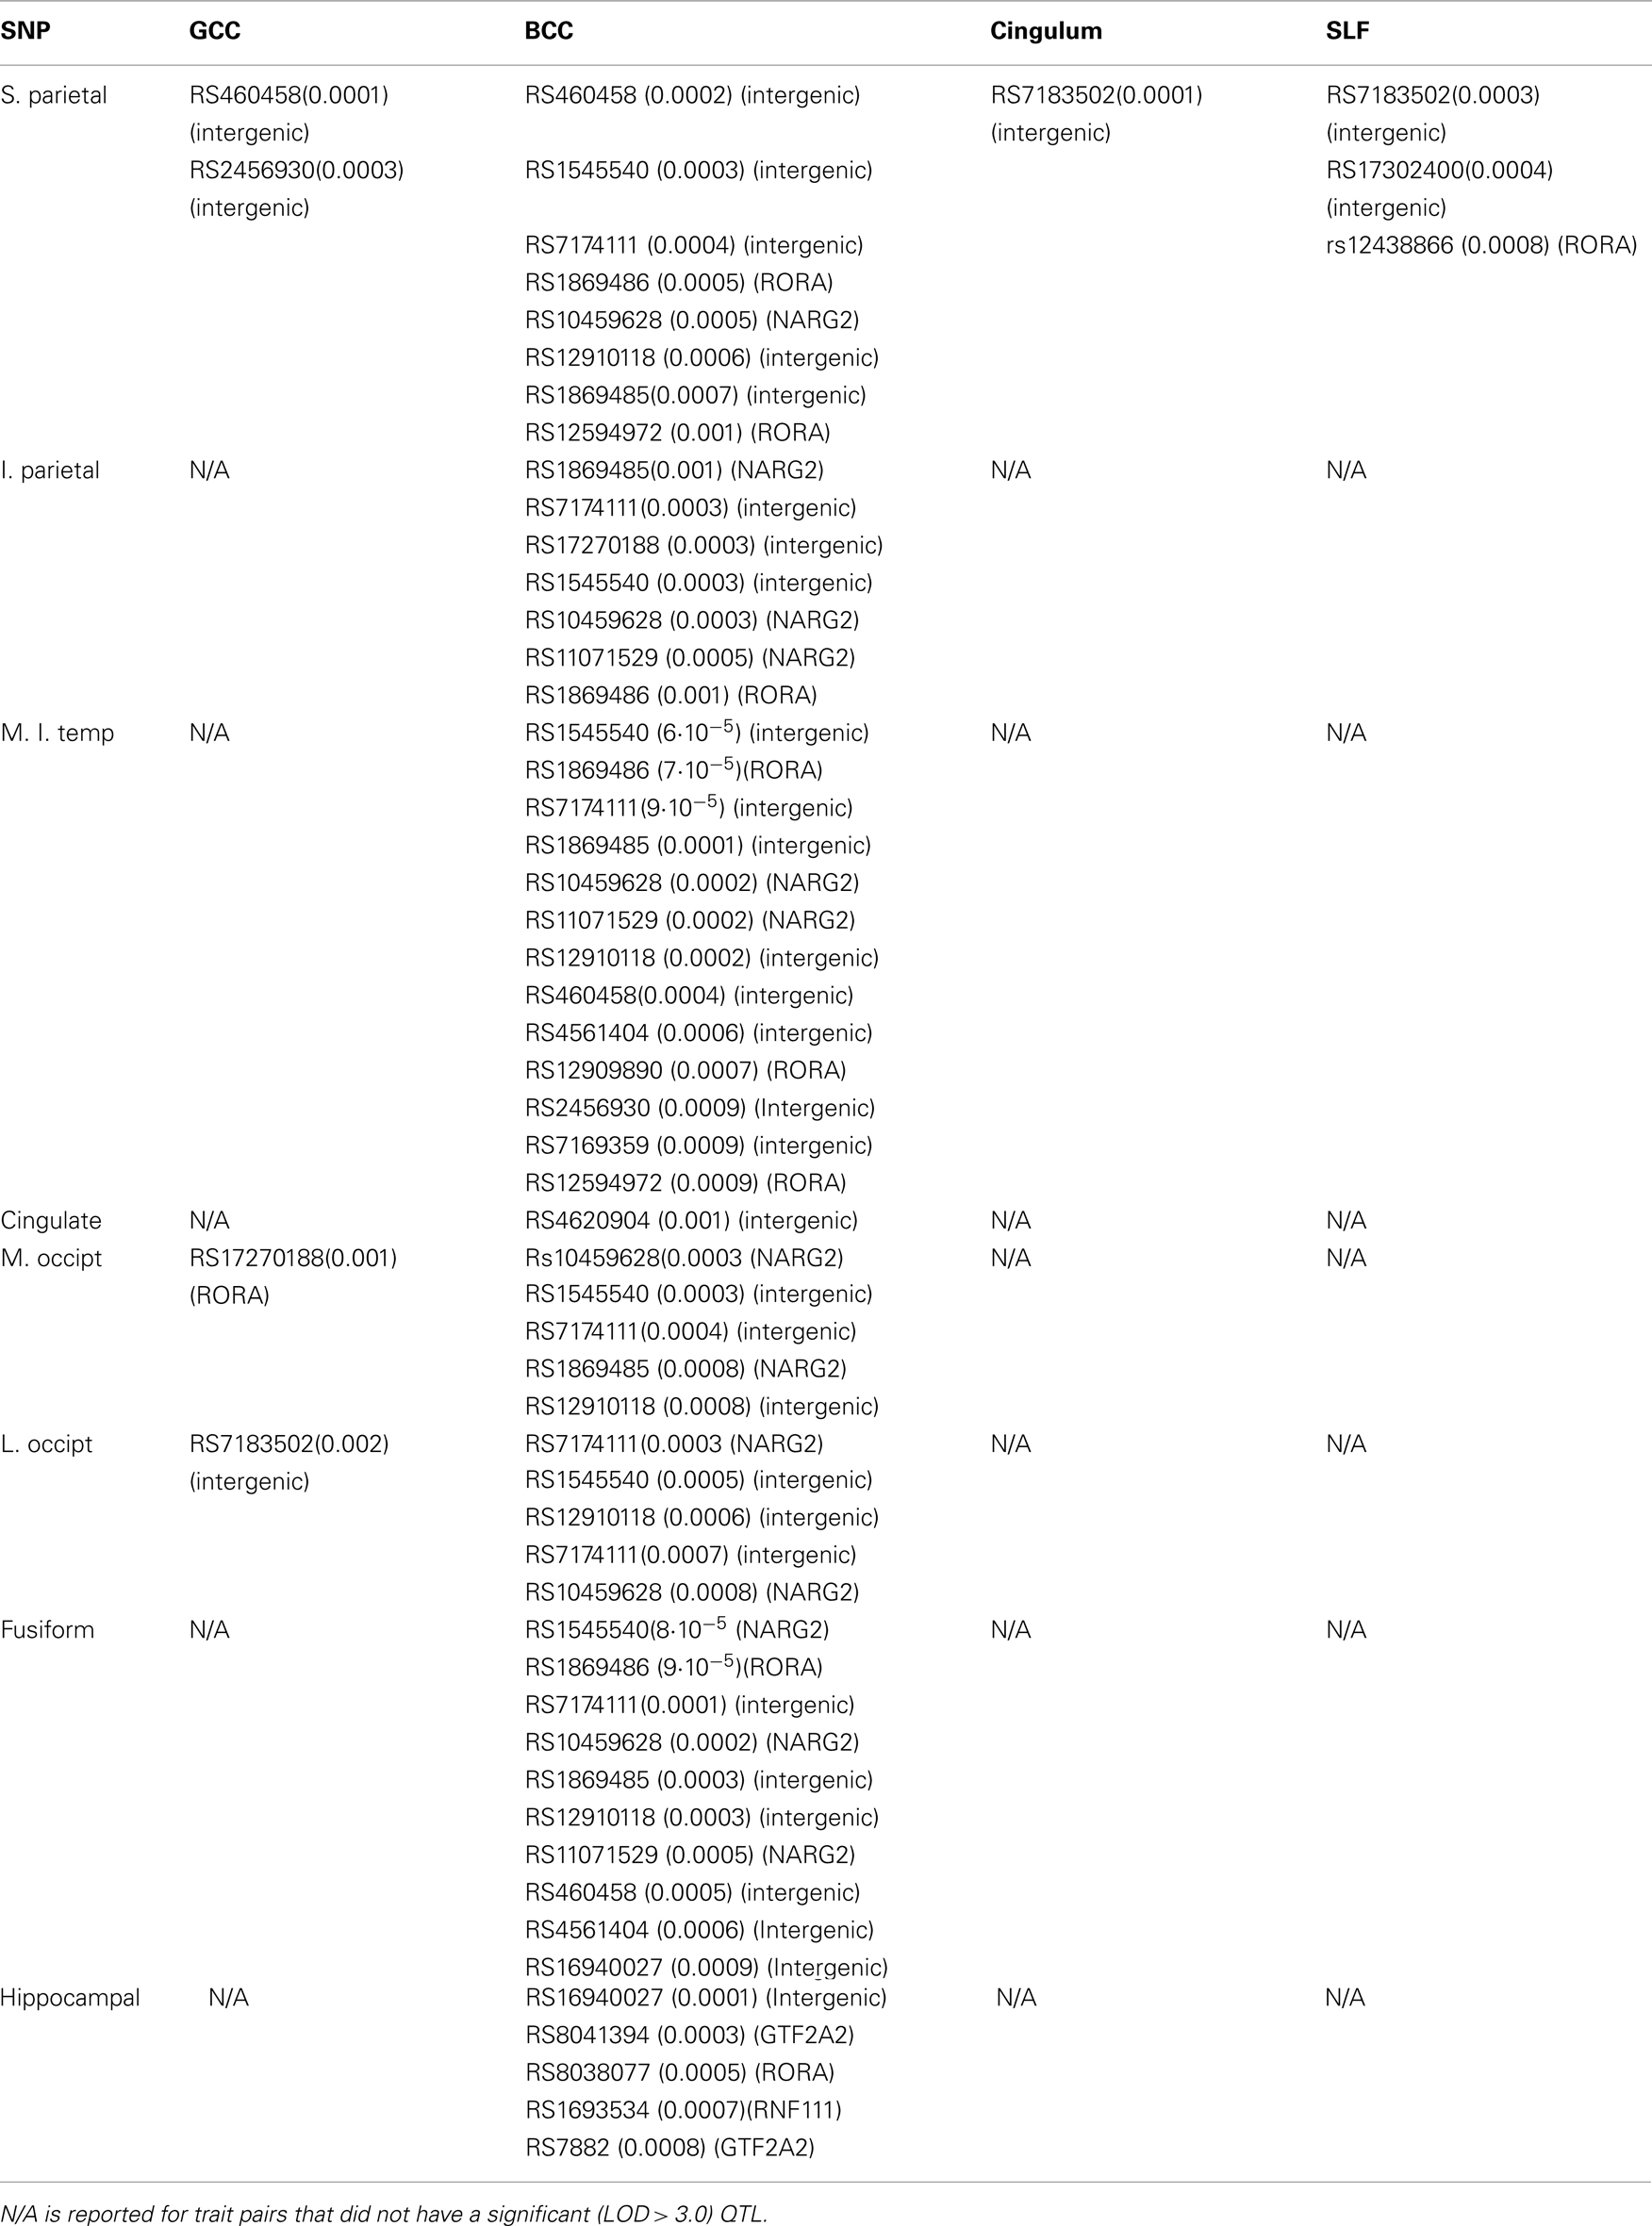
Table 4. SNP name (p) and (genetic association) for the highest and all suggestively (p ≤ 0.001) significant SNP associations.
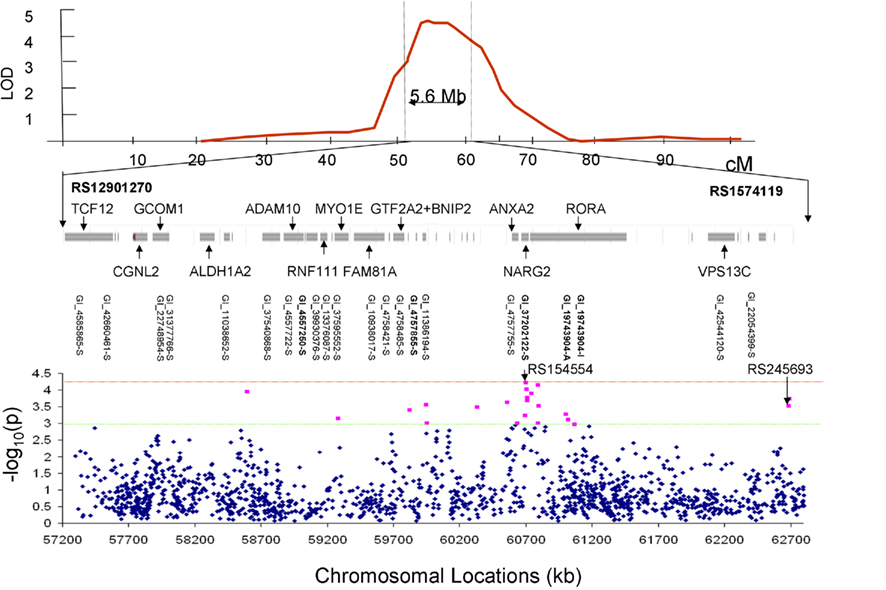
Figure 4. The LOD peak was flanked by markers rs12901270 and rs1574119 and covered 5.6 Mb of genome (top). The chromosomal region under the linkage peak harbored 20 genes with 22 gene expression measurements (middle). Results (-log10 of the p-value) of the association analysis for 1565 SNPs located under the linkage peak are plotted along the x-axis (bottom). The red line corresponds to the significant evidence value of p = 5·10−5. The green line corresponds to the suggestive evidence value of p = 1·10−3.
Bivariate SNP association analyses were performed for the thirteen trait pairs that showed significant QTL to achieve finer localization of the linkage region. A total of 1565 SNPs were extracted from the region of 5.6 Mb (Figure 4 middle). The effective number of SNPs, corrected for linkage disequilibrium, was 985 with a Bonferroni corrected significance criterion of 5·10−5. No SNP met this criterion of significance. The highest significance (6·10−5) was observed for the intergenic rs154554. This SNP is located in the immediate vicinity (103 kb pairs) of the p-end of the NMDA receptor regulated 2 (NARG2) gene (Table 4). The highest significant SNPs for the remaining 12 trait pairs, were localized to NARG2 gene (N = 5), retinotopic acid receptor (RAR)–related orphan receptor alpha (RORA) gene (N = 1), and the rest (N = 6) were intergenic.
Next, we performed two post hoc analyses to identify potential clustering patterns of the SNP associations. We identified the 22 suggestively (p ≤ 10−3) significant SNPs across all thirteen trait pairs (Figure 3; Table 5). None was in linkage disequilibrium with others based on the r2 > 0.80 thresholds. Nine of the 22 polymorphisms (41%) were localized to two neighboring genes: NARG2 (N = 3) and RORA (N = 6; Table 5; Figure 3, bottom). Two (rs8041394, p = 0.0003 and rs7882, p = 0.0001) were localized to the General Transcription Factor IIA, 2 gene (Table 5; Figure 3, bottom). One (rs1693534, p = 0.0007) was localized to the Ring Finger Protein 111 (RNF11) gene (Figure 3, bottom). Among the remaining (N = 7) intergenic polymorphisms, we identified rs2456930 (p = 0.0003; Figure 3, bottom). This polymorphism was reported as a highly associated (p = 3.1·10−7) finding resulting from genome-wide search by Stein and colleagues for bilateral temporal lobe volume in which each copy of the G allele correlated with reductions of temporal lobe volume (Stein et al., 2010a). In the current study, this SNP was observed as the second most significant association in the analysis of the GM thickness of the superior parietal lobule and the FA of the genu of corpus callosum. Residual (corrected for age and sex) GM thickness and FA values for subjects with homozygous minor (AA) allele were 3.8 and 3.4% higher than for subjects with GG allele (Figure 5).
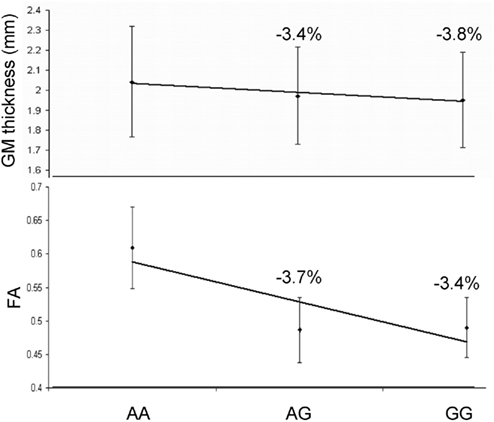
Figure 5. Residual (corrected for age and sex) GM thickness and FA values for subjects with grouped by genotype for the rs2456930 polymorphism. The allele frequencies for this population were AA = 14.6%, AG = 48.3%, and GG = 36.9%.
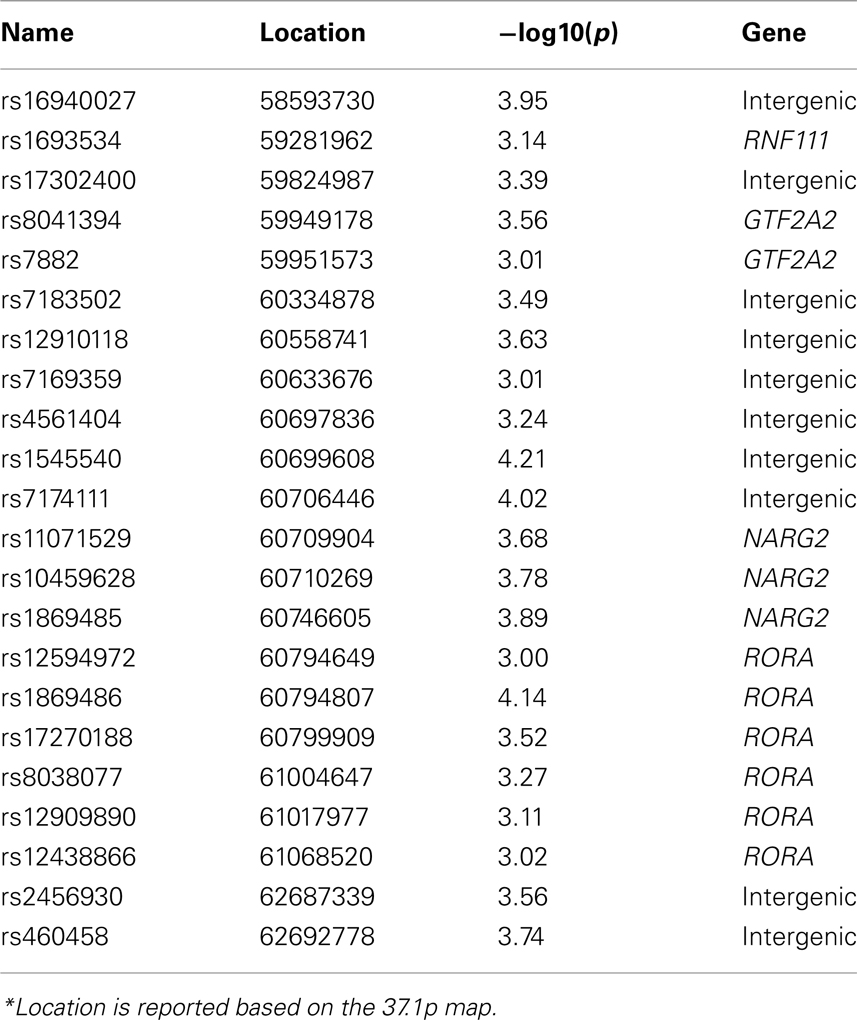
Table 5. Suggestively (p ≤ 0.001) significant SNP association aggregated for the thirteen traits.
Next, we identified the frequency at which polymorphisms appeared in the list of top-10 most significant polymorphisms for the thirteen trait pairs (Table 6). This list was composed of 46 unique polymorphisms (Table 6). None of the SNPs were in linkage disequilibrium with others based on the r2 > 0.80 threshold. Three polymorphisms (rs1545540, rs1869485, and rs717411) had the highest co-occurrence (occurred for 11 out of 13 trait pairs). Two were intergenic (rs1545540 and rs7174111) and one (rs1869485) resided with the NARG2 gene. Both intergenic (rs1545540 and rs7174111) polymorphisms were proximal (12 Kbt and 5 Kbt downstream, respectively) to the NARG2 gene. We further analyzed the genetic association of the 130 most significant polymorphisms. Polymorphisms localized to two genes: RORA and NARG2 accounted for about 22% of the polymorphisms (Table 7).
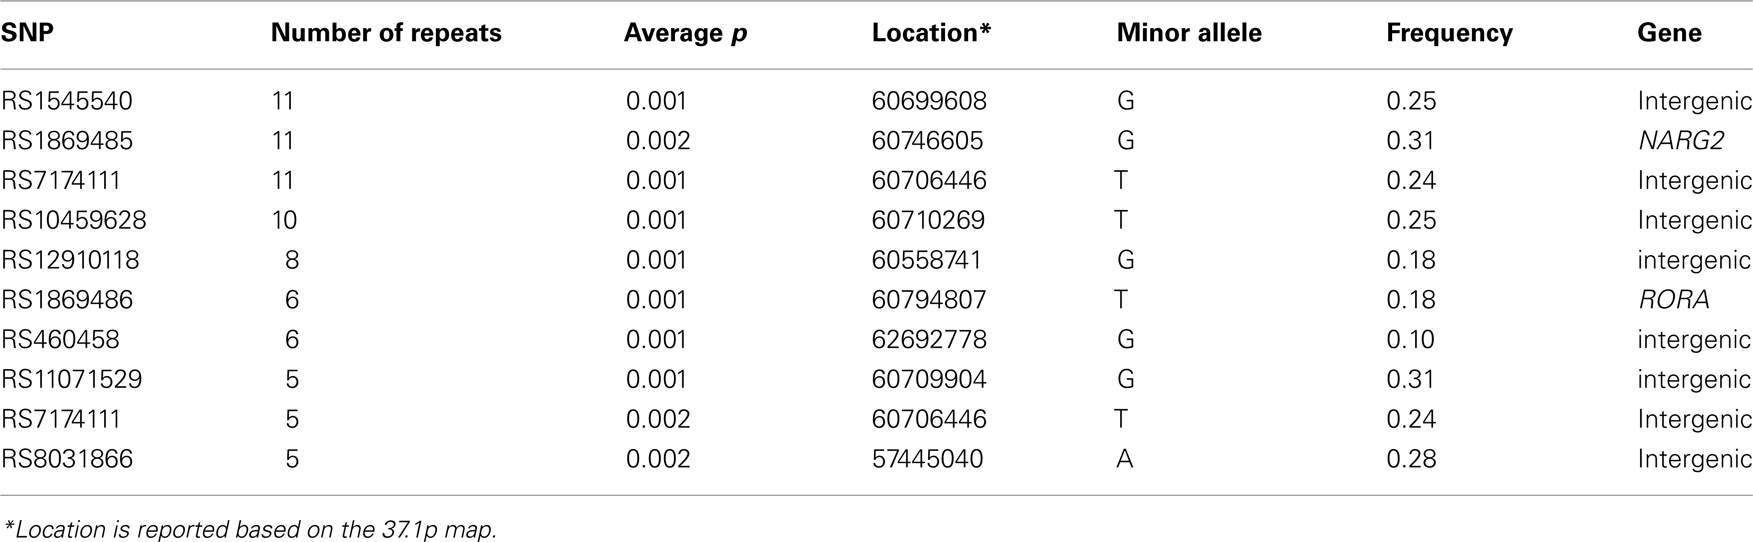
Table 6. Frequency repeats by SNPs within N = 130 of top-10 significant associations for each of the thirteen traits.
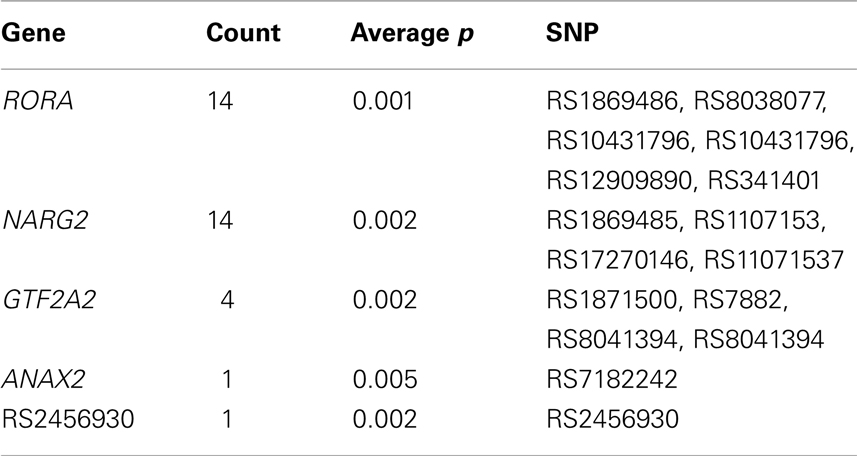
Table 7. Analysis of repeats by gene within top-10 significant association for each of the thirteen traits.
Finally, we tested 22 gene-expression measurements from 20 genes residing under the linkage peak. These data were collected 17 years ago and were available for 371 subjects. Bivariate genetic correlation analysis was used to calculate phenotypic correlation between gene-expression values and whole-brain GM thickness and FA values separately. Phenotypic (rP) correlation values for two transcripts of the RORA gene and one transcript of disintegrin and metalloproteinase domain-containing protein 10 (ADAM10) were significant (p < 0.05) for both GM thickness and FA values (Table 8).
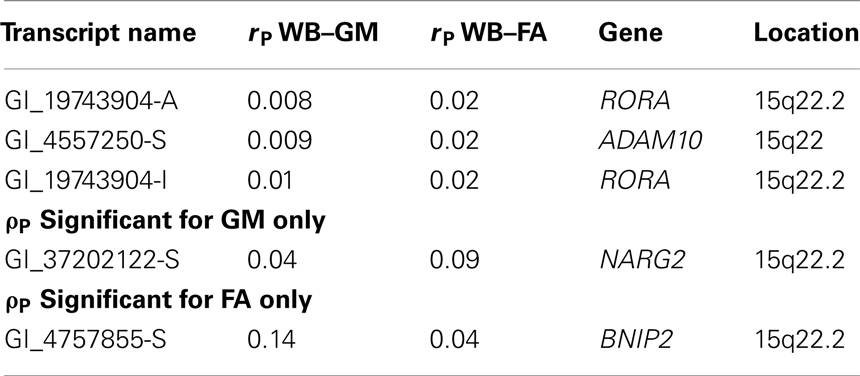
Table 8. Correlation coefficient between the expression level and whole-brain average GM thickness and FA values.
A transcript for NARG2 gene was correlated with the GM thickness and its correlation coefficient with FA approached significance (p < 0.10). However, these correlations did not reach significance (p = 0.002) once corrected for multiple (N = 22) comparisons. Additionally, the ADAM10 expressions were significantly and positively correlated with the NARG2 expressions (r = 0.44; p < 10−5). No further significant (r = < 0.10) correlations were observed among other transcripts.
Discussion
The life-long relationship between cortical GM thickness and WM FA values (Kochunov et al., 2011) suggests that shared genetic factors might be influencing their age-trajectories. We examined these trends in a large, well-characterized sample of Mexican–American participants from the Genetics of Brain Structure and Function study and demonstrated a significant shared variance between them. We used bivariate genetic analyses to localize chromosomal regions and to identify individual genes involved in this relationship. The bivariate linkage analysis of the whole-brain average GM thickness and FA values produced a suggestive locus on the chromosome 15q22–23 near the previously reported univariate QTL for the FA values (Kochunov et al., 2010a). Bivariate linkage analyses of regional GM and FA trait pairs produced thirteen significant loci in the same region. This chromosomal region of 5.6 Mb harbors over 30 genes, many of which are critical to normal brain development. Reports on individuals with chromosomal deletions in this region have described severe congenital defects such as holoprosencephaly (Machado et al., 2010) and cerebral dysmorphia (Koivisto et al., 1999; Lalani et al., 2006). A microdeletion of 1 Mb of genome in the immediate vicinity to the rs1574119 resulted in cerebral dysmorphia, autism, mental retardation, and developmental delay (Smith et al., 2000). Additionally, a study in 175 families of Latino descent reported this region as a locus of suggestive (LOD = 2.11) significance for harboring genes that act as risk factors for schizophrenia (Escamilla et al., 2009).
We attempted to identify individual genes using SNP associations and correlations with the gene-expression analyses. The bivariate association analysis for the 1565 SNPs uniformly covering this region did not return a definitive finding. It produced several useful results. 41% of the potentially (p < 10−3) significant SNPs were localized to two proximal genes NARG and RORA. These two genes span 14% of the genome between markers rs12901270 and rs1574119 and therefore received a higher (two to three times) number of associations than would be expected by chance. Examining the top-10 most significant SNPs for each of the 13 trait pairs found that 22% (28 out of 130) of the polymorphism were also localized to the NARG2 or RORA genes. Correlation with gene-expression values identified three transcripts whose expression levels were significantly (r < 0.05) correlated with whole-brain average measurements for both traits. Two of these transcripts were from the RORA gene. The third transcript was from the ADAM metallopeptidase domain 10 (ADAM10) gene. The transcript for NARG2 gene showed a significant correlation with GM thickness and a suggestive (p = 0.09) correlation with the FA values.
We consider RORA as the likely candidate for pleiotropic association between FA and GM thickness. RORA was discovered as the site of the “staggerer” mutation in a mouse model that is characterized by cerebellar ataxia and profound neurodegeneration (Hamilton et al., 1996; Dussault et al., 1998). RORA encodes a protein that acts as a constitutive activator of transcription and a receptor for glucocorticoids (Jarvis et al., 2002). It is expressed in many tissues including cortical, subcortical and cerebellar neurons and neuroglial cells (Jarvis et al., 2002). In neuronal and glial cells the RORA transcription factor exerted both neuroprotective and anti-inflammatory functions. It provides neuroprotection by increasing the expression of antioxidant proteins, which makes neurons less sensitive to apoptotic stimuli (Boukhtouche et al., 2006). In glial cells its expression is up-regulated by pro-inflammatory cytokines and loss of its function leads to pro-inflammatory activation in astrocytes. Epidemiological genetic analyses implicated this gene in several disorders including: depression (Garriock et al., 2009; Lavebratt et al., 2009; Le-Niculescu et al., 2009; McGrath et al., 2009; Terracciano et al., 2010), Parkinson’s disease (Edwards et al., 2010), age-related macular degeneration (Schaumberg et al., 2010), and attention deficit hyperactivity disorder (Neale et al., 2008). Its lymphocytic expression levels in autistic individuals were lower than in healthy controls and correlated with the severity of the disorder (Hu et al., 2006, 2009; Nguyen et al., 2010; Sarachana et al., 2010).
We consider NARG2 as a potential candidate gene. Relatively little is know about this gene. It codes the N-methyl-D-aspartate (NMDA) receptor, a glutamate-gated ion channel (Sugiura et al., 2001). It is highly expressed in the neonatal brain and plays an important role in brain development by regulating neuronal survival, migration, and proliferation (Sugiura et al., 2004). Though NARG2 is located next to RORA on the q-terminal, the lack of correlation between NARG2 and RORA indicates that NARG2 modulation of GM thickness is unrelated to its proximity to RORA.
Notably, the gene-expressions for the α-secretase, ADAM10 gene were correlated with both GM thickness and FA values. ADAM10 is an α-secretase capable of anti-amyloidogenic proteolysis of the amyloid precursor protein. This gene is considered a novel treatment target for Alzheimer’s disease (AD; Kim et al., 2009). In vitro studies demonstrated that α-secretase is responsible for the non-amyloidogenic cleavage of Alzheimer’s plaque protein. Up-regulation of its expression can prevent intracellular and extracellular accumulation of the toxic β-amyloid species (Aβ; Jarvis et al., 2010). In vivo animal studies in Alzheimer mouse models showed that blocking ADAM10 expression, or its trans-synaptic transport, led to a rapid increase in the concentration of Aβ plaque and increased brain atrophy (Epis et al., 2010; Wang et al., 2010; Zhang et al., 2010). Reduced ADAM10 trans-synaptic trafficking rates were also demonstrated in the hippocampal tissue samples from AD patients (Marcello et al., 2010). Two ADAM10 polymorphisms were associated with increased risk of developing a late-onset AD (Kim et al., 2009). These polymorphisms significantly attenuated α-secretase activity of (>70% decrease), and elevated Aβ levels (1.5–3.5-fold).
Our study replicated an association between rs2456930 and brain integrity (Stein et al., 2010b). Stein and colleagues identified this SNP as a significant GWAS finding in 742 participants in the Alzheimer disease neuroimaging initiative (ADNI). The genotypic frequencies for this SNP in our subjects (AA = 14.6%, AG = 48.3%, GG = 36.9%) were nearly identical to those reported by Stein and colleagues (AA = 13.0%, AG = 49.5%, GG = 37.5%; Stein et al., 2010a). The magnitudes and the direction of the genetic effects for were also similar. In both populations the homozygous minor allele (AA) exerted neuroprotective properties. The AA carriers had higher GM thickness and FA values (3.8 and 3.4%, respectively) than carriers of the homozygous major allele (GG). Stein et al. (2010a) reported a 3.13% higher volume of the temporal lobe for AA versus GG carriers. This polymorphism is found within a “gene desert” over 200 kb away from known genes. It is located within a 10 kb of a region with both promoter and enhancer histone markings which characterizes it as an area with potential regulatory function (Schones and Zhao, 2008). It potentially has high functional relevance, even though the gene target is not yet known. Our finding suggests the neuroprotective effects of this polymorphism can be observed in normal aging and therefore, are probably not directly associated with AD pathology.
Our analysis of a population of healthy aging Mexican Americans has identified a novel, significant QTL at the chromosome 15q22–23. SNP association and correlation with gene-expression analyses identified three genes located under the linkage peak, RORA, NARG2, and ADAM10, showed potential for jointly influencing cortical thickness and cerebral WM integrity. Genetic factors that are jointly influencing two different imaging traits may be acting through neuroprotective effects. The scientific literature indicates that RORA and ADAM10 genes are considered potential treatment targets for neurodegenerative disorders, and two mutations of ADAM10 gene are being considered as candidates for AD susceptibility. Localization of these genes reached only trend significance and further deep sequencing and functional variants analyses will be required for the true identification.
Limitations
This study was performed in Mexican Americans, a population with significant Native American admixture. If relatively rare variants are involved in the determination of quantitative variability, we may expect considerable differences in the localization of the most important genetic loci across populations (Blangero et al., 2003). Linkage studies of such complex phenotypes cannot be used to exclude genetic regions for important QTLs. Therefore, the lack of concordance cannot be interpreted as evidence against the hypothesis that a QTL exists in a particular genomic region.
The gene-expression correlation analyses were limited by two factors. First, these were available for about half (N = 371, 150/221 males/females; average age = 47.8 ± 12.9 years) of our subjects. Second, the collection of gene-expression data preceded the acquisition of brain images by 17 years. This prospective analysis approach may limit future replications studies.
Another limitation of this analysis is the use of Bonferroni correction for multiple comparisons. Permutation analysis can be used to infer empirical p-values and provide less conservative correction for multiple comparisons than that obtained with Bonferroni. However, the variance-components estimation in large extended pedigrees is not trivial and sometimes may fail to converge as permutation does not take family structures into the account. Hence permutation would require significant additional effort, and since the Bonferroni thresholds are conservative, we chose to use that methodology.
Conflict of Interest Statement
The authors declare that the research was conducted in the absence of any commercial or financial relationships that could be construed as a potential conflict of interest.
Acknowledgments
This research was supported by a National Institute of Biomedical Imaging and Bioengineering (K01 EB006395) grant to Peter Kochunov, and by National Institute of Mental Health grants (RO1s MH078111, MH0708143, and MH083824) to John Blangero and David Glahn.
Footnotes
References
Abe, O., Aoki, S., Hayashi, N., Yamada, H., Kunimatsu, A., Mori, H., Yoshikawa, T., Okubo, T., and Ohtomo, K. (2002). Normal aging in the central nervous system: quantitative MR diffusion-tensor analysis. Neurobiol. Aging 23, 433–441.
Abecasis, G. R., Cherny, S. S., Cookson, W. O., and Cardon, L. R. (2002). Merlin – rapid analysis of dense genetic maps using sparse gene flow trees. Nat. Genet. 30, 97–101.
Aganj, I., Sapiro, G., Parikshak, N., Madsen, S. K., and Thompson, P. M. (2009). Measurement of cortical thickness from MRI by minimum line integrals on soft-classified tissue. Hum. Brain Mapp. 30, 3188–3199.
Almasy, L., and Blangero, J. (1998). Multipoint quantitative-trait linkage analysis in general pedigrees. Am. J. Hum. Genet. 62, 1198–1211.
Almasy, L., Dyer, T. D., and Blangero, J. (1997). Bivariate quantitative trait linkage analysis: pleiotropy versus co-incident linkages. Genet. Epidemiol. 14, 953–958.
Amos, C., de Andrade, M., and Zhu, D. (2001). Comparison of multivariate tests for genetic linkage. Hum. Hered. 51, 133–144.
Amos, C. I., and Laing, A. E. (1993). A comparison of univariate and multivariate tests for genetic linkage. Genet. Epidemiol. 10, 671–676.
Beaulieu, C. (2002). The basis of anisotropic water diffusion in the nervous system – a technical review. NMR Biomed. 15, 435–455.
Biffi, A., Anderson, C. D., Desikan, R. S., Sabuncu, M., Cortellini, L., Schmansky, N., Salat, D., and Rosand, J. (2010). Genetic variation and neuroimaging measures in Alzheimer disease. Arch. Neurol. 67, 677–685.
Blangero, J., Williams, J. T., and Almasy, L. (2003). Novel family-based approaches to genetic risk in thrombosis. J. Thromb. Haemost. 1, 1391–1397.
Boehnke, M. (1991). Allele frequency estimation from data on relatives. Am. J. Hum. Genet. 48, 22–25.
Boerwinkle, E., and Sing, C. F. (1986). Bias of the contribution of single-locus effects to the variance of a quantitative trait. Am. J. Hum. Genet. 39, 137–144.
Boukhtouche, F., Vodjdani, G., Jarvis, C. I., Bakouche, J., Staels, B., Mallet, J., Mariani, J., Lemaigre-Dubreuil, Y., and Brugg, B. (2006). Human retinoic acid receptor-related orphan receptor alpha1 overexpression protects neurones against oxidative stress-induced apoptosis. J. Neurochem. 96, 1778–1789.
Brouwer, R. M., Mandl, R. C., Peper, J. S., van Baal, G. C., Kahn, R. S., Boomsma, D. I., and Hulshoff Pol, H. E. (2010). Heritability of DTI and MTR in nine-year-old children. Neuroimage 53, 1085–1092.
Burdick, J. T., Chen, W. M., Abecasis, G. R., and Cheung, V. G. (2006). In silico method for inferring genotypes in pedigrees. Nat. Genet. 38, 1002–1004.
Cachia, A., Mangin, J. F., Riviere, D., Papadopoulos-Orfanos, D., Kherif, F., Bloch, I., and Regis, J. (2003). A generic framework for the parcellation of the cortical surface into gyri using geodesic Voronoi diagrams. Med. Image Anal. 7, 403–416.
Chiang, M. C., McMahon, K. L., de Zubicaray, G. I., Martin, N. G., Hickie, I., Toga, A. W., Wright, M. J., and Thompson, P. M. (2011). Genetics of white matter development: a DTI study of 705 twins and their siblings aged 12 to 29. Neuroimage 54, 2308–2317.
Dussault, I., Fawcett, D., Matthyssen, A., Bader, J. A., and Giguere, V. (1998). Orphan nuclear receptor ROR alpha-deficient mice display the cerebellar defects of staggerer. Mech. Dev. 70, 147–153.
Edenberg, H. J., Bierut, L. J., Boyce, P., Cao, M., Cawley, S., Chiles, R., Doheny, K. F., Hansen, M., Hinrichs, T., Jones, K., Kelleher, M., Kennedy, G. C., Liu, G., Marcus, G., McBride, C., Murray, S. S., Oliphant, A., Pettengill, J., Porjesz, B., Pugh, E. W., Rice, J. P., Rubano, T., Shannon, S., Steeke, R., Tischfield, J. A., Tsai, Y. Y., Zhang, C., and Begleiter, H. (2005). Description of the data from the collaborative study on the genetics of alcoholism (COGA) and single-nucleotide polymorphism genotyping for genetic analysis workshop 14. BMC Genet. 6(Suppl. 1). doi: 10.1186/1471-2156-6-S1-S2
Edwards, T. L., Scott, W. K., Almonte, C., Burt, A., Powell, E. H., Beecham, G. W., Wang, L., Zuchner, S., Konidari, I., Wang, G., Singer, C., Nahab, F., Scott, B., Stajich, J. M., Pericak-Vance, M., Haines, J., Vance, J. M., and Martin, E. R. (2010). Genome-wide association study confirms SNPs in SNCA and the MAPT region as common risk factors for Parkinson disease. Ann. Hum. Genet. 74, 97–109.
Epis, R., Marcello, E., Gardoni, F., Vastagh, C., Malinverno, M., Balducci, C., Colombo, A., Borroni, B., Vara, H., Dell’Agli, M., Cattabeni, F., Giustetto, M., Borsello, T., Forloni, G., Padovani, A., and Di Luca, M. (2010). Blocking ADAM10 synaptic trafficking generates a model of sporadic Alzheimer’s disease. Brain 133, 3323–3335.
Escamilla, M., Hare, E., Dassori, A. M., Peralta, J. M., Ontiveros, A., Nicolini, H., Raventos, H., Medina, R., Mendoza, R., Jerez, A., Munoz, R., and Almasy, L. (2009). A schizophrenia gene locus on chromosome 17q21 in a new set of families of Mexican and central American ancestry: evidence from the NIMH Genetics of schizophrenia in latino populations study. Am. J. Psychiatry 166, 442–449.
Farnham, J. M., Camp, N. J., Neuhausen, S. L., Tsuruda, J., Parker, D., MacDonald, J., and Cannon-Albright, L. A. (2004). Confirmation of chromosome 7q11 locus for predisposition to intracranial aneurysm. Hum. Genet. 114, 250–255.
Fischl, B., and Dale, A. M. (2000). Measuring the thickness of the human cerebral cortex from magnetic resonance images. Proc. Natl. Acad. Sci. U.S.A. 97, 11050–11055.
Gaitanis, J. N., and Walsh, C. A. (2004). Genetics of disorders of cortical development. Neuroimaging Clin. N. Am. 14, 219–229, viii.
Gao, W., Lin, W., Chen, Y., Gerig, G., Smith, J. K., Jewells, V., and Gilmore, J. H. (2009). Temporal and spatial development of axonal maturation and myelination of white matter in the developing brain. AJNR Am. J. Neuroradiol. 30, 290–296.
Garriock, H. A., Kraft, J. B., Shyn, S. I., Peters, E. J., Yokoyama, J. S., Jenkins, G. D., Reinalda, M. S., Slager, S. L., McGrath, P. J., and Hamilton, S. P. (2009). A genomewide association study of citalopram response in major depressive disorder. Biol. Psychiatry 67, 133–138.
Glahn, D. C., Thompson, P. M., and Blangero, J. (2007). Neuroimaging endophenotypes: strategies for finding genes influencing brain structure and function. Hum. Brain Mapp. 28, 488–501.
Gogtay, N., Giedd, J. N., Lusk, L., Hayashi, K. M., Greenstein, D., Vaituzis, A. C., Nugent, T. F. III, Herman, D. H., Clasen, L. S., Toga, A. W., Rapoport, J. L., and Thompson, P. M. (2004). Dynamic mapping of human cortical development during childhood through early adulthood. Proc. Natl. Acad. Sci. U.S.A. 101, 8174–8179.
Goring, H. H., Curran, J. E., Johnson, M. P., Dyer, T. D., Charlesworth, J., Cole, S. A., Jowett, J. B., Abraham, L. J., Rainwater, D. L., Comuzzie, A. G., Mahaney, M. C., Almasy, L., MacCluer, J. W., Kissebah, A. H., Collier, G. R., Moses, E. K., and Blangero, J. (2007). Discovery of expression QTLs using large-scale transcriptional profiling in human lymphocytes. Nat. Genet. 39, 1208–1216.
Hamilton, B. A., Frankel, W. N., Kerrebrock, A. W., Hawkins, T. L., FitzHugh, W., Kusumi, K., Russell, L. B., Mueller, K. L., van Berkel, V., Birren, B. W., Kruglyak, L., and Lander, E. S. (1996). Disruption of the nuclear hormone receptor RORalpha in staggerer mice. Nature 379, 736–739.
Hu, V. W., Frank, B. C., Heine, S., Lee, N. H., and Quackenbush, J. (2006). Gene expression profiling of lymphoblastoid cell lines from monozygotic twins discordant in severity of autism reveals differential regulation of neurologically relevant genes. BMC Genomics 7, 118. doi: 10.1186/1471-2164-7-118
Hu, V. W., Sarachana, T., Kim, K. S., Nguyen, A., Kulkarni, S., Steinberg, M. E., Luu, T., Lai, Y., and Lee, N. H. (2009). Gene expression profiling differentiates autism case-controls and phenotypic variants of autism spectrum disorders: evidence for circadian rhythm dysfunction in severe autism. Autism Res. 2, 78–97.
Huttenlocher, P. R., and Dabholkar, A. S. (1997). Regional differences in synaptogenesis in human cerebral cortex. J. Comp. Neurol. 387, 167–178.
Jarvis, C. I., Goncalves, M. B., Clarke, E., Dogruel, M., Kalindjian, S. B., Thomas, S. A., Maden, M., and Corcoran, J. P. (2010). Retinoic acid receptor-alpha signalling antagonizes both intracellular and extracellular amyloid-beta production and prevents neuronal cell death caused by amyloid-beta. Eur. J. Neurosci. 32, 1246–1255.
Jarvis, C. I., Staels, B., Brugg, B., Lemaigre-Dubreuil, Y., Tedgui, A., and Mariani, J. (2002). Age-related phenotypes in the staggerer mouse expand the RORalpha nuclear receptor’s role beyond the cerebellum. Mol. Cell. Endocrinol. 186, 1–5.
Jones, D. K., Horsfield, M. A., and Simmons, A. (1999). Optimal strategies for measuring diffusion in anisotropic systems by magnetic resonance imaging. Magn. Reson. Med. 42, 515–525.
Jones, K. A., Porjesz, B., Almasy, L., Bierut, L., Goate, A., Wang, J. C., Dick, D. M., Hinrichs, A., Kwon, J., Rice, J. P., Rohrbaugh, J., Stock, H., Wu, W., Bauer, L. O., Chorlian, D. B., Crowe, R. R., Edenberg, H. J., Foroud, T., Hesselbrock, V., Kuperman, S., Nurnberger, J. Jr., O’Connor, S. J., Schuckit, M. A., Stimus, A. T., Tischfield, J. A., Reich, T., and Begleiter, H. (2004). Linkage and linkage disequilibrium of evoked EEG oscillations with CHRM2 receptor gene polymorphisms: implications for human brain dynamics and cognition. Int. J. Psychophysiol. 53, 75–90.
Joshi, A. A., Lepore, N., Joshi, S. H., Lee, A. D., Barysheva, M., Stein, J. L., McMahon, K. L., Johnson, K., de Zubicaray, G. I., Martin, N. G., Wright, M. J., Toga, A. W., and Thompson, P. M. (2011). The contribution of genes to cortical thickness and volume. Neuroreport 22, 101–105.
Kamarajan, C., Porjesz, B., Jones, K., Chorlian, D., Padmanabhapillai, A., Rangaswamy, M., Stimus, A., and Begleiter, H. (2006). Event-related oscillations in offspring of alcoholics: neurocognitive disinhibition as a risk for alcoholism. Biol. Psychiatry 59, 625–634.
Kammerer, C. M., Schneider, J. L., Cole, S. A., Hixson, J. E., Samollow, P. B., O’Connell, J. R., Perez, R., Dyer, T. D., Almasy, L., Blangero, J., Bauer, R. L., and Mitchell, B. D. (2003). Quantitative trait loci on chromosomes 2p, 4p, and 13q influence bone mineral density of the forearm and hip in Mexican Americans. J. Bone Miner. Res. 18, 2245–2252.
Kim, M., Suh, J., Romano, D., Truong, M. H., Mullin, K., Hooli, B., Norton, D., Tesco, G., Elliott, K., Wagner, S. L., Moir, R. D., Becker, K. D., and Tanzi, R. E. (2009). Potential late-onset Alzheimer’s disease-associated mutations in the ADAM10 gene attenuate {alpha}-secretase activity. Hum. Mol. Genet. 18, 3987–3996.
Klein, R. J., Zeiss, C., Chew, E. Y., Tsai, J. Y., Sackler, R. S., Haynes, C., Henning, A. K., SanGiovanni, J. P., Mane, S. M., Mayne, S. T., Bracken, M. B., Ferris, F. L., Ott, J., Barnstable, C., and Hoh, J. (2005). Complement factor H polymorphism in age-related macular degeneration. Science 308, 385–389.
Kochunov, P., and Davis, M. (2009). Development of structural MR brain imaging protocols to study genetics and maturation. Methods 50, 136–146.
Kochunov, P., Glahn, D., Lancaster, J., Wincker, P., Smith, S., Thompson, P., Almasy, L., Duggirala, R., Fox, P., and Blangero, J. (2010a). Genetics of microstructure of cerebral white matter using diffusion tensor imaging. Neuroimage 15, 1109–1116.
Kochunov, P., Williamson, D., Lancaster, J., Fox, P., Cornell, J., Blangero, J., and Glahn, D. (2010b). Fractional anisotropy of water diffusion in cerebral white matter across the lifespan. Neurobiol. Aging. doi: 10.1016/j.neurobiolaging.2010.01.014. [Epub ahead of print].
Kochunov, P., Glahn, D. C., Lancaster, J., Thompson, P. M., Kochunov, V., Rogers, B., Fox, P., Blangero, J., and Williamson, D. E. (2011). Fractional anisotropy of cerebral white matter and thickness of cortical gray matter across the lifespan. Neuroimage 58, 41–49.
Kochunov, P., Lancaster, J. L., Glahn, D. C., Purdy, D., Laird, A. R., Gao, F., and Fox, P. (2006). Retrospective motion correction protocol for high-resolution anatomical MRI. Hum. Brain Mapp. 27, 957–962.
Kochunov, P., Lancaster, J. L., Thompson, P., Woods, R., Mazziotta, J., Hardies, J., and Fox, P. (2001). Regional spatial normalization: toward an optimal target. J. Comput. Assist. Tomogr. 25, 805–816.
Kochunov, P., Mangin, J. F., Coyle, T., Lancaster, J., Thompson, P., Riviére, D., Cointepas, Y., Régis, J., Schlosser, A., Royall, D. R., Zilles, K., Mazziotta, J., Toga, A., and Fox, P. T. (2005). Age-related morphology trends of cortical sulci. Hum. Brain Mapp. 26, 210–220.
Kochunov, P., Thompson, P. M., Coyle, T. R., Lancaster, J. L., Kochunov, V., Royall, D., Mangin, J. F., Riviere, D., and Fox, P. T. (2008). Relationship among neuroimaging indices of cerebral health during normal aging. Hum. Brain Mapp. 29, 36–45.
Kochunov, P., Thompson, P. M., Lancaster, J. L., Bartzokis, G., Smith, S., Coyle, T., Royall, D. R., Laird, A., and Fox, P. T. (2007). Relationship between white matter fractional anisotropy and other indices of cerebral health in normal aging: tract-based spatial statistics study of aging. Neuroimage 35, 478–487.
Koivisto, P. A., Koivisto, H., Haapala, K., and Simola, K. O. (1999). A de novo deletion of chromosome 15(q15.2q21.2) in a dysmorphic, mentally retarded child with congenital scalp defect. Clin. Dysmorphol. 8, 139–141.
Lalani, S. R., Sahoo, T., Sanders, M. E., Peters, S. U., and Bejjani, B. A. (2006). Coarctation of the aorta and mild to moderate developmental delay in a child with a de novo deletion of chromosome 15(q21.1q22.2). BMC Med. Genet. 7, 8. doi: 10.1186/1471-2350-7-8
Lavebratt, C., Sjoholm, L. K., Partonen, T., Schalling, M., and Forsell, Y. (2009). PER2 variantion is associated with depression vulnerability. Am. J. Med. Genet. B Neuropsychiatr. Genet. 153B, 570–581.
Le-Niculescu, H., Patel, S. D., Bhat, M., Kuczenski, R., Faraone, S. V., Tsuang, M. T., McMahon, F. J., Schork, N. J., Nurnberger, J. I. Jr., and Niculescu, A. B. III. (2009). Convergent functional genomics of genome-wide association data for bipolar disorder: comprehensive identification of candidate genes, pathways and mechanisms. Am. J. Med. Genet. B Neuropsychiatr. Genet. 150B, 155–181.
Lerch, J. P., and Evans, A. C. (2005). Cortical thickness analysis examined through power analysis and a population simulation. Neuroimage 24, 163–173.
Machado, I. N., Heinrich, J. K., and Barini, R. (2010). Genomic imbalances detected through array CGH in fetuses with holoprosencephaly. Arq. Neuropsiquiatr. 69, 3–8.
Madler, B., Drabycz, S. A., Kolind, S. H., Whittall, K. P., and MacKay, A. L. (2008). Is diffusion anisotropy an accurate monitor of myelination? Correlation of multicomponent T2 relaxation and diffusion tensor anisotropy in human brain. Magn. Reson. Imaging 26, 874–888.
Mangin, J. F., Riviere, D., Cachia, A., Duchesnay, E., Cointepas, Y., Papadopoulos-Orfanos, D., Collins, D. L., Evans, A. C., and Regis, J. (2004). Object-based morphometry of the cerebral cortex. IEEE Trans. Med. Imaging 23, 968–982.
Marcello, E., Epis, R., Saraceno, C., Gardoni, F., Borroni, B., Cattabeni, F., Padovani, A., and Di Luca, M. (2010). SAP97-mediated local trafficking is altered in Alzheimer disease patients’ hippocampus. Neurobiol. Aging. doi: 10.1016/j.neurobiolaging.2010.09.015.
McGrath, C. L., Glatt, S. J., Sklar, P., Le-Niculescu, H., Kuczenski, R., Doyle, A. E., Biederman, J., Mick, E., Faraone, S. V., Niculescu, A. B., and Tsuang, M. T. (2009). Evidence for genetic association of RORB with bipolar disorder. BMC Psychiatry 9, 70. doi: 10.1186/1471-244X-9-70
Meyer-Lindenberg, A. (2010). Imaging genetics of schizophrenia. Dialogues Clin. Neurosci. 12, 449–456.
Mitchell, B. D., Kammerer, C. M., Blangero, J., Mahaney, M. C., Rainwater, D. L., Dyke, B., Hixson, J. E., Henkel, R. D., Sharp, R. M., Comuzzie, A. G., VandeBerg, J. L., Stern, M. P., and MacCluer, J. W. (1996). Genetic and environmental contributions to cardiovascular risk factors in Mexican Americans. The San Antonio Family Heart Study. Circulation 94, 2159–2170.
Moskvina, V., and Schmidt, K. M. (2008). On multiple-testing correction in genome-wide association studies. Genet. Epidemiol. 32, 567–573.
Neale, B. M., Lasky-Su, J., Anney, R., Franke, B., Zhou, K., Maller, J. B., Vasquez, A. A., Asherson, P., Chen, W., Banaschewski, T., Buitelaar, J., Ebstein, R., Gill, M., Miranda, A., Oades, R. D., Roeyers, H., Rothenberger, A., Sergeant, J., Steinhausen, H. C., Sonuga-Barke, E., Mulas, F., Taylor, E., Laird, N., Lange, C., Daly, M., and Faraone, S. V. (2008). Genome-wide association scan of attention deficit hyperactivity disorder. Am. J. Med. Genet. B Neuropsychiatr. Genet. 147B, 1337–1344.
Nguyen, A., Rauch, T. A., Pfeifer, G. P., and Hu, V. W. (2010). Global methylation profiling of lymphoblastoid cell lines reveals epigenetic contributions to autism spectrum disorders and a novel autism candidate gene, RORA, whose protein product is reduced in autistic brain. FASEB J. 24, 3036–3051.
Olvera, R. L., Bearden, C. E., Velligan, D. I., Almasy, L., Carless, M. A., Curran, J. E., Williamson, D. E., Duggirala, R., Blangero, J., and Glahn, D. C. (2010). Common genetic influences on depression, alcohol, and substance use disorders in Mexican-American families. Am. J. Med. Genet. B Neuropsychiatr. Genet. 156, 561–568.
Salthouse, T. A. (2009). When does age-related cognitive decline begin? Neurobiol. Aging 30, 507–514.
Sarachana, T., Xu, M., Wu, R. C., and Hu, V. W. (2010). Sex hormones in autism: androgens and estrogens differentially and reciprocally Regulate RORA, a novel candidate gene for autism. PLoS ONE 6, e17116. doi: 10.1371/journal.pone.0017116
Schaumberg, D. A., Chasman, D., Morrison, M. A., Adams, S. M., Guo, Q., Hunter, D. J., Hankinson, S. E., and DeAngelis, M. M. (2010). Prospective study of common variants in the retinoic acid receptor-related orphan receptor alpha gene and risk of neovascular age-related macular degeneration. Arch. Ophthalmol. 128, 1462–1471.
Schmitz, S., Cherny, S. S., and Fulker, D. W. (1998). Increase in power through multivariate analyses. Behav. Genet. 28, 357–363.
Schones, D. E., and Zhao, K. (2008). Genome-wide approaches to studying chromatin modifications. Nat. Rev. Genet. 9, 179–191.
Smith, M., Filipek, P. A., Wu, C., Bocian, M., Hakim, S., Modahl, C., and Spence, M. A. (2000). Analysis of a 1-megabase deletion in 15q22-q23 in an autistic patient: identification of candidate genes for autism and of homologous DNA segments in 15q22-q23 and 15q11-q13. Am. J. Med. Genet. 96, 765–770.
Smith, S. M., Jenkinson, M., Johansen-Berg, H., Rueckert, D., Nichols, T. E., Mackay, C. E., Watkins, K. E., Ciccarelli, O., Cader, M. Z., Matthews, P. M., and Behrens, T. E. (2006). Tract-based spatial statistics: voxelwise analysis of multi-subject diffusion data. Neuroimage 31, 1487–1505.
Smith, S. M., Jenkinson, M., Woolrich, M. W., Beckmann, C. F., Behrens, T. E., Johansen-Berg, H., Bannister, P. R., De Luca, M., Drobnjak, I., Flitney, D. E., Niazy, R. K., Saunders, J., Vickers, J., Zhang, Y., De Stefano, N., Brady, J. M., and Matthews, P. M. (2004). Advances in functional and structural MR image analysis and implementation as FSL. Neuroimage 23(Suppl. 1), S208–S219.
Sobel, E., and Lange, K. (1996). Descent graphs in pedigree analysis: applications to haplotyping, location scores, and marker-sharing statistics. Am. J. Hum. Genet. 58, 1323–1337.
Song, S. K., Yoshino, J., Le, T. Q., Lin, S. J., Sun, S. W., Cross, A. H., and Armstrong, R. C. (2005). Demyelination increases radial diffusivity in corpus callosum of mouse brain. Neuroimage 26, 132–140.
Sowell, E. R., Peterson, B. S., Thompson, P. M., Welcome, S. E., Henkenius, A. L., and Toga, A. W. (2003). Mapping cortical change across the human life span. Nat. Neurosci. 6, 309–315.
Stein, J. L., Hua, X., Lee, S., Ho, A. J., Leow, A. D., Toga, A. W., Saykin, A. J., Shen, L., Foroud, T., Pankratz, N., Huentelman, M. J., Craig, D. W., Gerber, J. D., Allen, A. N., Corneveaux, J. J., Dechairo, B. M., Potkin, S. G., Weiner, M. W., and Thompson, P. (2010a). Voxelwise genome-wide association study (vGWAS). Neuroimage 53, 1160–1174.
Stein, J. L., Hua, X., Morra, J. H., Lee, S., Hibar, D. P., Ho, A. J., Leow, A. D., Toga, A. W., Sul, J. H., Kang, H. M., Eskin, E., Saykin, A. J., Shen, L., Foroud, T., Pankratz, N., Huentelman, M. J., Craig, D. W., Gerber, J. D., Allen, A. N., Corneveaux, J. J., Stephan, D. A., Webster, J., DeChairo, B. M., Potkin, S. G., Jack, C. R. Jr., Weiner, M. W., and Thompson, P. M. (2010b). Genome-wide analysis reveals novel genes influencing temporal lobe structure with relevance to neurodegeneration in Alzheimer’s disease. Neuroimage 51, 542–554.
Sugiura, N., Dadashev, V., and Corriveau, R. A. (2004). NARG2 encodes a novel nuclear protein with (S/T)PXX motifs that is expressed during development. Eur. J. Biochem. 271, 4629–4637.
Sugiura, N., Patel, R. G., and Corriveau, R. A. (2001). N-methyl-D-aspartate receptors regulate a group of transiently expressed genes in the developing brain. J. Biol. Chem. 276, 14257–14263.
Terracciano, A., Tanaka, T., Sutin, A. R., Sanna, S., Deiana, B., Lai, S., Uda, M., Schlessinger, D., Abecasis, G. R., Ferrucci, L., and Costa, P. T. Jr. (2010). Genome-wide association scan of trait depression. Biol. Psychiatry 68, 811–817.
Thompson, P. M., Cannon, T. D., Narr, K. L., van Erp, T., Poutanen, V. P., Huttunen, M., Lonnqvist, J., Standertskjold-Nordenstam, C. G., Kaprio, J., Khaledy, M., Dail, R., Zoumalan, C. I., and Toga, A. W. (2001). Genetic influences on brain structure. Nat. Neurosci. 4, 1253–1258.
Wakana, S., Jiang, H., Nagae-Poetscher, L. M., van Zijl, P. C., and Mori, S. (2004). Fiber tract-based atlas of human white matter anatomy. Radiology 230, 77–87.
Walsh, C. A. (2000). Genetics of neuronal migration in the cerebral cortex. Ment. Retard Dev. Disabil. Res. Rev. 6, 34–40.
Wang, C. Y., Zheng, W., Wang, T., Xie, J. W., Wang, S. L., Zhao, B. L., Teng, W. P., and Wang, Z. Y. (2010). Huperzine A activates Wnt/beta-catenin signaling and enhances the nonamyloidogenic pathway in an Alzheimer transgenic mouse model. Neuropsychopharmacology 36, 1073–1089.
Winkler, A. M., Kochunov, P., Blangero, J., Almasy, L., Zilles, K., Fox, P. T., Duggirala, R., and Glahn, D. C. (2010). Cortical thickness or grey matter volume? The importance of selecting the phenotype for imaging genetics studies. Neuroimage 53, 1135–1146.
Keywords: imaging genetics, cortical thickness, WM integrity, genetic correlation, GWAS, QTL, RORA, ADAM10
Citation: Kochunov P, Glahn DC, Nichols TE, Winkler AM, Hong EL, Holcomb HH, Stein JL, Thompson PM, Curran JE, Carless MA, Olvera RL, Johnson MP, Cole SA, Kochunov V, Kent J and Blangero J (2011) Genetic analysis of cortical thickness and fractional anisotropy of water diffusion in the brain. Front. Neurosci. 5:120. doi: 10.3389/fnins.2011.00120
Received: 22 July 2011; Paper pending published: 14 August 2011;
Accepted: 15 September 2011; Published online: 19 October 2011.
Edited by:
Michael F. Miles, Virginia Commonwealth University, USAReviewed by:
Andreas Beyer, Technische Universität Dresden, GermanyKai Wang, University of Southern California, USA
Copyright: © 2011 Kochunov, Glahn, Nichols, Winkler, Hong, Holcomb, Stein, Thompson, Curran, Carless, Olvera, Johnson, Cole, Kochunov, Kent and Blangero. This is an open-access article subject to a non-exclusive license between the authors and Frontiers Media SA, which permits use, distribution and reproduction in other forums, provided the original authors and source are credited and other Frontiers conditions are complied with.
*Correspondence: Peter Kochunov, Dip ABMP, Maryland Psychiatric Research Center, Department of Psychiatry, University of Maryland School of Medicine, 55 Wade Avenue, Catonsville 21228, MD, USA. e-mail:cGtvY2h1bm92QG1wcmMudW1hcnlsYW5kLmVkdQ==