

 Mohamad Bouhamdan1
- 1 Department of Pharmacology, Wayne State University School of Medicine, Detroit, MI, USA
- 2 Department of Pathology, Wayne State University School of Medicine, Detroit, MI, USA
The transcription factor NURR1 plays a pivotal role in the development and maintenance of neurotransmitter phenotype in midbrain dopamine neurons. Conversely, decreased NURR1 expression is associated with a number of dopamine-related CNS disorders, including Parkinson’s disease and drug addiction. In order to better understand the nature of NURR1-responsive genes and their potential roles in dopamine neuron differentiation and survival, we used a human neural cellular background (SK-N-AS cells) in which to generate a number of stable clonal lines with graded NURR1 gene expression that approximated that seen in DA cell-rich human substantia nigra. Gene expression profiling data from these NURR1-expressing clonal lines were validated by quantitative RT-PCR and subjected to bioinformatic analyses. The present study identified a large number of NURR1-responsive genes and demonstrated the potential importance of concentration-dependent NURR1 effects in the differential regulation of distinct NURR1 target genes and biological pathways. These data support the promise of NURR1-based CNS therapeutics for the neuroprotection and/or functional restoration of DA neurons.
Introduction
Nuclear receptor related 1 (NURR1; also known as NR4A2, NOT, TINUR, HZF3, RNR1), together along with NUR77 (NR4A1) and NOR-1 (NR4A3), constitute the NR4A family of orphan nuclear receptors. Depending on the cellular context, these transcriptional regulators may be stably expressed or induced as immediate early genes, leading to pleiotropic physiological effects (Maxwell and Muscat, 2005). NURR1 plays a unique and critical role in the development of the dopaminergic neurotransmitter phenotype in ventral midbrain neurons, as evidenced by the loss of dopamine (DA) phenotypic markers in Nurr1-null mice (Zetterstrom et al., 1997; Castillo et al., 1998; Saucedo-Cardenas et al., 1998). Moreover, continued Nurr1 expression is required for phenotypic maintenance in mature DA neurons (Kadkhodaei et al., 2009). In animal and cellular studies, modest changes in NURR1 levels affect the resilience of DA cells in response to stressors, drugs, and neurotoxins (Le et al., 1999; Eells et al., 2002; Moore et al., 2008). In keeping with these findings from model systems, in human brain decreased NURR1 gene expression is associated with a diminution of DA phenotype during normal aging, as well as in Parkinson’s disease (PD), and chronic drug abuse (Bannon et al., 2002; Chu et al., 2002; Horvath et al., 2007; Le et al., 2008; Sleiman et al., 2009). Despite the recognition of NURR1’s importance, our understanding of the full complement of NURR1-responsive genes and their roles in the differentiation and survival of DA neurons is far from complete.
The identification of genes regulated by NURR1 has come about largely by determining changes in midbrain gene expression occurring in the Nurr1-null mouse or by acute over-expression of NURR1 in various cell lines (Sacchetti et al., 1999, 2001; Iwawaki et al., 2000; Wallen et al., 2001; Hermanson et al., 2003, 2006; Lammi et al., 2004; Davies et al., 2005; Gil et al., 2007; Kitagawa et al., 2007; Luo et al., 2007; Sousa et al., 2007; Volpicelli et al., 2007; Yang and Latchman, 2008; Jacobs et al., 2009a; Galleguillos et al., 2010). Surprisingly, there seems to be quite limited concordance among these datasets, exemplified by a recent study (Jacobs et al., 2009a) in which only one in eight genes differentially expressed in the Nurr1-null midbrain was also affected by transient NURR1 over-expression in a mouse-derived cell model system (with many of the affected transcripts showing similar directionality of change after both the loss of NURR1 and NURR1 over-expression). When considering such discrepancies, one must consider the importance of cellular background (with attendant differences in the expression of transcriptional regulators and other genes). Given the growing appreciation, however, that some transcription factors can exert concentration-dependent effects on gene expression (Johnson et al., 2006; Kamath et al., 2008; Pope and Bresnick, 2010), we hypothesized that the profiles of NURR1-responsive genes could also vary as a function of the NURR1 expression levels in these various model systems.
In order to begin addressing possible concentration-dependent effects of NURR1 on target gene response, and to avoid the confounding issue of cell-to-cell heterogeneity of transgene expression that is seen with transient transfections, we chose a well-characterized human neuronal cell line (SK-N-AS cells) with modest basal expression of NURR1 as the cellular background in which to generate a number of clonal cell lines with stable, graded levels of NURR1 expression. Using gene expression profiling, quantitative RT-PCR, and bioinformatics, we identified distinct concentration-dependent effects of NURR1 on individual target genes and biological pathways. Implications for the therapeutic use of NURR1 in the treatment of CNS disorders related to DA neuron dysfunction are discussed.
Materials and Methods
Derivation of SK-N-AS Clonal Cell Lines and Cell Culture Procedures
The human neuroblastoma cell line SK-N-AS (American Type Tissue Collection, Manassas, VA, USA), was maintained as previously described (Michelhaugh et al., 2005; Wang and Bannon, 2005; Wang et al., 2007). To generate stable clonal cell lines, parental SK-N-AS cells were transfected with 10 μg of a previously described (Michelhaugh et al., 2005) NURR1 expression construct (or corresponding empty vector) using LipofectAMINE2000 (Invitrogen) following the manufacturer’s protocol. Cells expressing transgene (including the neomycin resistance gene) were selected for by treatment with the antibiotic G418 (1 μg/mL), then harvested, and replated at very low density in 96 well plates to allow for subsequent harvest and expansion of single stably transfected cells into distinct clonal cell lines, which were screened for the level of NURR1-encoding transgene expression (independent of transgene copy number or potential integration site). In a separate experiment, the MN9D-derived, dox-inducible, NURR1-expressing cell line MN9D-23 (provided by Dr. Howard J. Federoff, Georgetown, USA) was grown as previously described (Luo et al., 2007) and treated with doxycycline (2 μg/mL; Sigma, USA) for 24 h before harvest. SK-N-AS-derived clonal lines and MN9D cells were assessed for NURR1 expression as described below.
RNA Isolation and QRT-PCR
RNA was isolated using TRIzol reagent (Invitrogen) following the manufacturer’s protocol, then DNAse-treated with the Qiagen RNeasy Minikit (Qiagen, Valencia, CA, USA). Quantification of RNA was accomplished using NanoDrop ND-1000 (Thermo Scientific, Waltham, MA, USA), with an initial assessment of RNA quality by agarose–formaldehyde gel electrophoresis and ethidium bromide staining. RNA (100 ng) from each sample was reverse-transcribed using random hexamers (Promega, Madison, WI, USA) and Omniscript RT kit (Qiagen) following the manufacturer’s protocol. Subsequent PCR reactions used SYBR Green master mix (Qiagen) following the manufacturer’s instructions. Transcript abundance in individual samples was quantified using the StepOne® Real-Time PCR System (Applied Biosystems, Carlsbad, CA, USA) in comparison to a 5 point standard curve generated from pooled sample aliquots. Biological triplicates (the same samples used for microarray analysis described below) were generated for each experimental condition, with each triplicate sample assayed by quantitative real-time PCR (qRT-PCR) in duplicate. PCR primer sequences (represented 5′–3′) used in validation experiments are shown in Table S2 in Supplementary Material. In addition to RNA from cultured cells, initial experiments assayed human substantia nigra RNA for purposes of comparison. To this end, 30 fresh-frozen human midbrains were cryostat-sectioned, slide-mounted, and finely dissected to enrich for substantia nigra DA neurons as compared to surrounding non-DA cell groups. Two independent pools of human RNA were generated by pooling equal RNA aliquots from 15 specimens each (NB: de-identified cadaver specimens were obtained at autopsy and therefore not considered human subjects research or governed by 45 CFR part 46, per SF424 guide Part II: Human Subjects).
Gene Expression Analysis
Microarray assays (using HT-12 BeadChips; Illumina, Inc., San Diego, CA, USA) were performed by the Keck Microarray Resource as part of the NIH Neuroscience Microarray Consortium. Raw and quantile-normalized microarray data and an associated project metadata file are available through the NCBI-GEO repository (GSE33434). The quality and quantity of each RNA sample (aliquots of the same samples used for qRT-PCR experiments described above) was verified using an Agilent Bioanalyzer (Agilent Technologies, Santa Clara, CA, USA) prior to labeling reactions. Biotin-labeled cRNAs were generated using the TotalPrep RNA Amplification kit (Applied Biosystems) with 500 ng total RNA as template. Each sample was labeled in an independent reaction, with n = 3 biological replicates for each cell line. Microarray controls included control RNAs spiked into RT reactions, as well as spiked-in cRNAs that matched or mismatched with BeadChips oligos. Labeled cRNAs were hybridized according to the manufacturer’s protocol and scanned on the Illumina iScan. Initial Consortium data analysis included quantile normalization, carried out in Illumina BeadStudio.
Statistical and Bioinformatic Analyses
Normalized array data for biological triplicates (see above) was imported into MultiExperiment Viewer (MeV)1 and samples hierarchically clustered by Pearson correlation to investigate replicate similarity and identify any potential outliers. Biological triplicates of each clonal line were found to be more closely correlated with each other than with triplicates from the other clonal lines (Figure A2 in Appendix), establishing a high degree of reproducibility in the profiles of gene expression among samples from the same clonal line; all microarray data were thus included in all subsequent analyses. A one-way ANOVA of the normalized array data was carried out (in MeV) for all transcripts exhibiting at least a 20% change in the E and/or G clonal lines relative to the C line [NB: in our validation experiments, we were able to validate changes <20% (see Figure 3; Table S1 in Supplementary Material)]. After a Benjamini–Hochberg multiple testing correction, we identified ~6100 transcripts exhibiting significant differences (corrected p ≤ 0.05) as a function of NURR1 expression (Table S1 in Supplementary Material). This list of transcripts was imported into Microsoft Excel and further classified based on their response profile across clonal lines (Figure 2). A subset of transcripts most robustly affected by NURR1 over-expression (i.e., those transcripts exhibiting at least a twofold increase/decrease in clonal lines E or G relative to C) was hierarchically clustered by Pearson correlation (in MeV) to identify subsets of coordinately regulated transcripts (Figure 4). The resulting transcript clusters were imported into Genomatix Software Suite (v2.1)2 and analyzed in the Pathway System (GePS) module to detect significantly enriched gene ontology (GO) biological processes (p ≤ 0.01, see Figure 4). In addition, the list of NURR1-responsive transcripts in the clonal cell lines (Table S1 in Supplementary Material) was compared with those transcripts co-varying with NURR1 gene expression in human substantia nigra (as determined by Pavlidis template matching to NURR1 transcript abundance across subjects in MeV (at the p < 0.05 level). The enrichment for GO terms (p < 0.01) in the resulting set of 897 overlapping probes (determined in Genomatix) is shown in Table S3 in Supplementary Material.
Results
Generation and Characterization of a Model System for Studying NURR1-Mediated Effects
In order to facilitate our investigation into the profile of NURR1-responsive transcripts as well as the possible concentration-dependent effects of NURR1, we generated stable SK-N-AS-derived clonal cell lines with different levels of NURR1 gene expression in an otherwise identical cellular background (Figure 1). A clonal line derived using empty expression vector (designated C cells) exhibited low basal levels of NURR1 gene expression (Figure 1), as previously reported for parental SK-N-AS cells (Michelhaugh et al., 2005; Wang and Bannon, 2005; Wang et al., 2007). Statistically significant increases in NURR1 gene expression were evident in clonal lines with NURR1-encoding transgene (designated E and G cells; Figure1) accompanied, as expected, by increases in nuclear levels of NURR1 protein (Figure A1 in Appendix). To provide a physiological context for the level of NURR1 gene expression, SK-N-AS clonal lines were compared with samples of human substantia nigra (a brain region highly enriched in NURR1-expressing DA neurons) as well as a mouse neural cell line commonly used to study NURR1 effects (i.e., MN9D cells with a doxycycline-induced Nurr1 transgene; Luo et al., 2007). As shown in Figure 1, NURR1 gene expression in the E and G clonal lines bracketed that seen in human substantia nigra, whereas its expression in doxycycline-treated MN9D cells was actually several orders of magnitude higher than that seen in brain tissue. These data suggest that profiling the differences in gene expression across these C, E, and G clonal lines might provide a more relevant model of NURR1-dependent changes in gene expression occurring in the human brain during DA cell development and DA-related disease states.
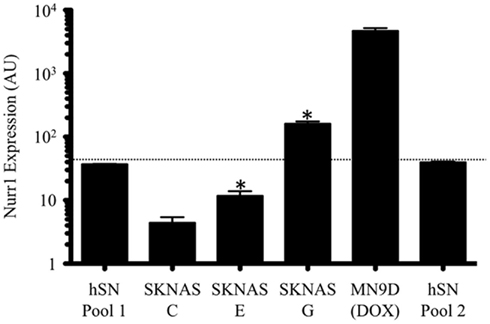
Figure 1. Generation of neural cell lines with graded expression of the transcription factor NURR1. NURR1 gene expression in SK-N-AS-derived clonal lines E and G bracketed that seen in human substantia nigra, whereas acute NURR1 induction in the MN9D cell model was several orders of magnitude higher than seen in human tissue. Bars are the means (±SD) of biological triplicates (C, E, G cells) or single samples (MN9D and human SN pools) measured by qRT-PCR in duplicate. The two human SN pools were comprised of 15 independent specimens each. Note that data are plotted on a log scale. *Indicates significant difference in NURR1 expression compared to control (C cells; one-tailed t-test, p ≤ 0.003).
NURR1-Responsive Transcripts Exhibit Differences in Concentration-Dependence and Directionality of Change
We identified by microarray analysis >6000 transcripts (corresponding to ~5000 genes) whose abundance differed significantly (one-way ANOVA; corrected p ≤ 0.05) in response to increasing NURR1 expression. A complete list of these differentially expressed transcripts (and corresponding fold changes) is provided in Table S1 in Supplementary Material. As summarized in Figure 2, NURR1-induced similar magnitude increases and decreases in equivalent numbers of transcripts (compare Figures 2A,B). It was noteworthy, however, that for many transcripts, the effects of NURR1 actually varied as a function of its concentration; for example, one-fifth of NURR1-responsive transcripts showed bidirectional changes with increasing NURR1 expression (Table S1 in Supplementary Material). Overall, these data strongly suggest that NURR1 exerts previously unrecognized concentration-dependent effects.
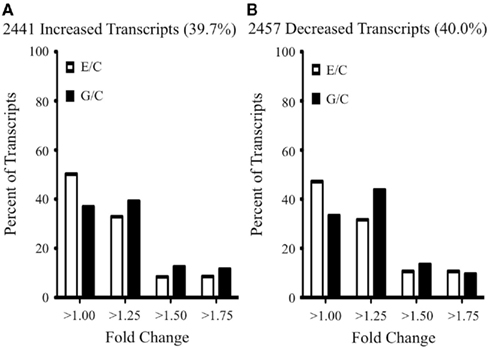
Figure 2. Summary of NURR1 effects on profiles of gene expression. The abundances of >6000 transcripts were significantly altered as a function of increasing NURR1 concentrations across SK-N-AS-derived clonal lines (i.e., C → E → G lines). Transcripts exhibiting a unidirectional response to increasing NURR1 [i.e., increased in E and G (A) or decreased in E and G (B), relative to C] are characterized by distributions of effect sizes (fold-change plotted on x axis, percent of transcripts with corresponding change plotted on y axis). Not shown are the one-fifth of NURR1-responsive transcripts that exhibited bidirectional changes with increasing nurr1 expression (i.e., different directions of change in E and G, relative to C; see Table S1 in Supplementary Material for supporting expression data).
We validated these microarray findings using qRT-PCR. For every transcript that was examined in this manner, qRT-PCR data were significantly correlated with the corresponding microarray data (Figure 3). This was the case irrespective of whether a given transcript was a well-established NURR1 target [e.g., solute carrier family 6 member 3 (SLC6A3; aka DAT1), dopa decarboxylase (DDC), alpha-synuclein (SNCA), or vasoactive intestinal polypeptide (VIP)], a suspected but less well-characterized NURR1 target [e.g., carboxypeptidase E (CPE)], or a new NURR1 target as identified in this study [e.g., apolipoprotein E (APOE), CCAT/enhancer protein beta (CEBPB), chemokine (C-X-C motif) ligand 12 (CXCL12), or early growth response protein 1 (EGR1); see Figure 3]. Importantly, changes in transcript abundance were validated whether unidirectional (APOE, CPE, DDC, EGR1, SLC6A3, SNCA) or bi-directional (CEBPB, CXCL12, VIP) as a function of NURR1 concentration, spanning magnitudes of change ranging from <20% to >10-fold differences (Figure 3). These qRT-PCR data strongly support the validity of the larger microarray dataset (Table S1 in Supplementary Material).
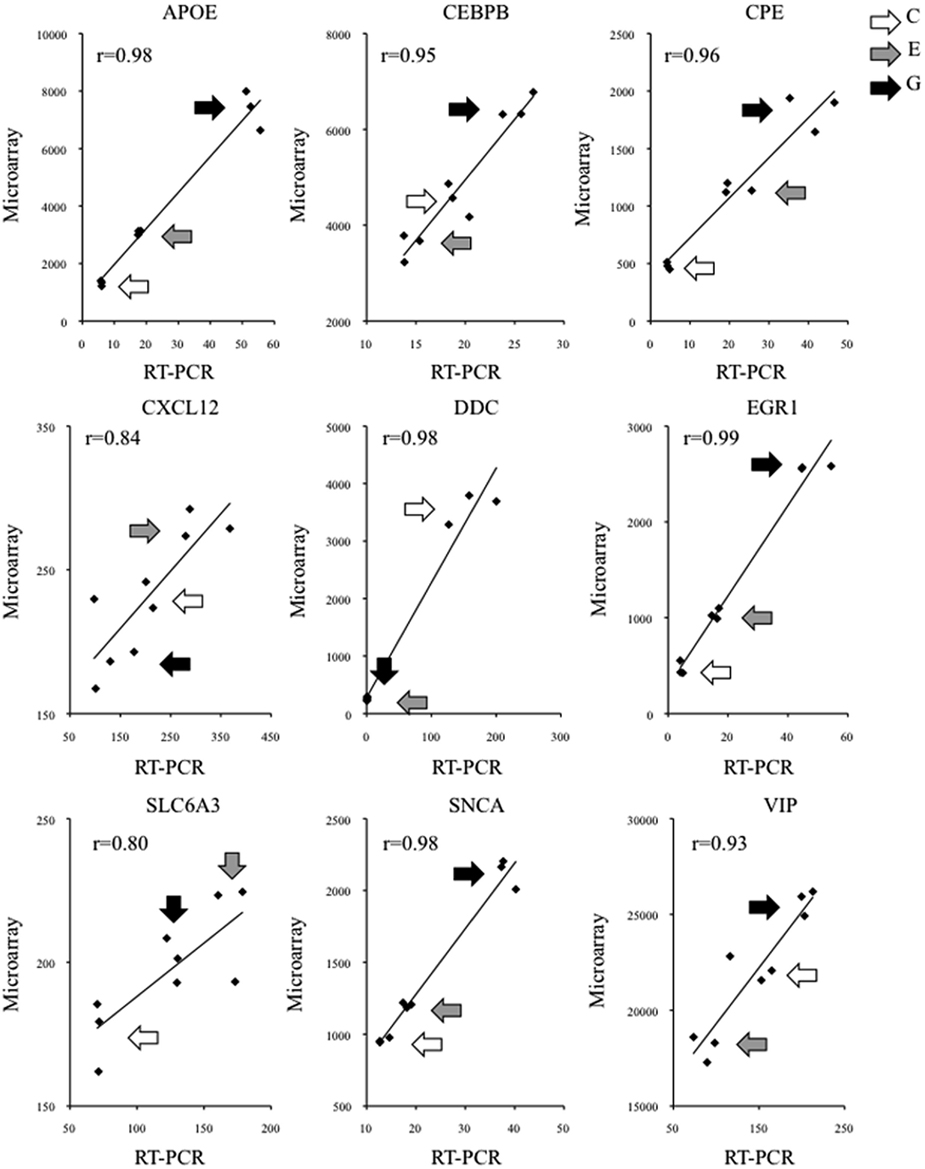
Figure 3. Validation of individual NURR1 target genes identified by microarray. The abundance of representative NURR1-responsive transcripts was determined by qRT-PCR. In each case examined, transcript abundance across clonal cell lines was significantly correlated with the corresponding microarray data, irrespective of the magnitude or direction of NURR1-responsiveness, or whether the transcript was a previously known or novel NURR1 target. Data from triplicate samples used in microarray and qRT-PCR assays are shown (microarray intensity values on y axis, qRT-PCR data reported on x axis in arbitrary units). For each transcript, corresponding Pearson r values are indicated; data were significantly correlated (one-tailed p ≤ 0.005). Different shaded arrows indicate biological triplicates of the clonal lines (C, E, or G) from which samples were derived. Primer sequences are provided in Table S2 in Supplementary Material.
Table 1 (left-hand column) lists NURR1-responsive genes found in our gene profiling dataset (Table S1 in Supplementary Material) that have been previously characterized as NURR1 targets based on some combination of experimental approaches (including NURR1 over-expression, Nurr1 gene knockout, ChIP-on-chip, and/or promoter analysis). Also indicated (in the center and right-hand columns) are NURR1-responsive genes seen in our profiling dataset that had been previously suggested as possible NURR1 targets based on more limited evidence (i.e., solely on differential expression in the Nurr1 knockout mouse or NURR1 ChIP-on-chip data; Table 1; Sacchetti et al., 1999, 2001; Iwawaki et al., 2000; Wallen et al., 2001; Hermanson et al., 2003, 2006; Lammi et al., 2004; Davies et al., 2005; Gil et al., 2007; Kitagawa et al., 2007; Luo et al., 2007; Sousa et al., 2007; Volpicelli et al., 2007; Yang and Latchman, 2008; Jacobs et al., 2009a; Galleguillos et al., 2010). The magnitude and directionality of NURR1-responsiveness we observed in these latter groups was the same as that seen for more well-documented NURR1 targets, providing confirmatory biological evidence in support of their inclusion as members of an expanded list of NURR1-responsive genes.
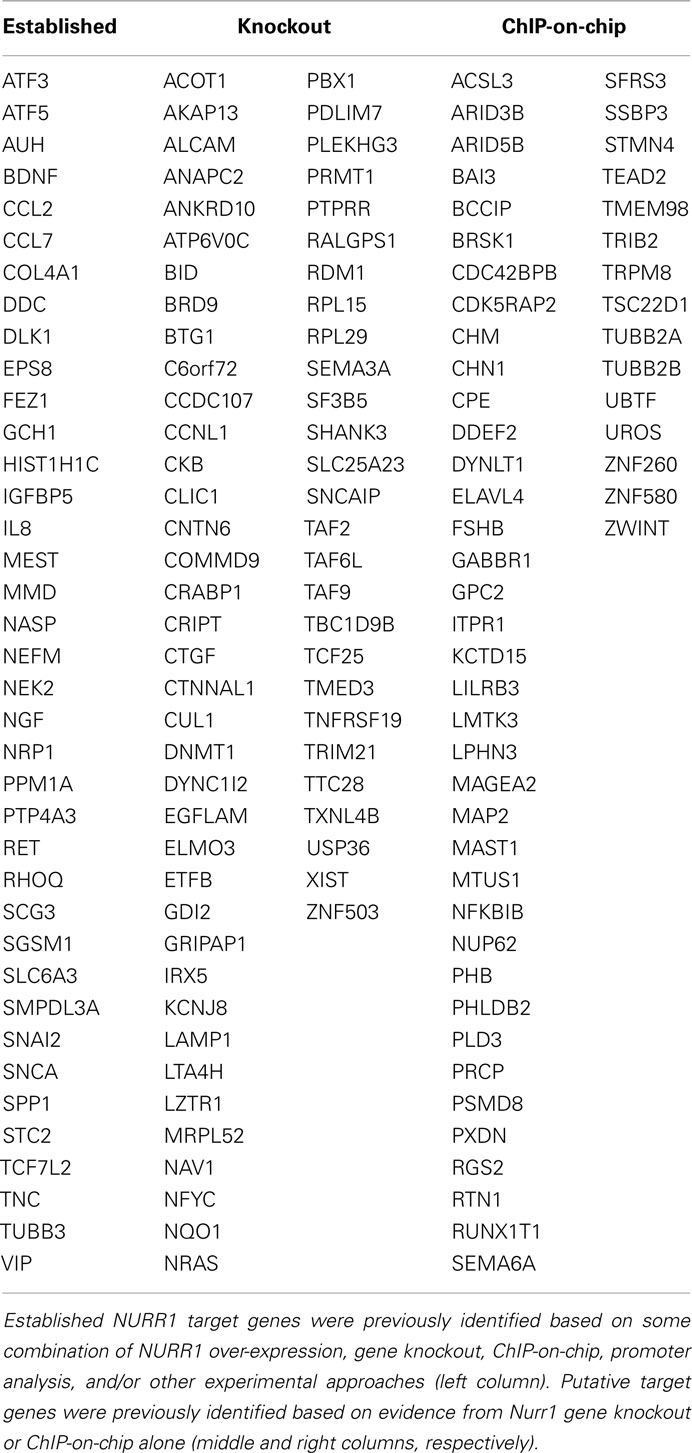
Table 1. Known and putative NURR1 target genes showing NURR1-dependent differential expression in clonal cells.
Relationships among the Most Robustly Affected NURR1 Targets
Given the number of NURR1-responsive transcripts identified in Table S1 in Supplementary Material, this list most likely encompasses both many direct targets of NURR1 as well as genes lying downstream of NURR1 action. In order to focus on those more likely to be direct NURR1 targets, we narrowed our subsequent investigation to the subset of transcripts most robustly affected by NURR1 over-expression. In this instance, we selected the ~1700 transcripts (representing ~1400 genes) from our larger dataset (Table S1 in Supplementary Material) that exhibited at least a twofold difference in abundance in either the E or G cells (relative to C). To identify potential relationships among NURR1-responsive genes and the potential significance of different patterns of NURR1-responsiveness, we hierarchically clustered this subset of transcripts by Pearson correlation, identifying groups showing similar expression patterns across clonal cell lines. We found that these most highly NURR1-responsive transcripts fell into five broad clusters, for which the direction and magnitude of change in abundance is indicated in Figure 4 (left-hand portion). The biological processes and some of the transcripts represented in these clusters are described below.
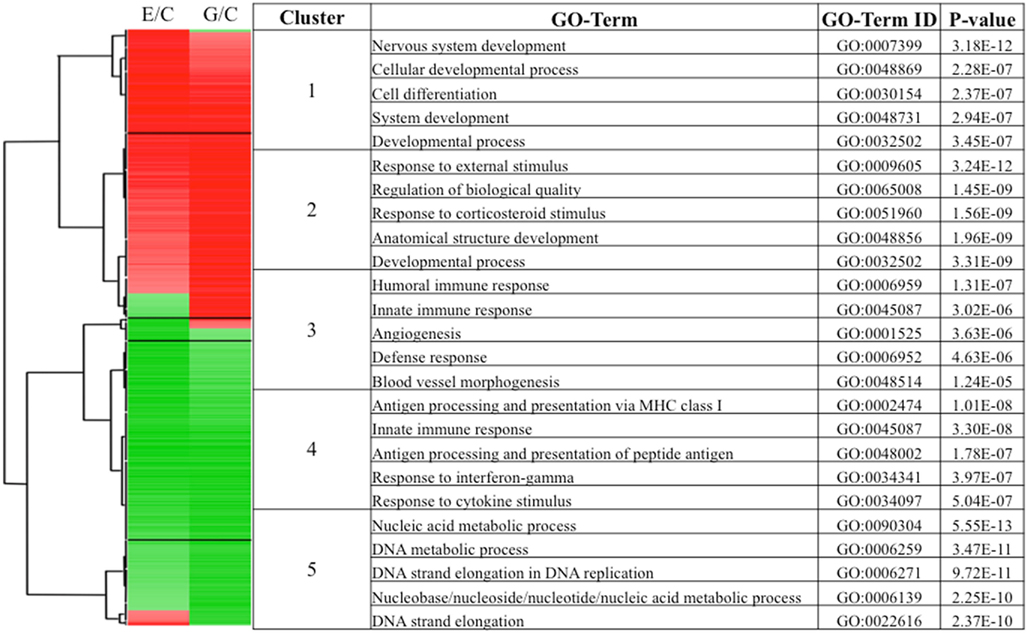
Figure 4. Hierarchical clustering of the most robustly affected NURR1-responsive transcripts identified clusters with distinct concentration-dependence and biological processes. Transcripts included in this clustering were increased or decreased at least twofold in either the E or G cell line (relative to C, ~1700 transcripts). The resulting five distinct clusters are indicated, with the direction (red, increased; green, decreased) and magnitude of change (color intensity) indicated (left-hand portion). The top biological processes most enriched in each of the five clusters (along with corresponding GO ID terms and p values) are presented (right-hand portion).
Cluster 1 (Figure 4) consists of transcripts maximally or near-maximally induced by moderate changes in NURR1 (i.e., C line → E line). More robust NURR1 gene expression (e.g., seen in the G line) induced no further (or only incremental) increases in target gene expression (or in a few cases, actual decreases). GO analysis indicated that the biological processes most enriched in this transcript cluster are related to nervous system development (Figure 4, right side). Some examples of these highly NURR1-responsive transcripts include collapsing response mediator 1 (CRMP1; a neuronal-specific regulator of sema 3A signaling in growth cones), kinesin family member 1A (KIF1A; involved in axonal transport of synaptic vesicles), tubulin 2beta and 2alpha (TUBB2B and TUBB2A; major microtubule components involved in neuronal migration and vesicle movement), embryonic lethal, abnormal vision, Drosophila-like 3 and trinucleotide repeat containing 4 (ELAVL3 and TNRC4; neuron-specific RNA-binding proteins) and BR serine/threonine kinase 1 (BRSK1; a protein kinase critical for development of neuronal polarization).
Cluster 2 (Figure 4) consists primarily of transcripts best characterized by their prominent induction in response to only higher NURR1 expression (i.e., G line). The transcripts most enriched in this cluster Figure in rather broad biological processes, including responses to external stimuli, and the regulation of cell development and localization. Included within the cluster are many transcription factors, including immediate early genes [e.g., EGR1, FBJ murine osteosarcoma viral oncogene homolog (FOS), jun proto-oncogene (JUN)], developmental transcription factors [e.g., gastrulation brain homeobox 2 (GBX2), LIM homeobox 8 (LHX8), homeobox C8 (HOXC8), neurogenin 2 (NEUROG2)], and other classes of transcription factors [e.g., cAMP response element binding protein 5 (CREB5), CEBP delta (CEBPD)]. These NURR1-induced transcription factors may, in turn, contribute to activation of biological processes linked to this cluster. A distinct subgroup of transcripts within cluster 2 were unchanged or decreased somewhat in abundance by moderate NURR1 levels (e.g., E cells), but robustly induced with greater NURR1 concentrations (Figure 4). A number of these transcripts [e.g., interleukin 1beta (IL1B), leukemia inhibitory factor (LIF), tumor necrosis factor alpha-induced protein 6 (TNFAIP6), chemokine (C-C motif) ligand 7 (CCL7), interleukin 8 (IL8), prostaglandin-endoperoxide synthase 2 (PTGS2), matrix metalloproteinase 9 (MMP9)] encode prototypical pro-inflammatory proteins; many of these, however, exert context-dependent effects on neuronal development, migration, plasticity, or survival as well (Boulanger, 2009; Deverman and Patterson, 2009).
Cluster 3 (Figure 4) consists of a small but interesting group of transcripts robustly decreased in response to even modest increases in NURR1 (C → E), but which rebounded to near-control levels of abundance in the presence of higher NURR1 concentrations (i.e., G cells). The biological processes represented in this cluster are related to immune response [e.g., chemokine (C-C motif) ligand 2 (CCL2), complement component 3 (C3), complement component 1 r-subcomponent-like (C1RL), interleukin 32 (IL32), serum amyloid A1 (SAA1)] and, to a lesser extent, angiogenesis. Cluster 4 (Figure 4) consists of a larger group of transcripts decreased in abundance following all increases in NURR1 concentration examined (i.e., C → E, G). Biological processes related to antigen processing/presentation and immune response are very highly enriched in this cluster, including transporter 1, ATP-binding cassette, subfamily B (TAP)-related transcripts (TAP1, TAP2, TAPBP, TAPBPL), human leukocyte antigen (HLA)-related transcripts (HLA-A, HLA-A29. 1, HLA-B, HLA-F, HLA-H), nuclear factor kappa B (NFKB)-related transcripts (NFKB1, NFKBIA), TNF-related transcripts (TNF, TNFIP1, TNFRSF4), peroxisome proliferator-activated receptor gamma (PPARG), and complement component 7 (C7), among others.
Cluster 5 (Figure 4) consists of transcripts slightly decreased (or less frequently, slightly increased) in abundance by moderate increases in NURR1, but substantially reduced at higher NURR1 concentrations (e.g., C line → G line). The most highly enriched biological categories relate to nucleic acid metabolic processes, DNA replication, and cell cycle; some specific transcripts include minichromosome maintenance complex component (MCM)-related transcripts (MCM4, MCM5, MCM6, MCM7, MCM10), heterogeneous nuclear ribonucleoprotein (HNRNP)-related transcripts (HNRNPA1, HNRPH1, HNRPK, HNRPM), and cell division cycle (CDC)-related transcripts (CDC14B, CDC45L, CDCA7). Overall, hierarchical clustering and GO analyses revealed that groups of transcripts that clustered together based on their concentration-dependent responses to NURR1 appear to subserve quite distinct biological processes.
Discussion
For our investigation into the nature of NURR1-responsive genes, we generated stable clonal cells lines with graded NURR1 expression that approximated that seen in human substantia nigra (i.e., E and G lines; Figure 1). Hierarchical clustering of gene expression data from biological triplicates of these clonal lines (and an additional, independent NURR1-expressing clonal line) confirmed that the changes in NURR1 abundance per se largely accounted for the observed differences in gene expression profiles (Figure A2 in Appendix). Examining the different profiles of gene expression seen with increasing NURR1 concentration (i.e., C → E, G) provides a new cellular model of NURR1-related changes similar to those occurring during DA cell development; conversely, gene expression changes seen with decreasing NURR1 (i.e., G, E → C) may model some of the changes seen during the course of DA-related neurodegenerative disease states, particularly those involving loss of NURR1 expression (e.g., PD and drug abuse). In this regard, it may be worth noting that, although there are important differences between our SK-N-AS-derived clonal lines and authentic DA neurons, the biological processes most affected (i.e., GO terms most enriched) in our clonal cells as a function of NURR1 expression (Figure 4) are similar to the GO terms best describing human substantia nigra transcripts that co-vary with NURR1 gene expression (Table S3 in Supplementary Material).
A central finding of the present study was that NURR1 effects are concentration- and gene-dependent: different patterns of increased or decreased transcript abundance (and even some bidirectional changes) were seen as a function of NURR1 concentration (Figures 2–4; Table S1 in Supplementary Material). Our data indicate that conflicting reports in the literature regarding the NURR1-responsiveness of individual genes may well reflect heretofore unappreciated differences in the magnitude of NURR1 induction obtained in various model systems. In a similar vein, the recent observation (Jacobs et al., 2009a) that numerous transcripts were similarly changed by the complete loss of NURR1 and NURR1 over-expression seems consistent with our finding that some transcripts respond to NURR1 in a bidirectional manner. The fact that our microarray findings were validated by qRT-PCR irrespective of the direction or magnitude of change (Figure 3) supports the overarching conclusion that NURR1 exerts gene-specific, concentration-dependent (and sometimes bi-directional) effects.
Although this is the first report of concentration-dependent responses to NURR1, a similar phenomenon has been reported for the hematopoietic transcription factors GATA-1 and Pu.1, where the responsiveness of target genes is thought to be linked to variations in response element sequences or location and/or by interactions with multiple co-regulators (Johnson et al., 2006; Kamath et al., 2008; Pope and Bresnick, 2010). In this regard, it is interesting to note that, in addition to its well-established role in neurogenesis, NURR1 has recently been implicated in control of hematopoietic stem cell proliferation (Sirin et al., 2010). Although it is well-known that NURR1 (and family members NUR77 and NOR-1) can regulate target gene expression through binding as a monomer, homodimer, or heterodimer to a number of related cis-elements (Maxwell and Muscat, 2005), we were unable to identify consistent differences in the nature, frequency or location of cis-elements that predicted the observed magnitude or pattern of NURR1 response of previously known or newly identified NURR1-responsive genes (not shown). On the other hand, there is a nascent appreciation that NURR1 also interacts with a number of distinct co-regulators (Mulholland et al., 2005; Sacchetti et al., 2006; Carpentier et al., 2008; Jacobs et al., 2009b); the role of these different co-regulators in NURR1’s pleiotropic, concentration-dependent effects thus warrants further investigation.
In the current experiments, we observed that even modest increases in NURR1 abundance resulted in increased expression of transcripts related to NURR1’s well-appreciated role in DA neuron development and maintenance (Figure 4; cluster 1 and, to a lesser extent, cluster 2). A correlate of the apparent commitment toward neurogenesis was a NURR1-induced, concentration-dependent decrease in the expression of genes involved in processes related to cell division (Figure 4; cluster 5), resulting in a lengthening of cell doubling times with increasing NURR1 levels (i.e., C line: 24 h; E line: 58 h; G line 72 h doubling times, respectively); similar findings have been previously described in a neural stem cell context (Sousa et al., 2007). On the other hand, a strong but more complex concentration-dependent effect of NURR1 was observed for numerous immune-related transcripts, in that modest increases in NURR1 significantly reduced their expression levels, whereas further increases in NURR1 resulted in lesser decreases (or in some cases, clear increases) in gene expression (Figure 4; clusters 3, 4 and a subgroup of cluster 2). This is particularly interesting given that NURR1 has been implicated as a mediator of immune/pro-inflammatory processes in some peripheral tissues and animal models of multiple sclerosis (McEvoy et al., 2002; Davies et al., 2005; Doi et al., 2008), whereas NURR1 exerts anti-inflammatory effects in other peripheral tissues (Bonta et al., 2007) and neuroprotective effects on DA cells in inflammatory models of PD (Saijo et al., 2009). Although some NURR1-induced “pro-inflammatory” proteins can, under certain conditions, mediate additional non-inflammatory effects (e.g., neuronal migration, differentiation or neuroprotection; Carvey et al., 2001; Littlejohn et al., 2011), our data are also consistent with the notion that increasing NURR1 concentrations could, in some instances, tip the scales from anti-inflammatory to pro-inflammatory cellular effects. Our working hypothesis is that high levels of NURR1 are associated with its role as a stimulus-induced immediate early gene which, while physiologically adaptive in the short-run, could mediate detrimental biological processes (e.g., chronic inflammation, immune response, apoptosis) over extended periods of time. On the other hand, modest levels of NURR1 may be all that is needed to facilitate neurogenesis, inhibit cell cycle progression, stabilize neural phenotype, and dampen immune and pro-inflammatory processes.
Our results show that, beyond its previously described effects on a few known DA phenotypic genes, NURR1 can significantly affect the expression of many other neural genes, some implicated in the function (or dysfunction) of DA neurons (see Figure 5; supportive expression data found in Figure 3; Table S1 in Supplementary Material). For example, NURR1 induces expression of numerous transcription factors and their co-regulators, including TCF7L2, a known NURR1 target and Wnt signal transducer involved in DA cell development (Jacobs et al., 2009a) and EGR1, which increases DA synthesis (Papanikolaou and Sabban, 2000). NURR1 also induced both CREB5 and CREBBP (CBP), thus constituting a feed-forward system, given that NURR1 is itself a highly CREB-responsive gene (Volakakis et al., 2010). We also found that NURR1 regulates numerous genes encoding neuron-specific RNA-binding proteins including ELAVL4, a gene consistently associated with risk of PD (Noureddine et al., 2005; DeStefano et al., 2008). NURR1 regulates numerous genes involved in dendritic, axonal, vesicular, and exocytotic functions including SEMA3A, which is critical to the navigation of DA axons (Hernandez-Montiel et al., 2008; Torre et al., 2010), and KIF1A, a motor protein whose altered abundance precedes DA axon neuropathy and DA cell loss in a mutant SNCA model of PD (Chung et al., 2009). In addition, NURR1 regulates numerous DA cell trophic factors, including GDF15, which rescues DA cell functioning in a model of PD (Strelau et al., 2000). NURR1 also regulates the CXCL12–CXCR4 signaling pathway, which modulates DA cell activity and cocaine-induced (i.e., DA-mediated) behavior, and whose robust expression in DA cells is altered in both a model of PD and clinical PD (Guyon et al., 2008; Shimoji et al., 2009; Trecki and Unterwald, 2009). We report for the first time that NURR1 robustly induces expression of APOE, for which the ∊4 variant is associated with the risk of both Alzheimer’s disease and loss of brain DA (Camicioli et al., 1999). We also note that nurr1 co-regulates SLC6A3 (encoding the DA transporter) as well as the DA transporter-binding proteins (Sidhu et al., 2004; Zhang et al., 2009) SNCA and CPE; the former two genes having established associations with PD, drug abuse, and other neurological disorders (Bannon, 2005; Venda et al., 2010). In summary, these data support the promise of NURR1-based CNS therapeutics for the functional restoration and neuroprotection of DA neurons, particularly if therapeutic strategies can encompass the ongoing advances in cell-specific targeting to DA neurons (Gonzalez-Barrios et al., 2006).
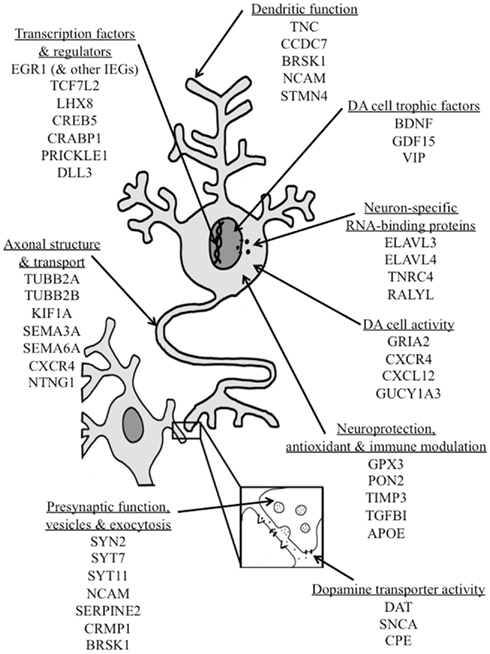
Figure 5. Schematic representation of multiple sites of action through which NURR1 regulation of gene expression may contribute to DA cell development, phenotypic stability, neuroprotection or functional recovery. Some specific genes robustly regulated by NURR1 are grouped according to their primary biological processes; many are known to modulate DA neuronal activity and/or have been associated with DA-related diseases such as Parkinson’s disease or drug abuse. Abbreviations for gene names are indicated in the text and supportive gene expression data are provided in Table S1 in Supplementary Material.
Conflict of Interest Statement
The authors declare that the research was conducted in the absence of any commercial or financial relationships that could be construed as a potential conflict of interest.
Acknowledgments
This work was supported by NIDA grant DA006470 to Michael J. Bannon. The authors thank Drs. Gregory Kapatos and Rodrigo Andrade for their insightful comments during data analysis and the preparation of this manuscript.
Supplementary Material
The Supplementary Material for this article can be found online at http://www.frontiersin.org/neurogenomics/10.3389/fnins.2011.00135/abstract
Table S1| Comprehensive list of NURR1-responsive transcripts as identified by graded NURR1 over-expression in SK-N-AS clonal cell lines.
Table S2| Primer sequences used for qRT-PCR experiments.
Table S3| Human confirmation of NURR1-regulated biological processes identified in SK-N-AS clonal cell lines.
Footnotes
References
Bannon, M. J. (2005). The dopamine transporter: role in neurotoxicity and human disease. Toxicol. Appl. Pharmacol. 204, 355–360.
Bannon, M. J., Pruetz, B., Manning-Bog, A. B., Whitty, C. J., Michelhaugh, S. K., Sacchetti, P., Granneman, J. G., Mash, D. C., and Schmidt, C. J. (2002). Decreased expression of the transcription factor NURR1 in dopamine neurons of cocaine abusers. Proc. Natl. Acad. Sci. U.S.A. 99, 6382–6385.
Bonta, P. I., Pols, T. W., and dr Vries, C. J. (2007). NR4A nuclear receptors in atherosclerosis and vein-graft disease. Trends Cardiovasc. Med. 17, 105–111.
Boulanger, L. M. (2009). Immune protein in brain development and synaptic plasticity. Neuron 64, 93–109.
Camicioli, R., Kaye, J., Payami, H., Ball, M. J., and Murdoch, G. (1999). Apolipoprotein E epsilon4 is associated with neuronal loss in the substantia nigra in Alzheimer’s disease. Dement. Geriatr. Cogn. Disord. 10, 437–441.
Carpentier, R., Sacchetti, P., Segard, P., Staels, B., and Lefebvre, P. (2008). The glucocorticoid receptor is a co-regulator of the orphan nuclear receptor Nurr1. J. Neurochem. 104, 777–789.
Carvey, P. M., Ling, Z. D., Sortwell, C. E., Pitzer, M. R., McGuire, S. O., Storch, A., and Collier, T. J. (2001). A clonal line of mesencephalic progenitor cells converted to dopamine neurons by hematopoietic cytokines: a source of cells for transplantation in Parkinson’s disease. Exp. Neurol. 171, 98–108.
Castillo, S. O., Baffi, J. S., Palkovits, M., Goldstein, D. S., Kopin, I. J., Witta, J., Magnuson, M. A., and Nikodem, V. M. (1998). Dopamine biosynthesis is selectively abolished in substantia nigra/ventral tegmental area but not in hypothalamic neurons in mice with targeted disruption of the Nurr1 gene. Mol. Cell. Neurosci. 11, 36–46.
Chu, Y., Kompoliti, K., Cochran, E. J., Mufson, E. J., and Kordower, J. H. (2002). Age-related decreases in Nurr1 immunoreactivity in the human substantia nigra. J. Comp. Neurol. 450, 203–214.
Chung, C. Y., Koprich, J. B., Siddiqi, H., and Isacson, O. (2009). Dynamic changes in presynaptic and axonal transport proteins combined with striatal neuroinflammation precede dopaminergic neuronal loss in a rat model of AAV alpha-synucleinopathy. J. Neurosci. 29, 3365–3373.
Davies, M. R., Harding, C. J., Raines, S., Tolley, K., Parker, A. E., Downey-Jones, M., and Needham, M. R. (2005). Nurr1 dependent regulation of pro-inflammatory mediators in immortalised synovial fibroblasts. J. Inflamm. (Lond). 2, 15.
DeStefano, A. L., Latourelle, J., Lew, M. F., Suchowersky, O., Klein, C., Golbe, L. I., Mark, M. H., Growdon, J. H., Wooten, G. F., Watts, R., Guttman, M., Racette, B. A., Perlmutter, J. S., Marlor, L., Shill, H. A., Singer, C., Goldwurm, S., Pezzoli, G., Saint-Hilaire, M. H., Hendricks, A. E., Gower, A., Williamson, S., Nagle, M. W., Wilk, J. B., Massood, T., Huskey, K. W., Baker, K. B., Itin, I., Litvan, I., Nicholson, G., Corbett, A., Nance, M., Drasby, E., Isaacson, S., Burn, D. J., Chinnery, P. F., Pramstaller, P. P., Al-Hinti, J., Moller, A. T., Ostergaard, K., Sherman, S. J., Roxburgh, R., Snow, B., Slevin, J. T., Cambi, F., Gusella, J. F., and Myers, R. H. (2008). Replication of association between ELAVL4 and Parkinson disease: the GenePD study. Hum. Genet. 124, 95–99.
Doi, Y., Oki, S., Ozawa, T., Hohjoh, H., Miyake, S., and Yamamura, T. (2008). Orphan nuclear receptor NR4A2 expressed in T cells from multiple sclerosis mediates production of inflammatory cytokines. Proc. Natl. Acad. Sci. U.S.A. 105, 8381–8386.
Eells, J. B., Lipska, B. K., Yeung, S. K., Misler, J. A., and Nikodem, V. M. (2002). Nurr1-null heterozygous mice have reduced mesolimbic and mesocortical dopamine levels and increased stress-induced locomotor activity. Behav. Brain Res. 136, 267–275.
Galleguillos, D., Fuentealba, J. A., Gomez, L. M., Saver, M., Gomez, A., Nash, K., Burger, C., Gysling, K., and Andres, M. E. (2010). Nurr1 regulates RET expression in dopamine neurons of adult rat midbrain. J. Neurochem. 114, 1158–1167.
Gil, M., McKinney, C., Lee, M. K., Eells, J. B., Phyillaier, M. A., and Nikodem, V. M. (2007). Regulation of GTP cyclohydrolase I expression by orphan receptor Nurr1 in cell culture and in vivo. J. Neurochem. 101, 142–150.
Gonzalez-Barrios, J. A., Lindahl, M., Bannon, M. J., Anaya-Martinez, V., Flores, G., Navarro-Quiroga, I., Trudeau, L. E., Aceves, J., Martinez-Arguelles, D. B., Garcia-Villegas, R., Jimenez, I., Segovia, J., and Martinez-Fong, D. (2006). Neurotensin polyplex as an efficient carrier for delivering the human GDNF gene into nigral dopamine neurons of hemoparkinsonian rats. Mol. Ther. 14, 857–865.
Guyon, A., Skrzydelski, D., Rovere, C., Apartis, E., Rostene, W., Kitabgi, P., Melik Parsadaniantz, S., and Nahon, J. L. (2008). Stromal-cell-derived factor 1alpha/CXCL12 modulates high-threshold calcium currents in rat substantia nigra. Eur. J. Neurosci. 28, 862–870.
Hermanson, E., Borgius, L., Bergsland, M., Joodmardi, E., and Perlmann, T. (2006). Neuropilin1 is a direct downstream target of Nurr1 in the developing brain stem. J. Neurochem. 97, 1403–1411.
Hermanson, E., Joseph, B., Castro, D., Lindqvist, E., Aarnisalo, P., Wallen, A., Benoit, G., Hengerer, B., Olson, L., and Perlmann, T. (2003). Nurr1 regulates dopamine synthesis and storage in MN9D dopamine cells. Exp. Cell Res. 288, 324–334.
Hernandez-Montiel, H. L., Tamariz, E., Sandoval-Minero, M. T., and Varela-Echavarria, A. (2008). Semaphorins 3A, 3C, and 3F in mesencephalic dopaminergic axon pathfinding. J. Comp. Neurol. 506, 387–397.
Horvath, M. C., Kovacs, G. G., Kovari, V., Majtenyi, K., Hurd, Y. L., and Keller, E. (2007). Heroin abuse is characterized by discrete mesolimbic dopamine and opioid abnormalities and exaggerated nuclear receptor-related 1 transcriptional decline with age. J. Neurosci. 27, 13371–13375.
Iwawaki, T., Kohno, K., and Kobayashi, K. (2000). Identification of a potential nurr1 response element that activates the tyrosine hydroxylase gene promoter in cultured cells. Biochem. Biophys. Res. Commun. 274, 590–595.
Jacobs, F. M., van der Linden, A. J., Wang, Y., von Oerthel, L., Sul, H. S., Burbach, J. P., and Smidt, M. P. (2009a). Identification of Dlk1, Ptpru, and Klhl1 as novel Nurr1 target genes in meso-diencephalic dopamine neurons. Development 136, 2363–2373.
Jacobs, F. M., van Erp, S., van der Linden, A. J., von Oerthel, L., Burbach, J. P., and Smidt, M. P. (2009b). Pitx3 potentiates Nurr1 in dopamine neuron terminal differentiation through release of SMRT-mediated repression. Development 136, 531–540.
Johnson, K. D., Kim, S. I., and Bresnick, E. H. (2006). Differential sensitivities of transcription factor target genes underlie cell type-specific gene expression profiles. Proc. Natl. Acad. Sci. U.S.A. 103, 15939–15944.
Kadkhodaei, B., Ito, T., Joodmardi, E., Mattsson, B., Rouillard, C., Carta, M., Muramatsu, S., Sumi-Ichinose, C., Nomura, T., Metzger, D., Chambon, P., Lindqvist, E., Larsson, N. G., Olson, L., Bjorklund, A., Ichinose, H., and Perlmann, T. (2009). Nurr1 is required for maintenance of maturing and adult midbrain dopamine neurons. J. Neurosci. 29, 15923–15932.
Kamath, M. B., Houston, I. B., Janovski, A. J., Zhu, X., Gowrisankar, S., Jegga, A. G., and DeKoter, R. P. (2008). Dose-dependent repression of T-cell and natural killer cell genes by PU.1 enforces myeloid and B-cell identity. Leukemia 22, 1214–1225.
Kitagawa, H., Ray, W. J., Glantschnig, H., Nantermet, P. V., Yu, Y., Leu, C. T., Harada, S., Kato, S., and Freedman, L. P. (2007). A regulatory circuit mediating convergence between Nurr1 transcriptional regulation and Wnt signaling. Mol. Cell. Biol. 27, 7486–7496.
Lammi, J., Huppunen, J., and Aarnisalo, P. (2004). Regulation of the osteopontin gene by the orphan nuclear receptor NURR1 in osteoblasts. Mol. Endocrinol. 18, 1546–1557.
Le, W., Conneely, O. M., He, Y., Jankovic, J., and Appel, S. H. (1999). Reduced Nurr1 expression increases the vulnerability of mesencephalic dopamine neurons to MPTP-induced injury. J. Neurochem. 73, 2218–2221.
Le, W., Pan, T., Huang, M., Xu, P., Xie, W., Zhu, W., Zhang, X., Deng, H., and Jankovic, J. (2008). Decreased NURR1 gene expression in patients with Parkinson’s disease. J. Neurol. Sci. 273, 29–33.
Littlejohn, D., Mangano, E., Clarke, M., Bobyn, J., Moloney, K., and Hayley, S. (2011). Inflammatory mechanisms of neurodegeneration in toxin-based models of Parkinson’s disease. Parkinsons Dis. 2011, 713517.
Luo, Y., Henricksen, L. A., Giuliano, R. E., Prifti, L., Callahan, L. M., and Federoff, H. J. (2007). VIP is a transcriptional target of Nurr1 in dopaminergic cells. Exp. Neurol. 203, 221–232.
Maxwell, M. A., and Muscat, G. E. (2005). The NR4A subgroup: immediate early response genes with pleiotropic physiological roles. Nucl. Recept. Signal. 4, e002.
McEvoy, A. N., Murphy, E. A., Ponnio, T., Conneely, O. M., Bresnihan, B., FitzGerald, O., and Murphy, E. P. (2002). Activation of nuclear orphan receptor NURR1 transcription by NF-kappa B and cyclic adenosine 5′-monophosphate response element-binding protein in rheumatoid arthritis synovial tissue. J. Immunol. 168, 2979–2987.
Michelhaugh, S. K., Vaitkevicius, H., Wang, J., Bouhamdan, M., Krieg, A. R., Walker, J. L., Mendiratta, V., and Bannon, M. J. (2005). Dopamine neurons express multiple isoforms of the nuclear receptor nurr1 with diminished transcriptional activity. J. Neurochem. 95, 1342–1350.
Moore, T. M., Brown, T., Cade, M., and Eells, J. B. (2008). Alterations in amphetamine-stimulated dopamine overflow due to the Nurr1-null heterozygous genotype and postweaning isolation. Synapse 62, 764–774.
Mulholland, D. J., Dedhar, S., Coetzee, G. A., and Nelson, C. C. (2005). Interaction of nuclear receptors with the Wnt/beta-catenin/Tcf signaling axis: Wnt you like to know? Endocr. Rev. 26, 898–915.
Noureddine, M. A., Qin, X. J., Oliveira, S. A., Skelly, T. J., van der Walt, J., Hauser, M. A., Pericak-Vance, M. A., Vance, J. M., and Li, Y. J. (2005). Association between the neuron-specific RNA-binding protein ELAVL4 and Parkinson disease. Hum. Genet. 117, 27–33.
Papanikolaou, N. A., and Sabban, E. L. (2000). Ability of Egr1 to activate tyrosine hydroxylase transcription in PC12 cells. Cross-talk with AP-1 factors. J. Biol. Chem. 275, 26683–26689.
Pope, N. J., and Bresnick, E. H. (2010). Differential coregulator requirements for function of the hematopoietic transcription factor GATA-1 at endogenous loci. Nucleic Acids Res. 38, 2190–2200.
Sacchetti, P., Brownschidle, L. A., Granneman, J. G., and Bannon, M. J. (1999). Characterization of the 5′-flanking region of the human dopamine transporter gene. Brain Res. Mol. Brain Res. 74, 167–174.
Sacchetti, P., Carpentier, R., Segard, P., Olive-Cren, C., and Lefebvre, P. (2006). Multiple signaling pathways regulate the transcriptional activity of the orphan nuclear receptor NURR1. Nucleic Acids Res. 34, 5515–5527.
Sacchetti, P., Mitchell, T. R., Granneman, J. G., and Bannon, M. J. (2001). Nurr1 enhances transcription of the human dopamine transporter gene through a novel mechanism. J. Neurochem. 76, 1565–1572.
Saijo, K., Winner, B., Carson, C. T., Collier, J. G., Boyer, L., Rosenfeld, M. G., Gage, F. H., and Glass, C. K. (2009). A Nurr1/CoREST pathway in microglia and astrocytes protects dopaminergic neurons from inflammation-induced death. Cell 137, 47–59.
Saucedo-Cardenas, O., Quintana-Hau, J. D., Le, W. D., Smidt, M. P., Cox, J. J., De Mayo, F., Burbach, J. P., and Conneely, O. M. (1998). Nurr1 is essential for the induction of the dopaminergic phenotype and the survival of ventral mesencephalic late dopaminergic precursor neurons. Proc. Natl. Acad. Sci. U.S.A. 95, 4013–4018.
Shimoji, M., Pagan, F., Healton, E. B., and Mocchetti, I. (2009). CXCR4 and CXCL12 expression is increased in the nigro-striatal system of Parkinson’s disease. Neurotox. Res. 16, 318–328.
Sidhu, A., Wersinger, C., and Vernier, P. (2004). Alpha-synuclein regulation of the dopaminergic transporter: a possible role in the pathogenesis of Parkinson’s disease. FEBS Lett. 565, 1–5.
Sirin, O., Lukov, G. L., Mao, R., Conneely, O. M., and Goodell, M. A. (2010). The orphan nuclear receptor Nurr1 restricts the proliferation of haematopoietic stem cells. Nat. Cell Biol. 12, 1213–1219.
Sleiman, P. M., Healy, D. G., Muqit, M. M., Yang, Y. X., Van Der Brug, M., Holton, J. L., Revesz, T., Quinn, N. P., Bhatia, K., Diss, J. K., Lees, A. J., Cookson, M. R., Latchman, D. S., and Wood, N. W. (2009). Characterization of a novel NR4A2 mutation in Parkinson’s disease brain. Neurosci. Lett. 457, 75–79.
Sousa, K. M., Mira, H., Hall, A. C., Jansson-Sjostrand, L., Kusakabe, M., and Arenas, E. (2007). Microarray analyses support a role for Nurr1 in resistance to oxidative stress and neuronal differentiation in neural stem cells. Stem Cells 25, 511–519.
Strelau, J., Sullivan, A., Bottner, M., Lingor, P., Faulkenstein, E., Suter-Crazzolara, C., Galter, D., Jaszai, J., and Krieglstein, K. (2000). Growth/differentiation factor-15/macrophage inhibitory cytokine-1 is a novel trophic factor for midbrain dopaminergic neurons in vivo. J. Neurosci. 20, 8597–8603.
Torre, E. R., Gutekunst, C. A., and Gross, R. E. (2010). Expression by midbrain dopamine neurons of Sema3A and 3F receptors is associated with chemorepulsion in vitro but a mild in vivo phenotype. Mol. Cell. Neurosci. 44, 135–153.
Trecki, J., and Unterwald, E. M. (2009). Modulation of cocaine-induced activity by intracerebral administration of CXCL12. Neuroscience 161, 13–22.
Venda, L. L., Cragg, S. J., Buchman, V. L., and Wade-Martins, R. (2010). Alpha-synuclein and dopamine at the crossroads of Parkinson’s disease. Trends Neurosci. 33, 559–568.
Volakakis, N., Kadkhodaei, B., Joodmardi, E., Wallis, K., Panman, L., Silvaggi, J., Spiegelman, B. M., and Perlmann, T. (2010). NR4A orphan nuclear receptors as mediators of CREB-dependent neuroprotection. Proc. Natl. Acad. Sci. U.S.A. 107, 12317–12322.
Volpicelli, F., Caiazzo, M., Greco, D., Consales, C., Leone, L., Perrone-Capano, C., Colucci D’Amato, L., and di Porzio, U. (2007). BDNF is a downstream target of Nurr1 transcription factor in rat midbrain neurons in vitro. J. Neurochem. 102, 441–453.
Wallen, A. A., Castro, D. S., Zetterstrom, R. H., Karlen, M., Olson, L., Ericson, J., and Perlmann, T. (2001). Orphan nuclear receptor Nurr1 is essential for Ret expression in midbrain dopamine neurons and in the brain stem. Mol. Cell. Neurosci. 18, 649–663.
Wang, J., and Bannon, M. J. (2005). Sp1 and Sp3 activate transcription of the human dopamine transporter gene. J. Neurochem. 93, 474–482.
Wang, J., Michelhaugh, S. K., and Bannon, M. J. (2007). Valproate robustly increases Sp transcription factor-mediated expression of the dopamine transporter gene within dopamine cells. Eur. J. Neurosci. 25, 1982–1986.
Yang, Y. X., and Latchman, D. S. (2008). Nurr1 transcriptionally regulates the expression of alpha-synuclein. Neuroreport 19, 867–871.
Zetterstrom, R. H., Solomin, L., Jansson, L., Hoffer, B. J., Olson, L., and Perlmann, T. (1997). Dopamine neuron agenesis in Nurr1-deficient mice. Science 276, 248–250.
Zhang, H., Li, S., Wang, M., Vukusic, B., Pristupa, Z. B., and Liu, F. (2009). Regulation of dopamine transporter activity by carboxypeptidase E. Mol. Brain 2, 10.
Appendix
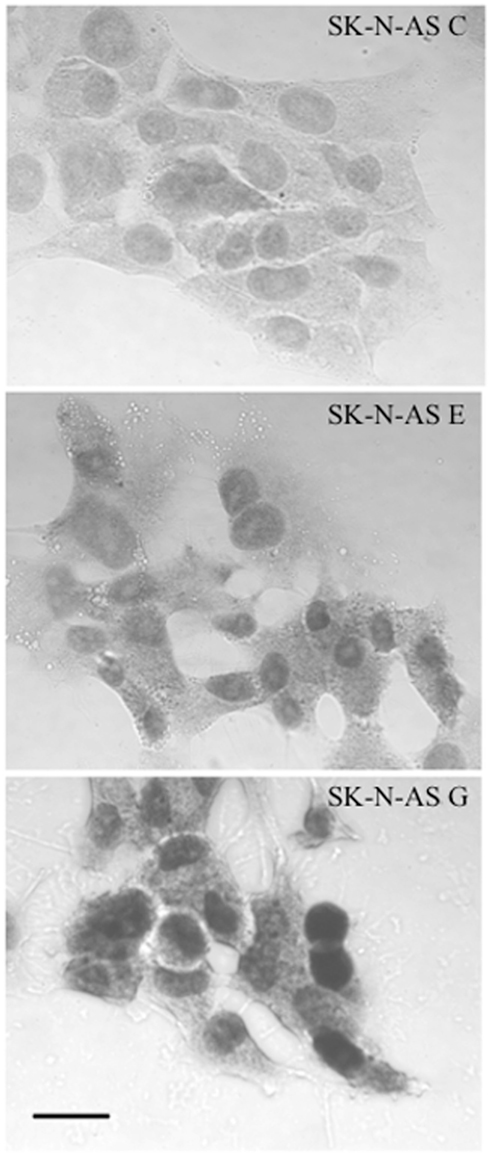
Figure A1. Immunocytochemical demonstration of increased NURR1 abundance in SK-N-AS-derived clonal cell lines E and G. Note that both endogenous NURR1 (in C cells; top) and transgene-derived NURR1 (in E and G! cells: middle and bottom panels, respectively) is primarily nuclear in localization. Cells were fixed with cold 4% paraformaldehyde for 30 minutes and blocked for 2 h at 4°C (PBS with 5% normal goal serum. 5% normal donkey serum. 2% BSA, and 0.2% Triton ×-100) before incubation at 4°C overnight with NURR1 antibody at 1:200 dilution in blocking solution (N20: Santa Cruz Biotechnology, Santa Cruz, CA, USA). After rinsing, cells were incubated with a 1:500 dilution (in blocking solution) of biotinylated anti-rabbit secondary antibody (Vector Laboratories, Burlingame, CA, USA) and diaminobenzidine peroxidase substrate kit with nickel enhancement (Vector Laboratories) per the manufacturer’s protocols. Semi-quantitative assessment of 50 NURR1-positive cells from each clonal line (captured from multiple immunocytochemical images, each background-corrected) revealed that the increase in nuclear NURR1 abundance in E cells (~2.4-fold relative to C cells) paralleled the changes seen in transcript abundance (see Figure 1). Although larger increases in NURR1 immunoreactivity were visually apparent in G cells (bottom panel) compared to C or E cells, the extent of increase in abundance (nominally measured as ~3.3-fold increase over C) could not be accurately quantified due to the obvious saturation of the NURR1 immunocytochemical signal. Scale bar represents 25 μm.
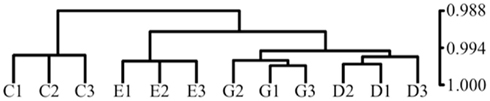
Figure A2. Hierarchical clustering of samples by Pearson correlation demonstrates that NURR1 expression is the major determinant of relatedness of gene expression profiles among clonal cell lines. Profiles of gene expression were compared for biological triplicates of clonal C. E, G cells and an additional clonal cell line (D) we isolated with NURR1 transcript abundance equivalent to G cells (Ct of 27.0 versus 26.9, respectively, by qRT-PCR). Clustering by Pearson (Pearson r indicated on vertical axis) shows that biological triplicates for each cell line are most highly related, that C cells stand apart from the NURR1-transgene expressing cells, and that the G and D lines are most highly related, verifying that changes in NURR1 abundance per se could largely account for observed differences in patterns of gene expression.
Keywords: NURR1, transcription factor, gene expression profile, neurodegeneration, addiction, dopamine cell, human
Citation: Johnson MM, Michelhaugh SK, Bouhamdan M, Schmidt CJ and Bannon MJ (2011) The transcription factor NURR1 exerts concentration-dependent effects on target genes mediating distinct biological processes. Front. Neurosci. 5:135. doi: 10.3389/fnins.2011.00135
Received: 10 August 2011; Accepted: 21 November 2011;
Published online: 20 December 2011.
Edited by:
David F. Clayton, University of Illinois, USAReviewed by:
Ted Abel, University of Pennsylvania, USAClaudio V. Mello, Oregon Health and Science University, USA
Copyright: © 2011 Johnson, Michelhaugh, Bouhamdan, Schmidt and Bannon. This is an open-access article distributed under the terms of the Creative Commons Attribution Non Commercial License, which permits non-commercial use, distribution, and reproduction in other forums, provided the original authors and source are credited.
*Correspondence: Michael J. Bannon, Department of Pharmacology, Wayne State University School of Medicine, 540 E Canfield, 6374 Scott Hall, Detroit, MI 48201, USA. e-mail:bWJhbm5vbkBtZWQud2F5bmUuZWR1
†Magen M. Johnson and Sharon K. Michelhaugh have contributed equally to this work.