 Ruth A. Carper
 Jeffrey M. Treiber
 Nathan S. White
 Jiwandeep S. Kohli
 Ralph-Axel Müller
- 1Brain Development Imaging Laboratory, Department of Psychology, San Diego State University, San Diego, CA, USA
- 2School of Medicine, University of California San Diego, La Jolla, CA, USA
- 3Multimodal Imaging Laboratory, Department of Radiology, University of California San Diego, La Jolla, CA, USA
Autism postmortem studies have shown various cytoarchitectural anomalies in cortical and limbic areas including increased cell packing density, laminar disorganization, and narrowed minicolumns. However, there is little evidence on dendritic and axonal organization in ASD. Recent imaging techniques have the potential for non-invasive, in vivo studies of small-scale structure in the human brain, including gray matter. Here, Restriction Spectrum Imaging (RSI), a multi-shell diffusion-weighted imaging technique, was used to examine gray matter microstructure in 24 children with ASD (5 female) and 20 matched typically developing (TD) participants (2 female), ages 7–17 years. RSI extends the spherical deconvolution model to multiple length scales to characterize neurite density (ND) and organization. Measures were examined in 48 cortical regions of interest per hemisphere. To our knowledge, this is the first time that a multi-compartmental diffusion model has been applied to cortical gray matter in ASD. The ND measure detected robust age effects showing a significant positive relationship to age in all lobes except left temporal when groups were combined. Results were also suggestive of group differences (ASD<TD) in anterior cingulate, right superior temporal lobe and much of the parietal lobes, but these fell short of statistical significance. For MD, significant group differences (ASD>TD) in bilateral parietal regions as well as widespread age effects were detected. Our findings support the value of multi-shell diffusion imaging for assays of cortical gray matter. This approach has the potential to add to postmortem literature, examining intracortical organization, intracortical axonal content, myelination, or caliber. Robust age effects further support the validity of the ND metric for in vivo examination of gray matter microstructure in ASD and across development. While diffusion MRI does not approach the precision of histological studies, in vivo imaging measures of microstructure can complement postmortem studies, by allowing access to large sample sizes, a whole-brain field of view, longitudinal designs, and combination with behavioral and functional assays. This makes multi-shell diffusion imaging a promising technique for understanding the underlying cytoarchitecture of the disorder.
Introduction
By general consensus, autism spectrum disorder (ASD) is a neurobiological disorder, likely of complex genetic, epigenetic, and possibly environmental origin, with brain development deviating from the typical path beginning in the prenatal period (Bailey et al., 1998; Palmen et al., 2004; Bauman and Kemper, 2005; Hutsler and and Casanova, 2016). Post-mortem studies are indispensible to our understanding of the underlying cellular anomalies. A reduction in the number of cerebellar Purkinje cells was among the earliest histologic reports (Bauman and Kemper, 1985), and a report of patchy neocortical thickening and laminar disorganization followed (Bailey et al., 1998). Increased cell packing density has been found in anterior cingulate, hippocampus and amygdala (Kemper and Bauman, 1998; Schumann and Amaral, 2006), and in prefrontal cortex by some (Bailey et al., 1998; Courchesne et al., 2011), but not all (Bauman and Kemper, 2005) research groups, while decreased density was found in fusiform gyrus (van Kooten et al., 2008). Increases in cortical cell packing density may relate to narrowed mini-columns in dorsolateral prefrontal cortex and superior temporal gyrus (Casanova et al., 2002, 2006; Buxhoeveden et al., 2006), suggesting a reduction in the amount of neuropil space surrounding neurons, which may reflect a decrease in inhibitory neurites in the affected regions. Ectopias (Bailey et al., 1998; Wegiel et al., 2010) and increased dendritic spine densities (Hutsler and Zhang, 2010) have also been reported. These neurostructural findings suggest altered rates of neurogenesis, delayed or reduced apoptosis or pruning or local failures of migration.
The postmortem literature is also quite variable, however, due to limitations which may be addressed through MRI and other in vivo imaging techniques. Some postmortem neuropathology is described as “patchy” at the individual case level (Bailey et al., 1998; Hutsler et al., 2007), and some findings are inconsistent across research groups or methods (Bailey et al., 1998; Bauman and Kemper, 2005; Hutsler et al., 2007). Furthermore, it is quite likely that histological differences that can be detected vary with the age of the case, particularly over the course of childhood, as indicated by in vivo MRI studies (Courchesne et al., 2001; Carper et al., 2002; Schumann et al., 2010; Hazlett et al., 2011). Such variability is difficult to overcome in postmortem studies, which are usually limited to small samples (averaging about 5 cases per study; Schumann and Nordahl, 2011) across wide age spans, with most cases in the adolescent or adult range. In addition, since histologic studies are extremely time consuming, studies are often limited to samples of only a few anatomical regions rather than whole-brain surveys. Longitudinal studies are furthermore impossible, limiting any developmental interpretations of post-mortem findings. In vivo imaging techniques may overcome many of these issues, allowing large sample sizes, whole-brain assessment, and longitudinal studies. However, examination of sub-voxel features such as dendritic or axonal organization and cortical cytoarchitecture has remained beyond the reach of in vivo imaging studies on ASD published to date.
The ability to describe cytoarchitecture and neuronal connectivity at the sub-millimeter level in living subjects would be a tremendous boon to research of neurodevelopmental and other neurologic disorders. Continuing improvements in system hardware and advances in acquisition techniques and sequence programming continue to push back the limits on spatial resolution. At the same time, new models for analysis of diffusion MRI allow examination of separate compartments within a single voxel. The combination of multi-shell diffusion acquisitions and multi-compartmental analysis approaches permits estimates of neurite (both axon and dendrite) content and organization within clinically manageable acquisition times (Jensen et al., 2005; Lu et al., 2006; Zhang et al., 2012; White et al., 2013). Multi-shell diffusion imaging (i.e., acquisition at multiple b-values and multiple diffusion directions), allows classification of diffusion at multiple length scales, disambiguating restricted (slow) diffusion from hindered (fast) diffusion. Inclusion of high b-values allows insight into micro-scale structures such as the organization and density of dendritic and axonal processes (neurites; Barazany et al., 2009; Raffelt et al., 2012; Assaf et al., 2013; Dell'Acqua et al., 2013). Here we used Restriction Spectrum Imaging (RSI, White et al., 2013), one such analysis approach, for in vivo examination of neurite organization within cerebral cortex in an ASD population.
RSI extends the spherical deconvolution model (Tournier et al., 2004) across these multiple length scales to characterize neurite density and organization at each imaged voxel. Analogous models have been used to examine white matter in one study of young adults with ASD (Lazar et al., 2014) but, to our knowledge, this is the first time that a multi-compartmental model has been applied to cortical gray matter in this population and the first time this age group has been addressed. We examined 48 cortical regions of interest per hemisphere in a population of 24 ASD and 20 TD children and adolescents.
Materials and Methods
Participants
Participants ranged between 7 and 17 years of age and included both males and females. All potential ASD participants were administered the Autism Diagnostic Observation Schedule (ADOS, Lord et al., 2001), and their parents completed the Autism Diagnostic Interview-Revised (ADI-R, Rutter et al., 1995). Final diagnosis of Autism Spectrum Disorder was determined by a trained clinical psychologist according to DSM-V criteria (American Psychiatric Association, 2013) and with reference to ADOS and ADI-R scores. Children with known history of neurological disorders other than ASD (e.g., Fragile X syndrome, epilepsy) were excluded. Typically developing (TD) participants were recruited from the community, excluding anyone with a personal or family history of autism or a personal history of other neurologic or psychiatric conditions. Participants were also administered the Wechsler Abbreviated Scale of Intelligence (WASI, Wechsler, 1999), the Social Responsiveness Scale (SRS, Constantino and Gruber, 2005), and the Edinburgh Handedness Inventory (Oldfield, 1971). The study was approved by the University of California, San Diego, and San Diego State University Institutional Review Boards, with written informed consent and assent provided by all participants and caregivers.
MRI Data Acquisition and Preprocessing
MRI data were collected on a GE Discovery MR 750 3.0T system using an 8-channel head coil. Diffusion was measured with a multi-shell EPI sequence encoded for 45 non-collinear diffusion directions, (15 unique directions at each of 3 b-values: 500, 1500, and 4000 s/mm2) and 2 at b = 0 s/mm2 (in-plane resolution = 1.875 × 1.875 mm, thickness = 2.5 mm, TR = 7 s, TE = 87.4 ms, flip = 90°). An anatomical T1-weighted fast spoiled gradient echo (FSPGR) scan (1 mm3, TR = 8.108 s, TE = 3.172 ms, flip = 8°) was also acquired. Preprocessing of diffusion data was performed using in-house software and included eddy current correction (Zhuang et al., 2006), rigid body correction for motion with corresponding adjustments to the vector matrix, correction of susceptibility-induced field distortions (Holland et al., 2010), and correction for gradient non-linearities (Jovicich et al., 2006).
Quality Assessment and Motion Quantification
Multi-shell diffusion images were initially collected from 33 ASD and 24 TD children and adolescents. Average translation and rotation between acquisitions was calculated for each participant and considered for group matching. All image data, including each diffusion direction and b-value, were also visually inspected for motion-related signal dropout and other artifacts. The high b-value shell is particularly sensitive to motion-related dropout leading to a high exclusion rate. Seven subjects were excluded for excessive dropout (5 ASD, 2 TD) and an additional six for translation >1 mm or rotation >.01 radians (0.6 degrees, 4 ASD, 2 TD). Participants who were excluded did not differ significantly from those who were included with regard to age, IQ, or symptom severity (ADOS, ADI, SRS), for either subject group.
Restriction Spectrum Imaging
The RSI model is based on the compartmentalization of water in brain tissue. Diffusion of water molecules within brain tissue is constrained by cell membranes and other structures and thus ranges from restricted diffusion, as in intra-cellular spaces where water is (on time scales examined here) unable to diffuse beyond the cellular or axonal membrane, to free diffusion, found in fluid spaces where diffusion is unencumbered by barriers such as membranes or large proteins (Le Bihan, 2012). Between these extremes, diffusion is hindered, e.g., in extracellular spaces where water must follow a tortuous path to pass around cell membranes or other obstacles, but is not enclosed by such barriers (Assaf and Basser, 2005). RSI applies a mathematical model (White et al., 2013, 2014) to determine the proportion of a voxel (volume fraction) and signal (signal fraction) stemming from hindered, restricted, or free water compartments and the geometry of diffusion within each of these compartments (isotropic or anisotropic). The algorithm is described in detail in the original validation study (White et al., 2013) and represents an extension of the linear spherical deconvolution model (Tournier et al., 2004; Dell'Acqua et al., 2007; Jian and Vemuri, 2007; Kaden et al., 2007) to multiple diffusion length scales. In the current application we used five diffusion length scales. The volume fraction of anisotropic restricted diffusion (the shortest length scale examined) is believed to reflect the relative density of neuronal processes (neurite density, ND; White et al., 2013). ND was calculated for each voxel, as were the fractional anisotropy (FA) and mean diffusivity (MD) derived from the diffusion tensor. The ND volume fraction was standardized to a 1–1000 range; FA ranged 0–1.
Analysis of Anatomical Images and Extraction of ROIs
Preprocessing of anatomical T1 scans included correction for gradient non-linearities (Jovicich et al., 2006) and brain extraction (Smith, 2002). A gray matter mask was derived for each subject (Avants et al., 2011b) and affine registration was used to align each participant's T1 to the corresponding RSI image and to a sample-specific template in MNI space which had been derived using Advanced Normalization Tools (ANTS, Avants et al., 2010, 2011a). This allowed backward transformation of the Harvard-Oxford cortical atlas (http://fsl.fmrib.ox.ac.uk/fsl/fslwiki/Atlases) from MNI space to each individual's native diffusion space, providing 48 gyral-level ROIs for each hemisphere. Average ND, FA, and MD within gray matter were calculated for each of these ROIs and for the overall cerebral lobes (see Supplementary Table 1 for ROIs and their lobar designations).
Results
The final sample included 24 ASD participants (5 female) aged 7–17 years, and 20 TD participants (2 female) aged 8–17 years. Groups were well matched for age, non-verbal IQ, and motion measures with all p > 0.5 (Table 1). The ASD group had lower verbal IQ as is frequently found in this socio-communicative disorder.
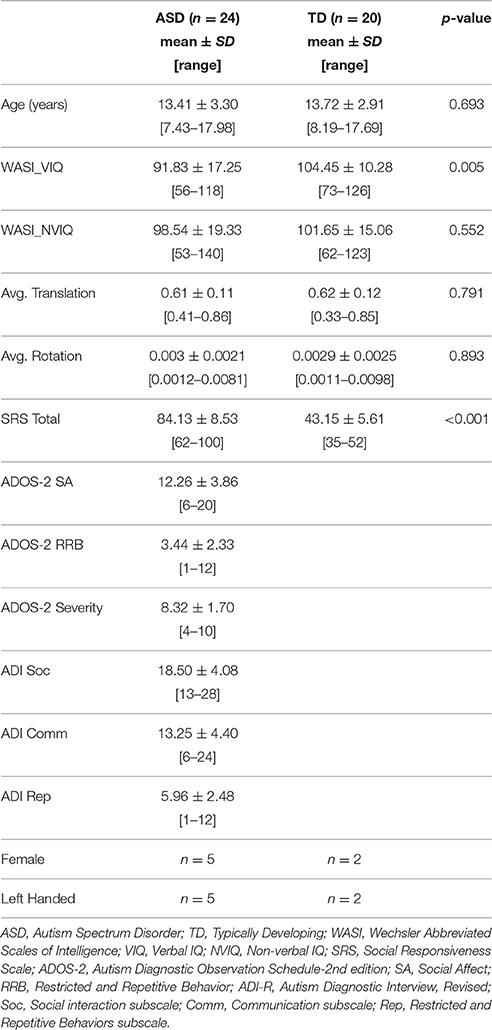
Table 1. Demographics.
Linear regressions were performed on ND, FA, and MD measures separately for each lobe and hemisphere with age, group, group-by-age interaction, and a constant included in each model. The false discovery rate (FDR, Benjamini and Hochberg, 1995) was used to correct for multiple comparisons. All regressions performed on a single dependent variable (ND, FA, or MD) were included within a statistical family with the significance of each overall F-test included in that correction. Coefficients were corrected in a similar fashion.
Lobar Effects
Regressions were significant for ND in all lobes in the right hemisphere and for frontal, parietal, and occipital lobes in the left hemisphere (Table 2). The effects of age were significant and positive (increasing with age) in all of these. Rates ranged from 1.38 per year (left occipital lobe) to 4.11 per year (right frontal lobe) with the volume fraction standardized to a 1–1000 scale (Figures 1A,B). Group differences showed reduced ND in left parietal and left occipital lobes in ASD compared to TD participants (Figure 2) with moderate effect sizes ranging from 0.37 to 0.75, but these did not survive correction for multiple comparisons. Interactions between group and age were not significant.
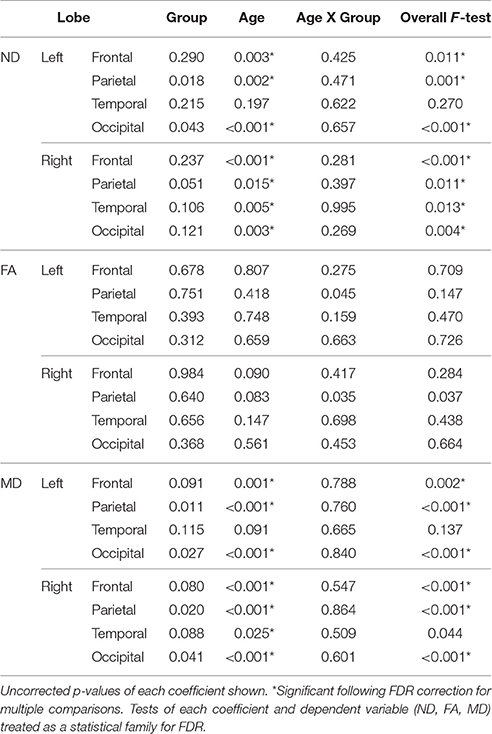
Table 2. Linear regression results (p-values) for neurite density, fractional anisotropy, and mean diffusivity by lobe.
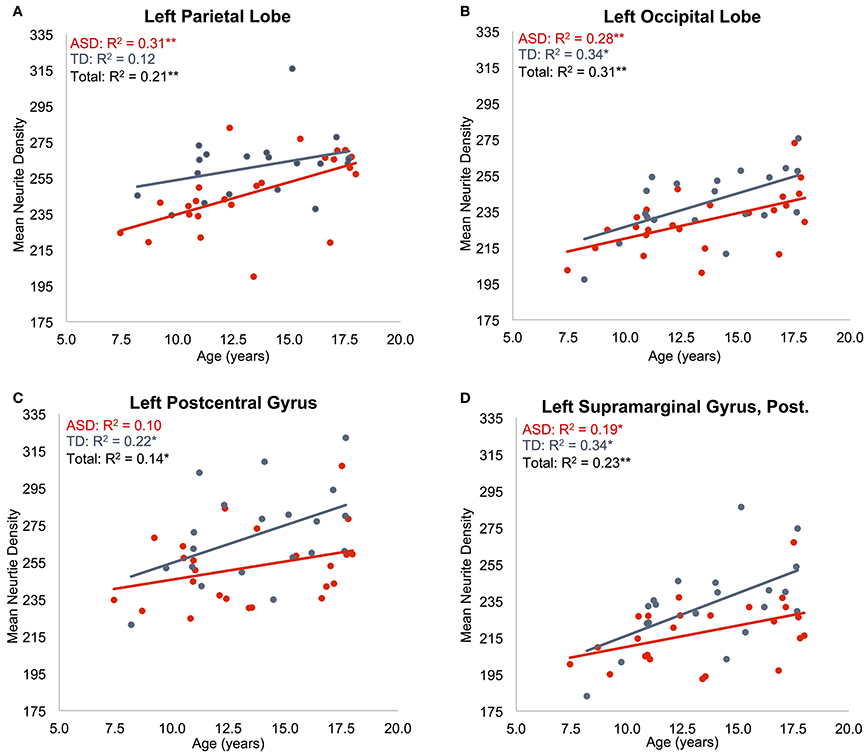
Figure 1. Effects of age on neurite density. Mean ND is shown as a function of subject age for: (A) left parietal lobe, (B) left occipital lobe, (C) left postcentral gyrus, (D) posterior division of left supramarginal gyrus. ASD indicated in red, TD indicated in blue. Neurite density standardized to a 0–1000 range. *p < 0.05, **p < 0.005.
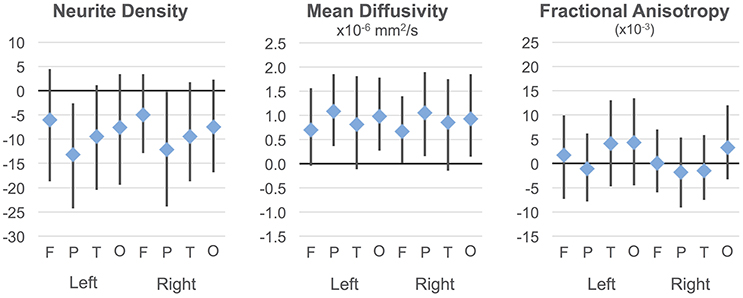
Figure 2. Group differences in ND, MD, and FA. Group differences and 95% confidence intervals are shown for each cortical lobe. Positive values indicate ASD >TD. Neurite density standardized to a 0–1000 range.
On the MD measure, regressions were significant bilaterally in frontal, parietal and occipital lobes, but not temporal lobes. All of these showed significant negative effects of age (decreasing with age) with rates ranging from −2.445 × 10⁻⁶ mm2/s per year (left frontal lobe) to −3.875 × 10⁻⁶ mm2/s per year (left parietal lobe). MD was higher in ASD in the parietal and occipital lobes bilaterally (Figure 2) again with medium effect sizes (0.49 to 0.67). However, these did not survive correction for multiple comparisons. There were no significant interactions. By contrast, similar linear regression analyses for FA values did not reach significance after correction for multiple comparisons.
Localized Effects
Individual ROIs were also examined for a more localized understanding of effects in MD and ND (see Supplementary Table 1 for list of ROIs examined), using similar linear regression models. For each dependent variable, all regions were included bilaterally to correct each coefficient for multiple comparisons (48 regions x 2 hemispheres).
Regressions on ND were significant for all regions on the dorsolateral aspect of the right frontal lobe as well as the right anterior cingulate, paracingulate, operculum and insula (Supplementary Table 2, Figures 1C,D). Left frontal effects were restricted to anterior cingulate, paracingulate, central operculum, and posterior portions of the dorsal surface. Regressions were also significant for all subregions of parietal lobes (except bilateral superior parietal lobule, right precuneus, and right postcentral), a few bilateral temporal regions including posterolateral regions, planum temporale, Heschl's gyrus, and right temporal occipital fusiform gyrus, and portions of occipital lobe including bilateral posterior cingulate. All of these except left Heschl's gyrus exhibited significantly greater ND with increasing age.
Group effects (see Supplementary Figure 1 for group differences and confidence intervals) suggested that ND was reduced in ASD in a number of regions (e.g., anterior cingulate, precentral and supramarginal gyri bilaterally, parts of superior temporal gyrus, fusiform, and planum temporale on the right), but only left temporal occipital fusiform cortex survived correction for multiple comparisons (and overall regression was not significant). The only significant group-by-age interaction was in right anterior cingulate with ND increasing more rapidly with age in ASD.
With only one exception (right temporal occipital fusiform), all regions that showed significant positive age effects on ND also showed significant negative effects on the MD measure (Supplementary Figure 2, Supplementary Table 3). In addition, left superior parietal lobule was affected, and more of left frontal lobes (left middle frontal, subcallosal gyri), and occipital lobes (bilateral intracalcarine cortex and pole, right lateral occipital gyrus, left supracalcarine, cuneal, and lingual regions) showed age effects.
Group differences on MD did not survive correction, but the tendency was toward higher MD in ASD than TD particularly in parietal regions and in several frontal and occipital regions (see Supplementary Figure 2 for group differences and confidence intervals). Interactions were not significant.
Discussion
The present study is—to our knowledge—the first to apply a multi-compartmental diffusion model using multishell MRI to the study of cortical gray matter microstructure in ASD. We found robust age effects for both ND (increasing) and MD (decreasing), but not FA, a measure more suited to tissues with well-aligned microstructure such as in the deep white matter. Trends toward decreased ND and increased MD in ASD did not survive correction for multiple comparisons when examined at the lobar level. More localized examination again showed robust age effects in the ND and MD measures, and a significant group difference was found on ND (ASD<TD) in the left temporal occipital fusiform gyrus. While other ND differences did not survive correction for multiple comparisons, examination of confidence intervals (Supplementary Figures 1, 2) suggests that larger sample sizes or improvements in signal-to-noise and motion control (see Limitations) may support such differences.
Our findings indicate that multi-shell, multi-compartmental approaches may provide a valuable addition to our ability to examine gray matter microstructure in ASD and other disorders. While the RSI derived ND measure may not be as sensitive as the tensor-derived MD measure, it offers greater interpretability and specificity as discussed below.
Neurite Density and Mean Diffusivity
The ND measure is likely driven primarily by axons, and particularly myelinated axons, rather than dendrites within cerebral cortex. At the diffusion time-scales examined here, unmyelinated neurites allow some amount of water exchange across the cellular membrane. Since the ND measure is derived from elements with cylindrical symmetry, wherein diffusion is restricted in the direction transverse to the cylinder, but relatively unencumbered along the long axis, unmyelinated elements will contribute less overall signal to the neurite water compartment due to greater water exchange. Hence, lower ND such as that seen in younger participants likely reflects: (1) lower density of myelinated axons, (2) thinner myelin (allowing greater average water exchange), or possibly (3) smaller average caliber of myelinated axons which would be associated with less water in the restricted cylindrical pool.
Cortical MD may be driven by the same factors (but in the opposite direction) since ND and MD measures will tend to correlate inversely with each other. MD is highest where diffusion is free and lowest where it is restricted (e.g., areas of high ND). However, MD is derived from a tensor model and does not distinguish intracellular from extracellular compartments as do RSI derived measures. Other possible causes of MD effects therefore cannot be excluded in regions where ND effects were not detected. Inflammatory responses also lead to increased MD due to increased tissue water (Alexander et al., 2007) but would not be expected to alter intracellular measures such as ND. Signs of inflammation have been reported in ASD (Vargas et al., 2005; Zimmerman et al., 2005; Morgan et al., 2010; Suzuki et al., 2013) so this potential contributor must be considered. Alternatively, MD may simply be a more robust measure than ND when examining gray matter. With only about 25% of the cortical diffusion volume fraction being restricted, ND signal-to-noise will be lower than in the composite MD measure. The relative simplicity of the tensor model may also make measures such as MD more robust than those derived from the more complex RSI model. However, since effect sizes for ND ranged from medium to large (0.37 to 0.75) the lack of more significant findings may have been due to limited sample size, accompanied by expected variability due to the known etiological heterogeneity in ASD (Geschwind and State, 2015).
Age Effects
The validity of the ND metric was supported by robust maturational effects detected in our study. ND increased significantly with age in all lobes except left temporal when groups were combined, showing clear sensitivity to developmental change. At first glance, the direction of change may appear unexpected: The number of cortical synapses, and presumably the complexity of dendritic branches, begins to decrease prior to age 8 years (Huttenlocher and Dabholkar, 1997), while cortical gray matter volume stabilizes (Courchesne et al., 2000), so that a measure of “neurite density” might be expected to decline during this period. However, as described above, the ND measure is probably particularly sensitive to the degree of axonal myelination, which continues well into adulthood. This is supported by multi-shell diffusion studies on neurotypical white matter development that also found age related increases in intraneurite compartments using compartmental diffusion models other than RSI. In a recent abstract, Chang et al. (2015) reported increasing intra-axonal volume fractions across childhood and adolescence using neurite orientation dispersion and density imaging (NODDI). Significant age related increases were also reported by Jelescu et al. (2015) in infants and toddlers, and by Billiet et al. (2015) in adults, with both of these using both NODDI and diffusion kurtosis imaging. These latter studies concluded that the age effects must be at least partially reflective of ongoing myelination, rather than strictly of intra-axonal volume fractions. Indeed, the same NODDI measure was found to correlate with direct staining of myelin in a rat model (Jespersen et al., 2007).
Localization of Group Trends
While group differences on ND were only marginal,—surviving correction for multiple comparisons in only a single region—and therefore must be viewed with substantial caution, the localization of these results deserves some consideration in context of the postmortem literature. ND tended to be lower in ASD than TD in bilateral anterior cingulate gyri, for which increased cell packing density has been reported in several ASD post-mortem cases (Kemper and Bauman, 1998; Schumann and Amaral, 2006). This region also showed the only group-by-age interaction surviving correction, with the ASD group showing a greater increase in ND with age than TD. One of these postmortem studies also examined axons just beneath the cortex (Zikopoulos and Barbas, 2010). In that study, axons were sampled from white matter beneath four areas of frontal lobe in five adult ASD postmortem cases, finding a relative shift from larger to smaller caliber axons exiting the anterior cingulate cortex. As discussed above, smaller myelinated axons are one potential source of ND reductions, which would be consistent with our findings. Zikopoulos and Barbas (2010) also found decreased myelin thickness in axons exiting orbital frontal cortex compared to controls. But, while myelin thickness is another potential source of ND changes, we found little evidence of a group difference in orbital cortex. Other areas where shifts in cell packing density have been reported in ASD include the hippocampus and amygdala, which were not examined here, the prefrontal cortex (though not consistently), and potentially the superior temporal gyrus given findings of narrowed minicolumns. In our sample, ND did tend to be lower in the ASD group in the superior temporal gyrus and its superior aspect (Heschl's gyrus, planum temporale) primarily in the right hemisphere. We found no evidence of prefrontal differences. One group has reported decreased cell density in fusiform cortex, whereas we found lower ND that was limited to the posterior aspect of the gyrus.
Limitations
The absence of significant group differences in RSI may partly reflect the inter-case variability of cytoarchitectonic abnormalities in ASD, commonly found in the literature (Bailey et al., 1998; Hutsler et al., 2007; Wegiel et al., 2010). Additionally, some neuropathologies may not affect the same regions of cortex across all ASD cases, such as laminar differences that have been described as “patchy” (Hutsler et al., 2007). Group-wise analyses such as those used here would not be sensitive to such subject-specific anomalies. Notably, one recent study demonstrated the utility of a multi-compartment diffusion approach for identification of focal cortical dysplasias, not unlike those reported in ASD cases, on a case-wise basis (Winston et al., 2014). Intracellular volume fraction, their marker of neurite density, highlighted focal dysplasias more prominently than traditional diffusion or structural imaging. With a large normative sample, it might be possible to detect focal dysplasias in vivo on a case-wise basis in ASD and other disorders using RSI or other compartmental diffusion models.
As with all MRI methodologies, subject motion during scanning can be an issue, particularly when comparing groups that may differ in their likelihood of motion. We thoroughly screened all scans for subject motion resulting in well-matched subject groups. However, better protection of multi-shell diffusion sequences from motion may be possible. Our highest b-value shell (b = 4000 s/mm2) was particularly susceptible to motion-related slice dropout, forcing us to exclude c. 27% of ASD participants. This could be improved either by reducing the maximum gradient strength while losing sensitivity to the shortest diffusion distances or, more simply, by repeating the acquisition of this highest shell to allow signal averaging.
Although RSI provides insight to subvoxel neural content in the form of separate intra and extracellular compartments, partial volume effects are still relevant. Voxel size was large (8.8 mm3) leading to inclusion of both gray and white matter within voxels and averaging across lamina. Higher resolutions may be possible with accelerated imaging techniques, but are unlikely to reach sublaminar resolution in the near future.
RSI is not sensitive to all types of cytoarchitectonic anomalies reported in the ASD literature, such as dysmorphology of specific cell types, ectopias, and abnormal dendritic spine density.
The sample examined here spanned a broad and developmentally complex age range, from 7 to 17 years. After controlling for subject motion, sample sizes of 24 and 20 participants per group were somewhat limited for such a broad range. We were also limited to participants who were relatively high functioning in order to maximize subject cooperation during scanning. Results derived here may not, therefore, generalize to lower-functioning ASD populations or to populations outside of the examined age range.
Conclusion
DWI methods are typically restricted to examination of white matter. However, RSI shows substantial promise for microstructural examination of gray matter in ASD. The method is sensitive to effects of age, suggests that group differences may be detected with larger sample sizes, and offers greater interpretability than the traditional diffusion tensor measures FA and MD. The robust age effects that were found for ND support the validity and sensitivity of multi-shell, multi-compartment DWI for in vivo examination of gray matter in developmental populations. While RSI is not sensitive to all types of cytoarchitectonic anomalies reported in the ASD literature, measures are likely to reflect intracortical axonal content, myelination, and caliber, which have received limited attention in postmortem studies and can thus complement these in important ways. In the context of fundamental advantages of in vivo studies, which can be combined with functional (functional imaging or behavioral) assays, provide a whole brain field of view, and can be administered in longitudinal designs, the first findings reported here suggest that multishell diffusion imaging may be a promising complement to postmortem neurohistology in ASD.
Author Contributions
RC, NW, and RM contributed to the conception and design of the work; RC, JT, and JK contributed to the processing, analysis, and presentation of data; all authors contributed to the manuscript itself.
Funding
This study was supported by National Institutes of Health grants R01-MH081023 and K01-MH097972, and by National Science Foundation Grant No. 1430082.
Conflict of Interest Statement
The authors declare that the research was conducted in the absence of any commercial or financial relationships that could be construed as a potential conflict of interest.
Acknowledgments
Our sincere thanks to our participants and their families for sharing their time with us. Additional thanks to Dr. Qidi Peng and Miss Afrooz Jahedi for statistical consultation.
Supplementary Material
The Supplementary Material for this article can be found online at: http://journal.frontiersin.org/article/10.3389/fnins.2016.00610/full#supplementary-material
References
Alexander, A. L., Lee, J. E., Lazar, M., and Field, A. S. (2007). Diffusion tensor imaging of the brain. Neurotherapeutics 4, 316–329. doi: 10.1016/j.nurt.2007.05.011
Assaf, Y., Alexander, D. C., Jones, D. K., Bizzi, A., Behrens, T. E., Clark, C. A., et al. (2013). The CONNECT project: combining macro- and micro-structure. Neuroimage 80, 273–282. doi: 10.1016/j.neuroimage.2013.05.055
American Psychiatric Association (2013). Diagnostic and Statistical Manual of Mental Disorders, 5th Edn. Washington, DC: American Psychiatric Association.
Assaf, Y., and Basser, P. J. (2005). Composite hindered and restricted model of diffusion (CHARMED) MR imaging of the human brain. Neuroimage 27, 48–58. doi: 10.1016/j.neuroimage.2005.03.042
Avants, B. B., Tustison, N. J., Song, G., Cook, P. A., Klein, A., and Gee, J. C. (2011a). A reproducible evaluation of ANTs similarity metric performance in brain image registration. Neuroimage 54, 2033–2044. doi: 10.1016/j.neuroimage.2010.09.025
Avants, B. B., Tustison, N. J., Wu, J., Cook, P. A., and Gee, J., C. (2011b). An open source multivariate framework for n-tissue segmentation with evaluation on public data. Neuroinformatics 9, 381–400. doi: 10.1007/s12021-011-9109-y
Avants, B. B., Yushkevich, P., Pluta, J., Minkoff, D., Korczykowski, M., Detre, J., et al. (2010). The optimal template effect in hippocampus studies of diseased populations. Neuroimage 49, 2457–2466. doi: 10.1016/j.neuroimage.2009.09.062
Bailey, A., Luthert, P., Dean, A., Harding, B., Janota, I., Montgomery, M., et al. (1998). A clinicopathological study of autism. Brain 121 (Pt 5), 889–905.
Barazany, D., Basser, P. J., and Assaf, Y. (2009). In vivo measurement of axon diameter distribution in the corpus callosum of rat brain. Brain 132, 1210–1220. doi: 10.1093/brain/awp042
Bauman, M. L., and Kemper, T. L. (1985). Histoanatomic observations of the brain in early infantile autism. Neurology 35, 866–874.
Bauman, M. L., and Kemper, T. L. (2005). Neuroanatomic observations of the brain in autism: a review and future directions. Int. J. Dev. Neurosci. 23, 183–187. doi: 10.1016/j.ijdevneu.2004.09.006
Benjamini, Y., and Hochberg, Y. (1995). Controlling the false discovery rate - a practical and powerful approach to multiple testing. J. R. Stat. Soc. Ser. B Methodol. 57, 289–300.
Billiet, T., Vandenbulcke, M., Madler, B., Peeters, R., Dhollander, T., Zhang, H., et al. (2015). Age-related microstructural differences quantified using myelin water imaging and advanced diffusion MRI. Neurobiol. Aging 36, 2107–2121. doi: 10.1016/j.neurobiolaging.2015.02.029
Buxhoeveden, D. P., Semendeferi, K., Buckwalter, J., Schenker, N., Switzer, R., and Courchesne, E. (2006). Reduced minicolumns in the frontal cortex of patients with autism. Neuropathol. Appl. Neurobiol. 32, 483–491. doi: 10.1111/j.1365-2990.2006.00745.x
Carper, R. A., Moses, P., Tigue, Z. D., and Courchesne, E. (2002). Cerebral lobes in autism: early hyperplasia and abnormal age effects. Neuroimage 16, 1038–1051. doi: 10.1006/nimg.2002.1099
Casanova, M. F., Buxhoeveden, D. P., Switala, A. E., and Roy, E. (2002). Minicolumnar pathology in autism. Neurology 58, 428–432. doi: 10.1212/WNL.58.3.428
Casanova, M. F., van Kooten, I. A., Switala, A. E., van Engeland, H., Heinsen, H., Steinbusch, H. W., et al. (2006). Minicolumnar abnormalities in autism. Acta Neuropathol. 112, 287–303. doi: 10.1007/s00401-006-0085-5
Chang, Y.-S., Owen, J. P., Pojman, N. J., Thieu, T., Bukshpun, P., Wakahiro, M. L. J., et al. (2015). White Matter Changes of Neurite Density and Orientation Dispersion during Human Brain Maturation (Abstract). Honolulu, HI: Organization for Human Brain Mapping.
Constantino, J. N., and Gruber, C. P. (2005). Social Responsiveness Scale. Los Angeles, CA: Western Psychological Services.
Courchesne, E., Chisum, H. J., Townsend, J., Cowles, A., Covington, J., Egaas, B., et al. (2000). Normal brain development and aging: quantitative analysis at in vivo MR imaging in healthy volunteers. Radiology 216, 672–682. doi: 10.1148/radiology.216.3.r00au37672
Courchesne, E., Karns, C. M., Davis, H. R., Ziccardi, R., Carper, R. A., Tigue, Z. D., et al. (2001). Unusual brain growth patterns in early life in patients with autistic disorder: an MRI study. Neurology 57, 245–254. doi: 10.1212/WNL.57.2.245
Courchesne, E., Mouton, P. R., Calhoun, M. E., Semendeferi, K., Ahrens-Barbeau, C., Hallet, M. J., et al. (2011). Neuron number and size in prefrontal cortex of children with autism. JAMA 306, 2001–2010. doi: 10.1001/jama.2011.1638
Dell'Acqua, F., Rizzo, G., Scifo, P., Clarke, R. A., Scotti, G., and Fazio, F. (2007). A model-based deconvolution approach to solve fiber crossing in diffusion-weighted MR imaging. IEEE Trans. Biomed. Eng. 54, 462–472. doi: 10.1109/TBME.2006.888830
Dell'Acqua, F., Simmons, A., Williams, S. C., and Catani, M. (2013). Can spherical deconvolution provide more information than fiber orientations? Hindrance modulated orientational anisotropy, a true-tract specific index to characterize white matter diffusion. Hum. Brain Mapp. 34, 2464–2483. doi: 10.1002/hbm.22080
Geschwind, D. H., and State, M. W. (2015). Gene hunting in autism spectrum disorder: on the path to precision medicine. Lancet Neurol. 14, 1109–1120. doi: 10.1016/S1474-4422(15)00044-7
Hazlett, H. C., Poe, M. D., Gerig, G., Styner, M., Chappell, C., Smith, R. G., et al. (2011). Early brain overgrowth in autism associated with an increase in cortical surface area before age 2 years. Arch. Gen. Psychiatry 68, 467–476. doi: 10.1001/archgenpsychiatry.2011.39
Holland, D., Kuperman, J. M., and Dale, A. M. (2010). Efficient correction of inhomogeneous static magnetic field-induced distortion in Echo Planar Imaging. Neuroimage 50, 175–183. doi: 10.1016/j.neuroimage.2009.11.044
Hutsler, J. J., and Casanova, M. F. (2016). Review: cortical construction in autism spectrum disorder: columns, connectivity and the subplate. Neuropathol. Appl. Neurobiol. 42, 115–134. doi: 10.1111/nan.12227
Hutsler, J. J., Love, T., and Zhang, H. (2007). Histological and magnetic resonance imaging assessment of cortical layering and thickness in autism spectrum disorders. Biol. Psychiatry 61, 449–457. doi: 10.1016/j.biopsych.2006.01.015
Hutsler, J. J., and Zhang, H. (2010). Increased dendritic spine densities on cortical projection neurons in autism spectrum disorders. Brain Res. 1309, 83–94. doi: 10.1016/j.brainres.2009.09.120
Huttenlocher, P. R., and Dabholkar, A. S. (1997). Regional differences in synaptogenesis in human cerebral cortex. J. Comp. Neurol. 387, 167–178.
Jelescu, I. O., Veraart, J., Adisetiyo, V., Milla, S. S., Novikov, D. S., and Fieremans, E. (2015). One diffusion acquisition and different white matter models: how does microstructure change in human early development based on WMTI and NODDI? Neuroimage 107, 242–256. doi: 10.1016/j.neuroimage.2014.12.009
Jensen, J. H., Helpern, J. A., Ramani, A., Lu, H., and Kaczynski, K. (2005). Diffusional kurtosis imaging: the quantification of non-gaussian water diffusion by means of magnetic resonance imaging. Magn. Reson. Med. 53, 1432–1440. doi: 10.1002/mrm.20508
Jespersen, S. N., Kroenke, C. D., Østergaard, L., Ackerman, J. J. H., and Yablonskiy, D. A (2007). Modeling dendrite density from magnetic resonance diffusion measurements. Neuroimage 34, 1473–1486. doi: 10.1016/j.neuroimage.2006.10.037
Jian, B., and Vemuri, B. C. (2007). A unified computational framework for deconvolution to reconstruct multiple fibers from diffusion weighted MRI. IEEE Trans. Med. Imaging 26, 1464–1471. doi: 10.1109/TMI.2007.907552
Jovicich, J., Czanner, S., Greve, D., Haley, E., van der Kouwe, A., Gollub, R., et al. (2006). Reliability in multi-site structural MRI studies: effects of gradient non-linearity correction on phantom and human data. Neuroimage 30, 436–443. doi: 10.1016/j.neuroimage.2005.09.046
Kaden, E., Knosche, T. R., and Anwander, A. (2007). Parametric spherical deconvolution: inferring anatomical connectivity using diffusion MR imaging. Neuroimage 37, 474–488. doi: 10.1016/j.neuroimage.2007.05.012
Kemper, T. L., and Bauman, M. (1998). Neuropathology of infantile autism. J. Neuropathol. Exp. Neurol. 57, 645–652.
Lazar, M., Miles, L. M., Babb, J. S., and Donaldson, J. B. (2014). Axonal deficits in young adults with High Functioning Autism and their impact on processing speed. Neuroimage Clin. 4, 417–425. doi: 10.1016/j.nicl.2014.01.014
Le Bihan, D. (2012). Diffusion, confusion and functional MRI. Neuroimage 62, 1131–1136. doi: 10.1016/j.neuroimage.2011.09.058
Lord, C., Rutter, M., DiLavore, P., and Risi, S. (2001). Autism Diagnostic Observation Schedule. Los Angeles, CA: Western Psychological Services.
Lu, H., Jensen, J. H., Ramani, A., and Helpern, J. A. (2006). Three-dimensional characterization of non-gaussian water diffusion in humans using diffusion kurtosis imaging. NMR Biomed. 19, 236–247. doi: 10.1002/nbm.1020
Morgan, J. T., Chana, G., Pardo, C. A., Achim, C., Semendeferi, K., Buckwalter, J., et al. (2010). Microglial activation and increased microglial density observed in the dorsolateral prefrontal cortex in autism. Biol. Psychiatry 68, 368–376. doi: 10.1016/j.biopsych.2010.05.024
Oldfield, R. C. (1971). The assessment and analysis of handedness: the Edinburgh inventory. Neuropsychologia 9, 97–113.
Palmen, S. J. M. C., van Engeland, H., Hof, P. R., and Schmitz, C. (2004). Neuropathological findings in autism. Brain 127, 2572–2583. doi: 10.1093/brain/awh287
Raffelt, D., Tournier, J. D., Rose, S., Ridgway, G. R., Henderson, R., Crozier, S., et al. (2012). Apparent Fibre Density: a novel measure for the analysis of diffusion-weighted magnetic resonance images. Neuroimage 59, 3976–3994. doi: 10.1016/j.neuroimage.2011.10.045
Rutter, M., Lord, C., and LeCouteur, A. (1995). Autism Diagnostic Interview – R. Chicago, IL: Department of Psychiatry, University of Chicago.
Schumann, C. M., and Amaral, D. G. (2006). Stereological analysis of amygdala neuron number in autism. J. Neurosci. 26, 7674–7679. doi: 10.1523/JNEUROSCI.1285-06.2006
Schumann, C. M., Bloss, C. S., Barnes, C. C., Wideman, G. M., Carper, R. A., Akshoomoff, N., et al. (2010). Longitudinal magnetic resonance imaging study of cortical development through early childhood in autism. J. Neurosci. 30, 4419–4427. doi: 10.1523/JNEUROSCI.5714-09.2010
Schumann, C. M., and Nordahl, C. W. (2011). Bridging the gap between MRI and postmortem research in autism. Brain Res. 1380, 175–186. doi: 10.1016/j.brainres.2010.09.061
Smith, S. M. (2002). Fast robust automated brain extraction. Hum. Brain Mapp. 17, 143–155. doi: 10.1002/hbm.10062
Suzuki, K., Sugihara, G., Ouchi, Y., Nakamura, K., Futatsubashi, M., Takebayashi, K., et al. (2013). Microglial activation in young adults with autism spectrum disorder. JAMA Psychiatry 70, 49–58. doi: 10.1001/jamapsychiatry.2013.272
Tournier, J. D., Calamante, F., Gadian, D. G., and Connelly, A. (2004). Direct estimation of the fiber orientation density function from diffusion-weighted MRI data using spherical deconvolution. Neuroimage 23, 1176–1185. doi: 10.1016/j.neuroimage.2004.07.037
van Kooten, I. A., Palmen, S. J., von Cappeln, P., Steinbusch, H. W., Korr, H., Heinsen, H., et al. (2008). Neurons in the fusiform gyrus are fewer and smaller in autism. Brain 131, 987–999. doi: 10.1093/brain/awn033
Vargas, D. L., Nascimbene, C., Krishnan, C., Zimmerman, A. W., and Pardo, C. A. (2005). Neuroglial activation and neuroinflammation in the brain of patients with autism. Ann. Neurol. 57, 67–81. doi: 10.1002/ana.20315
Wechsler, D. (1999). Wechsler Abbreviated Scale of Intelligence. San Antonio, TX: Psychological Corporation.
Wegiel, J., Kuchna, I., Nowicki, K., Imaki, H., Wegiel, J., Marchi, E., et al. (2010). The neuropathology of autism: defects of neurogenesis and neuronal migration, and dysplastic changes. Acta Neuropathol. 119, 755–770. doi: 10.1007/s00401-010-0655-4
White, N. S., Leergaard, T. B., D'Arceuil, H., Bjaalie, J. G., and Dale, A. M. (2013). Probing tissue microstructure with restriction spectrum imaging: Histological and theoretical validation. Hum. Brain Mapp. 34, 327–346.
White, N. S., Mcdonald, C. R., Farid, N., Kuperman, J., Karow, D., Schenker-Ahmed, N. M., et al. (2014). Diffusion-weighted imaging in cancer: physical foundations and applications of restriction spectrum imaging. Cancer Res. 74, 4638–4652. doi: 10.1158/0008-5472.CAN-13-3534
Winston, G. P., Micallef, C., Symms, M. R., Alexander, D. C., Duncan, J. S., and Zhang, H. (2014). Advanced diffusion imaging sequences could aid assessing patients with focal cortical dysplasia and epilepsy. Epilepsy Res. 108, 336–339. doi: 10.1016/j.eplepsyres.2013.11.004
Zhang, H., Schneider, T., Wheeler-Kingshott, C. A., and Alexander, D. C. (2012). NODDI: practical in vivo neurite orientation dispersion and density imaging of the human brain. Neuroimage 61, 1000–1016. doi: 10.1016/j.neuroimage.2012.03.072
Zhuang, J., Hrabe, J., Kangarlu, A., Xu, D., Bansal, R., Branch, C. A., et al. (2006). Correction of eddy-current distortions in diffusion tensor images using the known directions and strengths of diffusion gradients. J. Magn. Reson. Imaging 24, 1188–1193. doi: 10.1002/jmri.20727
Zikopoulos, B., and Barbas, H. (2010). Changes in prefrontal axons may disrupt the network in autism. J. Neurosci. 30, 14595–14609. doi: 10.1523/JNEUROSCI.2257-10.2010
Keywords: autism, diffusion, MRI, cerebral cortex, neurite, DTI, gray matter, connectivity
Citation: Carper RA, Treiber JM, White NS, Kohli JS and Müller R-A (2017) Restriction Spectrum Imaging As a Potential Measure of Cortical Neurite Density in Autism. Front. Neurosci. 10:610. doi: 10.3389/fnins.2016.00610
Received: 01 February 2016; Accepted: 26 December 2016;
Published: 18 January 2017.
Edited by:
Roma Siugzdaite, Ghent University, BelgiumReviewed by:
Pew-Thian Yap, University of North Carolina at Chapel Hill, USABen Jeurissen, University of Antwerp, Belgium
Copyright © 2017 Carper, Treiber, White, Kohli and Müller. This is an open-access article distributed under the terms of the Creative Commons Attribution License (CC BY). The use, distribution or reproduction in other forums is permitted, provided the original author(s) or licensor are credited and that the original publication in this journal is cited, in accordance with accepted academic practice. No use, distribution or reproduction is permitted which does not comply with these terms.
*Correspondence: Ruth A. Carper, cmNhcnBlckBtYWlsLnNkc3UuZWR1