 Robert X. Smith
 Kay Jann
 Mirella Dapretto3
 Danny J. J. Wang
- 1NeuroImaging Laboratories (NIL) at Washington University School of Medicine, Washington University in Saint Louis, Saint Louis, MO, United States
- 2Keck School of Medicine of USC, University of Southern California, Los Angeles, CA, United States
- 3Department of Psychiatry and Biobehavioral Sciences, University of California Los Angeles, Los Angeles, CA, United States
Background: Two approaches to understanding the etiology of neurodevelopmental disorders such as Autism Spectrum Disorder (ASD) involve network level functional connectivity (FC) and the dynamics of neuronal signaling. The former approach has revealed both increased and decreased FC in individuals with ASD. The latter approach has found high frequency EEG oscillations and higher levels of epilepsy in children with ASD. Together, these findings have led to the hypothesis that atypical excitatory-inhibitory neural signaling may lead to imbalanced association pathways. However, simultaneously reconciling local temporal dynamics with network scale spatial connectivity remains a difficult task and thus empirical support for this hypothesis is lacking.
Methods: We seek to fill this gap by combining two powerful resting-state functional MRI (rs-fMRI) methods—functional connectivity (FC) and wavelet-based regularity analysis. Wavelet-based regularity analysis is an entropy measure of the local rs-fMRI time series signal. We examined the relationship between the RSN entropy and integrity in individuals with ASD and controls from the Autism Brain Imaging Data Exchange (ABIDE) cohort using a putative set of 264 functional brain regions-of-interest (ROI).
Results: We observed that an imbalance in intra- and inter-network FC across 11 RSNs in ASD individuals (p = 0.002) corresponds to a weakened relationship with RSN temporal entropy (p = 0.02). Further, we observed that an estimated RSN entropy model significantly distinguished ASD from controls (p = 0.01) and was associated with level of ASD symptom severity (p = 0.003).
Conclusions: Imbalanced brain connectivity and dynamics at the network level coincides with their decoupling in ASD. The association with ASD symptom severity presents entropy as a potential biomarker.
Introduction
Autism spectrum disorder (ASD) impacts the neurodevelopment of networks underlying social function and communication as well as sensorimotor abilities (APA, 1994). ASD has been linked to imbalanced functional connectivity (FC) in the brain (Jeste, 2011). FC measures synchronous neuronal signaling and has been used to identify several resting-state networks (RSNs) (Greicius et al., 2004; Seeley et al., 2009). Studies have reported intra- and inter-network FC among several RSNs to be either reduced (Villalobos et al., 2005; Welchew et al., 2005; Kana et al., 2006, 2007; Kleinhans et al., 2008; Uddin et al., 2013) or increased (Anderson et al., 2011; Supekar et al., 2013; Uddin et al., 2013) in ASD. Most work has focused on intra-network FC for specific RSNs. Notably, several studies have reported that the Default Mode Network (DMN), a set of brain regions that exhibit increased activity in the absence of an external stimuli (Raichle and MacLeod, 2001), exhibits both increased and decreased FC in ASD (Jann et al., 2015). However, research focused on a specific network is inherently limited at delineating the mechanisms of brain disruption at the global level. A growing number of reports have also shown that inter-network FC is also strongly impacted in ASD (Belmonte et al., 2004; Courchesne et al., 2007; Rudie et al., 2013; Cerliani et al., 2015).
Imbalance of excitation and inhibition within neural microcircuitry may impair the formation of intra- and inter-network connections that typify the segregation of RSNs during typical neurodevelopment. Hyper-excitability (elevated excitation/inhibition balance) has been hypothesized (E/I hypothesis) as an underlying mechanism for behavioral deficits in ASD (Rubenstein and Merzenich, 2003; Chao et al., 2010; Vattikuti and Chow, 2010; Yizhar et al., 2011). However, reconciling cortical dynamics with spatial network connectivity remains a difficult task. Resting-state functional MRI (rs-fMRI) is a widely used method offering a balance between temporal and spatial resolution. The rs-fMRI time series signal represents intrinsic blood oxygen level dependent (BOLD) activity that is correlated with neuronal activation (Logothetis et al., 2001). Evidence of spontaneous BOLD fluctuations suggests that stochastic processes govern neuronal activity (He et al., 2010). However, most studies investigate brain connectivity using FC analysis (e.g., mean intra- and inter-network correlations) which carries little information about the dynamic structure typifying neuronal activity. The relationship between FC and brain dynamics in ASD is not well-understood.
Recently, non-linear statistical measures based on approximate entropy (Pincus, 1991) and sample entropy (Richman and Moorman, 2000; Costa et al., 2002) have been used to investigate the dynamic structure and complexity of the brain by characterizing the recurring patterns of temporal fluctuations (Smith et al., 2014). A time series containing many repetitive patterns has relatively small entropy. Conversely, a time series containing few repetitive patterns has a higher entropy. Entropy studies have shown changes in dynamics in aging (Liu et al., 2012; Yang et al., 2013a), Alzheimer's disease (Yang et al., 2013b), schizophrenia (Takahashi et al., 2010), and depression (Pei-Shan Ho et al., 2018). Here we investigate the relationship between FC and brain dynamics at the network level using a recently developed wavelet-based regularity analysis (Smith et al., 2015). This approach to assess network dynamics is based on noise estimation capabilities of the wavelet transform to measure recurrent temporal pattern stability within the rs-fMRI signal across multiple temporal scales. The method consists of performing a stationary wavelet transform (SWT) to preserve signal structure, followed by construction of “lagged” subsequences to adjust for correlated features, and finally the calculation of sample entropy across wavelet scales based on an “objective” estimate of noise level at each scale.
Previous applications of wavelet-based regularity analysis showed the DMN, the most ‘active' areas of the brain at rest (De Luca et al., 2006), exhibited higher rs-fMRI signal entropy than rest of the brain (Smith et al., 2015). This suggested increased rs-fMRI signal activity is characterized by not only increased amplitudes, but also more complex trajectories through a diverse array of temporal patterns. Further investigation of wavelet-based regularity suggested it may be sensitive to neurobiological changes that underscore cognitive dysfunction. Specifically, widespread entropy differences in the DMN and executive control networks were detected between individuals with mild cognitive impairment and healthy controls. Taken together, these observations suggest wavelet-based regularity analysis is a promising measure of the rs-fMRI signal's dynamic structure.
Leveraging the spatial resolution of rs-MRI, we use machine learning to model the FC-entropy relationship across cortical and subcortical RSNs. We hypothesized that FC measures would be associated with RSN entropy in both ASD and TD participants. However, per the E/I hypothesis, we expected the FC-entropy relationship to be significantly weaker in ASD participants.
Methods
Participants
Resting-state fMRI (rs-fMRI) and structural imaging data of 85 individuals with ASD and 163 matched controls from multiple sites of the ABIDE data set (Di Martino et al., 2014) were included in this study for a total of N = 248 individuals. Inclusion criteria were: (A) a T1-weighted structural MRI image, (B) a resting-state functional MRI (rs-fMRI) with full cortical coverage, (C) a full-scale IQ > 100, and (D) a mean framewise displacement (FD)(Power et al., 2012) of >0.10 mm. Additionally, individuals for a site were included if a total of at least 7 ASD and 7 control participants met the above inclusion criteria. Demographic information is summarized in Table 1. Details of acquisition, informed consent, site-specific protocols, specific diagnostic criteria for each data set can be found at the ABIDE website http://fcon_1000.projects.nitrc.org/indi/abide/index.html. Institutional Review Board approval was provided by each site.

Table 1. Eighty-five individuals with ASD (18.0 yrs, 76 male, IQ = 117, FD = 0.065) and 163 TD children (17.4 yrs, 132 male, IQ = 115.8, FD = 0.064).
MRI Data Analysis
Structural MRI
T1-weighted structural images were transformed to standard Montreal Neurological Institute (MNI) 2 mm space using the suite of tools available in the FMRIB software library (FSL) 5.0.9 (http://www.fmrib.ox.ac.uk/fsl/). First, skull stripping was performed using the brain extraction tool [BET (Smith, 2002)]. Second, a 12 degrees-of-freedom affine transform from the brain extracted structural image to the MNI 2 mm reference image using FMRIB's linear image registration tool (FLIRT) (Jenkinson et al., 2002). The computed affine transform was applied to the original (non-brain extracted) structural image. Finally, non-linear warping was applied to the linearly registered original structural image using the FMRIB's non-linear image registration tool (FNIRT) (Andersson et al., 2007). Tissue segmentation was performed using FMRIB's automated segmentation tool (FAST) (Zhang et al., 2001). White matter and ventricle masks were created for later use in rs-fMRI nuisance regression. Visual inspection was performed at each stage for each individual to ensure successful brain extraction, tissue segmentation, and normalization.
Resting-State Functional MRI (rs-fMRI)
The rs-fMRI data were pre-processed as follows. First, correction for rigid body head motion was conducted using motion correction FLIRT (MCFLIRT) (Jenkinson et al., 2002) (default parameters, with final sinc interpolation). Second, an individual's mean rs-fMRI image was aligned with their structural image via a 7 degree-of-freedom affine registration using FLIRT, and the transformation was applied to all volumes in the time series. Frames with excessive motion were identified and scrubbed (Power et al., 2012) if the framewise displacement exceeded 0.3 mm. Individuals with >10% of their frames flagged for scrubbing were excluded. The mean framewise displacement of controls (FD = 0.064) was not significantly different (W = 7,135, p = 0.74; Table 1) compared to ASD participants (FD = 0.065) as determined by the Wilcoxon rank-sum test. The time series was band-pass filtered removing >0.1 and < 0.01 Hz. Lastly, voxel times series were linear detrended, and reduction of spurious variance was implemented by linear regression of nuisance waveforms derived from head motion (including motion derivatives) and ROI extracted time series in white matter, cerebrospinal fluid (CSF), and global signal. White matter and CSF time series were obtained similar to Chang and Glover (2009) by reverse-normalizing 6 mm spheres at MNI coordinates (26, −12, 35) and (19, −33, 18), respectively, to the native space of each individual. Individual specific white matter and ventricle masks were used to ensure no signal of interest in gray matter was included. Spatially smoothing was performed at the end with a 7 mm FWHM Gaussian filter.
Functional Connectivity Principal Components Analysis
An intra- and inter-network-wise method for analyzing distributed connectivity patterns was employed. Our analyses focused on a putative set of 264 functional regions-of-interest (ROIs) previously organized into 11 RSNs (Power et al., 2011). ROIs were defined as 10 mm diameter spheres whose center coordinates are given in MNI atlas space (Power et al., 2011). For each individual, we computed a 264 × 264 FC matrix by: (i) MNI atlas transformation of the pre-processed functional data, (ii) computation of the mean voxel time series within each ROI, (iii) and computation of the pairwise correlation between all ROI time series.
Data reduction was performed in two steps to isolate a metric of distributed FC changes. First, using each ROI's RSN designation (Power et al., 2011), we computed the average intra- and inter-network correlation for each RSN yielding a reduced 11 × 11 matrix for each individual. The 11 intra-network and inter-network averages (total of 11+55 = 66) were compiled for all N = 248 individuals into a single 248 × 66 matrix M. Second, a principal component analysis (PCA) of the matrix M was performed by singular value decomposition (SVD):
PCA is a simple eigenvector-based multivariate analysis that reveals the internal data structure in a way that best explains its variance. A single PCA including both control and ASD individuals provides a set of components common to both groups. This avoids the latent root and vector problem (Krzanowski, 1979) that occurs when separate PCAs are performed for each group. The principal components cn = UA were obtained by projection of the RSN averages onto the principal vectors V. The primary component, c1, was selected. c1-values vary along the primary vector V1. Variation along this vector explained 29% of the inter-individual RSN variance.
Wavelet-Based Regularity Analysis
We computed the entropy, H, of the mean rs-fMRI time series for the same 264 ROIs used in the FC analysis using a previously developed wavelet-based regularity analysis (Smith et al., 2015). This approach is sensitive to, in addition to any non-linear structure, the presence of intrinsic non-stationary processes (i.e., how variable the moments of the signal distribution are over time) within the rs-fMRI signal (Chang and Glover, 2009). Non-stationary structure is preserved with high fidelity across multiple scales using the SWT using the WaveLab850 toolbox (Buckheit et al., 2005). The time series noise level is estimated from the highest frequency subband using wavelet-based de-noising schemes (Donoho and Johnstone, 1994; Donoho, 1995; Chang et al., 2000) and used to tune sensitivity to the entropy of the intrinsic signal. The regularity with which rs-fMRI signal patterns recur is measured with Sample Entropy (Pincus, 1991):
where recurrence probability of m-length subsequences within a tolerance distance r is given by:
Nm is the number of subsequences, Θ is the Heaviside function, and r = r0σ+t is the distance threshold for pattern similarity that depends on a scaling r0 of the time series standard deviation σ and a scale-dependent threshold t based on the BayesShrink approach (Chang et al., 2000). Patterns were constructed from time-delayed points to account for the serial correlations present in rs-fMRI data. Pattern lengths were kept small to increase the total number of patterns and improve the statistical power. In this study, patterns of length m(+1) = 1(2) were compared using a distance threshold of r0 = 0.2. The distance threshold, r0, was selected using a procedure described previously (Smith et al., 2015). The entropy was computed for a range of thresholds, 0.1–0.3 with 0.05 increments. The r0-value the maximized the range of observed entropy values across all individuals was selected. The mean entropy across two scales (0.031–0.063 and 0.063–0.13 Hz) for each of the 11 RSNs was obtained for each individual. The dyadic wavelet scales are based on the number of time points. Here, the scales most sensitive to the 0.01–0.10 Hz frequency band, where most slow-wave neuronal activity occurs, were selected.
Patterns containing one or more flagged frames were removed from consideration. Specifically, a binary time series for each individual equal in length to the rs-fMRI frames. Time points equaled one if a frame was flagged for excessive motion. A SWT was applied to this binary series. For each scale, m-length patterns were formed using the same parameters to form patterns for the rs-fMRI series. If any value in these patterns equal one, then the corresponding rs-fMRI pattern is removed from the wavelet-base regularity analysis.
Multilinear Regression Model
ASD and controls were pooled together and a multilinear regression model was used to evaluate the relationship between c1 (FC PCA scores) and RSN entropies, H. Specifically, we modeled c1 as:
where XH is the 248 × 11 matrix of network entropies for the 11 RSNs for all 248 individuals (both ASD and control), β are the model coefficients to be estimated, and ε are the residuals to be minimized. Importantly, no information about group membership (i.e., ASD or control) has been explicitly passed to the model.
Elastic net regularization was performed to avoid overfitting using the “glmnet” package (Friedman et al., 2010) within the R statistical computing language (R Core Team, 2017). Elastic net regularization is a common machine learning approach to building linear models that combines L1 (lasso; Tibshirani, 1996) and L2 (ridge; Tikhonov et al., 1995) regularization. L1 regularization tends to produce sparse solutions by selecting predictors strongly correlated with the outcome and zeroing out the remaining. L2 regularization is suited to deal with high collinearity among predictors. Estimated coefficients, , from elastic net regularization are formulated as:
where λ is a model complexity parameter, and α is a tradeoff between L1 (α = 1) and L2 (α = 0) regularization. values represent the importance of certain RSN entropies over others. Model validation was performed using 10-fold cross validation. A grid search for the minimum mean squared error (MSE) was performed across λ and αvalues.
Statistical Analyses
FC PCA score and entropy model distributions for ASD and control individuals were compared using the Wilcoxon rank-sum test. A post-hoc linear regression analysis was used to test for an interaction of entropy model estimates, , by group (i.e., ASD vs. controls) in predicting c1: c1 = γ0+γ1G+γ2c1H+γ3Gc1H+εr. Here γi are the regression coefficients, G is a binary variable representing ASD individuals or controls, and εr are the regression residuals. The regression coefficient γ3 measures the entropy model by group interaction and characterizes the relative model performance between groups. The associations between c1 and c1H with the individuals' ADOS-G severity scores (Lord et al., 2000) (for individuals with available scores) were computed using a Pearson correlation. The mean age difference between ASD and controls was 0.6 years, and not statistically significant (W = 6,816, p = 0.66; Table 1). As such, age was not included as a regressor to avoid loss of statistical power in detecting entropy related group differences.
Results
Imbalance in Functional Connectivity
We observed a distributed set of intra- and inter-network FC. The brain networks that exhibit the most inter-individual variation were evaluated by principal component analysis of functional connectivity matrices for ASD and control groups. The primary PCA vector V1 (Figure 1A) is positively weighted by the intra- and inter-network FC among several RSNs including the sensorimotor (SM, SM-lat), visual (VIS), auditory (AUD), dorsal attention (DAN), ventral attention (VAN), and cingulo-opercular (CO). Conversely, the intra- and inter-network FC of the default mode (DMN), salience (SAL), fronto-parietal (FP), and subcortical (SUB) RSNs were negatively weighted. FC PCA scores, c1, significantly differed between ASD and control groups (Figure 1B; W = 5,846, p = 0.04).
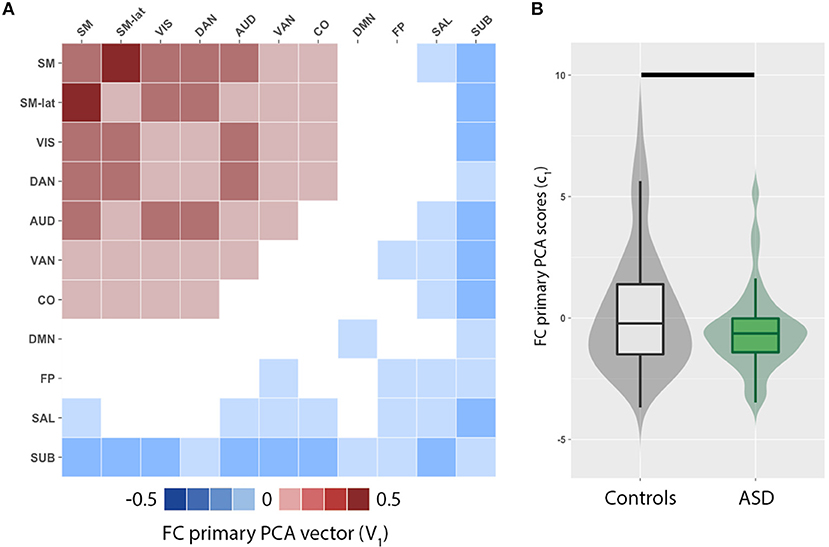
Figure 1. Principal component analysis (PCA) reveals imbalance in functional connectivity (FC) across cortical and subcortical resting-state networks (RSN). (A) Primary PCA vector, V1, is positively weighted by the intra- and inter-network FC among several RSNs including the sensorimotor (SM, SM-lat), visual (VIS), auditory (AUD), dorsal attention (DAN), ventral attention (VAN), and cingulo-opercular (CO). Conversely, the intra- and inter-network FC of the default mode (DMN), salience (SAL), fronto-parietal (FP), and subcortical (SUB) RSNs are negatively weighted. (B) Violin and box plots of the primary PCA component score distributions for controls (gray) and individuals with autism spectrum disorders (ASD; green). Horizontal black line denotes significant difference (p = 0.002).
Imbalance in Brain Entropy
To evaluate whether this imbalance in intra- and inter-network FC in ASD individuals corresponds to dynamical changes, the mean entropy for each of the 11 RSNs were included as predictors to model FC PCA scores (c1) of all individuals. First, we observed that a combination of most RSNs (Figure 2A) reliably predicted c1. The minimum MSE computed from a 10-fold cross validation was 11.4 ± 7.2% of c1 variance, and was observed for α = 0.15. The DMN exhibited the strongest weighting, but interestingly, estimated model coefficients (), for sensory networks (SM, SM-lat, VIS, AUD, SUB) were positively weighted, while higher order cognitive networks (DMN, SAL, CO, DAN, VAN, FP) were negatively weighted. Second, in a post-hoc linear regression analysis that included binary variable representing group (i.e., ASD vs. controls), we observed an interaction of group with c1H in predicting c1 (Figure 2B; γ3 = 0.82, t = 2.3, standard error = 0.35, p = 0.02). Lastly, we observed c1H were significantly different for ASD compared to controls (Figure 2C; W = 5,628, p = 0.02).
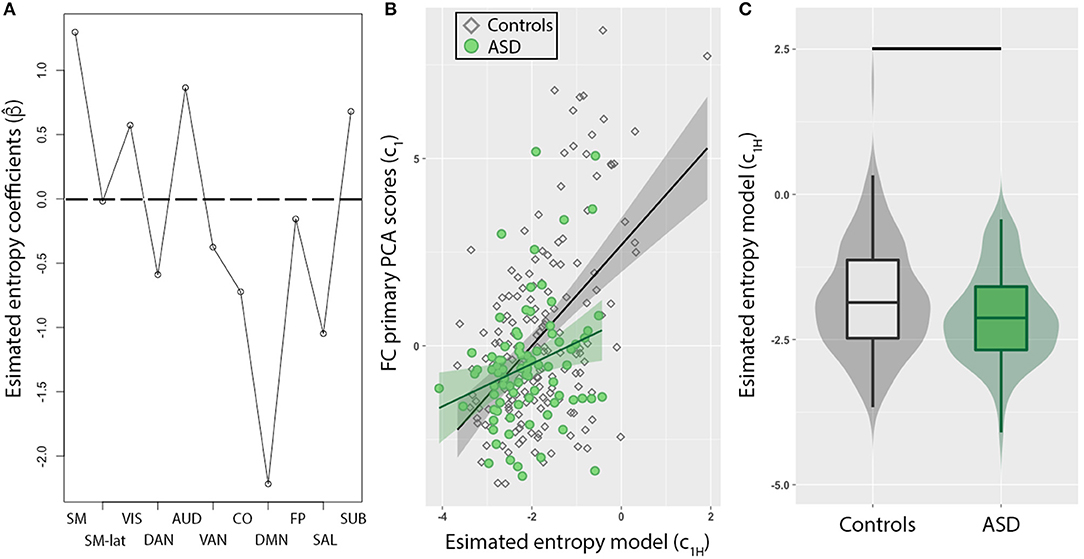
Figure 2. Resting-state network (RSN) entropy is a stronger predictor of functional connectivity (FC) for TD compared to ASD. (A) Model coefficients determined from elastic net method show sensory networks (SM, SM-lat, VIS, AUD, SUB) are positively weighted, while higher order cognitive networks (DMN, SAL, CO, DAN, VAN, FP) are negatively weighted. (B) Scatter plot showing the relationship between FC (PCA primary component projections) and entropy model for control (diamonds) and ASD (circles) individuals. The model was significantly weaker in predicting FC in ASD compared to controls (p = 0.02). (C) Box plot of entropy model distributions for control (gray) and ASD (green) groups. Horizontal black line denotes significant difference (p = 0.01).
Severity Score Association
Lastly, we found a significant negative association between the estimated model predictors (c1H) and severity scores based on the Autism Diagnostic Observation Schedule-Generic (ADOS-G; Figure 3; r = −0.31, p = 0.003). However, no association was observed between c1 and ADOS-G severity scores.
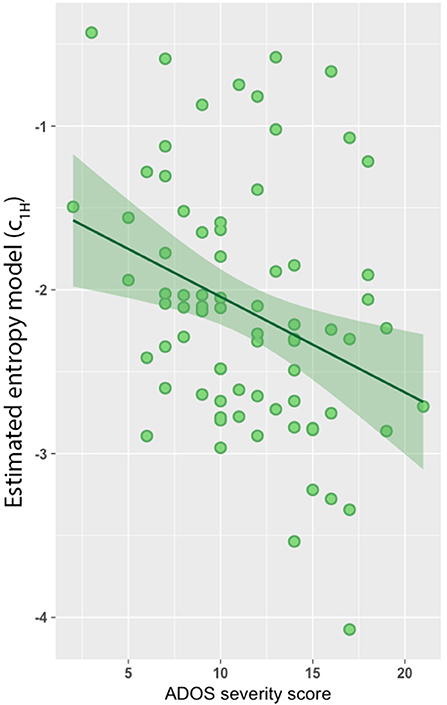
Figure 3. Entropy model predicts autism diagnostic observation schedule-generic (ADOS-G) severity score. Entropy model was negatively associated with ADOS-G severity scores (r = −0.31, p = 0.003).
Discussion
Our findings revealed distributed alterations in FC across multiple RSNs in ASD individuals. Alterations in FC were characterized by negatively weighted sensory and positively weighted cognitive RSNs, suggesting an imbalance of intra- and inter-network FC in ASD. Linear modeling of these alterations in FC revealed a significant association with alterations in brain dynamics, as measured by the time series entropy of multiple RSNs. We observed the observed FC imbalance in ASD individuals was mirrored by a similar imbalance in brain dynamics. Specifically, alterations in brain dynamics were characterized by positively weighted sensory and negatively weighted cognitive RSNs. Alterations in the brain dynamics were further associated with level of symptom severity in individuals with ASD.
Our results provide insight into the impact that ASD has on the intra- and inter-network FC balance among several RSNs. Previous studies have reported hypo-connectivity in the VIS (Villalobos et al., 2005), SM (Mostofsky et al., 2009), and DAN/VAN (Belmonte et al., 2010) networks. Conversely, hyper-connectivity of the salience (Uddin et al., 2013) and subcortical (Padmanabhan et al., 2013; Jann et al., 2015) networks have also been reported. Consistent with these reports, we find imbalanced FC may be a whole-brain phenomenon distributed across multiple RSNs. Further, the imbalanced FC largely discriminated sensory from cognitive networks. Sensory networks primarily develop early during childhood while cognitive networks continue to develop into early adulthood (Somerville et al., 2010; Petanjek et al., 2011). Altered segregation of cognitive networks (as indexed by stronger inter-network connectivity) may reflect the atypical developmental trajectories (e.g., delayed or incomplete pruning process) seen in ASD (Penzes et al., 2011).
There is rapidly growing literature on the relationship between FC and brain dynamics (Hutchison et al., 2013a,b; Allen et al., 2014; Laumann et al., 2017). Here we found that, when taken together, the dynamics of 11 RSNs reliably predicted their engagement of distributed pattern of FC. The strongest contributors to the entropy model were the DMN, SM, and SAL networks. We note, the SM and SAL contributions to both the primary PCA vector and the entropy model were strong, and in both cases opposing each other. This suggests that changes in network dynamics largely follow local FC changes. This is consistent with histological studies reporting disorganized pyramidal cells, consistent with focal cortical dysplasia, extend across many cortical columns in such a fashion that impedes coordinated signaling to other regions in ASD (Casanova, 2007; Schmitz and Rezaie, 2008; Mosconi et al., 2009; Casanova et al., 2013). Conversely, the DMN was a small contributor to the primary PCA vector, but was the largest contributor to the entropy model. This may reflect the tremendous heterogeneity that characterizes ASD (Courchesne et al., 2011). Specifically, both hypo- and hyper-connectivity have been reported within the DMN in individuals with ASD (Raichle and MacLeod, 2001), suggesting these opposing effects may have averaged each other out.
Overall, our results indicate FC and entropy provide complementary information regarding the spatiotemporal organization of the brain. Similar to FC, the entropy model discriminated sensory from cognitive networks. Interestingly our entropy model—rather than FC—was significantly associated with ASD symptom severity. Specifically, the time series signals in the negatively weighted cognitive networks (e.g., DMN, SAL) become less repetitive with increasing symptom severity, suggesting increased excitatory behavior. Conversely, the time series signals in the positively weighted sensory networks (e.g., SM, SUB) become more repetitive with increasing symptom severity. This may suggest increased inhibitory signaling associated with repetitive behaviors in ASD (Lombardo et al., 2016). Taken together, these findings point to entropy as a sensitive measure of the hypothesized excitation and inhibition imbalance underlying ASD behavioral deficits (Rubenstein and Merzenich, 2003; Chao et al., 2010; Vattikuti and Chow, 2010; Yizhar et al., 2011) and may serve as a potential biomarker.
Ethics Statement
This study was carried out in accordance with the recommendations of each sites Institutional Review Board. The protocol was approved by each sites Institutional Review Board. All subjects gave written informed consent in accordance with the Declaration of Helsinki.
Author Contributions
RS, KJ, MD, and DW contributed to the conceptualization of this paper. RS contributed data analysis. RS, KJ, MD, and DW contributed to the drafting of the manuscript.
Conflict of Interest Statement
The authors declare that the research was conducted in the absence of any commercial or financial relationships that could be construed as a potential conflict of interest.
The reviewer SA and handling editor declared their shared affiliation at time of review.
References
Allen, E. A., Damaraju, E., Plis, S. M., Erhardt, E. B., Eichele, T., and Calhoun, V. D. (2014). Tracking whole-brain connectivity dynamics in the resting state. Cereb. Cortex 24, 663–676. doi: 10.1093/cercor/bhs352
Anderson, J. S., Nielsen, J. A., Froehlich, A. L., DuBray, M. B., Druzgal, T. J., Cariello, A. N., et al. (2011). Functional connectivity magnetic resonance imaging classification of Autism. Brain 134, 3742–3754. doi: 10.1093/brain/awr263
Andersson, J., Jenkinson, M., and Smith, S. (2007). Non-linear Registration aka Spatial Normalisation. Internal Technical Report TR07JA2. Oxford: Oxford Centre for Functional Magnetic Resonance Imaging of the Brain, Department of Clinical Neurology, Oxford University. Available online at: www.fmrib.ox.ac.uk/analysis/techrep for downloading
APA (1994). Diagnostic, and Statistical Manual of Mental Disorders. Washington, DC: American Psychiatric Association.
Belmonte, M. K., Allen, G., Beckel-Mitchener, A. B., Boulanger, L. M., Carper, R. A., and Webb, S. J. (2004). Autism and abnormal development of brain connectivity. J. Neurosci. 24, 9228–9231. doi: 10.1523/JNEUROSCI.3340-04.2004
Belmonte, M. K., Gomot, M., and Baron-Cohen, S. (2010). Visual attention in Autism families: ‘unaffected' sibs share atypical frontal activation. J. Child Psychol. Psychiatry 51, 259–276. doi: 10.1111/j.1469-7610.2009.02153.x
Buckheit, J., Chen, S., Donoho, D., and Johnstone, I. (2005). Available online at: www.stat.stanford.edu:80/wavelab/
Casanova, M. F. (2007). The neuropathology of Autism. Brain Pathol. 17, 422–433. doi: 10.1111/j.1750-3639.2007.00100.x
Casanova, M. F., El-Baz, A. S., Kamat, S. S., Dombroski, B. A., Khalifa, F., Elnakib, A., et al. (2013). Focal cortical dysplasias in Autism spectrum disorders. Acta Neuropathol. Commun. 1:67. doi: 10.1186/2051-5960-1-67
Cerliani, L., Mennes, M., Thomas, R. M., Di Martino, A., Thioux, M., and Keysers, C. (2015). Increased functional connectivity between subcortical and cortical resting-state networks in Autism Spectrum Disorder. JAMA Psychiatry 72, 767–777. doi: 10.1001/jamapsychiatry.2015.0101
Chang, C., and Glover, G. (2009). Effects of model-based physiological noise correction on default mode network anti-correlations and correlations. Neuroimage 47, 1448–1459. doi: 10.1016/j.neuroimage.2009.05.012
Chang, S., Yu, B., and Vetterli, M. (2000). Adaptive wavelet thresholding for image denoising and compression. IEEE Trans. Image Process. 9, 1532–1546. doi: 10.1109/83.862633
Chao, H. T., Chen, H., Samaco, R. C., Xue, M., Chahrour, M., Yoo, J., et al. (2010). Dysfunction in GABA signalling mediates Autism-like stereotypies and Rett syndrome phenotypes. Nature 468, 263–269. doi: 10.1038/nature09582
Costa, M., Goldberger, A., and Peng, C. K. (2002). Multiscale entropy analysis of complex physiologic time series. Phys. Rev. Lett. 89:068102. doi: 10.1103/PhysRevLett.89.068102
Courchesne, E., Mouton, P. R., Calhoun, M. E., Semendeferi, K., Ahrens-Barbeau, C., Hallet, M. J., et al. (2011). Neuron number and size in prefrontal cortex of children with Autism. JAMA 306, 2001–2010. doi: 10.1001/jama.2011.1638
Courchesne, E., Pierce, K., Schumann, C. M., Redcay, E., Buckwalter, J. A., Kennedy, D. P., et al. (2007). Mapping early brain development in Autism. Neuron 56, 399–413. doi: 10.1016/j.neuron.2007.10.016
De Luca, M., Beckmann, C. F., Stefano, N., Matthews, P. M., and Smith, S. M. (2006). fMRI resting state networks define distinct modes of long-distance interactions in the human brain. Neuroimage 29, 1359–1367. doi: 10.1016/j.neuroimage.2005.08.035
Di Martino, A., Yan, C. G., Li, Q., Denio, E., Castellanos, F. X., Alaerts, K., et al. (2014). The Autism brain imaging data exchange: towards a large-scale evaluation of the intrinsic brain architecture in Autism. Mol. Psychiatry 19, 659–667. doi: 10.1038/mp.2013.78
Donoho, D. (1995). De-noising by soft-thresholding. IEEE Trans. Inform. Theor. 41, 613–627. doi: 10.1109/18.382009
Donoho, D., and Johnstone, I. (1994). Ideal spatial adaptation via wavelet shrinkage. Biometrika 81, 425–455. doi: 10.1093/biomet/81.3.425
Friedman, J., Hastie, T., and Tibshirani, R. (2010). Regularization paths for generalized linear models via coordinate descent. J. Stat. Softw. 33, 1–22. doi: 10.18637/jss.v033.i01
Greicius, M., Srivastava, G., Reiss, A., and Menon, V. (2004). Default-mode network activity distinguishes Alzheimers disease from healthy aging: evidence from functional MRI. Proc. Natl. Acad. Sci. U.S.A. 101, 4637–4642. doi: 10.1073/pnas.0308627101
He, B. J., Zempel, J. M., Snyder, A. Z., and Raichle, M. E. (2010). The temporal structures and functional significance of scale-free brain activity. Neuron 66, 353–369. doi: 10.1016/j.neuron.2010.04.020
Hutchison, R. M., Womelsdorf, T., Allen, E. A., Bandettini, P. A., Calhoun, V. D., Corbetta, M., et al. (2013a). Dynamic functional connectivity: promise, issues, and interpretations. Neuroimage 80, 360–378. doi: 10.1016/j.neuroimage.2013.05.079
Hutchison, R. M., Womelsdorf, T., Gati, J. S., Everling, S., and Menon, R. S. (2013b). Resting-state networks show dynamic functional connectivity in awake humans and anesthetized macaques. Hum. Brain Mapp. 34, 2154–2177. doi: 10.1002/hbm.22058
Jann, K., Hernandez, L. M., Beck-Pancer, D., McCarron, R., Smith, R. X., Dapretto, M., et al. (2015). Altered resting perfusion and functional connectivity of default mode network in youth with Autism Spectrum Disorder. Brain Behav. 5:e00358. doi: 10.1002/brb3.358
Jenkinson, M., Bannister, P. R., Brady, J. M., and Smith, S. M. (2002). Improved optimisation for the robust and accurate linear registration and motion correction of brain images. Neuroimage 17, 825–841. doi: 10.1006/nimg.2002.1132
Jeste, S. S. (2011). The neurology of Autism Spectrum Disorders. Curr. Opin. Neurol. 24, 132–139. doi: 10.1097/WCO.0b013e3283446450
Kana, R. K., Keller, T. A., Cherkassky, V. L., Minshew, N. J., and Just, M. A. (2006). Sentence comprehension in Autism: thinking in pictures with decreased functional connectivity. Brain 129, 2484–2493. doi: 10.1093/brain/awl164
Kana, R. K., Keller, T. A., Minshew, N. J., and Just, M. A. (2007). Inhibitory control in high-functioning Autism: decreased activation and underconnectivity in inhibition networks. Biol. Psychiatry 62, 198–206. doi: 10.1016/j.biopsych.2006.08.004
Kleinhans, N. M., Richards, T., Sterling, L., Stegbauer, K. C., Mahurin, R., Johnson, L. C., et al. (2008). Abnormal functional connectivity in Autism spectrum disorders during face processing. Brain 131, 1000–1012. doi: 10.1093/brain/awm334
Krzanowski, W. J. (1979). Between-groups comparison of principal components. J. Am. Stat. Assoc. 74, 703–707. doi: 10.1080/01621459.1979.10481674
Laumann, T. O., Snyder, A. Z., Mitra, A., Gordon, E. M., Gratton, C., Adeyemo, B., et al. (2017). On the stability of BOLD fMRI correlations. Cereb. Cortex 27, 4719–4732.
Liu, C. Y., Krishnan, A. P., Yan, L., Smith, R. X., Kilroy, E., Alger, J. R., et al. (2012). Complexity and synchronicity of resting state blood oxygenation level-dependent (bold) functional MRI in normal aging and cognitive decline. J. Magn. Reson. Imaging 38, 36–45. doi: 10.1002/jmri.23961
Logothetis, N. K., Pauls, J., Augath, M., Trinath, T., and Oeltermann, A. (2001). Neurophysiological investigation of the basis of the fMRI signal. Nature 412, 150–157. doi: 10.1038/35084005
Lombardo, M. V., Lai, M.-C., Auyeung, B., Holt, R. J., Allison, C., Smith, P., et al. (2016). Unsupervised data-driven stratification of mentalizing heterogeneity in Autism. Sci. Rep. 6:35333. doi: 10.1038/srep35333
Lord, C., Risi, S., Lambrecht, L., Cook, E. H. Jr., Leventhal, B. L., DiLavore, P. C., et al. (2000). The Autism diagnostic observation schedule-generic: a standard measure of social and communication deficits associated with the spectrum of Autism. J. Autism Dev. Disord. 30, 205–223. doi: 10.1023/A:1005592401947
Mosconi, M. W., Kay, M., D'Cruz, A.-M., Seidenfeld, A., Guter, S., Stanford, L. D., et al. (2009). Impaired inhibitory control is associated with higher-order repetitive behaviors in Autism Spectrum Disorders. Psychol. Med. 39, 1559–1566.
Mostofsky, S. H., Powell, S. K., Simmonds, D. J., Goldberg, M. C., Caffo, B., and Pekar, J. (2009). Decreased connectivity and cerebellar activity in Autism during motor task performance. Brain 132, 2413–2425. doi: 10.1093/brain/awp088
Padmanabhan, A., Lynn, A., Foran, W., Luna, B., and O'Hearn, K. (2013). Age related changes in striatal resting state functional connectivity in Autism. Front. Hum. Neurosci. 7:814. doi: 10.3389/fnhum.2013.00814
Pei-Shan Ho, S., Ho-Ling, L., Chih-Mao, H., et al. (2018). “Complexity analysis of resting state fMRI signals in depressive patients,” in 2017 39th Annual International Conference of the IEEE Engineering in Medicine and Biology Society (EMBC) (Jeju Island), 3190–3193.
Penzes, P., Cahill, M. E., Jones, K. A., VanLeeuwen, J. E., and Woolfrey, K. M. (2011). Dendritic spine pathology in neuropsychiatric disorders. Nat. Neuro 14, 285–293. doi: 10.1038/nn.2741
Petanjek, Z., Judaš, M., Šimic, G., Rasin, M. R., Uylings, H. B., Rakic, P., et al. (2011). Extraordinary neoteny of synaptic spines in the human prefrontal cortex. Proc. Natl. Acad. Sci. U.S.A. 108, 13281–13286. doi: 10.1073/pnas.1105108108
Pincus, S. (1991). Approximate entropy as a measure of system complexity. Proc. Natl. Acad. Sci. U.S.A. 88, 2297–2301. doi: 10.1073/pnas.88.6.2297
Power, J. D., Barnes, K. A., Snyder, A. Z., Schlaggar, B. L., and Petersen, S. E. (2012). Spurious but systematic correlations in functional connectivity MRI networks arise from subject motion. Neuroimage 59, 2142–2154. doi: 10.1016/j.neuroimage.2011.10.018
Power, J. D., Cohen, A. L., Nelson, S. M., Wig, G. S., Barnes, K. A., Church, J. A., et al. (2011). Functional network organization of the human brain. Neuron 72, 665–678. doi: 10.1016/j.neuron.2011.09.006
R Core Team (2017). R: A Language and Environment for Statistical Computing. Vienna: R Foundation for Statistical Computing. Available online at: https://www.R-project.org/
Raichle, M. E., and MacLeod, A. M. (2001). A default mode of brain function. Proc. Natl. Acad. Sci. U.S.A. 98, 676–682. doi: 10.1073/pnas.98.2.676
Richman, J. S., and Moorman, J. (2000). Physiological time-series analysis using approximate entropy and sample entropy. Am. J. Physiol. Heart Circ. Physiol. 278, 2039–2049. doi: 10.1152/ajpheart.2000.278.6.H2039
Rubenstein, J. L., and Merzenich, M. M. (2003). Model of Autism: increased ratio of excitation/inhibition in key neural systems. Genes Brain Behav. 2, 255–267. doi: 10.1034/j.1601-183X.2003.00037.x
Rudie, J. D., Brown, J. A., Beck-Pancer, D., Hernandez, L., Dennis, E. L., Thompson, P. M., et al. (2013). Altered functional and structural brain network organization in Autism. Neuroimage Clin. 2, 79–94. doi: 10.1016/j.nicl.2012.11.006
Schmitz, C., and Rezaie, P. (2008). The neuropathology of Autism: where do we stand? Neuropathol. Appl. Neurobiol. 34, 4–11. doi: 10.1111/j.1365-2990.2007.00872.x
Seeley, W. W., Crawford, R., Zhou, J., Miller, B., and Greicius, M. (2009). Neurodegenerative diseases target large-scale human brain networks. Neuron 62, 42–52. doi: 10.1016/j.neuron.2009.03.024
Smith, R. X., Jann, K., Ances, B., and Wang, D. J. J. (2015). Wavelet-based regularity analysis reveals recurrent spatiotemporal behavior in resting-state fMRI. Hum. Brain Mapp. 36, 3603–3620. doi: 10.1002/hbm.22865
Smith, R. X., Yan, L., and Wang, D. (2014). Multiple time scale complexity analysis of resting state fMRI. Brain Imaging Behav. 8, 284–291. doi: 10.1007/s11682-013-9276-6
Smith, S. M. (2002). Fast robust automated brain extraction. Hum. Brain Mapp. 17, 143–155. doi: 10.1002/hbm.10062
Somerville, L. H., Jones, R. M., and Casey, B. J. (2010). A time of change: behavioral and neural correlates of adolescent sensitivity to appetitive and aversive environmental cues. Brain Cogn. 72, 124–133. doi: 10.1016/j.bandc.2009.07.003
Supekar, K., Uddin, L. Q., Khouzam, A., Phillips, J., Gaillard, W. D., Kenworthy, L. E., et al. (2013). Brain hyperconnectivity in children with Autism and its links to social deficits. Cell Rep. 5, 738–747. doi: 10.1016/j.celrep.2013.10.001
Takahashi, T., Cho, R., Mizuno, T., Kikuchic, M., Takahashi, T. M. K., and Wada, Y. (2010). Antipsychotics reverse abnormal EEG complexity in drug-naive schizophrenia: a multiscale entropy analysis. Neuroimage 51, 173–182. doi: 10.1016/j.neuroimage.2010.02.009
Tibshirani, R. (1996). Regression shrinkage and selection via the lasso. J. R. Stat. Soc. B 58, 267–288.
Tikhonov, A. N., Goncharsky, A. V., Stepanov, V. V., and Yagola, A. G. (1995). Numerical Methods for the Solution of Ill-Posed Problems. Boston, MA: Kluwer Academic Publishers. doi: 10.1007/978-94-015-8480-7
Uddin, L. Q., Supekar, K., Lynch, C. J., Khouzam, A., Phillips, J., Feinstein, C., et al. (2013). Salience network-based classification and prediction of symptom severity in children with Autism. JAMA Psychiatry 70, 869–879. doi: 10.1001/jamapsychiatry.2013.104
Vattikuti, S., and Chow, C. C. (2010). A computational model for cerebral cortical dysfunction in Autism Spectrum Disorders. Biological Biol. Psychiatry 67, 672–678. doi: 10.1016/j.biopsych.2009.09.008
Villalobos, M. E., Mizuno, A., Dahl, B. C., Kemmotsu, N., and Müller, R.-A. (2005). Reduced functional connectivity between V1 and inferior frontal cortex associated with visuomotor performance in Autism. Neuroimage 25, 916–925. doi: 10.1016/j.neuroimage.2004.12.022
Welchew, D. E., Ashwin, C., Berkouk, K., Salvador, R., Suckling, J., Baron-Cohen, S., et al. (2005). Functional disconnectivity of the medial temporal lobe in Asperger's syndrome. Biol. Psychiatry 57, 991–998. doi: 10.1016/j.biopsych.2005.01.028
Yang, A. C., Huang, C. C., Yeh, H. L., Liu, M. E., Hong, C. J., Tu, P. C., et al. (2013a). Complexity of spontaneous BOLD activity in default mode network is correlated to cognitive Function in normal male elderly: a multiscale entropy analysis. Neurobiol. Aging 34, 428–438. doi: 10.1016/j.neurobiolaging.2012.05.004
Yang, A. C., Wang, S.-J., Lai, K.-L., Tsai, C. F., Yang, C. H., Hwang, J. P., et al. (2013b). Cognitive and neuropsychiatric correlates of EEG dynamic complexity in patients with Alzheimer's disease. Prog. Neuropsychopharmacol. Biol. Psychiatry 47, 52–61. doi: 10.1016/j.pnpbp.2013.07.022
Yizhar, O., Fenno, L. E., Prigge, M., Schneider, F., Davidson, T. J., O'Shea, D. J., et al. (2011). Neocortical excitation/inhibition balance in information processing and social dysfunction. Nature 477, 171–178. doi: 10.1038/nature10360
Keywords: complexity, resting-state, fMRI, connectivity, dynamics, Autism Spectrum Disorders
Citation: Smith RX, Jann K, Dapretto M and Wang DJJ (2018) Imbalance of Functional Connectivity and Temporal Entropy in Resting-State Networks in Autism Spectrum Disorder: A Machine Learning Approach. Front. Neurosci. 12:869. doi: 10.3389/fnins.2018.00869
Received: 01 June 2018; Accepted: 07 November 2018;
Published: 27 November 2018.
Edited by:
Bradley J. MacIntosh, Sunnybrook Research Institute (SRI), CanadaReviewed by:
Seok Jun Hong, Child Mind Institute, United StatesCasey Paquola, Montreal Neurological Institute and Hospital, McGill University, Canada
Sarah Atwi, Sunnybrook Research Institute (SRI), Canada
Copyright © 2018 Smith, Jann, Dapretto and Wang. This is an open-access article distributed under the terms of the Creative Commons Attribution License (CC BY). The use, distribution or reproduction in other forums is permitted, provided the original author(s) and the copyright owner(s) are credited and that the original publication in this journal is cited, in accordance with accepted academic practice. No use, distribution or reproduction is permitted which does not comply with these terms.
*Correspondence: Robert X. Smith, c21pdGgueC5yb2JlcnRAZ21haWwuY29t