 María G. García-Gomar1*†
 Christian Strong2†
 Nicola Toschi1,3
 Kavita Singh1Bruce R. Rosen1
 Lawrence L. Wald1
 Marta Bianciardi1*
- 1Department of Radiology, Athinoula A. Martinos Center for Biomedical Imaging, MGH and Harvard Medical School, Boston, MA, United States
- 2Department of Neurosurgery, Brigham and Women’s Hospital, Harvard Medical School, Boston, MA, United States
- 3Medical Physics Section, Department of Biomedicine and Prevention, Faculty of Medicine, Tor Vergata University of Rome, Rome, Italy
Despite extensive neuroimaging research of primary sensory cortices involved in auditory and visual functions, subcortical structures within these domains, such as the inferior and superior colliculi, the medial and lateral geniculate nuclei and the superior olivary complex, are currently understudied with magnetic resonance imaging (MRI) in living humans. This is because a precise localization of these nuclei is hampered by the limited contrast and sensitivity of conventional neuroimaging methods for deep brain nuclei. In this work, we used 7 Tesla multi-modal (T2-weighted and diffusion fractional anisotropy) 1.1 mm isotropic resolution MRI to achieve high sensitivity and contrast for single-subject brainstem and thalamic nuclei delineation. After precise coregistration to stereotactic space, we generated an in vivo human probabilistic atlas of auditory (medial geniculate nucleus, inferior colliculus, and superior olivary complex) and visual (lateral geniculate nucleus and superior colliculus) subcortical nuclei. We foresee the use of this atlas as a tool to precisely identify the location and shape of auditory/visual deep nuclei in research as well as clinical human studies.
Introduction
Brainstem nuclei such as the inferior colliculus (IC), superior colliculus (SC) and the superior olivary complex (SOC), as well as thalamic nuclei such as the medial geniculate nucleus (MG) and lateral geniculate nucleus (LG) modulate auditory/auditory-motor (IC, SOC and MG) and visual/oculo-motor (SC and LG) functions. These nuclei are also involved in the pathogenesis of disorders such as auditory agnosia, pure-word deafness, eye-movement and visual-field deficits, hallucinations in Parkinson’s disease, and glaucoma (Joswig et al., 2015; Pasu et al., 2015; Wang et al., 2015; Biotti et al., 2016; Lee et al., 2016). Nevertheless, a stereotaxic probabilistic structural atlas of these nuclei in living humans does not exist. This limits research and clinical (diagnostic, prognostic, pharmaceutical, surgical) studies of their structure, function and connectivity in health and disease.
We briefly review the localization and the anatomical connectivity of the aforementioned structures. The IC, an oval shaped region located in the caudal half of the mesencephalic tectum, receives inputs from several brainstem auditory pathway nuclei such as the cochlear nuclei, nuclei of the lateral lemniscus, lateral and medial superior olive as well as from the auditory cortex. One of the efferent pathways from IC projects to the deeper layers of the SC (thus coordinating eye and head orientation in response to visual/auditory stimuli) while another ascends in the brachium of the IC targeting the MG in the thalamus (Olszewski and Baxter, 2014). The SC is a gray matter nucleus located in the rostral half of the mesencephalic tectum. Its primary function is the orientation of the head toward objects of interest. The optical tract is a major afferent of this nucleus. The SC also receives projections from the parabigeminal nucleus, substantia nigra pars reticulata, zona incerta and corticotectal projections from visual cortical areas and the medial temporal cortex (Olszewski and Baxter, 2014; May, 2006). The SC plays a key role for generation of saccadic eye movements, as it projects to the paramedian pontine reticular formation through the descending predorsal bundle; meanwhile its ascending branch projects toward the interstitial nucleus of Cajal, a vertical saccade generator in the midbrain, and to the mediodorsal thalamic nucleus and the intralaminar thalamic nuclei. The major output of the SC projects toward the LG in its way to the visual cortex (Olszewski and Baxter, 2014; May, 2006). The SOC contains two principal nuclei: the medial superior olivary nucleus and the lateral superior olivary nucleus. The SOC is located in the ventrolateral border of the caudal pontine tegmentum. The function of this nucleus is to process the binaural input converging from the cochlear nuclei from the two ears. The SOC projects to the IC via the lateral lemniscus (Kulesza, 2007). The MG is the thalamic relay of the auditory pathway. It is located in the ventromedial thalamus, it receives input from the IC and projects toward the auditory cortex. Finally, the LG is the thalamic relay of the visual pathway and is located in the ventrolateral thalamus. The LG receives input form the SC and projects toward the visual cortex.
As opposed to previous work performing indirect localization of the MG and LG based on fMRI and DTI connectivity analyses (Chen et al., 1999; Bestmann et al., 2004; Kastner et al., 2004; Schneider et al., 2004; Barnes et al., 2010; Javad et al., 2014; Keifer et al., 2015), we aimed at directly localizing these and the other aforementioned nuclei from in vivo structural magnetic resonance images (MRI). Previous structural MRI work reports the automatic/semi-automatic segmentation of some thalamic nuclei at 1.5 Tesla with 3 mm resolution (Wiegell et al., 2003), including the MG and LG. Additionally, previous studies performed automatic segmentation of the LG in an attempt to compare human healthy controls to glaucoma patients using T1-weighted images acquired with 3 Tesla and 1.5 Tesla MRI with 1.30 and 1.20 mm resolution respectively (Wang et al., 2015), as well as semi-automated segmentation of the LG to characterize its morphometry at 3 Tesla and 1.5 Tesla MRI with a voxel size of 1 mm (Hernowo et al., 2011; Cecchetti et al., 2016). Nevertheless, these studies mainly focused on single-subject nuclei segmentations rather than creating in vivo human probabilistic (i.e., representative of a population) atlases of the visual and auditory thalamic/brainstem nuclei.
Both auditory and visual pathways demonstrated lower gray matter volumes in disease states relative to healthy controls (specifically, lower volume of the right IC and left hippocampus in tinnitus patients (Landgrebe et al., 2009) or lower LG volume in blind patients relative to sighted individuals (Aguirre et al., 2016)). Similarly, other studies suggest that visual deficits can be predicted by delineation of the optic tract (de Blank et al., 2018), while other studies report being able to track the optic neuritis recovery by measuring functional activation in the LG (Korsholm et al., 2007). An improved understanding of the anatomical boundaries of these nuclei may better elucidate such prognostic frameworks. Further, acoustic pathway delineation is limited by current MRI techniques (Maffei et al., 2018). In this context, an improved localization of auditory nuclei such as the MG, IC and SOC might help better characterize this pathway. Finally, LG is relevant in psychiatric diseases like schizophrenia (Mai et al., 1993; Selemon and Begovic, 2007; Dorph-Petersen et al., 2009; Buchmann et al., 2014).
The primary objective of our work was to create an in vivo probabilistic neuroimaging-based atlas of the right and left IC, SC, MG, LG and SOC using: (1) cutting-edge technology (7 Tesla MRI scanner, 32-channel receive coil-array) to maximize MRI detection sensitivity; (2) a high-resolution (1.1 mm isotropic) multi-contrast [T2-weighted and diffusion fractional anisotropy (FA)] echo-planar-imaging (EPI) approach, which provided complementary contrasts for brainstem anatomy with precisely matched geometric distortions and resolution.
Materials and Methods
MRI Data Acquisition
Data were obtained in a prior study (Bianciardi et al., 2015). While the acquisition and analysis are summarized below, full details can be found in Bianciardi et al., 2015. Twelve healthy subjects (6m/6f, age 28 ± 1 years) provided informed and written consent for 7 Tesla MRI (Magnetom, Siemens Healthineers, Germany) per Massachusetts General Hospital Institutional Review Board approval in accordance with the Declaration of Helsinki. A custom-built 32-channel receive coil and volume transmit coil was employed in data acquisition (Keil et al., 2010), providing improved sensitivity for the brainstem compared to commercial coils with a similar number of channels. The improved sensitivity of this coil was due to: (i) a more posterior arrangement of the coil elements; (ii) its shape curving around the back of the head enabling a closer proximity to the cerebellum and brainstem as opposed to commercial coils that typically extend straight down along the lower parts of the head; (iii) a more efficient flip angle calibration for lower parts of the brain because the coil extends more inferiorly than traditional coils. We utilized a common single-shot 2D echo-planar imaging scheme for 1.1 mm isotropic sagittal diffusion-tensor images (DTI), and T2-weighted images, with matrix size/GRAPPA factor/nominal echo-spacing = 180 × 240/3/0.82 ms. This provided T2-weighted anatomical images with resolution and geometric distortions perfectly matched to the DTI dataset. With the echo-planar-imaging scheme, we were also able to mitigate specific-absorption-rate limits of spin-warp T2-weighted MRI at 7 Tesla. Other specifications of DTI and T2-weighted images included: spin-echo EPI, 61 slices, echo-time/repetition-time = 60.8 ms/5.6 s, partial Fourier: 6/8, unipolar diffusion-weighting gradients (for DTI), 60 diffusion directions (for DTI, b-value ∼ 1000 s/mm2), 7 interspersed “b0” images (non-diffusion weighted, b-value ∼ 0 s/mm2, which were also utilized as T2-weighted MRI), 4 repetitions, acquisition time/repetition 6’43”. The total acquisition time for DTI and T2-weighted MRI was ∼27’. Importantly, use of unipolar (Stejskal and Tanner, 1965) rather than bipolar (Reese et al., 2003) diffusion gradients allowed shortening of the echo-time by ∼30 ms and hence provided significantly improved sensitivity of high-resolution DTI.
MRI Data Pre-processing and Alignment to MNI Space
On an individual subject basis, the diffusion FA map was calculated from the DTI acquisition concatenated across 4 repetitions and preprocessed (distortion and motion-corrected) with the Diffusion Toolbox of the FMRIB Software Library (FSL, Oxford, United Kingdom) as in Bianciardi et al. (2015). After motion correction, the 28 “b0” T2-weighted images were averaged and co-registered to DTI data via affine transformation.
Co-registration to MNI space was performed on a single-subject basis for both FA and T2-weighted images as in Bianciardi et al. (2015). Each subject’s FA image was aligned to an MNI space-based diffusion FA template (coined “IIT space”) (IIT human brain atlas, v.3, Chicago, IL, United States) (Varentsova et al., 2014). This template was utilized because it encompasses the entirety of the brainstem, is compatible with diffusion-based tractography, and provides high contrast detail in the brainstem. Specifically, we utilized the Advanced Normalization Tool (ANTs, Philadelphia, PA, United States) (Avants et al., 2011) by concatenating a generic affine and a high-dimensional non-linear warp transformation computed for images having the same modality (FA maps). The generic affine transformation was computed by concatenating center-of mass alignment (degrees of freedom, dof = 3), rigid (dof = 6), similarity (dof = 7) and fully affine (dof = 12) transformations with smoothing sigmas: 4, 2, 1, 0 voxels – fixed image space. The high-dimensional non-linear warp transformation employed a symmetric diffeomorphic normalization transformation model with smoothing sigmas: 3, 2, 1, 0 voxels – fixed image space –, and histogram image matching prior to registration. It also employed a cross correlation metric, regular sampling, gradient step size: 0.2; four multi-resolution levels: shrink factors 6, 4, 2, 1 voxels – fixed image space; data winsorization – quantiles: 0.005, 0.995; convergence criterion: slope of the normalized energy profile over the last 10 iterations <10-8. The combined transformation was then applied to both single-subject FA and T2-weighted images, using a single-interpolation step (interpolation method: linear). Single-subject FA and T2-weighted images were also aligned to MNI152 standard (non-linear 6th generation MNI152_T1_1mm available for instance in FSL) space (coined “MNI152_1mm space”), which is frequently utilized space for fMRI analysis. While the MNI152_1mm space and the IIT space are well aligned elsewhere, there is slight misalignment in the brainstem, particularly in the pons and medulla. Therefore, single-subject FA and T2-weighted images were aligned to MNI152_1mm space by applying two concatenated transformations, using a single-interpolation step (interpolation method: linear): first, the single-subject to IIT space transformation computed above; and second, the IIT to MNI152_1mm non-linear transformation computed in Bianciardi et al. (2015), using the same parameters as above.
Single-Subject Labeling and Probabilistic Atlas Generation
On a single-subject basis, two raters (C.S. and M.B. for IC, SC, and MG; M.G. and M.B for LG and SOC) independently performed a manual segmentation (fslview, FSL, Oxford, United Kingdom) of multi-contrast (FA maps and T2-weighted) images in IIT space to yield single-subject labels (i.e., masks) of the regions of interest (ICl/r, SCl/r, MGl/r, LGl/r, SOCl/r). Each rater inspected both imaging modalities simultaneously. For each nucleus in each subject, we defined a “final label” including only voxels marked by both raters (i.e., the intersection of the labels of the two raters). The manual segmentation was performed by utilizing image contrast and anatomical landmarks (Paxinos et al., 2012) as follows.
The IC was delineated based on a hypointense region in T2-weighted images located in the tectum of the midbrain, caudal to the SC on the dorsal aspect of the mesencephalon, lateral –in its dorsal aspect- to the periaqueductal gray (hyperintense in T2-weighted images), and –ventrally– to the cuneiform nucleus (hypointense in the FA map). The IC was bounded laterally by the cerebrospinal fluid. The SC was visible in the midbrain as a hypointense region on T2-weighted images, rostral to the IC, lateral to the periaqueductal gray and bounded laterally by the cerebrospinal fluid. The MG was identified as a small rounded/oval shaped eminence hypointense in T2-weighted images, adjacent to the corticospinal tract (hyperintense in the FA map), pulvinar nucleus (hypointense in T2-weighted images), LG (hypointense in FA maps), and substantia nigra (hypointense in T2-weighted images). The LG was identified as a “rainbow-shaped” ovoid structure hypointense in FA maps in the posteroinferior thalamus, located lateral to the corticospinal tract (hyperintense in the FA map), and anterolateral to the MG (hypointense in T2-weighted images). The SOC, comprising the lateral and medial superior olive, the lateroventral and medioventral periolivary nucleus, and the superior paraolivary nucleus, was identified on FA maps as a hypointense oval region dorsolateral to the central tegmental tract, and with its most caudal part posterior to the superior border of the inferior olive.
Note that, to delineate each nucleus, we mainly used the image modality (either FA or T2-weighted MRI – for instance T2-weighted MRI for IC, SC and MGN; FA for LG and SOC) that displayed the nucleus boundaries with good contrast, and employed the other modality (which had poor contrast for that nucleus – e.g., FA for IC, SC and MGN; T2-weighted MRI for LG and SOC) to identify neighboring nuclei or landmarks.
A probabilistic neuroimaging atlas in IIT space was formulated for each nucleus as an average probability map of the nucleus label encompassing all subjects (highest probability = 100% overlap of nuclei labels across subjects, n = 12). After registering the individual subject labels to MNI152_1mm space (by applying the IIT to MNI152 transformations described above, interpolation method: nearest neighbor in order to preserve label intensities), a probabilistic neuroimaging atlas in MNI152_1mm spaces of these nuclei was also formulated. The atlas was developed in both IIT and MNI152 spaces to facilitate extrapolation to structural, diffusion and functional MRI modalities.
For each subject and each final label (coregistered to single-subject native space via the inverse of the transformations described in 2.2) we also calculated the label volume in native space. We then computed the mean (s.e.) label volume across all subjects.
Atlas Validation
The probabilistic nuclei atlas was validated by computing for each nucleus and subject: (i) the inter-rater agreement, as the modified Hausdorff distance between labels delineated by the two raters; (ii) the internal consistency across subjects of the final label, as the modified Hausdorff distance between each final label and the probabilistic atlas label (thresholded at 35%) generated by averaging the labels across the other 11 subjects (leave-one-out cross validation). For both (i) and (ii), the modified Hausdorff distance (Dubuisson and Jain, 1994), a measure of spatial overlap frequently used in neuroimaging (Fischl et al., 2008; Ghosh et al., 2010; Klein et al., 2010; Yendiki et al., 2011; Augustinack et al., 2013), was calculated as follows: the minimum distance of each point within one label from the other label was averaged across all points for each label, resulting in two distance values; the maximum value of these 2 values was calculated. We also evaluated the inter-rater agreement and the internal consistency of labels with a metric more commonly used in the literature (especially for larger brain structures), the Dice similarity coefficient (Dice, 1945). The Dice similarity coefficient of two labels X and Y (e.g., of the two raters for the inter-rater agreement) is defined as (2∗|X∩Y|)/(|X| + |Y|), where |X| + |Y| are the volumes of each label and |X∩Y| is the volume of the union of the two labels. Finally, for each nucleus, the modified Hausdorff distance as well as the Dice similarity coefficient in both cases (i) and (ii) was averaged across subjects.
Results
The probabilistic neuroimaging-based structural labels in MNI space of ICl/r are shown in Figure 1. The left and right IC nuclei appeared as hypointensities compared to neighboring regions on T2-weighted MRI. The probabilistic neuroimaging-based structural labels in MNI space of SCl/r are shown in Figure 2. Again, the left and right nuclei appeared as hypointensities on T2-weighted MRI, possibly indicating a higher iron concentration compared to neighboring areas (Drayer et al., 1986). In Figure 3, we show the probabilistic atlas label in MNI space of the MGl/r. The MG was also hypointense in T2-weighted MRI. In Figure 4, we show the probabilistic atlas label in MNI space of the LGl/r, which was hypointense in the FA map. In Figure 5, we show the probabilistic atlas label in MNI space of the SOCl/r, which was an oval hypointense structure in the FA map. All the nuclei (ICl/r, SCl/r, MGl/r, LGl/r and SOCl/r) demonstrated good spatial (i.e., up to 100%) agreement of labels across subjects indicating the feasibility of delineating the probabilistic label of these nuclei in standard space.
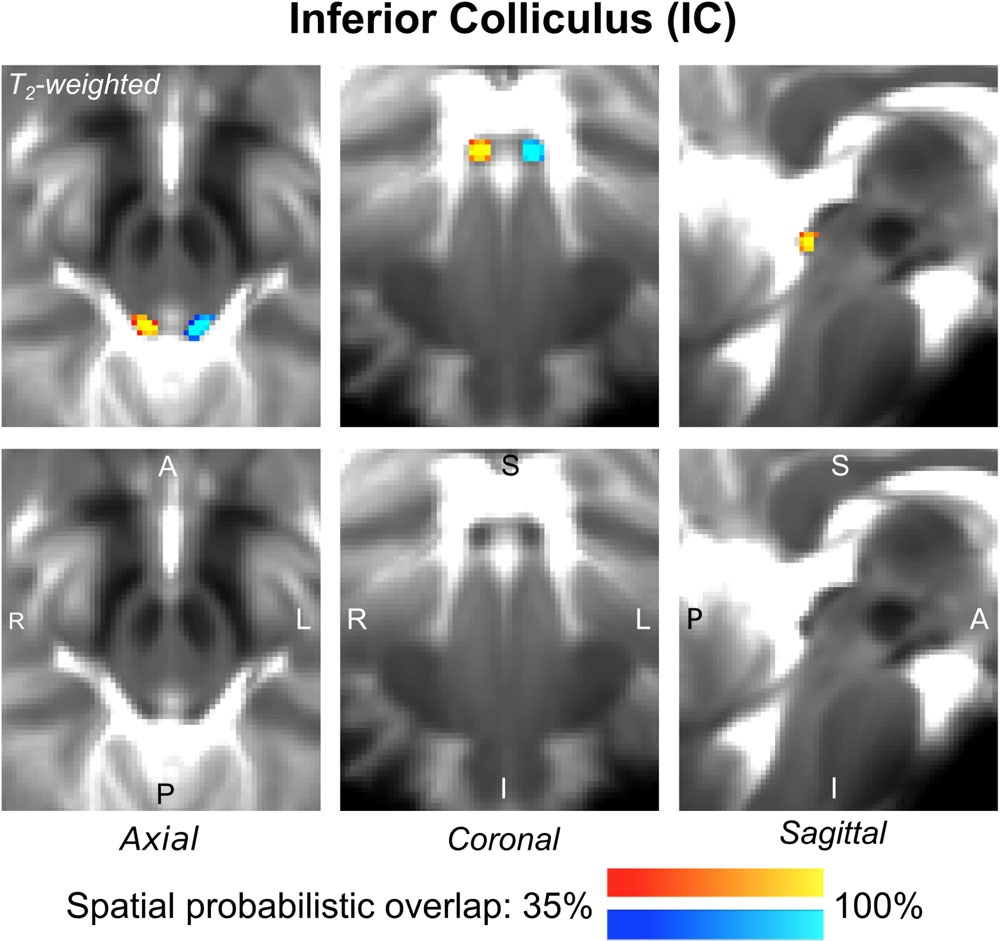
Figure 1. Probabilistic atlas label in MNI space of the IC (left: blue-to-cyan; right: red-to-yellow). The IC was hypointense in T2-weighted MRI; its label is overlaid on the group average T2-weighted image. Very good (i.e., up to 100%) spatial agreement of labels across subjects was observed indicating the feasibility of delineating the probabilistic label of this nucleus involved in auditory and auditory-motor functions.
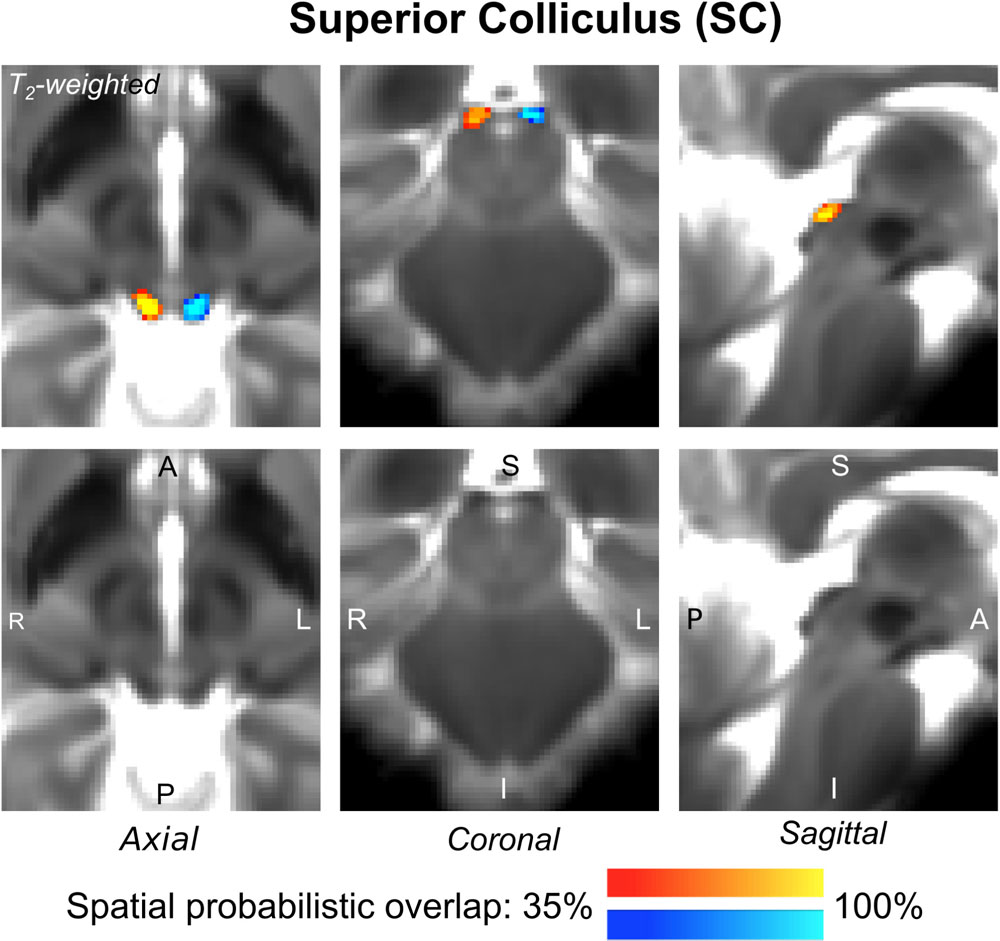
Figure 2. Probabilistic atlas label in MNI space of the SC (left: blue-to-cyan; right: red-to-yellow). The SC was hypointense in T2-weighted MRI; its label is overlaid on the group average T2-weighted image. Very good (i.e., up to 100%) spatial agreement of labels across subjects was observed indicating the feasibility of delineating the probabilistic label of this nucleus involved in visual and oculo-motor functions.
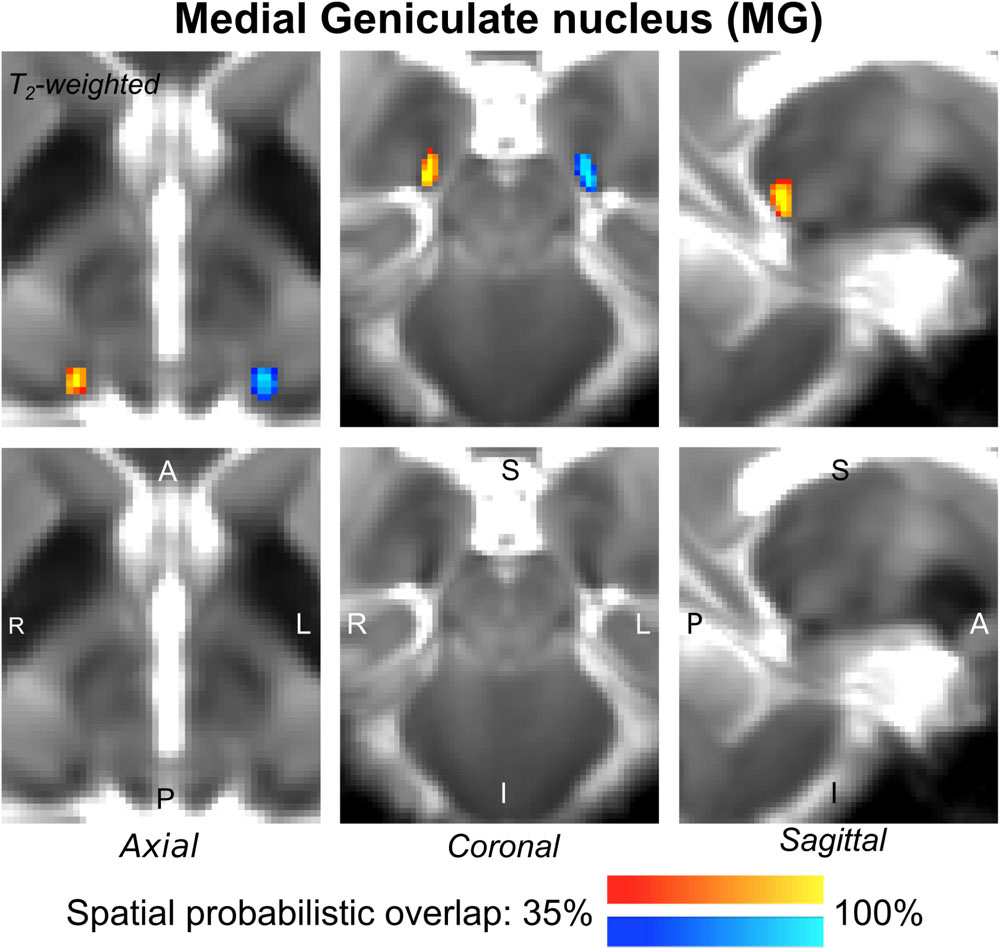
Figure 3. Probabilistic atlas label in MNI space of the MG (left: blue-to-cyan; right: red-to-yellow). The MG was hypointense in T2-weighted MRI; its label is overlaid on the group average T2-weighted image. Very good (i.e., up to 100%) spatial agreement of labels across subjects was observed indicating the feasibility of delineating the probabilistic label of this nucleus, which is a thalamic relay between the IC and the auditory cortex, and thus it is crucially involved in auditory and auditory-motor functions.
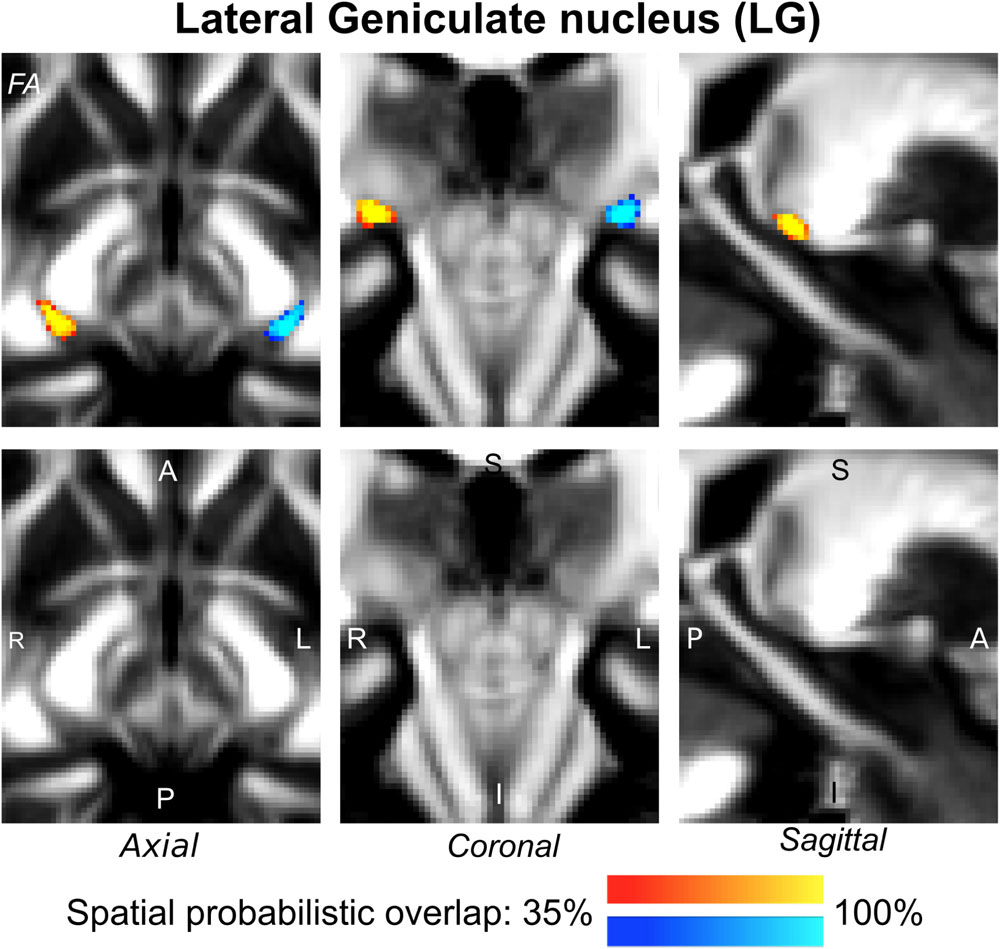
Figure 4. Probabilistic atlas label in MNI space of the LG (left: blue-to-cyan; right: red-to-yellow). The LG was hypointense in diffusion FA MRI; its label is overlaid on the group average FA map. Very good spatial (i.e., up to 100%) agreement of labels across subjects was observed indicating the feasibility of delineating the probabilistic label of this nucleus, which is a thalamic relay for visual and oculo-motor pathways.
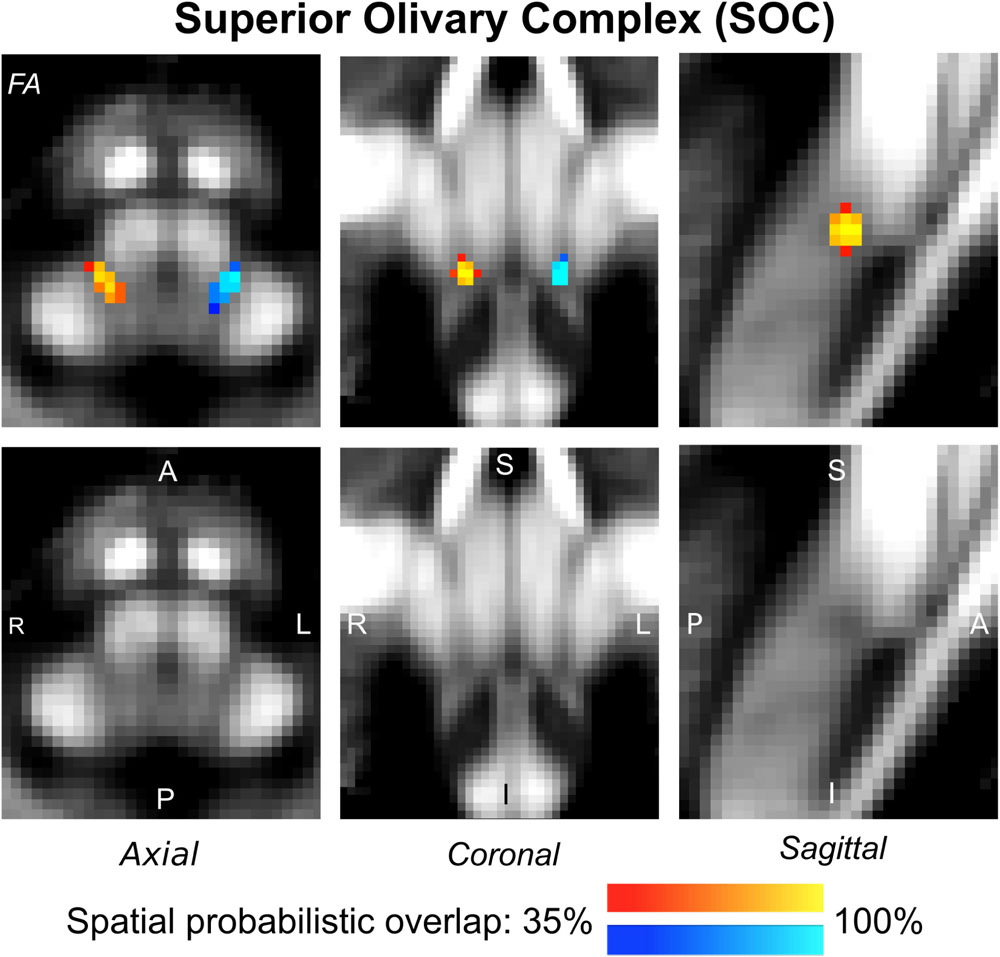
Figure 5. Probabilistic atlas label in MNI space of the SOC (left: blue-to-cyan; right: red-to-yellow). The SOC was hypointense in diffusion FA MRI; its label is overlaid on the group average FA map. Very good spatial (i.e., up to 100%) agreement of labels across subjects was observed indicating the feasibility of delineating the probabilistic label of this nucleus, which is a brainstem structure involved in auditory and auditory-motor functions.
The inter-rater label agreement and the internal consistency of each label (computed for validation) are both shown in Figure 6. For each nucleus, the average modified Hausdorff distance assessing the inter-rater agreement and the internal consistency of nuclei atlas labels (Figure 6, upper row) was below the linear spatial imaging resolution (1.1 mm) (p < 0.05, unpaired t-test), thus confirming the accuracy of the delineations of two independent raters. In addition, the Dice similarity coefficient for the inter-rater agreement and the internal consistency (Figure 6, bottom row) was always above 0.63, thus showing a good performance of both metrics.
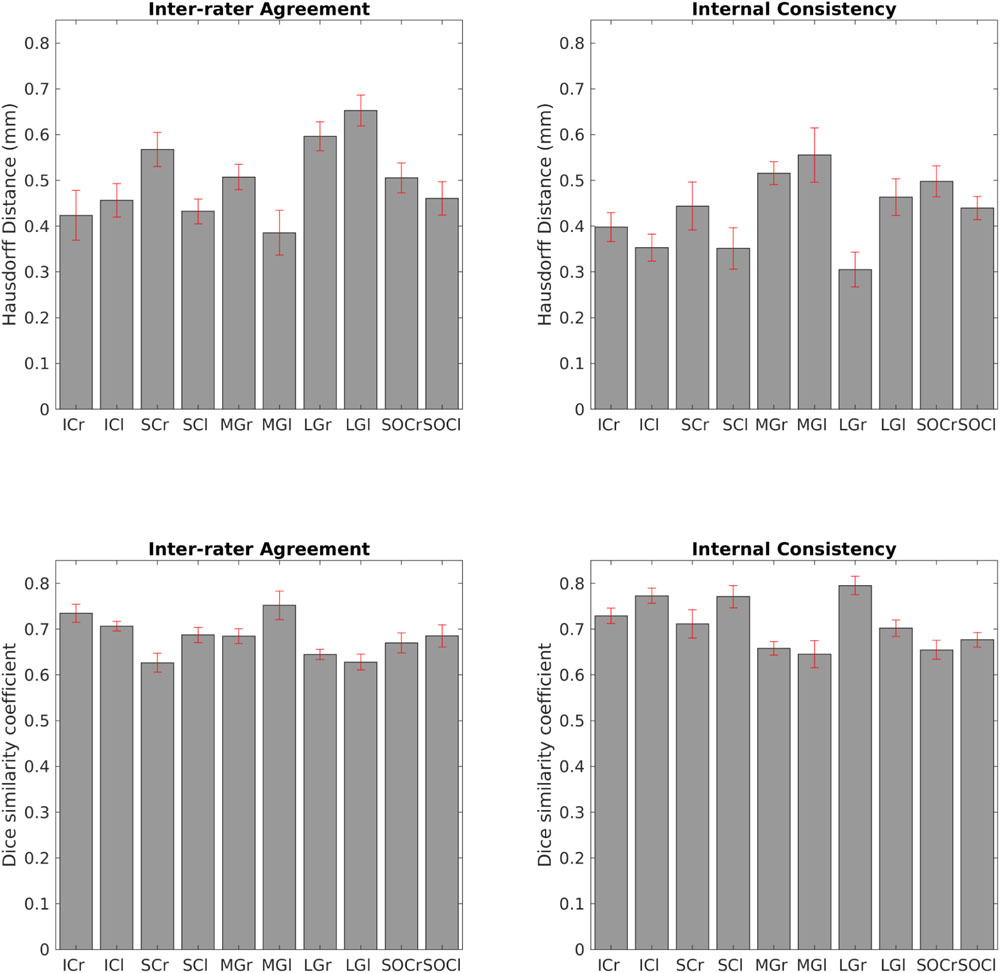
Figure 6. Atlas validation. Upper left: inter-rater agreement of nuclei labels (bar/error bar = mean/s.e. modified Hausdorff distance across 12 subjects). Upper right: internal consistency of nuclei labels across subjects (bar/errorbar = mean/s.e. modified Hausdorff distance across 12 subjects). Lower left: Dice similarity coefficient (range: 0–1) of the inter-rater agreement (bar/error bar = mean/s.e. Dice similarity coefficient across 12 subjects) Lower right: Dice similarity coefficient (range: 0–1) of the internal consistency (bar/error bar = mean/s.e. Dice similarity coefficient across 12 subjects). The labels of the IC, SC, MG, LG and SOC displayed good spatial overlap across raters and subjects (i.e., modified Hausdorff distance smaller than the imaging resolution and Dice similarity coefficient higher than 0.63), thus validating the probabilistic nuclei atlas.
In Table 1, for each nucleus we report the mean ( ± s.e.) volume (as well as volume range) across 12 subjects obtained in the present study. Furthermore, in Table 1 we also report an extensive literature review of volumes of IC, SC, MG, LG and SOC obtained in postmortem histological studies, as well as in structural and functional MRI. We mostly included studies performed in younger human adults [age between 19 and 47 years, except for two studies on older subjects (Nara et al., 1996; Sitek et al., 2019)] because it is known that the brain displays morphological changes with aging (Keuken et al., 2013). Except for the SC, the nuclei volumes obtained in this study fell (p < 0.05, t-test) within the range of literature values.
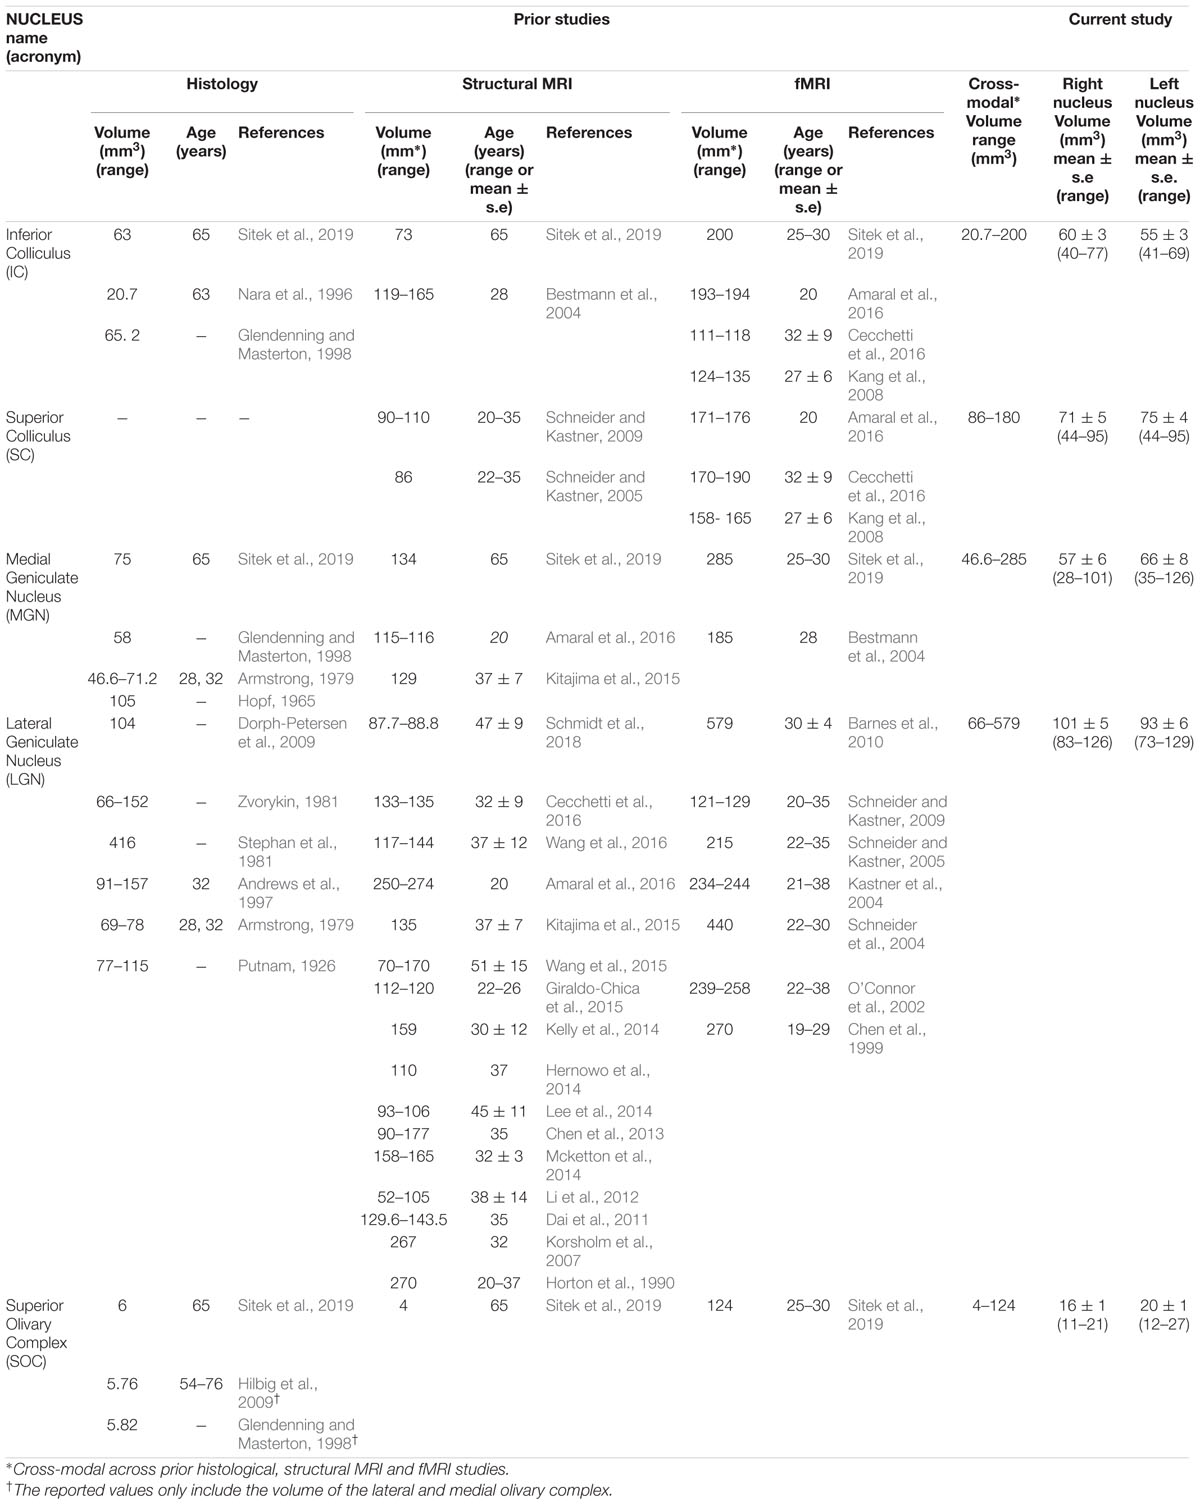
Table 1. Volumes of the IC, SC, MG, LG, and SOC.
Discussion
Compared to a large body of research focused on primary auditory/visual cortical areas (Ress et al., 2000; Morosan et al., 2001; Rademacher et al., 2001; Abdul-Kareem and Sluming, 2008; Hinds et al., 2009; Hoffmann et al., 2009; Bridge, 2011; Sánchez-Panchuelo et al., 2012; Augustinack et al., 2014; Saenz and Langers, 2014; Wasserthal et al., 2014; Cheng, 2016; Moerel et al., 2019), the structure, function and connectivity of subcortical brainstem and thalamic auditory/visual nuclei are currently understudied. New tools are needed to fill this gap and enable accurate structural delineations of the underlying deep brain nuclei in future clinical and research studies.
We first review the technological and methodological advances of this study that overcame conventional imaging limitations and enabled the generation of a new tool, namely a structural probabilistic atlas of subcortical auditory/visual nuclei. Then, for each nucleus, we discuss the segmentation process, in relation to the MRI contrast used for the nucleus delineation, the identification of specific nuclei borders, and the obtained volumes in comparison to literature values. Further, we discuss the possible impact of the atlas for clinical and research studies. Finally, we acknowledge the limitations of this work and propose possible future extensions.
Technological and Methodological Advances
In this work we showed that the use of advanced ultra-high-field MRI sequences allowed in vivo structural imaging of tiny brainstem and thalamic nuclei with high contrast, sensitivity and good spatial resolution with respect to conventional (e.g., 3 Tesla) MRI. For instance, a 7 Tesla diffusion MRI is expected to yield a ∼2.2 increase in sensitivity with respect to 3 Tesla MRI, and gains in contrast related to decreased partial volume effects due to increased spatial resolution. Notably, the 7 Tesla sequence was optimized to: (i) achieve minimum echo time (e.g., by the use of a monopolar scheme) given the lower gray and white matter T2 values at 7 Tesla compared to 3 Tesla; (ii) refine the RF transmit gain in the brainstem (to compensate for strong RF in-homogeneities at 7 Tesla), by tuning the RF voltage with an actual flip-angle imaging pulse sequence (Yarnykh, 2007); (iii) perform several iterations of semi-automatic B0 shimming. Specifically, these 7 Tesla structural MRI (T2-weighted and FA maps) techniques enabled the single-subject segmentation of subcortical auditory and visual subcortical nuclei based on their contrast with respect to neighboring areas. An important consideration regards the multi-contrast, resolution- and distortion-matched structural image acquisition used in this work. The latter allowed us to discriminate the structural boundaries of some nuclei due to the improved visualization of multiple contrasts in a common space, and to the use of complementary information derived from different image contrasts.
On the Atlas Creation
Our findings demonstrate the feasibility of delineating auditory/visual brainstem and thalamic nuclei by segmentation of single-subject high-contrast and high-sensitivity MRI images at 7 Tesla. This extends previous reports (Li et al., 2012) of manual single-subject localization of LG using neuroimaging in living humans based on the identification of anatomical landmarks. Crucially, our work also demonstrated the feasibility of generating a validated in vivo stereotaxic probabilistic atlas of these structures after precise coregistration to MNI (or another stereotactic) space. This atlas complements existing in vivo neuroimaging atlases of other brain structures (Tzourio-Mazoyer et al., 2002; Desikan et al., 2006; Destrieux et al., 2010).
We generated labels for two (bilateral) mescencephalic tegmental nuclei ICl/r and SCl/r. They were hypointense oval shaped structures easily identifiable on a T2-weighted MRI. The periaqueductal gray and the cuneiform nucleus were located at the anteromedial border of the IC (with good contrast in FA maps) and the cerebrospinal fluid limited its lateral edge. For the SC, its inferior edge was clearly located near the most rostral part of the IC, yet its rostro-ventral edge —in proximity to the thalamus— was less clearly defined due to the absence of an abrupt change in contrast in that area. The periaqueductal gray neighbored the medial border of the SC, while the cerebrospinal fluid delimited the posterolateral border of this structure. As visible in Table 1, our IC volumes were within literature values (specifically, closer to the inferior range of the latter), mainly derived from histology and structural MRI studies. Instead, the volume of the SC was slightly lower than reported literature values. Further validation work with MRI and histology might better elucidate the relationship between the achieved contrast in in vivo T2-weighted images and the distribution of iron (or of other microstructural properties) within different layers of this nucleus (Drayer et al., 1986).
For the manual delineation of the thalamic auditory MG nucleus we mainly used the T2-weighted image contrast. The MG was visible as a hypointense area neighboring (at its upper edge) the posteroventral thalamic nuclei, bounded inferiorly by the cerebrospinal fluid and limited by the pulvinar on its posterolateral border. Its medial border was clearly visible in FA maps, due to the high contrast with neighboring white matter bundles, such as the medial lemniscus and the spinothalamic tract. It is interesting to note the high variability in the MG volume values reported in the literature (see Table 1) for this structure. For instance, fMRI studies reported larger MG volumes compared to histology and structural MRI studies, possibly due to partial volume effects and artifacts due to draining veins in this region (Sitek et al., 2019). The MG volumes obtained in this study were within the range of previous literature reports (see Table 1). The MG label was useful to delimitate the posteromedial border of the LG, yet for the other borders of the LG we also used the contrast available in the FA maps. Notably, we used the FA maps to identify white matter bundles neighboring the LG, such as the optic tract anterior to LG and, in its medial aspect, the mesencephalic peduncles. The LG has an array of six cell layers currently not visible in our MRIs. Interestingly, recent in vivo studies report changes in the volume and shape of LG compatible with the location of the magnocellular layer in dyslexia according to previous hypothesis for this disease (Giraldo-Chica et al., 2015; Giraldo-Chica and Schneider, 2018). Previous reports of the LG volume show high degree of variability (up to two-fold) between individuals even when using the same techniques (Andrews et al., 1997; Selemon and Begovic, 2007; Kitajima et al., 2015; Wang et al., 2015). The LG volumes obtained in the present study were within the range of literature values (see Table 1). In the current study we found that the right LG was slightly larger compared to the left LG, in agreement with previous reports (Li et al., 2012; Lee et al., 2014).
The SOC was a round-oval hypointense area in FA maps with well-defined borders, yet at its most postero-lateral aspects its boundaries were more difficult to delineate due to its close proximity with other structures (e.g., the facial nucleus) (Kulesza, 2007). Our probabilistic SOC label is compatible with a complex comprising five nuclei described in the Paxinos atlas: the medial and lateral superior olive, the lateroventral and medioventral periolivary nucleus and the superior paraolivary nucleus (Paxinos et al., 2012). Previous histological and structural MRI studies report smaller SOC volumes (less than 6 mm3) than in the current work, most probably because they constrain their investigation to the small medial and lateral superior olivary nuclei (Glendenning and Masterton, 1998; Hilbig et al., 2009), and exclude the larger periolivary nuclei as well as the superior paraolivary nucleus. Yet, fMRI results report a larger volume (124 mm3) of the SOC, and our findings are within the range of literature values.
The atlas was validated with measures of inter-rater agreement and internal consistency of label delineations evaluated with the modified Hausdorff distance, a metric mostly unbiased by the size of the nucleus. We also evaluated the inter-rater agreement and the internal consistency using the Dice similarity coefficient, a more commonly used index in the neuroimaging literature for larger cortical and subcortical structures (Kaur et al., 2014; Iglesias et al., 2016; Tona et al., 2017). However, its sensitivity (similarly, to the Jaccard index) is biased toward larger structures with poorer performance in smaller structures such as tiny brainstem nuclei.
Potential Impact of the Atlas
The current work presents a human in vivo probabilistic atlas of auditory and visual subcortical nuclei in stereotactic (e.g., MNI) space.
Upon its release on public repositories of neuroimaging data and tools, this atlas might be used as a tool to better identify the IC, SC, MG, LG, SOC nuclei location in conventional (e.g., 3 Tesla) MRI, and enable more accurate characterizations of auditory and visual connectivity pathways in fMRI and diffusion tractography studies. The current work provides a detailed description of the location, shape and anatomy of these nuclei that could be useful in research as well as in future clinical studies to aid treatment delivery and tuning of strategies such as repetitive transcranial magnetic stimulation, neurosurgical planning or focused ultrasound therapies i.e., in tinnitus treatment (Smit et al., 2016; Yilmaz and Yilmaz, 2018) or advanced stages of Parkinson’s disease with catalepsy symptoms (Engelhardt et al., 2018). This atlas could also be used to evaluate microstructural changes in the brainstem, such as the location of microbleeds/lesions/tumors.
We foresee that this atlas might improve the reconstruction of three dimensional auditory/visual tracts by providing more precise seeding information in diffusion tractography using MRI. Further, this tool might be applied to improve diagnosis, prognosis and therapeutic decisions for different pathologies, such as glaucoma, amblyopia, optic neuritis, hemianopsia, congenital or genetic abnormalities that involve alterations in auditory or visual pathways (i.e., congenital blindness or congenital deafness), macular degeneration, cognitive (i.e., dyslexia) and psychiatric disorders (i.e., schizophrenia) among other applications (Brown et al., 2016; Prins et al., 2016).
Limitations and Future Perspectives
In the delimitation of LG and SOC we mainly used the contrast of FA maps, assuming that the observed low FA values within these nuclei were due to low myelin content (e.g., as expected in a gray matter region). To further corroborate our findings future human postmortem brain imaging with histological validation is needed to rule out possible confounds (such as low diffusion anisotropy due to crossing fibers). High angular resolution diffusion imaging (HARDI) acquisitions (preferentially with b-values > 2000 s/mm2) coupled with inspection of fiber orientation distributions and the application of tractography methods (Tournier et al., 2004; Zhang et al., 2012; Dell’Acqua and Tournier, 2019) could also provide useful information for brainstem nuclei delineation (such as a more accurate identification of neighboring fibers and of fibers traversing a nucleus, yet with higher uncertainty at the level of crossing fibers). At ultra-high magnetic fields, shorter T2 values might reduce the signal to noise ratio of high b-value diffusion images; yet, this effect is expected to be counterbalanced by gains in sensitivity due to the increased field strength.
We created an atlas based on images of healthy young adults, yet future work needs to be done in order to acknowledge possible differences across the lifespan. Future work should also investigate gender differences in nuclei shape and location.
Despite these limitations, our subcortical atlas is a unique non-invasive in vivo morphological tool to study the anatomy of deep brainstem and thalamic nuclei in healthy subjects, and its possible changes in different clinical populations.
Conclusion
We foresee the use of the generated probabilistic atlas of the IC, SC, MG, LG and SOC to aid the localization of these nuclei in conventional (e.g., 3 Tesla) images in future research studies of auditory and visual functions. Further, this atlas, upon coregistration to clinical MRI, might improve the evaluation of lesions and the assessment of connectivity pathways underlying auditory and visual mechanisms in a broad set of disease populations (e.g., auditory agnosia, pure-word deafness, eye movement and visual field deficits, Parkinson’s hallucinations, and glaucoma).
Data Availability
The datasets for this manuscript are not publicly available because we are using this data-set to currently expand our atlas and connectome of brainstem nuclei, as promised to a federal funding agency. The data-set, atlas and connectome will be released upon termination of this work. Requests to access the datasets should be directed to MB,bWFydGFiQG1naC5oYXJ2YXJkLmVkdQ==.
Ethics Statement
Twelve healthy subjects (6m/6f, age 28 ± 1 years) provided informed and written consent for 7 Tesla MRI (Magnetom, Siemens Healthineers, Germany) per Massachusetts General Hospital Institutional Review Board approval in accordance with the Declaration of Helsinki.
Author Contributions
NT and MB preprocessed and analyzed the data. MG-G, CS, and MB manually labeled the ROIs. MG-G, CS, KS, and MB wrote the manuscript. MB designed the research, performed the experiments, and secured the funding. BR and LW gave feedback along the process.
Funding
This work was supported by the following sources of funding: National Institutes of Health (NIH) National Institute for Biomedical Imaging and Bioengineering, K01 EB019474 and P41 EB015896, National Institute on Deafness and other Communication Disorders R21 DC015888, National Cancer Institute U01 CA193632, and the Massachusetts General Hospital Claflin Distinguished Scholar Award. This work was also in part made possible by the resources provided by Shared Instrumentation Grants 1S10RR023401, 1S10RR019307, and 1S10RR023043.
Conflict of Interest Statement
The authors declare that the research was conducted in the absence of any commercial or financial relationships that could be construed as a potential conflict of interest.
References
Abdul-Kareem, I. A., and Sluming, V. (2008). Heschl gyrus and its included primary auditory cortex: structural MRI studies in healthy and diseased subjects. J. Magnet. Reson. Imaging 28, 287–299. doi: 10.1002/jmri.21445
Aguirre, G. K., Datta, R., Benson, N. C., Prasad, S., Jacobson, S. G., Cideciyan, A. V., et al. (2016). Patterns of individual variation in visual pathway structure and function in the sighted and blind. PLoS One 11:e0164677. doi: 10.1371/journal.pone.0164677
Amaral, L., Ganho-Ávila, A., Osório, A., Soaresm, M. J., He, D., Chen, Q., et al. (2016). Hemispheric asymmetries in subcortical visual and auditory relay structures in congenital deafness. Eur. J. Neurosci. 44, 2334–2339. doi: 10.1111/ejn.13340
Andrews, T. J., Halpern, S. D., and Purves D. (1997). Correlated size variations in human visual cortex, lateral geniculate nucleus, and optic tract. J. Neurosci. 17, 2859–2868. doi: 10.1523/JNEUROSCI.17-08-02859.1997
Armstrong, E. (1979). Quantitative comparison of the hominoid thalamus. I. Specific sensory relay nuclei. Am. J. Phys. Anthropol. 51, 365–382. doi: 10.1002/ajpa.1330510308
Augustinack, J. C., Huber, K. E., Stevens, A. A., Roy, M., Frosch, M. P., van der Kouwe, A. J., et al. (2013). Predicting the location of human perirhinal cortex, Brodmann’s Area 35, from MRI. Neuroimage 64, 32–42. doi: 10.1016/j.neuroimage.2012.08.071
Augustinack, J. C., Magnain, C., Reuter, M., van der Kouwe, A. J., Boas, D., and Fischl, B. (2014). MRI parcellation of ex vivo medial temporal lobe. Neuroimage 93(Pt 2), 252–259. doi: 10.1016/j.neuroimage.2013.05.053
Avants, B. B., Tustison, N. J., Song, G., Cook, P. A., Klein, A., and Gee, J. C. (2011). A reproducible evaluation of ANTs similarity metric performance in brain image registration. Neuroimage 54, 2033–2044. doi: 10.1016/j.neuroimage.2010.09.025
Barnes, G. R., Li, X., Thompson, B., Singh, K. D., Dumoulin, S. O., and Hess, R. F. (2010). Decreased gray matter concentration in the lateral geniculate nuclei in human amblyopes. Investig. Ophthalmol. Vis. Sci. 51, 1432–1438. doi: 10.1167/iovs.09-3931
Bestmann, S., Baudewig, J., Siebner, H. R., Rothwell, J. C., and Frahm, J. (2004). Functional MRI of the immediate impact of transcranial magnetic stimulation on cortical and subcortical motor circuits. Eur. J. Neurosci. 19, 1950–1962. doi: 10.1111/j.1460-9568.2004.03277.x
Bianciardi, M., Toschi, N., Edlow, B. L., Eichner, C., Setsompop, K., Polimeni, J. R., et al. (2015). Toward an In Vivo neuroimaging template of human brainstem nuclei of the ascending arousal, autonomic, and motor systems. Brain Connectivity 5, 597–607. doi: 10.1089/brain.2015.0347
Biotti, D., Barbieux, M., and Brassat, D. (2016). Teaching video neuro images?: alternating skew deviation with abducting hypertropia following superior colliculus infarction. Neurology 86, e93–e94. doi: 10.1212/WNL.0000000000002425
Bridge, H. (2011). Mapping the visual brain: how and why. Eye 25, 291–296. doi: 10.1038/eye.2010.166
Brown, H. D., Woodall, R. L., Kitching, R. E., Baseler, H. A., and Morland, A. B. (2016). Using magnetic resonance imaging to assess visual deficits: a review. Ophthalmic Physiol. Opt. 36, 240–265. doi: 10.1111/opo.12293
Buchmann, A., Dentico, D., Peterson, M. J., Riedner, B. A., Sarasso, S., Massimini, M., et al. (2014). Reduced mediodorsal thalamic volume and prefrontal cortical spindle activity in schizophrenia. Neuroimage 102(Pt 2), 540–547. doi: 10.1016/j.neuroimage.2014.08.017
Cecchetti, L., Ricciardi, E., Handjaras, G., Kupers, R., Ptito, M., and Pietrini, P. (2016). Congenital blindness affects diencephalic but not mesencephalic structures in the human brain. Brain Struct. Funct. 221, 1465–1480. doi: 10.1007/s00429-014-0984-985
Chen, W., Zhu, X. H., Thulborn, K. R., and Ugurbil, K. (1999). Retinotopic mapping of lateral geniculate nucleus in humans using functional magnetic resonance imaging. Proc. Natl. Acad. Sci. U.S.A. 96, 2430–2434. doi: 10.1073/pnas.96.5.2430
Chen, Z., Wang, J., Lin, F., Dai, H., Mu, K., and Zhang, H. (2013). Correlation between lateral geniculate nucleus atrophy and damage to the optic disc in glaucoma. J. Neuroradiol. 40, 281–287. doi: 10.1016/j.neurad.2012.10.004
Cheng, K. (2016). What we have learned about human primary visual cortex from high resolution functional magnetic resonance imaging. Magnet. Reson. Med. Sci. 15, 1–10. doi: 10.2463/mrms.2015-2018
Dai, H., Mu, K. T., Qi, J. P., Wang, C. Y., Zhu, W. Z., Xia, L. M., et al. (2011). Assessment of lateral geniculate nucleus atrophy with 3T MR imaging and correlation with clinical stage of glaucoma. Am. J. Neuroradiol. 32, 1347–1353. doi: 10.3174/ajnr.A2486
de Blank, P., Fisher, M. J., Gittleman, H., Barnholtz-Sloan, J. S., Badve, C., and Berman, J. I. (2018). Validation of an automated tractography method for the optic radiations as a biomarker of visual acuity in neurofibromatosis-associated optic pathway glioma. Exp. Neurol. 299, 308–316. doi: 10.1016/j.expneurol.2017.06.004
Dell’Acqua, F., and Tournier, J. D. (2019). Modelling white matter with spherical deconvolution: how and why?. NMR Biomed. 32:e3945. doi: 10.1002/nbm.3945
Desikan, R. S., Ségonne, R., Fischl, B., Quinn, B. T., Dickerson, B. C., Blacker, D., et al. (2006). An automated labeling system for subdividing the human cerebral cortex on MRI scans into gyral based regions of interest. Neuroimage 31, 968–980. doi: 10.1016/j.neuroimage.2006.01.021
Destrieux, C., Fischl, B., Dale, A., and Halgren, E. (2010). Automatic parcellation of human cortical gyri and sulci using standard anatomical nomenclature. Neuroimage 53, 1–15. doi: 10.1016/j.neuroimage.2010.06.010
Dice, L. R. (1945). Measures of the amount of ecologic association between species. Ecology 26, 297–302. doi: 10.2307/1932409
Dorph-Petersen, K. A., Caric, D., Saghafi, R., Zhang, W., Sampson, A. R., and Lewis, D. A. (2009). Volume and neuron number of the lateral geniculate nucleus in schizophrenia and mood disorders. Acta Neuropathol. 117, 369–384. doi: 10.1007/s00401-008-0410-412
Drayer, B., Burger, P., Darwin, R., Riederer, S., Herfkens, R., and Johnson, G. A. (1986). Magnetic resonance imaging of brain iron. Am. J. Neuroradiol. 7, 373–380.
Dubuisson, M., and Jain, A. K. (1994). “A Modified Hausdorff Distance for Object Matching,” in Proceedings of 12th International Conference on Pattern Recognition, Jerusalem. doi: 10.1109/ICPR.1994.576361
Engelhardt, K. A., Marchetta, P., Schwarting, R. K. W., and Melo-Thomas, L. (2018). Haloperidol–Induced catalepsy is ameliorated by deep brain stimulation of the inferior colliculus. Sci. Rep. 8:2216. doi: 10.1038/s41598-018-19990-y
Fischl, B., Rajendran, N., Busa, E., Augustinack, J., Hinds, O., Thomas Yeo, B. T., et al. (2008). Cortical folding patterns and predicting cytoarchitecture. Cereb. Cortex 18, 1973–1980. doi: 10.1093/cercor/bhm225
Ghosh, S. S., Kakunoori, S., Augustinack, J., Nieto-Castanon, A., Kovelman, I., Gaab, N., et al. (2010). Evaluating the validity of volume-based and surface-based brain image registration for developmental cognitive neuroscience studies in children 4 to 11years of age. Neuroimage 53, 85–93. doi: 10.1016/j.neuroimage.2010.05.075
Giraldo-Chica, M., Hegarty, J. P., and Schneider, K. A. (2015). Morphological differences in the lateral geniculate nucleus associated with dyslexia. Neuroimage Clin. 7, 830–836. doi: 10.1016/j.nicl.2015.03.011
Giraldo-Chica, M., and Schneider, K. A. (2018). Hemispheric asymmetries in the orientation and location of the lateral geniculate nucleus in dyslexia. Dyslexia 24, 197–203. doi: 10.1002/dys.1580
Glendenning, K. K., and Masterton, R. B. (1998). Comparative morphometry of mammalian central auditory systems: variation in nuclei and form of the ascending system. Brain Behav. Evol. 51, 59–89. doi: 10.1159/000006530
Hernowo, A. T., Boucard, C. C., Jansonius, N. M., Hooymans, J. M. M., and Cornelissen, F. W. (2011). Automated morphometry of the visual pathway in primary open-angle glaucoma. Investig. Ophthalmol. Vis. Sci. 52, 2758–2766. doi: 10.1167/iovs.10-5682
Hernowo, A. T., Prins, D., Baseler, H. A., Plank, T., Gouws, A. D., Hooymans, J. M. M., et al. (2014). Morphometric analyses of the visual pathways in macular degeneration. Cortex 56, 99–110. doi: 10.1016/j.cortex.2013.01.003
Hilbig, H., Beil, B., Hilbig, H., Call, J., and Bidmon, H. J. (2009). Superior olivary complex organization and cytoarchitecture may be correlated with function and catarrhine primate phylogeny. Brain Struct. Funct. 213, 489–497. doi: 10.1007/s00429-008-0201-205
Hinds, O., Polimeni, J. R., Rajendran, N., Balasubramanian, M., Amunts, K., Zilles, K., et al. (2009). Locating the functional and anatomical boundaries of human primary visual cortex. Neuroimage 46, 915–922. doi: 10.1016/j.neuroimage.2009.03.036
Hoffmann, M. B., Stadler, J., Kanowski, M., and Speck, O. (2009). Retinotopic mapping of the human visual cortex at a magnetic field strength of 7T. Clin. Neurophysiol. 120, 108–116. doi: 10.1016/j.clinph.2008.10.153
Hopf, A. (1965). Volumetrische untersuchunger zur ver- gleichenden anatomie des thalamus. J. F. Hirnforschung. 8, 25–38.
Horton, J. C., Landau, K., Maeder, P., and Hoyt, W. F. (1990). Magnetic resonance imaging of the human lateral geniculate body. Arch. Neurol. 47, 1201–1206. doi: 10.1001/archneur.1990.00530110059017
Iglesias, J. E., Van Leemput, K., Augustinack, J., Insausti, R., Fischl, B., and Reuter M. (2016). Bayesian longitudinal segmentation of hippocampal substructures in brain MRI using subject-specific atlases. Neuroimage 141, 542–555. doi: 10.1016/j.neuroimage.2016.07.020
Javad, F., Warren, J. D., Micallef, C., Thornton, J. S., Golay, X., Yousry, T., et al. (2014). Auditory tracts identified with combined fMRI and diffusion tractography. Neuroimage 84, 562–574. doi: 10.1016/j.neuroimage.2013.09.007
Joswig, H., Schönenberger, U., Brügge, D., Richter, H., and Surbeck, W. (2015). Reversible pure word deafness due to inferior colliculi compression by a pineal germinoma in a young adult. Clin. Neurol. Neurosurg. 139, 62–65. doi: 10.1016/j.clineuro.2015.08.034
Kang, D. H., Kwon, K. W., Gu, B. M., Choi, J. S., Jang, J. H., and Kwon, J. S. (2008). Structural abnormalities of the right inferior colliculus in schizophrenia. Psychiatry Res. 164, 160–165. doi: 10.1016/j.pscychresns.2007.12.023
Kastner, S., O’Connor, D. H., Fukui, M. M., Fehd, H. M., Herwig, U., and Pinsk, M. A. (2004). Functional imaging of the human lateral geniculate nucleus and pulvinar. J. Neurophysiol. 91, 438–448. doi: 10.1152/jn.00553.2003
Kaur, S., Powell, S., He, L., Pierson, C. R., and Parikh, N. A. (2014). Reliability and repeatability of quantitative tractography methods for mapping structural white matter connectivity in preterm and term infants at term-equivalent age. PLoS One 9:e85807. doi: 10.1371/journal.pone.0085807
Keifer, O. P., Gutman, D. A., Hecht, E. E., Keilholz, S. D., and Ressler, K. J. (2015). A comparative analysis of mouse and human medial geniculate nucleus connectivity: a DTI and anterograde tracing study. Neuroimage 105, 53–66. doi: 10.1016/j.neuroimage.2014.10.047
Keil, B., Triantafyllou, C., Hamm, M., and Wald, L. L. (2010). “Design Optimization of a 32- Channel Head Coil at 7 T,” in Proceedings of the Annual Meeting of the International Society for Magnetic Resonance in Medicine, Stockholm, 1493.
Kelly, K. R., McKetton, L., Schneider, K. A., Gallie, B. L., and Steeves, J. K. E. (2014). Altered anterior visual system development following early monocular enucleation. Neuroimage Clin. 4, 72–81. doi: 10.1016/j.nicl.2013.10.014
Keuken, M. C., Bazin, P. L., Schäfer, A., Neumann, J., Turner, R., and Forstmann, B. U. (2013). Ultra-High 7T MRI of structural age-related changes of the subthalamic nucleus. J. Neurosci. 33, 4896–4900. doi: 10.1523/JNEUROSCI.3241-12.2013
Kitajima, M., Hirai, T., Yoneda, T., Iryo, Y., Azuma, M., Tateishi, M., et al. (2015). Visualization of the medial and lateral geniculate nucleus on phase difference enhanced imaging. Am. J. Neuroradiol. 36, 1669–1674. doi: 10.3174/ajnr.A4356
Klein, A., Ghosh, S. S., Avants, B., Yeo, B. T. T., Fischl, B., Ardekani, B., et al. (2010). Evaluation of volume-based and surface-based brain image registration methods. Neuroimage 51, 214–220. doi: 10.1016/j.neuroimage.2010.01.091
Korsholm, K., Madsen, K. H., Frederiksen, J. L., Skimminge, A., and Lund, T. E. (2007). Recovery from optic neuritis: an ROI-Based analysis of LGN and visual cortical areas. Brain 130, 1244–1253. doi: 10.1093/brain/awm045
Kulesza, R. J. (2007). Cytoarchitecture of the human superior olivary complex: medial and lateral superior olive. Hear. Res. 225, 80–90. doi: 10.1016/j.heares.2006.12.006
Landgrebe, M., Langguth, B., Rosengarth, K., Braun, S., Koch, A., Kleinjung, T., et al. (2009). Structural brain changes in tinnitus: grey matter decrease in auditory and non-auditory brain areas. Neuroimage 46, 213–218. doi: 10.1016/j.neuroimage.2009.01.069
Lee, J. Y., Jeong, H. J., Lee, J. H., Kim, Y. J., Kim, E. Y., Kim, Y. Y., et al. (2014). An investigation of lateral geniculate nucleus volume in patients with primary open-angle glaucoma using 7 tesla magnetic resonance imaging. Investig. Ophthalmol. Vis. Sci. 55, 3468–3476. doi: 10.1167/iovs.14-13902
Lee, J. Y., Yoon, E. J., Lee, W. W., Kim, Y. K., Lee, J. Y., and Jeon, B. (2016). Lateral geniculate atrophy in parkinson’s with visual hallucination: a trans-synaptic degeneration? Mov. Disord. 31, 547–554. doi: 10.1002/mds.26533
Li, M., He, H. G., Shi, W., Li, J., Lv, B., Wang, C. H., et al. (2012). Quantification of the human lateral geniculate nucleus in vivo using MR imaging based on morphometry: volume loss with age. Am. J. Neuroradiol. 33, 915–921. doi: 10.3174/ajnr.A2884
Maffei, C., Jovicich, J., De Benedictis, A., Corsini, F., Barbareschi, M., Chioffi, F., et al. (2018). Topography of the human acoustic radiation as revealed by Ex Vivo fibers micro-dissection and in vivo diffusion-based tractography. Brain Struct. Funct. 223, 449–459. doi: 10.1007/s00429-017-1471-1476
Mai, J. K., Berger, K., and Sofroniew, M. V. (1993). Morphometric evaluation of neurophysin-immunoreactivity in the human brain: pronounced inter-individual variability and evidence for altered staining patterns in schizophrenia. J. Fur Hirnforschung 34, 133–154.
May, P. J. (2006). The mammalian superior colliculus: laminar structure and connections. Prog. Brain Res. 151, 321–378. doi: 10.1016/S0079-6123(05)51011-51012
Mcketton, L., Kelly, K. R., and Schneider, K. A. (2014). Abnormal lateral geniculate nucleus and optic chiasm in human albinism. J. Comp. Neurol. 522, 2680–2687. doi: 10.1002/cne.23565
Moerel, M., De Martino, F., Uðurbil, K., Yacoub, E., and Formisano, E. (2019). Processing complexity increases in superficial layers of human primary auditory cortex. Sci. Rep. 9:5502. doi: 10.1038/s41598-019-41965-w
Morosan, P., Rademacher, J., Schleicher, A., Amunts, K., Schormann, T., and Zilles, K. (2001). Human primary auditory cortex: cytoarchitectonic subdivisions and mapping into a spatial reference system. Neuroimage 13, 684–701. doi: 10.1006/nimg.2000.0715
Nara, T., Goto, N., Hamano, S., and Okada, A. (1996). Morphometric development of the human fetal auditory system: inferior collicular nucleus. Brain Dev. 18, 35–39. doi: 10.1016/0387-7604(95)00089-5
O’Connor, D. H., Fukui, M. M., Pinsk, M. A., and Kastner, S. (2002). Attention modulates responses in the human lateral geniculate nucleus. Nat. Neurosci. 5, 1203–1209. doi: 10.1038/nn957
Olszewski, J., and Baxter, D. (2014). Cytoarchitecture of the Human Brain Stem, 3rd Edn. Karger (Philadelphia, PA: Lippincott), 104–119.
Pasu, S., Ridha, B. H., Wagh, V., Jindahra, P., Siddiqui, A., Plant, G., et al. (2015). Homonymous sectoranopia: asymptomatic presentation of a lateral geniculate nucleus lesion. Neuro Ophthalmol. 39, 289–294. doi: 10.3109/01658107.2015.1079221
Paxinos, G., Xu-Feng, H., Sengul, G., and Watson, C. (2012). Organization of Brainstem Nuclei. The Human Nervous System. Amsterdam: Elsevier Academic Press.
Prins, D., Hanekamp, S., and Cornelissen, F. W. (2016). Structural brain MRI studies in eye diseases: are they clinically relevant? A review of current findings. Acta Ophthalmol. 94, 113–121. doi: 10.1111/aos.12825
Putnam, T. J. (1926). Studies on the central visual system: IV. The details of the organization of the geniculostriate system in man. Arch. Neurol. Psychiatry 16, 683–707. doi: 10.1001/archneurpsyc.1926.02200300003001
Rademacher, J., Morosan, P., Schormann, T., Schleicher, A., Werner, C., Freund, H. J., et al. (2001). Probabilistic mapping and volume measurement of human primary auditory cortex. Neuroimage 13, 669–683. doi: 10.1006/nimg.2000.0714
Reese, T. G., Heid, O., Weisskoff, R. M., and Wedeen, V. J. (2003). Reduction of eddy-current-induced distortion in diffusion MRI using a twice-refocused spin echo. Magnet. Reson. Med. 49, 177–182. doi: 10.1002/mrm.10308
Ress, D., Backus, B. T., and Heeger, D. J. (2000). Activity in primary visual cortex predicts performance in a visual detection task. Nat. Neurosci. 3, 940–945. doi: 10.1038/78856
Saenz, M., and Langers, D. R. M. (2014). Tonotopic mapping of human auditory cortex. Hear. Res. Hum. Aud. Neuroimaging 307, 42–52. doi: 10.1016/j.heares.2013.07.016
Sánchez-Panchuelo, R. M., Francis, S. T., Schluppeck, D., and Bowtell, R. W. (2012). Correspondence of human visual areas identified using functional and anatomical MRI in Vivo at 7 T. J. Magnet. Reson. Imaging 35, 287–299. doi: 10.1002/jmri.22822
Schmidt, M. A., Knott, M., Heidemann, R., Michelson, G., Kober, T., Dörfler, A., et al. (2018). Investigation of lateral geniculate nucleus volume and diffusion tensor imaging in patients with normal tension glaucoma using 7 tesla magnetic resonance imaging. PLoS One 13:e0198830. doi: 10.1371/journal.pone.0198830
Schneider, K. A., and Kastner, S. (2005). Visual responses of the human superior colliculus: a high-resolution functional magnetic resonance imaging study. J. Neurophysiol. 94, 2491–2503. doi: 10.1152/jn.00288.2005
Schneider, K. A., and Kastner, S. (2009). Effects of sustained spatial attention in the human lateral geniculate nucleus and superior colliculus. J. Neurosci. 29, 1784–1795. doi: 10.1523/JNEUROSCI.4452-08.2009
Schneider, K. A., Richter, M. C., and Kastner, S. (2004). Retinotopic organization and functional subdivisions of the human lateral geniculate nucleus: a high-resolution functional magnetic resonance imaging study. J. Neurosci. 24, 8975–8985. doi: 10.1523/JNEUROSCI.2413-04.2004
Selemon, L. D., and Begovic, A. (2007). Stereologic analysis of the lateral geniculate nucleus of the thalamus in normal and schizophrenic subjects. Psychiatry Res. 151, 1–10. doi: 10.1016/j.psychres.2006.11.003
Sitek, K. R., Gulban, O. F., Calabrese, E., Johnson, G. A., Lage-Castellanos, A., Moerel, M., et al. (2019). Mapping the human subcortical auditory system using histology, post mortem MRI and in vivo MRI at 7T. eLife 8, 1–44. doi: 10.7554/eLife.48932
Smit, J. V., Janssen, M. L. F., van Zwieten, G., Jahanshahi, A., Temel, Y., and Stokroos, R. J. (2016). Deep brain stimulation of the inferior colliculus in the rodent suppresses tinnitus. Brain Res. 1650, 118–124. doi: 10.1016/j.brainres.2016.08.046
Stejskal, E. O., and Tanner, J. E. (1965). Spin diffusion measurements: spin echoes in the presence of a time-dependent field gradient. J. Chem. Phys. 42, 288–292. doi: 10.1063/1.1695690
Stephan, H., Frahm, H., and Baron, G. (1981). New and revised data on volumes of brain structures in insectivores and primates. Folia Primatol. 35, 1–29. doi: 10.1159/000155963
Tona, K. D., Keuken, M. C., de Rover, M., Lakke, E., Forstmann, B. U., Nieuwenhuis, S., et al. (2017). In Vivo visualization of the locus coeruleus in humans: quantifying the test–retest reliability. Brain Struct. Funct. 222, 4203–4217. doi: 10.1007/s00429-017-1464-5
Tournier, J. D., Calamante, F., Gadian, D. G., and Connelly, A. (2004). Direct estimation of the fiber orientation density function from diffusion-weighted MRI data using spherical deconvolution. Neuroimage 23, 1176–1185. doi: 10.1016/j.neuroimage.2004.07.037
Tzourio-Mazoyer, N., Landeau, B., Papathanassiou, D., Crivello, F., Etard, O., Delcroix, N., et al. (2002). Automated anatomical labeling of activations in SPM using a macroscopic anatomical parcellation of the MNI MRI single-subject brain. Neuroimage 15, 273–289. doi: 10.1006/nimg.2001.0978
Varentsova, A., Zhang, S., and Arfanakis, K. (2014). Development of a high angular resolution diffusion imaging human brain template. Neuroimage 91, 177–186. doi: 10.1016/j.neuroimage.2014.01.009
Wang, J., Li, T., Sabel, B. A., Chen, Z., Wen, H., Li, J., et al. (2016). Structural brain alterations in primary open angle glaucoma: a 3T MRI study. Sci. Rep. 6:18969. doi: 10.1038/srep18969
Wang, J., Miao, W., Li, J., Li, M., Zhen, Z., Sabel, B., et al. (2015). Automatic segmentation of the lateral geniculate nucleus: application to control and glaucoma patients. J. Neurosci. Methods 255, 104–114. doi: 10.1016/j.jneumeth.2015.08.006
Wasserthal, C., Brechmann, A., Stadler, J., Fischl, B., and Engel, K. (2014). Localizing the human primary auditory cortex in Vivo using structural MRI. Neuroimage 93(Pt 2), 237–251. doi: 10.1016/j.neuroimage.2013.07.046
Wiegell, M. R., Tuch, D. S., Larsson, H. B. W., and Wedeen, V. J. (2003). Automatic segmentation of thalamic nuclei from diffusion tensor magnetic resonance imaging. Neuroimage 19(2 Pt 1), 391–401. doi: 10.1016/s1053-8119(03)00044-2
Yarnykh, V. L. (2007). Actual flip-angle imaging in the pulsed steady state: a method for rapid three-dimensional mapping of the transmitted radiofrequency field. Magnet. Reson. Med. 57, 192–200. doi: 10.1002/mrm.21120
Yendiki, A., Panneck, P., Srinivasan, P., Stevens, A., Zöllei, L., Augustinack, J., et al. (2011). Automated probabilistic reconstruction of white-matter pathways in health and disease using an atlas of the underlying anatomy. Front. Neuroinformatics 5:23. doi: 10.3389/fninf.2011.00023
Yilmaz, Y. Z., and Yilmaz, M. (2018). “Transcranial Magnetic Stimulation in the Treatment of Tinnitus,” in En Transcranial Magnetic Stimulation in Neuropsychiatry ed. L. Ustohal (Rijeka: InTech) doi: 10.5772/intechopen.73221
Zhang, H., Schneider, T., Wheeler-Kingshott, C. A., and Alexander, D. C. (2012). NODDI: practical in Vivo neurite orientation dispersion and density imaging of the human brain. Neuroimage 61, 1000–1016. doi: 10.1016/j.neuroimage.2012.03.072
Keywords: inferior/superior colliculi, medial/lateral geniculate nuclei, superior olivary complex, in vivo neuroimaging-based human atlas, multi-contrast 7 Tesla MRI, visual/oculo-motor and auditory/auditory-motor functions
Citation: García-Gomar MG, Strong C, Toschi N, Singh K, Rosen BR, Wald LL and Bianciardi M (2019) In vivo Probabilistic Structural Atlas of the Inferior and Superior Colliculi, Medial and Lateral Geniculate Nuclei and Superior Olivary Complex in Humans Based on 7 Tesla MRI. Front. Neurosci. 13:764. doi: 10.3389/fnins.2019.00764
Received: 26 April 2019; Accepted: 09 July 2019;
Published: 07 August 2019.
Edited by:
John Ashburner, University College London, United KingdomReviewed by:
Anneke Alkemade, University of Amsterdam, NetherlandsLi-Wei Kuo, National Health Research Institutes, Taiwan
Copyright © 2019 García-Gomar, Strong, Toschi, Singh, Rosen, Wald and Bianciardi. This is an open-access article distributed under the terms of the Creative Commons Attribution License (CC BY). The use, distribution or reproduction in other forums is permitted, provided the original author(s) and the copyright owner(s) are credited and that the original publication in this journal is cited, in accordance with accepted academic practice. No use, distribution or reproduction is permitted which does not comply with these terms.
*Correspondence: María G. García-Gomar, bWdhcmNpYWdvbWFyQG1naC5oYXJ2YXJkLmVkdQ==; Marta Bianciardi, bWFydGFiQG1naC5oYXJ2YXJkLmVkdQ==
†These authors have contributed equally to this work as first authors