Abstract
Brain tumors are one of the most threatening diseases to human health. Accurate identification of the type of brain tumor is essential for patients and doctors. An automated brain tumor diagnosis system based on Magnetic Resonance Imaging (MRI) can help doctors to identify the type of tumor and reduce their workload, so it is vital to improve the performance of such systems. Due to the challenge of collecting sufficient data on brain tumors, utilizing pre-trained Convolutional Neural Network (CNN) models for brain tumors classification is a feasible approach. The study proposes a novel brain tumor classification system, called EFF_D_SVM, which is developed on the basic of pre-trained EfficientNetB0 model. Firstly, a new feature extraction module EFF_D was proposed, in which the classification layer of EfficientNetB0 was replaced with two dropout layers and two dense layers. Secondly, the EFF_D model was fine-tuned using Softmax, and then features of brain tumor images were extracted using the fine-tuned EFF_D. Finally, the features were classified using Support Vector Machine (SVM). In order to verify the effectiveness of the proposed brain tumor classification system, a series of comparative experiments were carried out. Moreover, to understand the extracted features of the brain tumor images, Grad-CAM technology was used to visualize the proposed model. Furthermore, cross-validation was conducted to verify the robustness of the proposed model. The evaluation metrics including accuracy, F1-score, recall, and precision were used to evaluate proposed system performance. The experimental results indicate that the proposed model is superior to other state-of-the-art models.
1. Introduction
Brain tumors pose a serious threat to people’s health and have a high fatality rate (Alyami et al., 2023). Early detection of brain tumors is crucial for patients, as they can get a greater chance of survival (Özbay and Altunbey Özbay, 2023). Medical imaging techniques have been widely used by radiologists. Among these techniques, Magnetic Resonance Imaging (MRI) is one of the most common techniques for diagnosing and evaluating brain tumors, which could provide rich brain tissue data (Gu and Li, 2021; Ayadi et al., 2022). However, the traditional MRI detection of brain tumors heavily relies on experienced doctors. Fatigue caused by prolonged working hours could affect doctor diagnosis, resulting in potential risks to patients. Therefore, it is necessary to develop an automated brain tumor classification computer-aided system to assist doctors in diagnosis (Nanda et al., 2023).
Brain tumors are commonly classified as either benign or malignant, with malignant tumors being further classified into three subtypes: glioma tumor, pituitary tumor, and meningioma tumor. Classifying brain tumors into multiple categories is more challenging than classifying them into two categories (Gu et al., 2021; Shahin et al., 2023).
Machine learning and deep learning are widely used in cancers study (Maurya et al., 2023). Typical ML classification methods encompass a series of steps: data preprocessing, feature extraction, feature selection, dimensionality reduction, and classification (Swati et al., 2019). Bi et al. (2021) and Saravanan et al. (2020) have both utilized machine learning to achieve the task of classifying skin cancers. Bi et al. (2021) utilized a combination of Support Vector Machine (SVM) and Chaotic World Cup Optimization (CWCO) optimization algorithms, whereas Saravanan et al. (2020) used SVM as a classifier and Gray-Level Co-Occurrence Matrix (GLCM) for feature extraction. Amin et al. (2020) employed SVM for brain tumors Classification. Feature extraction is a key step in achieving high performance in traditional machine learning. The accuracy of classification often depends on the features extracted with the help of experts. However, for most researchers, feature extraction is a challenging task when using traditional machine learning methods in research. The applications of machine learning and deep learning in disease classification are introduced in this paper.
In machine learning, it is necessary to perform feature extraction. Cheng et al. (2015) utilized three feature extraction techniques, namely intensity histogram, grey-scale co-occurrence matrix, and bag-of-words, achieving a model accuracy of 91.28%. Gumaei et al. (2019) employed a hybrid feature extraction approach to extract brain tumor images feature, which was combined with a regularized extreme learning machine for the classification of brain tumors, and an accuracy of 94.233% on the Chen dataset was achieved. Khan et al. (2019) used the watershed algorithm for image segmentation in a brain tumor classification system. The brain tumor classification system categorized tumors as either benign or malignant with an accuracy of 98.88%.
Since dataset features can be automatically extracted by deep learning techniques, they have got more and more attention (Bar et al., 2015). As a deep learning technique, Convolutional Neural Network (CNN) models have been widely used in the field of deep learning for tasks such as image classification, object detection, and face recognition. CNN models are mainly composed of convolutional layers, pooling layers, and fully connected layers. Convolutional layers use filters to perform convolution operations on input data and extract features of images. Pooling layers are used to downsample the features outputted by convolutional layers, reducing the number of features and parameters. The fully connected layer connects the output of the pooling layer to the final output layer for tasks such as classification or regression. Unlike traditional machine learning techniques, the CNN model can automatically learn useful features from images, eliminating the need for manual feature engineering, so it is an ideal choice for medical image processing (Yu et al., 2022; Maurya et al., 2023). Medical image datasets are generally small due to the difficulty and cost of acquisition. Therefore, as an effective small dataset processing technology, transfer learning has been widely applied in the field of medical image classification such as breast cancer, pneumonia, brain tumors, and glomerular disease (Yu et al., 2022). Talo et al. (2019) categorized brain tumors as benign or malignant using the pre-trained RestNet34. Kaur and Gandhi (2020) used pre-trained models such as Resnet50 and GoogLeNet ResnNet101 to classify brain tumors. Deepak and Ameer (2019) introduced a method using pre-trained GoogLeNet. Fine-tuned GoogLeNet was used to extract features of brain tumor images, and then SVM and KNN were employed as classifiers to complete the brain tumor classification task. EfficientNets, as lightweight models, are also extensively utilized in applications such as brain tumor classification (Tan and Le, 2019). Shah et al. (2022) used the EfficientNetB0 model to classify brain tumors as healthy and unhealthy. Nayak et al. (2022) utilized EfficientNetB0 to perform a triple classification of brain tumors, while Zulfiqar et al. (2023) utilized EfficientNetB2 for the same task. Yet, the model proposed in (Nayak et al., 2022) suffered from mild overfitting, resulting in low classification accuracy. And Zulfiqar et al. (2023) achieved a classification accuracy of only 91.35% when performing cross-validation experiments on different datasets. Additionally, Nayak et al. (2022) and Zulfiqar et al. (2023) only performed triple classification task of brain tumors.
Abiwinanda et al. (2019) created a model consisting of two convolution layers, an activation-Relu layer, and a Dense-64 layer. The model achieved an accuracy rate of 84.19%. Alanazi et al. (2022) constructed a 22-layer CNN architecture. The model was trained using a large-scale binary classification dataset, and then it was fine-tuned using a transfer learning approach. The accuracy of the model got 96.89 and 95.75% for Chen and Kaggle datasets, respectively. Kibriya et al. (2022) proposed a 13-layer CNN model and achieved 97.2 and 96.9% accuracy on Chen and Kaggle data sets. Jaspin and Selvan (2023) presented a 10-layer model using different optimizers (Adam and RMSprop) to train the model. On the Chen dataset, the accuracy of 96% was obtained using Adam and 95% was achieved using RMSprop. The studies by Swati et al. (2019) and Rehman et al. (2020) utilized the VGG19 and VGG16 models, respectively, and achieved accuracy rates of 94.82 and 98.69%. Sajjad et al. (2019) segmented the brain tumor region and used VGG19 for image classification, achieving an accuracy of 94.58%. Ghassemi et al. (2020) performed a brain tumor classification task based on a pre-trained Generative Adversarial Network (GAN) with an accuracy of 95.6%. Satyanarayana (2023) combined convolutional neural networks with a deep learning approach based on mass correlation and reported a classification accuracy of 94%. The proposed framework involved the construction of a multi-task CNN model and a 3D densely connected convolutional network. The authors combined the features extracted from a multi-task CNN and a 3D densely connected convolutional network to classify Alzheimer’s disease.
Moreover, it has been proven that combining pre-trained models with machine learning is also a feasible method. Kang et al. (2021) used MobileNetV2 to extract features from brain MRI images, and adopted the SVM algorithm for classification, obtaining an accuracy of 91.58%. In reference (Sekhar et al., 2022), MobileNetV2 was used to extract features from brain tumor images. The extracted features were then classified using SVM and K-Nearest Neighbors (KNN). The best classification accuracy of 98.3% is achieved using KNN. Öksüz et al. (2022) utilized ResNet18 to extract both shallow and deep features from an enlarged Region of Interest (ROI) in brain tumors.
By integrating the shallow and deep features, a classification of the tumors was carried out using SVM and KNN classifiers. The results indicated an overall classification accuracy of 97.25% with the SVM classifier and 97.0% with the KNN classifier. Demir and Akbulut (2022) proposed a new model, in which an R-CNN (Residual-CNN) structure was designed to extract features, using SVM as the classifier, with an accuracy of 96.6% being obtained. Deepak and Ameer (2023) used an additive loss function to train the CNN model, updating the model using different optimizers, then combined it with SVM and finally voted the classification results to derive the final classification result. The model obtained an accuracy of 95.6%. Muezzinoglu et al. (2023) built a new framework PatchResNet. Firstly, using a pre-trained ResNet50 to extract features from same-sized image blocks, feature selection was performed over Neighborhood Component Analysis (NCA), Chi2, and ReliefF. Secondly, the features were fed into the classifier KNN. Finally, majority voting was used to obtain the final prediction result with an accuracy rate of 98.1%.
Optimization algorithms have also been utilized to improve the performance of brain tumor classification systems. In reference (Kabir Anaraki et al., 2019), a Genetic Algorithm (GA) was used to optimize the CNN structure and achieved 94.2% accuracy. Kumar and Mankame (2020) combined the dolphin echolocation algorithm with the Sine Cosine Algorithm (SCA) to segment brain tumors from MRI and used the segmented images for brain tumor classification. Mehnatkesh et al. (2023) applied Improved Ant Colony Optimization (IACO) to optimize the super parameters of the ResNet architecture for brain tumor classification, achieving a classification accuracy rate of 98.694%.
The preceding discussion highlights the extensive adoption of deep learning as a prevalent technique for brain tumor classification. Nevertheless, the optimization of network structures using algorithmic approaches is time-intensive. Training the network from the ground up demands a substantial dataset and entails lengthier training compared to migration-based learning approaches. Furthermore, most of the prior studies have only employed a single dataset without conducting cross-dataset validation. However, our work utilized a pre-trained CNN model and incorporated regularization techniques to combat overfitting. The classification of brain tumors was successfully accomplished by the incorporation of machine learning techniques. Moreover, to verify the generalization performance of the proposed model, some experiments were carried out using two publicly available datasets while performing cross-data validation. And by adding Gaussian noise and salt-and-pepper (S&P) noise to the pictures of the brain tumor, the robustness of the model was further demonstrated.
We presented a novel feature extraction module based on EfficientNetB0 and employed SVM to categorize the resultant features. Specifically, we evaluated the model performance using both triple classification (glioma tumor, meningioma tumor, and pituitary tumor) and quadruple classification (glioma tumor, meningioma tumor, pituitary tumor, and healthy), providing comprehensive validation for our proposed model. In this paper, we presented an automated classification model of brain tumors, and the model was evaluated on two publicly available datasets (Chen and Kaggle). The model used a pre-trained EfficientNetB0 CNN model and combined dropout regularization and dense layers to construct a new feature extraction module EFF_D. The highest classification performance was achieved using the SVM classifier. The main research contributions of this study are as follows:
-
A new model is proposed for brain tumor classification.
-
Based on two public datasets, the proposed model has been proven to be a reliable method for brain tumor classification.
-
By using the last convolution layer of the Grad-CAM visualization model, a localized heat map was obtained, highlighting the brain tumor region.
-
The proposed model can classify brain tumors better than the available models. And the cross-data validation of the model achieves better result.
2. Materials and methods
This section focuses on our proposed approach. The base model used in this method is the pre-trained EfficientNetB0. Firstly, Relevant dropout and dense layers were introduced to construct a new model. Secondly, optimal hyperparameters were utilized to train the new model. Finally, the trained model was subsequently used to extract intricate image features, which were then classified utilizing the SVM algorithm. This approach is helpful in achieving better results in brain tumor classification tasks.
2.1. Introduction to the EfficientNetB0
EfficientNets is a series of convolutional neural network architectures developed by the Google team, making creative use of compound scaling. Of these, EfficientNetB0, as the base model, primarily consists of 16 mobile inverted bottleneck convolution (MBConv) modules (Tan and Le, 2019). In addition, the EfficientNetB0 architecture was utilized to perform 1,000 image classifications on the ImageNet dataset. According to the TensorFlow website1, input images for the model should be represented as floating-point tensors with three color channels and pixel values ranging from 0 to 255.
2.2. Datasets and preprocessing
The experiments were performed on two publicly available brain tumor datasets. The Chen dataset is the CE-MRI dataset shared by Cheng et al. (2015), which consists of 3,064 brain MRI images from 233 patients, including three types of brain tumors, namely glioma, meningioma, and pituitary tumors. The number of images of the three types of brain tumors in the dataset is 1,426, 708, and 930. The Kaggle dataset was obtained from Kaggle (Bhuvaji et al., 2020), which is comprised of 3,264 images including four categories: glioma, meningioma, pituitary, and healthy. The number of images of the four categories in the Kaggle dataset is 926, 937, 901, and 500.
The image of the Chen dataset has a size of 512 × 512 and is a grayscale image. Therefore, the image of Chen needs to be resized to 224 × 224 × 3. The image sizes in the Kaggle dataset are inconsistent, with some grayscale images and some RGB images. Similarly, the images should be adjusted to a uniform size of 224 × 224 × 3. In this paper, the data is randomly divided into non-overlapping training and test sets. The training set comprises 80% of the total dataset, while the remaining 20% is allocated to the test set.
2.3. Classification system
Both the datasets employed in this study, the Chen dataset, which has a total of 3,064 photos, and the Kaggle dataset, which has a total of 3,261 images—are tiny, making migration learning an effective method. The method of transfer learning is frequently used to train neural networks on a small dataset. In general, the process of training neural networks requires large dataset, but the number of brain tumor samples available is limited (Shin et al., 2016; Swati et al., 2019; Yu et al., 2022). Transfer learning offers an effective remedy for small sample size issues by enabling a transfer of knowledge from relevant tasks to new ones. Moreover, application of trained weights enhances both the efficiency and accuracy of models.
The overall architecture and method proposed in this paper are shown in Figure 1. The framework of the proposed brain tumor classification system is shown in Figure 1A. The dataset is divided into a training set and a test set, and they do not cross each other. The proposed model was trained on the training set, and the resulting trained model was saved to disk. The saved model was applied to classify the test set, and its performance was evaluated. As shown in Figure 1B, EfficientNetB0 is utilized as the foundation of our model. Table 1 describes the detailed parameters of the proposed model. The EfficientNetB0 model achieved high accuracy in classification tasks and was pre-trained on the large-scale ImageNet dataset (Tan and Le, 2019). As the dataset used in this experiment differs from the ImageNet dataset, the classification layer of the pre-trained model was removed. Then, we added two layers of Dropout to prevent overfitting, as well as two layers of Dense and one layer of Dense+Softmax to enable the model to classify our target images. The dropout ratios are 0.345 and 0.183, respectively, and the number of neurons in the Dense layer are both 69. The number of neurons in the Classification layer are either 3 or 4. When using an SVM as a classifier, the features extracted from the last Dropout layer can be used for SVM classification. The feature extraction module is called EFF_D, where the method using the Softmax classifier is called EFF_D_Softmax and the method using the SVM is called EFF_D_SVM.
Figure 1

General structure of the paper (A) Framework of the proposed brain tumor classification system (B) The proposed model.
Table 1
| Model | Parameters | Setting |
|---|---|---|
| EFF_D_Softmax | Dropout_1 | 0.345 |
| Dense_1 | 69 | |
| Dense_2 | 69 | |
| Dropout_2 | 0.183 | |
| optimizer | Adam | |
| Learning rate | 0.001 | |
| Batch size | 16 | |
| Loss function | Cross entropy | |
| epoch | 25 | |
| EFF_D_SVM | C | 1 |
| kernel | linear | |
| probability | True |
Parameters of the proposed model.
2.4. Training CNNs
The training of a convolutional neural network combines forward and backward propagation. It starts at the input layer and is propagated forward. Then, the loss is back propagated to the first layer. In layer l, the i-th neuron receives the input from neuron j in layer l-1 through a computation process. Training samples xj are weighted by Eq. 1.
where, represents weights, bi denotes bias. After computing the weighted sum of the variables (In), the resulting values are processed through the activation functions: Swish and Relu, as represented by Eqs 2, 3, respectively.
here, is the output using Swish, and β is a constant. is the output using Relu. The neurons in both the convolutional and fully connected layers are calculated using Eqs 1, 2 (or 3). The classification layer is calculated using the Softmax function which is shown as Eq. 4.
where, K is the number of categories, xi is the i-th element of the input vector x, and yi is the i-th element of the output vector y.
The cross-entropy loss function evaluates the prediction error of the model by comparing the predicted probability distribution generated by the model with the distribution of the true labels, as represented by Eq. 5. This loss function is utilized in the backpropagation process to optimize the model’s parameters and enhance the accuracy of the prediction results.
here, m represents the total number of samples, xi indicates the training sample indexed i, yi represents the corresponding label of xi, and P denotes the probability that xi belongs to class yi.
The model weights are updated according to Eq. 6.
where, αl, γt and μ represent different factors affecting the current iteration of the learning algorithm. αl corresponds to the learning rate at layer l. γt represents the scheduling rate which reduces the initial learning rate and μ is used to describe the influence of previously updated weights on the current iteration.
3. Results and discussion
The experiments were performed in Win11 operating system with 16 G RAM and RTX3060 graphics card of 6 G video memory.
3.1. Performance evaluation
The dataset exhibits an imbalance, thus, it is insufficient to only accuracy is used to quantify model performance. Except for accuracy, precision, recall, and F1-score metrics are also utilized to evaluate the model performance (Alsaggaf et al., 2020). The calculation formulas for these metrics are expressed as follows:
where, TP (True Positive) is the number of correct positive predictions, TN (True Negative) is the number of correct negative predictions, FP (False Positive) is the number of wrong positive predictions, and FN (False Negative) is the number of wrong negative predictions.
3.2. The selection of the benchmark model
The paper conducts a comparative analysis of VGG19, ResNet50, DenseNet121, and EfficientNetB0 models in relation to training time, inference time, total parameters, and test set accuracy. Each model is compared using the Chen dataset, which has seen extensive used. Inference time represents the time required to predict 612 images from the test set. The outcomes of the experiments are presented in Table 2. Although fine-tuning EfficientNetB0 takes relatively more time, its inference time is also faster. Furthermore, EfficientNetB0 has the highest classification accuracy. Therefore, EfficientNetB0 is chosen as the benchmark model.
Table 2
| Model | Training time (seconds) | Inference time (seconds) | Parameters (million) | Test accuracy(%) |
|---|---|---|---|---|
| VGG19 | 542 | 7 | 20.03 | 87.09 |
| ResNet50 | 397 | 4 | 23.59 | 91.18 |
| DenseNet121 | 524 | 3 | 7.04 | 96.57 |
| EfficientNetB0 | 500 | 4 | 4.05 | 98.37 |
Comparison of benchmark models.
3.3. Experimental results
In order to further verify the effectiveness of the proposed model, a series of comparison models were also designed in this article. Initially, the neuron count in EfficientNetB0’s classification layer is aligned with the number of categories in the dataset used for classification. The model is then subjected to fine-tuning. The model employing the Softmax classifier is referred to as EFF_Softmax, while the one employing the SVM classifier is labeled as EFF_SVM.
The training steps of the proposed EFF_D_SVM model are as follows:
Step 1: Importing the data and resizing the images to split the data into a training set and a test set.
Step 2: Loading the model and pre-trained weights, removing the Top layer, and adding the Dropout and Dense layers.
Step 3: Training EFF_D_Softmax to classify brain tumor images.
Step 4: Using EFF_D to extract features and using SVM to classify brain tumors.
Similarly, the same steps are adopted to train EFF_Softmax and EFF_SVM.
The experiments were performed using two datasets. The dataset Chen was used for testing 612 images consisting of 285 glioma tumor images, 141 meningioma tumor images and 186 pituitary tumor images. The Kaggle was used for testing 652 images including 185 glioma tumor images, 187 meningioma tumor images, 180 pituitary tumor image, and 100 no-tumor images.
Figure 2 shows the training results of the EFF_D_Softmax model and the EFF_Softmax model on the training sets of both datasets. Images in Figures 2A,B depict the training results obtained from the Chen dataset, while images in Figures 2C,D represent the training outcomes achieved using the Kaggle dataset. In relation to the Chen dataset, the EFF_D_Softmax model demonstrates an accuracy of 100 and 99.59% on the training and validation sets, respectively. Similarly, the EFF_Softmax model achieves accuracies of 100 and 99.18% on the training and validation sets, respectively. For the Kaggle dataset, the EFF_D_Softmax model achieves 99.93 and 98.21% accuracy on the training and validation sets, respectively. Similarly, the EFF_Softmax model achieves 100 and 98.51% accuracy on the training and validation sets, respectively.
Figure 2

Training results for EFF_D_Softmax and EFF_SoftMax, (A) accuracy curve (Chen dataset) (B) loss curve (Chen dataset) (C) accuracy curve (Kaggle dataset) (D) loss curve (Kaggle dataset).
The confusion matrixes for the classification results of the proposed method are shown in Figures 3, 4. Eqs 6–9 are utilized to calculate the detailed values of the model classification results from the confusion matrixes. The labels G, M, P, and NO represent different types of brain tumors: G for glioma, M for meningioma, P for pituitary tumor, and NO for the absence of a tumor. The obtained model metrics on the Chen and Kaggle are listed in Tables 3, 4, respectively. Moreover, to visually show the superiority of the adopted EFF_D_SVM model, the average metrics for classification results on the Chen dataset and Kaggle dataset are shown in Figures 5A,B, respectively. On the Chen, EFF_D_SVM showed the best classification results. On the Kaggle, as can be seen from Figure 5B, EFF_D_SVM outperformed the other models in terms of accuracy, f1-score and precision, but its recall rate was lower than that of EFF_SVM. Through the comparison in Table 4, we can see that the recall rate of EFF_D_SVM was higher than that of EFF_SVM for glioma, meningioma, and pituitary, and slightly lower than that of the EFF_SVM for no tumor. In a comprehensive analysis, the classification ability of EFF_D_SVM is still better than that of EFF_SVM. The Softmax classifier constantly strives for higher probabilities for correct classifications and lower probabilities for incorrect classifications, aiming to minimize the loss value. In contrast, the SVM classifier only needs to satisfy the boundary value and does not need to perform subtle manipulations on the concrete scores. Consequently, the Softmax classifier exhibits overfitting in brain tumor classification. Typically, Softmax is employed for large datasets, while SVM is suited for smaller datasets. In this paper, a small dataset is used, which could also contribute to the favorable performance of SVM classification.
Figure 3

Confusion matrix of the proposed model in the Chen (A) EFF_D_Softmax (B) EFF_D_SVM (C) EFF_Softmax (D) EFF_SVM.
Figure 4

Confusion matrix of the proposed model in the Kaggle (A) EFF_D_Softmax (B) EFF_D_SVM (C) EFF_Softmax (D) EFF_SVM.
Table 3
| Proposed model | Tumor type | Precision (%) | Recall (%) | F1-score (%) | Accuracy (%) |
|---|---|---|---|---|---|
| EFF_D_Softmax | Glioma | 98.61 | 99.30 | 98.95 | 98.37 |
| Meningioma | 96.45 | 96.45 | 96.45 | ||
| Pituitary | 99.46 | 98.39 | 98.92 | ||
| Average | 98.17 | 98.07 | 98.11 | ||
| EFF_D_SVM | Glioma | 98.95 | 99.30 | 99.12 | 98.86 |
| Meningioma | 97.20 | 98.58 | 97.89 | ||
| Pituitary | 1.00 | 98.39 | 99.19 | ||
| Average | 98.72 | 98.76 | 98.73 | ||
| EFF_Softmax | Glioma | 98.60 | 98.60 | 98.60 | 98.04 |
| Meningioma | 94.48 | 97.16 | 95.80 | ||
| Pituitary | 1.00 | 97.85 | 98.91 | ||
| Average | 97.69 | 97.87 | 97.77 | ||
| EFF_SVM | Glioma | 99.29 | 98.60 | 98.94 | 98.69 |
| Meningioma | 95.86 | 98.58 | 97.20 | ||
| Pituitary | 1.00 | 98.92 | 99.46 | ||
| Average | 98.38 | 98.70 | 98.53 |
Detailed metrics values of the proposed model on the Chen dataset.
Table 4
| Proposed model | Tumor type | Precision (%) | Recall (%) | F1-score (%) | Accuracy (%) |
|---|---|---|---|---|---|
| EFF_D_Softmax | Glioma | 96.83 | 98.92 | 97.86 | 97.85 |
| Meningioma | 98.88 | 94.65 | 96.72 | ||
| No Tumor | 98.02 | 99 | 98.51 | ||
| Pituitary | 97.81 | 99.44 | 98.62 | ||
| Average | 97.89 | 98 | 97.93 | ||
| Meningioma | 98.88 | 94.65 | 96.72 | ||
| No Tumor | 98.02 | 99 | 98.51 | ||
| Pituitary | 97.81 | 99.44 | 98.62 | ||
| Average | 97.89 | 98 | 97.93 | ||
| EFF_D_SVM | Glioma | 97.86 | 98.92 | 98.39 | 98.31 |
| Meningioma | 97.33 | 97.33 | 97.33 | ||
| No Tumor | 1 | 97 | 98.48 | ||
| Pituitary | 98.9 | 99.44 | 99.17 | ||
| Meningioma | 97.33 | 97.33 | 97.33 | ||
| No Tumor | 1 | 97 | 98.48 | ||
| Pituitary | 98.9 | 99.44 | 99.17 | ||
| Average | 98.52 | 98.17 | 98.34 | ||
| EFF_Softmax | Glioma | 95.31 | 98.92 | 97.08 | 97.55 |
| Meningioma | 98.31 | 93.05 | 95.6 | ||
| No Tumor | 96.15 | 1 | 98.04 | ||
| Pituitary | 1 | 99.44 | 99.72 | ||
| Average | 97.88 | 98 | 97.93 | ||
| EFF_SVM | Glioma | 98.37 | 97.84 | 98.1 | 98 |
| Meningioma | 97.3 | 96.26 | 96.77 | ||
| No Tumor | 95.24 | 1 | 97.56 | ||
| Pituitary | 1 | 98.89 | 99.44 | ||
| Average | 97.73 | 98.25 | 97.97 |
Detailed metrics values of the proposed model on the Kaggle dataset.
Figure 5
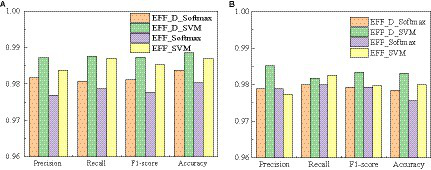
Average metrics for classification results (A) Chen (B) Kaggle.
Figure 6
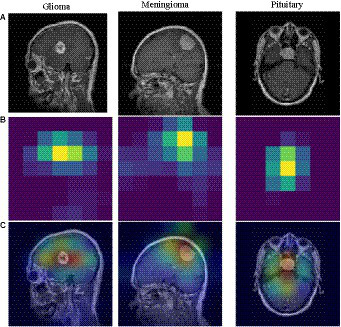
Grad-CAM visualization of different tumors. (A) brain tumor (B) heatmap (C) superimposed image.
On one hand, the model’s fitting ability pertains to its capacity to accurately capture patterns and relationships within the training data. On the other hand, generalizability encompasses the model’s capability to perform with data which has not encountered previously. When too much emphasis is placed on the model’s ability to fit, the model may overfit on the training data set and underperform on new data not seen before. Moreover, as can be observed from Figures 2, the EFF_D_Softmax and EFF_Softmax fit well on the training sets of both datasets. However, model validation on test sets for both datasets found that the EFF_D_Softmax outperformed the EFF_Softmax. Therefore, EFF_D_Softmax has better anti-fitting and generalization ability.
The Receiver Operating Characteristic (ROC) curve offers an effective tool to assess the model classification ability by the relationship curve between the false positive rate and the true positive rate. The Area Under the Curve (AUC) provides essential information about the ability of the proposed model to differentiate between tumor types. The classifier performance is better if the AUC value is higher. The ROC curves of EFF_D_SVM for Chen and Kaggle are depicted in Figures 7A,B, respectively. These curves, which are very close to the upper-left corner, indicate that the EFF_D_SVM model has excellent classification ability. In the Chen dataset, the AUC values of EFF_D_SVM for glioma, meningioma, and pituitary are 0.9994, 0.9998, and 0.9996, respectively. And in the Kaggle dataset, the AUC values of EFF_D_SVM for glioma, meningioma, pituitary adenoma and tumor-free are 0.9937, 0.9964, 0.9999 and 0.9999, respectively.
Figure 7

ROC curve for EFF_D_SVM (A) Chen (B) Kaggle.
The classification results obtained by our proposed model are compared with those obtained by previous state-of-the-art models that used the same dataset, as shown in Table 5. It can be observed that the proposed model outperforms the available state-of-the-art methods, both on Chen and Kaggle datasets. In particular, the accuracy of our proposed EFF_D_SVM model achieve 98.86 and 98.31% on Chen and Kaggle, respectively.
Table 5
| Reference | Dataset | Method | Accuracy(%) | F1-score(%) | Precision(%) | Recall (%) |
|---|---|---|---|---|---|---|
| Swati et al. (2019) | Chen | Fine-tuned VGG19 | 94.82 | 91.73 | 89.52 | 94.25 |
| Sekhar et al. (2022) | Chen | GoogleNet+KNN | 98.3 | 97.24 | 97.24 | 97.23 |
| Öksüz et al. (2022) | Chen | ResNet18 + ShallowNet+SVM | 97.25 | 95.26 | 95.25 | 95.27 |
| Satyanarayana (2023) | Chen | DCNN-MCN | 94 | – | – | – |
| Deepak and Ameer (2023) | Chen | Majority voting | 95.6 | – | – | – |
| Jaspin and Selvan (2023) | Chen | MCCNN | 95.17 | 95 | 96 | 95 |
| Mehnatkesh et al. (2023) | Chen | Optimizing ResNet | 98.694 | 98.458 | 98.53 | 98.40 |
| Kang et al. (2021) | Kaggle | MobileNetV2 + SVM | 98.16 | – | – | – |
| Muezzinoglu et al. (2023) | Kaggle | PatchResNet | 98.1 | 98.1 | 97.91 | 98.15 |
| Alanazi et al. (2022) | Chen | 22-layer-CNN | 96.89 | – | – | – |
| Kaggle | 95.75 | – | – | – | ||
| Kibriya et al. (2022) | Chen | 13-layer CNN | 97.2 | - | 97 | 96 |
| Kaggle | 96.9 | – | – | – | ||
| Proposed model | Chen | EFF_D_SVM | 98.86 | 98.73 | 98.76 | 98.72 |
| Kaggle | 98.31 | 98.34 | 98.52 | 98.17 |
Comparison of our proposed model with previous models.
To understand the model’s area of interest for a category, we visualized it using the Grad-CAM (Selvaraju et al., 2020) technique. This technique can help us to understand how the model distinguishes different types of brain tumors. In this paper, Grad-CAM is used to create a class activation heat map. The contribution of a specific part in differentiating between different brain tumors is directly proportional to the darkness of its corresponding color. Figure 6 shows a visual depiction of EFF_D_SVM for brain tumor image categorization using Grad-CAM. The heat map produced by Grad-CAM is displayed in Figure 6B, while Figure 6C exhibits the outcome of superimposing the heat map onto the original image. Figure 6C visually demonstrates the application of the grad-cam technique, where the area of the brain tumor is highlighted in red. This indicates that the tumor region serves as a prominent feature in differentiating brain tumors, although the surrounding area is also included.
3.4. Cross-dataset validation and robustness validation
To further demonstrate the robustness of our proposed model, cross-validating experiment on multiple datasets was also carried out. Considering that the Chen dataset is three-class dataset while the Kaggle dataset comprises four classes, EFF_D_SVM and EFF_SVM will be evaluated on Kaggle while excluding the normal category classes. This decision was made to ensure the model reliability and validity while avoiding any potential confounding factors. Table 6 es the results of cross-dataset validation. EFF_D_SVM achieves an F1-score of 97.61% and accuracy of 97.62%, which performs better than other models. These results suggest that the proposed EFF_D_SVM model has strong robustness.
Table 6
| Model | Precision (%) | Recall (%) | F1-score (%) | Accuracy (%) |
|---|---|---|---|---|
| EFF_D_Softmax | 97.20 | 97.08 | 97.08 | 97.09 |
| EFF_D_SVM | 97.67 | 97.61 | 97.61 | 97.62 |
| EFF_Softmax | 92.67 | 94.37 | 93.42 | 94.04 |
| EFF_SVM | 97.44 | 97.37 | 97.36 | 97.37 |
Results of cross-data validation.
To further evaluate the robustness of the model, gaussian noise and S&P noise were added to the test sets of brain tumor images, respectively. Gaussian noise constitutes a form of noise characterized by a probability density function that adheres to a Gaussian distribution. This type of noise frequently manifests in digital images. The emergence of Gaussian noise stems from intricate interplays among circuit components, prolonged functioning of the image sensor, and various other contributing factors. S & P is often referred to as impulse noise, which randomly modifies certain pixel values to appear as sporadic black-and-white dots in the image. This form of noise arises from the image sensor, transmission channel, decoding, and processing stages, resulting in both bright and dark dots scattered throughout the image. The robustness of models was verified by adding noise to datasets. Here, the variance of the Gaussian noise has been configured at 0.001, while the S&P noise affects 0.005 of the total pixels. Subsequently, the resulting image, which encompasses both Gaussian and S&P noise, is visually depicted in Figure 8. The Table 7 reveals that EFF_D_SVM demonstrates superior robustness compared to the other three models. Following the introduction of Gaussian and S&P noise to the images, EFF_D_SVM achieves classification accuracies of 95.42 and 96.24% for the Chen dataset, and 93.40 and 95.71% for the Kaggle dataset. Notably, for the test set of the Kaggle dataset, both EFF_Softmax and EFF_SVM exhibit classification accuracies below 90% upon the introduction of Gaussian noise, which shows that they have weak robustness.
Figure 8

Images after adding noise (A) original image (B) Gaussian noise (C) S&P.
Table 7
| Dataset | Type of noise | Model | Precision (%) | Recall (%) | F1-score (%) | Accuracy (%) |
|---|---|---|---|---|---|---|
| Chen | Gaussian noise | EFF_D_Softmax | 94.96 | 94.23 | 94.36 | 94.44 |
| EFF_D_SVM | 95.76 | 95.17 | 95.34 | 95.42 | ||
| EFF_Softmax | 93.46 | 89.49 | 90.42 | 92.32 | ||
| EFF_SVM | 93.69 | 89.31 | 90.57 | 92.16 | ||
| Salt and pepper noise | EFF_D_Softmax | 95.73 | 94.81 | 95.10 | 95.42 | |
| EFF_D_SVM | 96.67 | 95.22 | 95.83 | 96.24 | ||
| EFF_Softmax | 95.73 | 94.81 | 95.10 | 95.42 | ||
| EFF_SVM | 94.58 | 93.16 | 93.45 | 94.28 | ||
| Kaggle | Gaussian noise | EFF_D_Softmax | 94.14 | 92.89 | 93.25 | 93.10 |
| EFF_D_SVM | 93.76 | 93.25 | 93.54 | 93.40 | ||
| EFF_Softmax | 84.62 | 85.47 | 83.40 | 83.44 | ||
| EFF_SVM | 86.86 | 88.41 | 86.12 | 86.81 | ||
| Salt and pepper noise | EFF_D_Softmax | 94.38 | 95.04 | 94.45 | 94.33 | |
| EFF_D_SVM | 95.99 | 96.25 | 96.06 | 95.71 | ||
| EFF_Softmax | 92.89 | 93.05 | 92.31 | 92.02 | ||
| EFF_SVM | 91.09 | 91.93 | 91.14 | 90.95 |
Classification results of models after adding noise.
4. Conclusion
Early diagnosis of brain tumors is critical for selecting appropriate treatment options and saving the lives of patients. The manual examination of brain tumors is a laborious and time-consuming process, therefore, it is necessary to develop an automated detection method to aid physicians. This paper proposes a novel approach to detect multiple types of brain tumors. In this paper, a new feature extraction module EEF_D is proposed. Features are extracted from brain tumor images using EFF_D and the features are classified using SVM. To verify the effectiveness of our approach, a series of comparative experiments were also performed. The EFF_D_SVM model exhibits excellent classification ability for brain tumors with minimal Data pre-processing, as validated on both the Chen and Kaggle datasets. On the Chen dataset, EFF_D_SVM achieves a classification accuracy of 98.86% and an F1-score of 98.73%, and on the Kaggle dataset, it yields the corresponding values of 98.31 and 98.34%, respectively. Through comparison with other state-of-the-art models, the proposed model outperforms the available state-of-the-art methods. Moreover, by means of cross-validation experiments, the proposed model is proved to be very robust. In future work, samples from other types of brain disorders could be added to expand the dataset to improve the performance of the model, in turn to enhance the ability to identify other disorders.
Statements
Data availability statement
The datasets presented in this study can be found in online repositories. The names of the repository/repositories and accession number(s) can be found below: https://figshare.com/articles/dataset/brain_tumor_dataset/1512427https://www.kaggle.com/datasets/sartajbhuvaji/brain-tumor-classification-mri.
Author contributions
JZ: Investigation, Methodology, Project administration, Writing – original draft. XT: Software, Writing – original draft. WC: Writing – review & editing, Formal analysis, Software, Validation, Visualization. GD: Writing – review & editing, Project administration, Supervision. QF: Writing – review & editing, Validation. HZ: Investigation, Writing – review & editing. HJ: Investigation, Validation, Writing – review & editing.
Funding
The author(s) declare financial support was received for the research, authorship, and/or publication of this article. This work was supported by Major Science and Technology Projects of Henan Province (Grant No. 221100210500), the Medical and Health Research Project in Luoyang (Grant No. 2001027A), and the Construction Project of Improving Medical Service Capacity of Provincial Medical Institutions in Henan Province (Grant No. 2017–51).
Conflict of interest
The authors declare that the research was conducted in the absence of any commercial or financial relationships that could be construed as a potential conflict of interest.
Publisher’s note
All claims expressed in this article are solely those of the authors and do not necessarily represent those of their affiliated organizations, or those of the publisher, the editors and the reviewers. Any product that may be evaluated in this article, or claim that may be made by its manufacturer, is not guaranteed or endorsed by the publisher.
References
1
Abiwinanda N. Hanif M. Hesaputra S. T. Handayani A. Mengko T. R. (2019). “Brain tumor classification using convolutional neural network” in World congress on medical physics and biomedical engineering 2018 (Singapore, FL: Springer Nature Singapore), 183–189.
2
Alanazi M. F. Ali M. U. Hussain S. J. Zafar A. Mohatram M. Irfan M. et al . (2022). Brain tumor/mass classification framework using magnetic-resonance-imaging-based isolated and developed transfer deep-learning model. Sensors22:372. doi: 10.3390/s22010372
3
Alsaggaf W. Cömert Z. Nour M. Polat K. Brdesee H. Toğaçar M. (2020). Predicting fetal hypoxia using common spatial pattern and machine learning from cardiotocography signals. Appl. Acoust.167:107429. doi: 10.1016/j.apacoust.2020.107429
4
Alyami J. Rehman A. Almutairi F. Fayyaz A. M. Roy S. Saba T. et al . (2023). Tumor localization and classification from MRI of brain using deep convolution neural network and Salp swarm algorithm. Cogn. Comput., 1–11. (in press) doi: 10.1007/s12559-022-10096-2
5
Amin J. Sharif M. Yasmin M. Fernandes S. L. (2020). A distinctive approach in brain tumor detection and classification using MRI. Pattern Recogn. Lett.139, 118–127. doi: 10.1016/j.patrec.2017.10.036
6
Ayadi W. Charfi I. Elhamzi W. Atri M. (2022). Brain tumor classification based on hybrid approach. Vis. Comput.38, 107–117. doi: 10.1007/s00371-020-02005-1
7
Bar Y. Diamant I. Wolf L. Greenspan H. (2015). “Deep learning with non-medical training used for chest pathology identification,” in Medical imaging 2015: computer-aided diagnosis, Orlando, FL.
8
Bhuvaji S. Kadam A. Bhumkar P. Dedge S. Kanchan S . (2020). Brain tumor classification (MRI). Available at: https://www.kaggle.com/datasets/sartajbhuvaji/brain-tumor-classification-mri (Accessed October 20, 2022).
9
Bi D. Zhu D. Sheykhahmad F. R. Qiao M. (2021). Computer-aided skin cancer diagnosis based on a new meta-heuristic algorithm combined with support vector method. Biomed. Signal Process. Control68:102631. doi: 10.1016/j.bspc.2021.102631
10
Cheng J. Huang W. Cao S. Yang R. Yang W. Yun Z. et al . (2015). Enhanced performance of brain tumor classification via tumor region augmentation and partition. PLoS One10:e0140381. doi: 10.1371/journal.pone.0140381
11
Deepak S. Ameer P. M. (2019). Brain tumor classification using deep CNN features via transfer learning. Comput. Biol. Med.111:103345. doi: 10.1016/j.compbiomed.2019.103345
12
Deepak S. Ameer P. M. (2023). Brain tumor categorization from imbalanced MRI dataset using weighted loss and deep feature fusion. Neurocomputing520, 94–102. doi: 10.1016/j.neucom.2022.11.039
13
Demir F. Akbulut Y. (2022). A new deep technique using R-CNN model and L1NSR feature selection for brain MRI classification. Biomed. Signal Process. Control75:103625. doi: 10.1016/j.bspc.2022.103625
14
Ghassemi N. Shoeibi A. Rouhani M. (2020). Deep neural network with generative adversarial networks pre-training for brain tumor classification based on MR images. Biomed. Signal Process. Control57:101678. doi: 10.1016/j.bspc.2019.101678
15
Gu Y. Li K. (2021). A transfer model based on supervised multi-layer dictionary learning for brain tumor MRI image recognition. Front. Neurosci.15:687496. doi: 10.3389/fnins.2021.687496
16
Gu X. Shen Z. Xue J. Fan Y. Ni T. (2021). Brain tumor MR image classification using convolutional dictionary learning with local constraint. Front. Neurosci.15:679847. doi: 10.3389/fnins.2021.679847
17
Gumaei A. Hassan M. M. Hassan M. R. Alelaiwi A. Fortino G. (2019). A hybrid feature extraction method with regularized extreme learning machine for brain tumor classification. IEEE Access7, 36266–36273. doi: 10.1109/ACCESS.2019.2904145
18
Jaspin K. Selvan S. (2023). Multiclass convolutional neural network based classification for the diagnosis of brain MRI images. Biomed. Signal Process. Control82:104542. doi: 10.1016/j.bspc.2022.104542
19
Kabir Anaraki A. Ayati M. Kazemi F. (2019). Magnetic resonance imaging-based brain tumor grades classification and grading via convolutional neural networks and genetic algorithms. Biocybern. Biomed. Eng.39, 63–74. doi: 10.1016/j.bbe.2018.10.004
20
Kang J. Ullah Z. Gwak J. (2021). MRI-based brain tumor classification using Ensemble of Deep Features and Machine Learning Classifiers. Sensors21:2222. doi: 10.3390/s21062222
21
Kaur T. Gandhi T. K. (2020). Deep convolutional neural networks with transfer learning for automated brain image classification. Mach. Vis. Appl.31:20. doi: 10.1007/s00138-020-01069-2
22
Khan M. A. Lali I. U. Rehman A. Ishaq M. Sharif M. Saba T. et al . (2019). Brain tumor detection and classification: a framework of marker-based watershed algorithm and multilevel priority features selection. Microsc. Res. Tech.82, 909–922. doi: 10.1002/jemt.23238
23
Kibriya H. Masood M. Nawaz M. Nazir T. (2022). Multiclass classification of brain tumors using a novel CNN architecture. Multimed. Tools Appl.81, 29847–29863. doi: 10.1007/s11042-022-12977-y
24
Kumar S. Mankame D. P. (2020). Optimization driven deep convolution neural network for brain tumor classification. Biocybern. Biomed. Eng.40, 1190–1204. doi: 10.1016/j.bbe.2020.05.009
25
Maurya S. Tiwari S. Mothukuri M. C. Tangeda C. M. Nandigam R. N. S. Addagiri D. C. (2023). A review on recent developments in cancer detection using machine learning and deep learning models. Biomed. Signal Process. Control80:104398. doi: 10.1016/j.bspc.2022.104398
26
Mehnatkesh H. Jalali S. M. J. Khosravi A. Nahavandi S. (2023). An intelligent driven deep residual learning framework for brain tumor classification using MRI images. Expert Syst. Appl.213:119087. doi: 10.1016/j.eswa.2022.119087
27
Muezzinoglu T. Baygin N. Tuncer I. Barua P. D. Baygin M. Dogan S. et al . (2023). Patch res net: multiple patch division–based deep feature fusion framework for brain tumor classification using MRI images. J. Digit. Imaging36, 973–987. doi: 10.1007/s10278-023-00789-x
28
Nanda A. Barik R. C. Bakshi S. (2023). SSO-RBNN driven brain tumor classification with saliency-K-means segmentation technique. Biomed. Signal Process. Control81:104356. doi: 10.1016/j.bspc.2022.104356
29
Nayak D. R. Padhy N. Mallick P. K. Zymbler M. Kumar S. (2022). Brain tumor classification using dense efficient-net. Axioms11:34. doi: 10.3390/axioms11010034
30
Öksüz C. Urhan O. Güllü M. K. (2022). Brain tumor classification using the fused features extracted from expanded tumor region. Biomed. Signal Process. Control72:103356. doi: 10.1016/j.bspc.2021.103356
31
Özbay E. Altunbey Özbay F. (2023). Interpretable features fusion with precision MRI images deep hashing for brain tumor detection. Comput. Methods Prog. Biomed.231:107387. doi: 10.1016/j.cmpb.2023.107387
32
Rehman A. Naz S. Razzak M. I. Akram F. Imran M. (2020). A deep learning-based framework for automatic brain tumors classification using transfer learning. Circuits Syst. Signal Process.39, 757–775. doi: 10.1007/s00034-019-01246-3
33
Sajjad M. Khan S. Muhammad K. Wu W. Ullah A. Baik S. W. (2019). Multi-grade brain tumor classification using deep CNN with extensive data augmentation. J. Computat. Sci.30, 174–182. doi: 10.1016/j.jocs.2018.12.003
34
Saravanan S. Heshma B. Ashma Shanofer A. V. Vanithamani R. (2020). Skin cancer detection using dermoscope images. Mater. Today Proc.33, 4823–4827. doi: 10.1016/j.matpr.2020.08.388
35
Satyanarayana G. (2023). A mass correlation based deep learning approach using deep convolutional neural network to classify the brain tumor. Biomed. Signal Process. Control81:104395. doi: 10.1016/j.bspc.2022.104395
36
Sekhar A. Biswas S. Hazra R. Sunaniya A. K. Mukherjee A. Yang L. (2022). Brain tumor classification using fine-tuned Goog LeNet features and machine learning algorithms: IoMT enabled CAD system. IEEE J. Biomed. Health Inform.26, 983–991. doi: 10.1109/JBHI.2021.3100758
37
Selvaraju R. R. Cogswell M. Das A. Vedantam R. Parikh D. Batra D. (2020). Grad-CAM: visual explanations from deep networks via gradient-based localization. Int. J. Comput. Vis.128, 336–359. doi: 10.1007/s11263-019-01228-7
38
Shah H. A. Saeed F. Yun S. Park J.-H. Paul A. Kang J.-M. (2022). A robust approach for brain tumor detection in magnetic resonance images using Finetuned efficient net. IEEE Access10, 65426–65438. doi: 10.1109/ACCESS.2022.3184113
39
Shahin A. I. Aly W. Aly S. (2023). MBTFCN: a novel modular fully convolutional network for MRI brain tumor multi-classification. Expert Syst. Appl.212:118776. doi: 10.1016/j.eswa.2022.118776
40
Shin H.-C. Roth H. R. Gao M. Lu L. Xu Z. Nogues I. et al . (2016). Deep convolutional neural networks for computer-aided detection: CNN architectures, dataset characteristics and transfer learning. IEEE Trans. Med. Imaging35, 1285–1298. doi: 10.1109/TMI.2016.2528162
41
Swati Z. N. K. Zhao Q. Kabir M. Ali F. Ali Z. Ahmed S. et al . (2019). Brain tumor classification for MR images using transfer learning and fine-tuning. Comput. Med. Imaging Graph.75, 34–46. doi: 10.1016/j.compmedimag.2019.05.001
42
Talo M. Baloglu U. B. Yıldırım Ö. Rajendra Acharya U. (2019). Application of deep transfer learning for automated brain abnormality classification using MR images. Cogn. Syst. Res.54, 176–188. doi: 10.1016/j.cogsys.2018.12.007
43
Tan M. Le Q. V. (2019). “Efficientnet: Rethinking model scaling for convolutional neural networks”, in International Conference on Machine Learning, vol. 97, Long Beach, CA.
44
Yu X. Wang J. Hong Q.-Q. Teku R. Wang S.-H. Zhang Y.-D. (2022). Transfer learning for medical images analyses: a survey. Neurocomputing489, 230–254. doi: 10.1016/j.neucom.2021.08.159
45
Zulfiqar F. Ijaz Bajwa U. Mehmood Y. (2023). Multi-class classification of brain tumor types from MR images using efficient nets. Biomed. Signal Process. Control84:104777. doi: 10.1016/j.bspc.2023.104777
Summary
Keywords
brain tumors, transfer learning, feature extraction, grad-CAM, robustness
Citation
Zhang J, Tan X, Chen W, Du G, Fu Q, Zhang H and Jiang H (2023) EFF_D_SVM: a robust multi-type brain tumor classification system. Front. Neurosci. 17:1269100. doi: 10.3389/fnins.2023.1269100
Received
29 July 2023
Accepted
29 August 2023
Published
29 September 2023
Volume
17 - 2023
Edited by
Hao Zhang, Central South University, China
Reviewed by
Dahua Yu, Inner Mongolia University of Science and Technology, China; Yangding Li, Hunan Normal University, China
Updates
Copyright
© 2023 Zhang, Tan, Chen, Du, Fu, Zhang and Jiang.
This is an open-access article distributed under the terms of the Creative Commons Attribution License (CC BY). The use, distribution or reproduction in other forums is permitted, provided the original author(s) and the copyright owner(s) are credited and that the original publication in this journal is cited, in accordance with accepted academic practice. No use, distribution or reproduction is permitted which does not comply with these terms.
*Correspondence: Wenna Chen, chenwenna0408@163.com
Disclaimer
All claims expressed in this article are solely those of the authors and do not necessarily represent those of their affiliated organizations, or those of the publisher, the editors and the reviewers. Any product that may be evaluated in this article or claim that may be made by its manufacturer is not guaranteed or endorsed by the publisher.