 Wang ZheziXiong YanxiXie XingwuLi ShengMo BenchengSu GuangpingLv YunyiLiu Yue*
- Department of Radiology Imaging Center, Renmin Hospital, Hubei University of Medicine, Shiyan, Hubei, China
Objective: This study aims to investigate the effects of Type 2 Diabetes Mellitus (T2DM) on brain function in patients with Obstructive Sleep Apnea (OSA) using Regional Homogeneity (ReHo) combined with seed-based Functional Connectivity (FC) methods.
Materials and methods: 46 OSA patients, 38 OSA with T2DM patients, and 34 healthy controls (HC) were prospectively recruited. Clinical data were collected from all participants, and neuropsychological testing was performed using the Montreal Cognitive Assessment (MoCA), Mini-Mental State Examination (MMSE), and Epworth Sleepiness Scale (ESS). Resting-state functional magnetic resonance imaging (rs-fMRI) data were collected, and ReHo combined with seed-based FC analysis was used to assess brain function differences among the three groups. Finally, partial correlation analysis was conducted to investigate the relationship between clinical variables and imaging metrics ofthe differential brain regions.
Results: Compared to HCs group, the OSA group showed increased ReHo in the left occipital gyrus, and decreased ReHo in the right fusiform gyrus and left cerebellum region 8. Furthermore, FC between the left occipital gyrus and left cerebellum region 8, as well as between the right fusiform gyrus and left cerebellum region 3, was significantly decreased. Partial correlation analysis revealed a significant negative correlation between ReHo in the right fusiform gyrus and the Oxygen Desaturation Index (ODI), and a significant positive correlation between FC in the left cerebellum region 8 and MMSE scores. Compared to the OSA group, the OSA with T2DM group exhibited decreased ReHo in the left occipital gyrus, with increased FC between the left occipital gyrus and left thalamus. Partial correlation analysis showed that ReHo in the left occipital gyrus was significantly negatively correlated with the Insulin Resistance Index (IRI), while FC in the left thalamus was negatively correlated with MoCA scores and positively correlated with hemoglobinA1c (HbA1c) levels.
Conclusion: T2DM affects brain function in OSA patients, further exacerbating cognitive burden. These findings provide valuable insights into the neuropathological mechanisms ofT2DM in OSA and support the development of objective neuroimaging biomarkers.
1 Introduction
Type 2 diabetes mellitus (T2DM) is a metabolic disorder characterized by hyperglycemia and hyperinsulinemia. With improvements in living standards and an aging population, the global number of individuals with T2DM is projected to reach 642 million by 2024 (Yang et al., 2024). Prolonged hyperglycemia and glycemic variability in T2DM contribute to systemic macrovascular and microvascular complications, which can ultimately lead to severe multi-organ comorbidities (Xu et al., 2024). As a chronic metabolic condition, T2DM is associated with reduced expression of insulin receptors and decreased receptor tyrosine kinase activity, which promotes the accumulation of amyloid-β (Aβ) and tau proteins (Arnold et al., 2018). Chronic hyperglycemia and insulin resistance impair neuronal function, synaptic plasticity, and neurovascular integrity, triggering neuroinflammation and oxidative stress that exacerbate brain injury and eventually result in cognitive impairment (Van Sloten et al., 2020). Obstructive sleep apnoea (OSA) is a highly prevalent sleep-related breathing disorder. Based on the criterion of an apnea-hypopnoea index (AHI) ≥ 5 episodes per hour, approximately 936 million individuals aged 30–69 years worldwide are affected by OSA (Benjafield et al., 2019). OSA is characterized by recurrent partial (hypopnea) or complete (apnea) upper airway obstruction during sleep, accompanied by sleep disturbances (such as fragmentation or deprivation), intermittent hypoxia, hypercapnia, and other inflammation-related comorbidities. Furthermore, in terms of cognitive function, individuals with OSA exhibit varying degrees of impairment compared to healthy controls (Mohammadi et al., 2025).
Multiple cross-sectional studies suggest a potential bidirectional relationship between OSA and T2DM. On one hand, OSA may exacerbate glucose metabolic dysfunction through various mechanisms. Firstly, two hallmark features of OSA—intermittent hypoxia and sleep fragmentation—can activate the sympathetic nervous system, thereby promoting insulin resistance (IR) and increasing hepatic glucose production (Pamidi and Tasali, 2012). Secondly, intermittent hypoxia has been shown to be a risk factor for glucose metabolism disorders, independent of obesity. Recurrent cycles of hypoxia and reoxygenation can trigger oxidative stress and promote the release of inflammatory cytokines such as TNF-α and IL-6. The resulting systemic inflammatory state further contributes to the dysregulation of adipokines such as leptin and adiponectin, ultimately impairing insulin signaling pathways (Drager et al., 2011; Ryan et al., 2005). Thirdly, chronic sleep deprivation and poor sleep quality significantly impair glucose homeostasis, as evidenced by reduced insulin sensitivity and compromised compensatory capacity of pancreatic β-cells. Moreover, sleep deprivation can activate the hypothalamic–pituitary–adrenal axis, leading to increased cortisol secretion and gluconeogenesis, thereby exacerbating fasting hyperglycemia (Spiegel et al., 2009). On the other hand, the metabolic abnormalities associated with T2DM may impair respiratory control and upper airway stability, increasing the risk of OSA. Studies have reported that the prevalence of OSA among individuals with T2DM ranges from 24 to 86% (West et al., 2018). Compared with individuals without T2DM, those with T2DM are nearly twice as likely to develop OSA, and this association is independent of potential confounding variables and conventional OSA risk factors (Subramanian et al., 2019). A prospective cohort study further demonstrated that T2DM patients with elevated fasting insulin levels and higher homeostasis model assessment of insulin resistance (HOMA-IR) scores have a significantly increased incidence of OSA (Huang et al., 2022). Although there is a strong association between OSA and T2DM, most current neuroimaging studies continue to examine them as separate conditions. Given their high comorbidity and the potential synergistic effects on neurocognitive function, it is essential to investigate how the coexistence of OSA and T2DM specifically impacts brain function.
In this study, we included a healthy control group, an OSA group, and an OSA with T2DM group, and applied regional homogeneity (ReHo) and functional connectivity (FC) analyses to examine the impact of T2DM on brain function in OSA. ReHo assesses the temporal synchronization between a given voxel and its neighboring voxels, servin as an important indicator of local neuronal activity (Yu et al., 2023). FC measures the temporal correlation of neural activity between spatially separated brain regions, allowing for the assessment of functional interactions between impaired regions and other brain areas (Han et al., 2025). We hypothesize that T2DM may aggravate brain dysfunction in OSA patients and contribute to increased cognitive burden.
2 Materials and methods
2.1 Participants
This study employed a prospective recruitment design. From June 2023 to November 2024, we screened the medical record system of Shiyan People’s Hospital, affiliated with Hubei University of Medicine, and enrolled 46 OSA patients, 38 OSA with T2DM patients, as well as 34 age-, sex-, and education-matched healthy controls (HCs). The inclusion criteria for the OSA group were as follows: (1) age between 30 and 70 years; (2) right-handedness; (3) at least 6 years of formal education; and (4) a diagnosis of moderate-to-severe OSA, with an AHI > 15 events/h according to the 2.3 edition (2017) of the American Academy of Sleep Medicine (AASM) Manual for the Scoring of Sleep and Associated Events (Kapur et al., 2017), with no history of continuous positive airway pressure (CPAP) treatment. For the OSA with T2DM group, the inclusion criteria were: (1) age between 30 and 70 years; (2) right-handedness; (3) at least 6 years of formal education; (4) a confirmed diagnosis of T2DM base on the 2010 diagnostic criteria of the American Diabetes Association (ADA) (American Diabetes A, 2010), with stable long-term treatment; (5) a diagnosis of moderate-to-severe OSA (AHI > 15 events/h) according to Version 2.3 of the scoring manual by the American Academy of Sleep Medicine (AASM, 2017), and medical records indicated that the diagnosis of OSA preceded the onset of T2DM by at least 12 months. Clear information on the duration of T2DM (in years) was provided to be used as a covariate in subsequent analyses. The exclusion criteria applied to all three groups were as follows: (1) presence of other sleep disorders; (2) diabetic complications such as retinopathy, nephropathy, or peripheral neuropathy; (3) type 1 diabetes mellitus, history of diabetic ketoacidosis, hyperosmolar state, or severe hypoglycemia; (4) cerebrovascular disease, traumatic brain injury, or structural brain abnormalities detected by routine MRI; (5) history of cardiovascular or psychiatric disorders; (6) thyroid dysfunction, severe hepatic or renal impairment, infectious diseases, or other somatic conditions that may affect cognition; (7) history of alcohol abuse, substance abuse, or use of psychotropic medications; (8) contraindications to MRI; (9) left-handedness or ambidexterity.
This study was conducted in accordance with the Declaration of Helsinki and was approved by the Ethics Committee of Shiyan People’s Hospital. Written informed consent was obtained from all participants.
2.2 General information
General demographic and clinical information, including sex, age, body mass index (BMI), years of education, and duration of diabetes, was collected using a standardized patient questionnaire.
2.3 Clinical indicators and neuropsychological assessment
Clinical indicators collected from all three groups included systolic and diastolic blood pressure, triglycerides, total cholesterol, high-density lipoprotein, low-density lipoprotein, AHI, oxygen desaturation index (ODI), minimum oxygen saturation (SaO₂), total sleep time (TST), sleep efficiency, fasting blood glucose, insulin resistance index (IRI), and hemoglobinA1c (HbA1c). All participants underwent neuropsychological assessments, including the Montreal Cognitive Assessment (MoCA), the Mini-Mental State Examination (MMSE), and the Epworth Sleepiness Scale (ESS). These assessments were conducted by trained resident physicians with more than 2 years of clinical experience, under the supervision of a senior physician, and completed within 3 h prior to MRI scanning.
2.4 Polysomnography
All patients underwent polysomnography within 3 days prior to MRI scanning using the Compumedics Grael system (Australia). Participants were instructed to abstain from consuming any beverages known to affect sleep, including tea, coffee, and alcohol, during the 24 h preceding the examination. Each monitoring session lasted for at least 8 h, with the start time tailored to each participant’s habitual sleep schedule. All polysomnography data were interpreted by board-certified attending physicians with more than 5 years of experience and specialized training.
2.5 MRI acquisition
Structural and functional MRI data were acquired from all participants using a 3.0 T superconducting MRI scanner (MAGNETOM Skyra, Siemens Healthcare, Erlangen, Germany) equipped with a 32-channel phased-array head coil. Participants were instructed to lie supine, remain awake, minimize focused mental activity, and keep their heads still with the help of foam padding. All MRI scans were performed by professionally trained radiology residents with over 2 years of experience. High-resolution structural images were acquired using a sagittal three-dimensional magnetization-prepared rapid gradient echo (3D-MPRAGE) sequence with the following parameters: repetition time (TR) = 2000 ms, echo time (TE) = 2.49 ms, flip angle = 7, slice thickness = 1.0 mm, field of view (FOV) = 256 × 256 mm, voxel size = 1 mm × 1 mm × 1 mm, total slices = 192, and scan time = 4 min 40 s. Rs-fMRI was acquired using a blood oxygenation level-dependent gradient recalled echo-echo planar imaging (BOLD GRE-EPI) axial sequence with the following parameters: TR = 2000 ms, TE = 30 ms, flip angle = 90, number of slices = 33, slice thickness = 4.0 mm, FOV = 240 mm × 240 mm, voxel size = 3 mm × 3 mm × 4 mm. A total of 240 volumes were obtained over a scan duration of 8 min 8 s.
2.6 Rs-fMRI data preprocessing
Resting-state fMRI data were preprocessed using RESTplus_V11.2.1 The preprocessing steps included: (1) conversion of DICOM files to NIfTI format; (2)excluding the first 10 time points; (3) slice timing correction; (4) head motion correction (participants with translation >2 mm or rotation >2 ° were excluded); (5) spatial normalization with resampling to 3 mm × 3 mm × 3 mm voxel size; (6) linear trend removal; (7) nuisance covariate regression (including white matter, gray matter, cerebrospinal fluid signals, and Friston-24 motion parameters); (8) bandpass filtering.
2.7 ReHo calculation
After preprocessing, ReHo maps were calculated based on the Kendall’s coefficient of concordance (KCC), which assesses the similarity of the time series among each voxel and its 26 neighboring voxels. A standardized ReHo map was obtained by dividing the local KCC by the mean KCC of the whole brain. To enhance the signal-to-noise ratio, the standardized ReHo maps were smoothed with a 6 mm × 6 mm × 6 mm Gaussian kernel. Finally, the ReHo values of brain regions showing significant group differences were extracted for each participant using RESTplus for further correlation analyses.
2.8 FC analysis
Based on the results from section 1.7, brain regions showing significant ReHo differences were selected as seed regions. A voxel-wise whole-brain FC analysis was then performed by calculating the Pearson correlation coefficients between the mean time series of the seed region and the time series of every other voxel in the brain. The resulting correlation coefficients were transformed into Z-scores using Fisher’s r-to-Z transformation. Finally, two-sample t-tests were conducted at the voxel level to compare FC patterns across groups.
2.9 Statistical analysis
All statistical analyses were performed using SPSS version 26.0. For continuous variables, data conforming to a normal distribution are expressed as mean ± standard deviation, while non-normally distributed data are presented as median and interquartile range. Categorical data are expressed as percentages. Group comparisons of demographic and clinical variables were conducted using one-way analysis of variance (ANOVA) or the Kruskal–Wallis test, with a significance threshold set at p < 0.05. Post-hoc analysis were conducted when significant group effects were found to identify specific group differences. To examine group differences in whole-brain ReHo and FC metrics, ANOVA was conducted using sex, age, and head motion parameters as covariates. Group differences in ReHo were considered statistically significant if they survived Gaussian Random Field (GRF) correction with a voxel-level threshold of p < 0.005 and a cluster-level threshold of p < 0.05. For FC, statistical significance was defined as voxel-level p < 0.01 and cluster-level p < 0.05 after GRF correction. Finally, partial correlation analyses were conducted to examine the associations between imaging metrics and clinical characteristics, PSG parameters, as well as neuropsychological test scores, with sex, age, BMI, years of education, and diabetes duration (in years) included as covariates. A p-value of < 0.05 was considered statistically significant.
3 Result
3.1 Demographic characteristics
Three participants were excluded due to excessive head motion (translation >2 mm or rotation >2°), resulting in a final sample of 1 15 participants: 46 in the OSA group, 35 in the OSA with T2DM group, and 34 in the HCs group. Table 1 presents the demographic characteristics of the three groups and the results of post-hoc analysis. A significant group difference was observed in BMI (p = 0.000), whereas no significant differences were found in sex, age, or years of education (all p > 0.05).
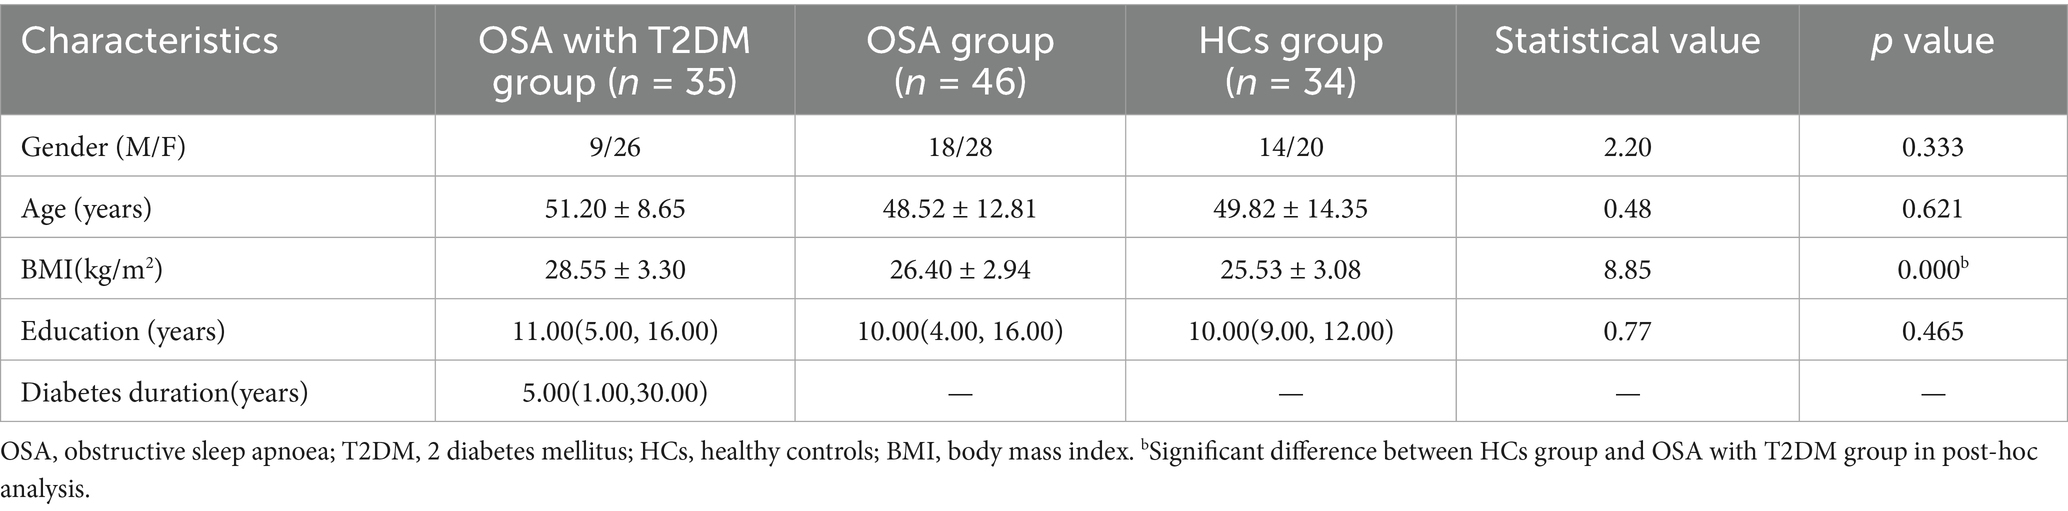
Table 1. Comparison of demographic characteristics.
3.2 Comparison of clinical characteristics, PSG scores, and neuropsychological assessments
Table 2 summarizes the clinical characteristics and post hoc analysis among the OSA, OSA with T2DM, and HCs groups. Significant group differences were observed in triglycerides (TG), total cholesterol (TC), low-density lipoprotein (LDL), apnea–hypopnea index (AHI), oxygen desaturation index (ODI), nadir SaO₂, mean SaO₂, percentage of time with SaO₂ < 90%, N1 and N3 sleep stages, MMSE, MoCA, and ESS. No significant differences were found among the three groups in diastolic blood pressure (DBP), systolic blood pressure (SBP), high-density lipoprotein (HDL), TST, sleep efficiency, N2 stage, or rapid ice moment (REM) sleep.
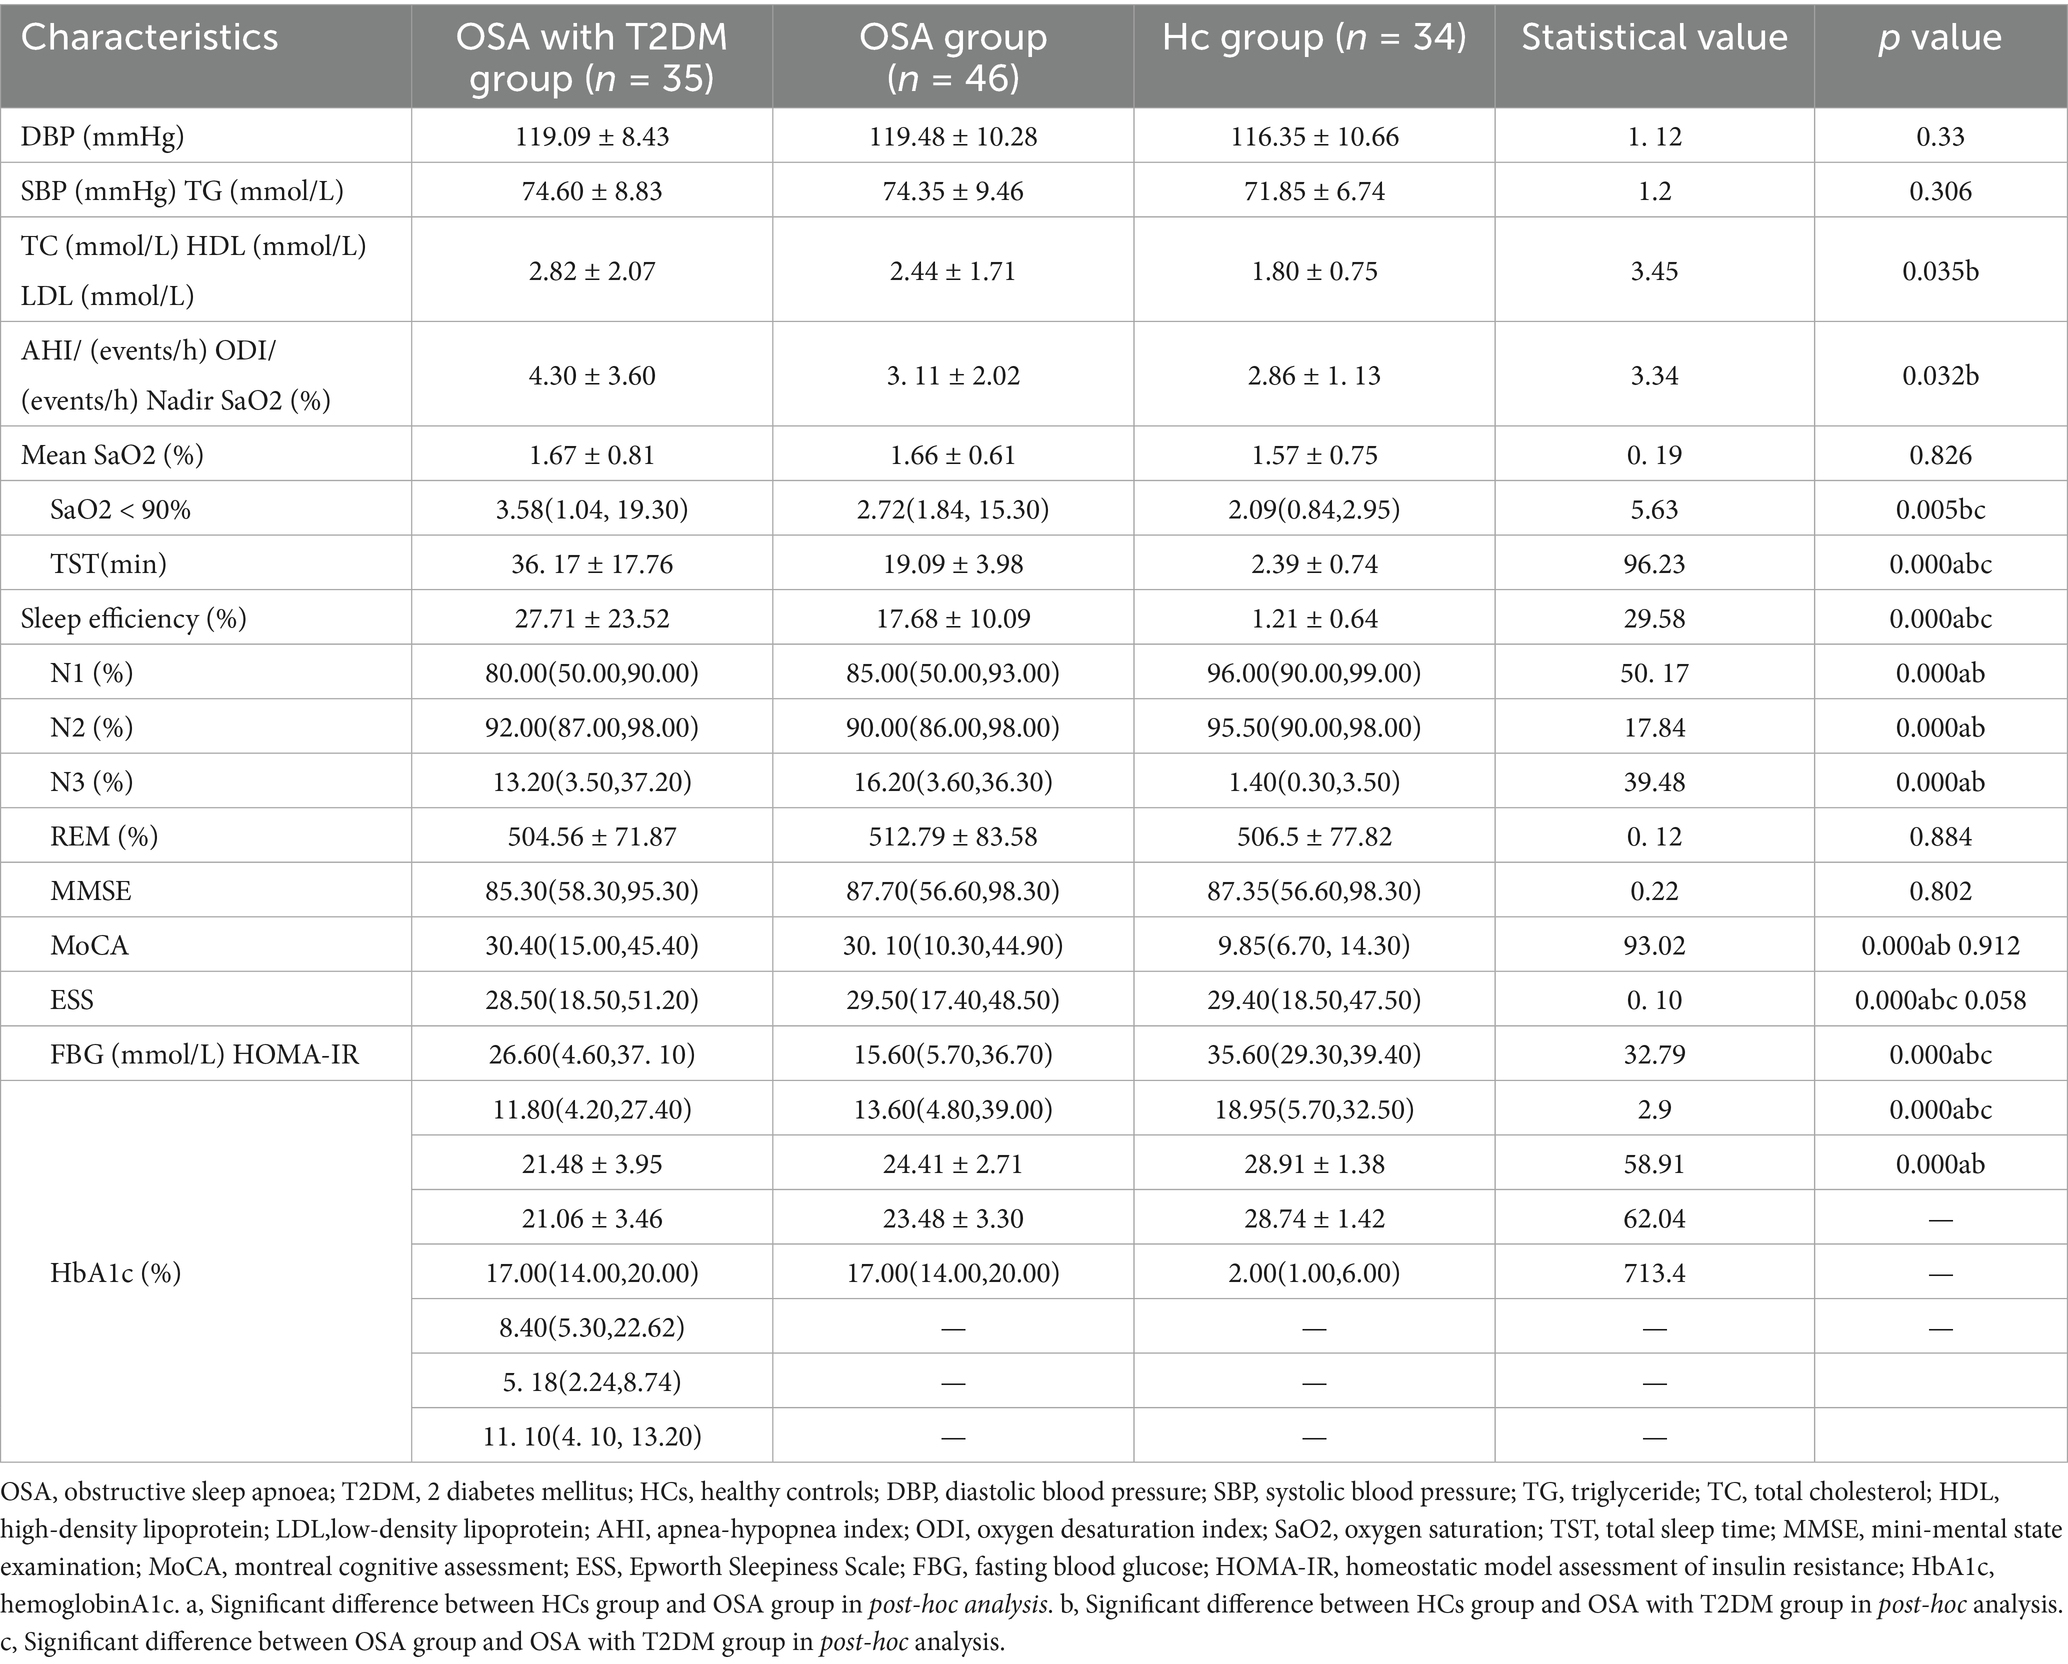
Table 2. Assessment of clinical features, PSG scores, and neuropsychological test scores.
3.3 Group differences in ReHo and seed-based functional connectivity
Compared with the HCs group, the OSA group showed significantly reduced ReHo values in the right fusiform gyrusand the left cerebellum region 8, while significantly increased ReHo values were observed in the left middle occipital gyrus (Table 3; Figure 1). Seed-based FC analysis using these regions revealed significantly decreased FC between the left middle occipital gyrus and the left cerebellum region 8, and between the right fusiform gyrus and the left cerebellum region 3 (Table 3; Figure 2).
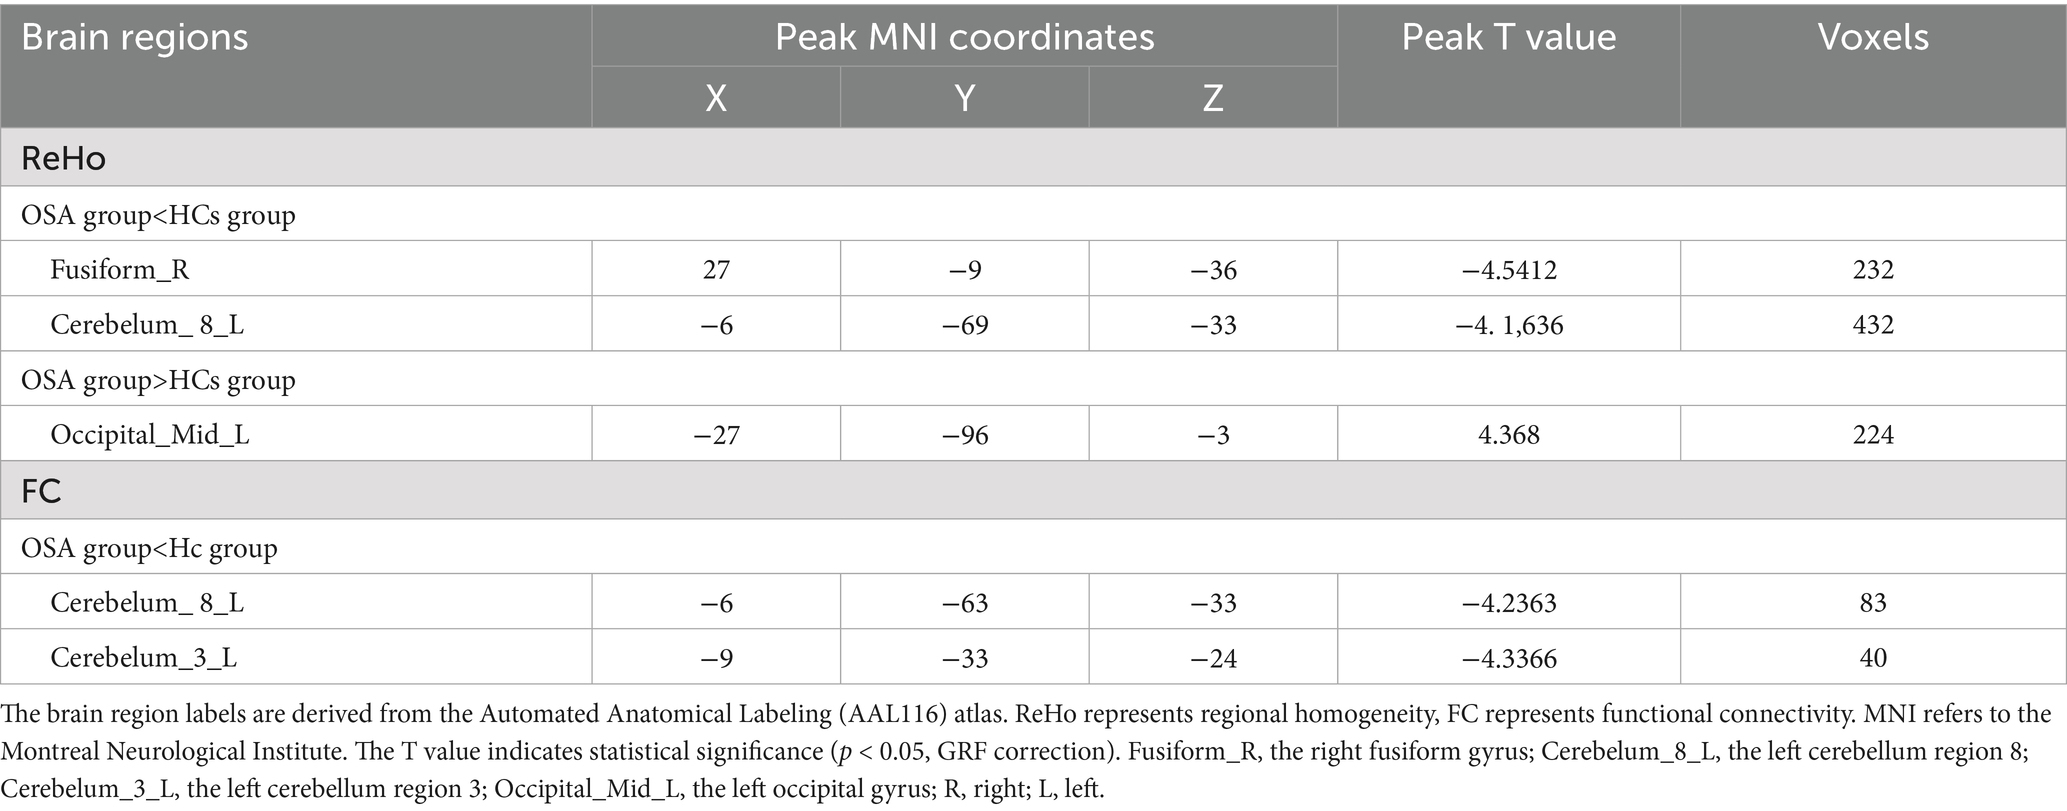
Table 3. Significant differences in ReHo and seed-based FC between OSA group and HCs group.
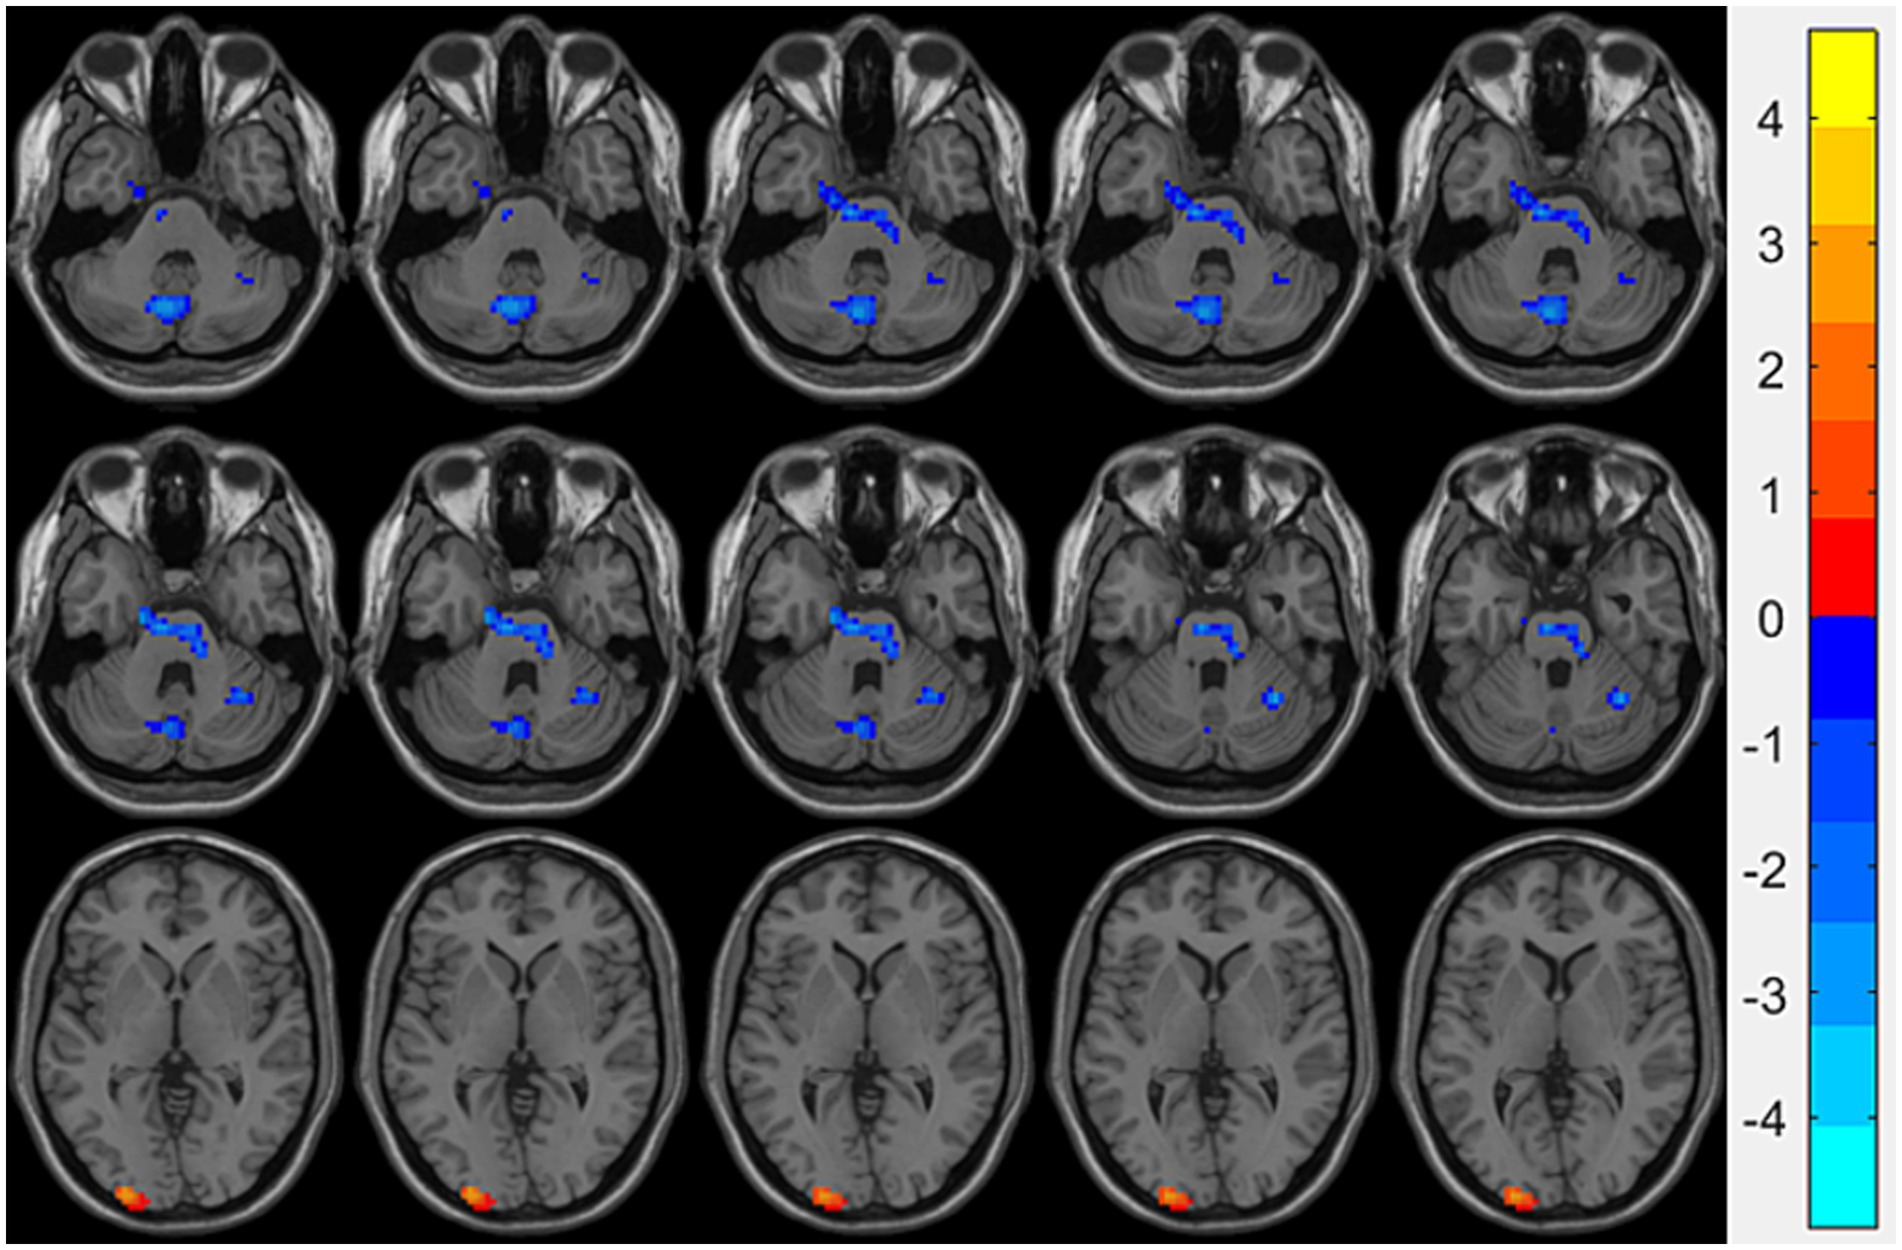
Figure 1. Brain regions showing significant ReHo differences between the OSA group and HCs. Cool-colored areas represent regions with significantly decreased ReHo values overlaid on axial slices of the MNI152 standard brain template, while warm-colored areas indicate regions with significantly increased ReHo values. The color bar represents t-values, with deeper colors indicating greater t-values. ReHo, Regional Homogeneity; MNI, Montreal Neurological Institute.
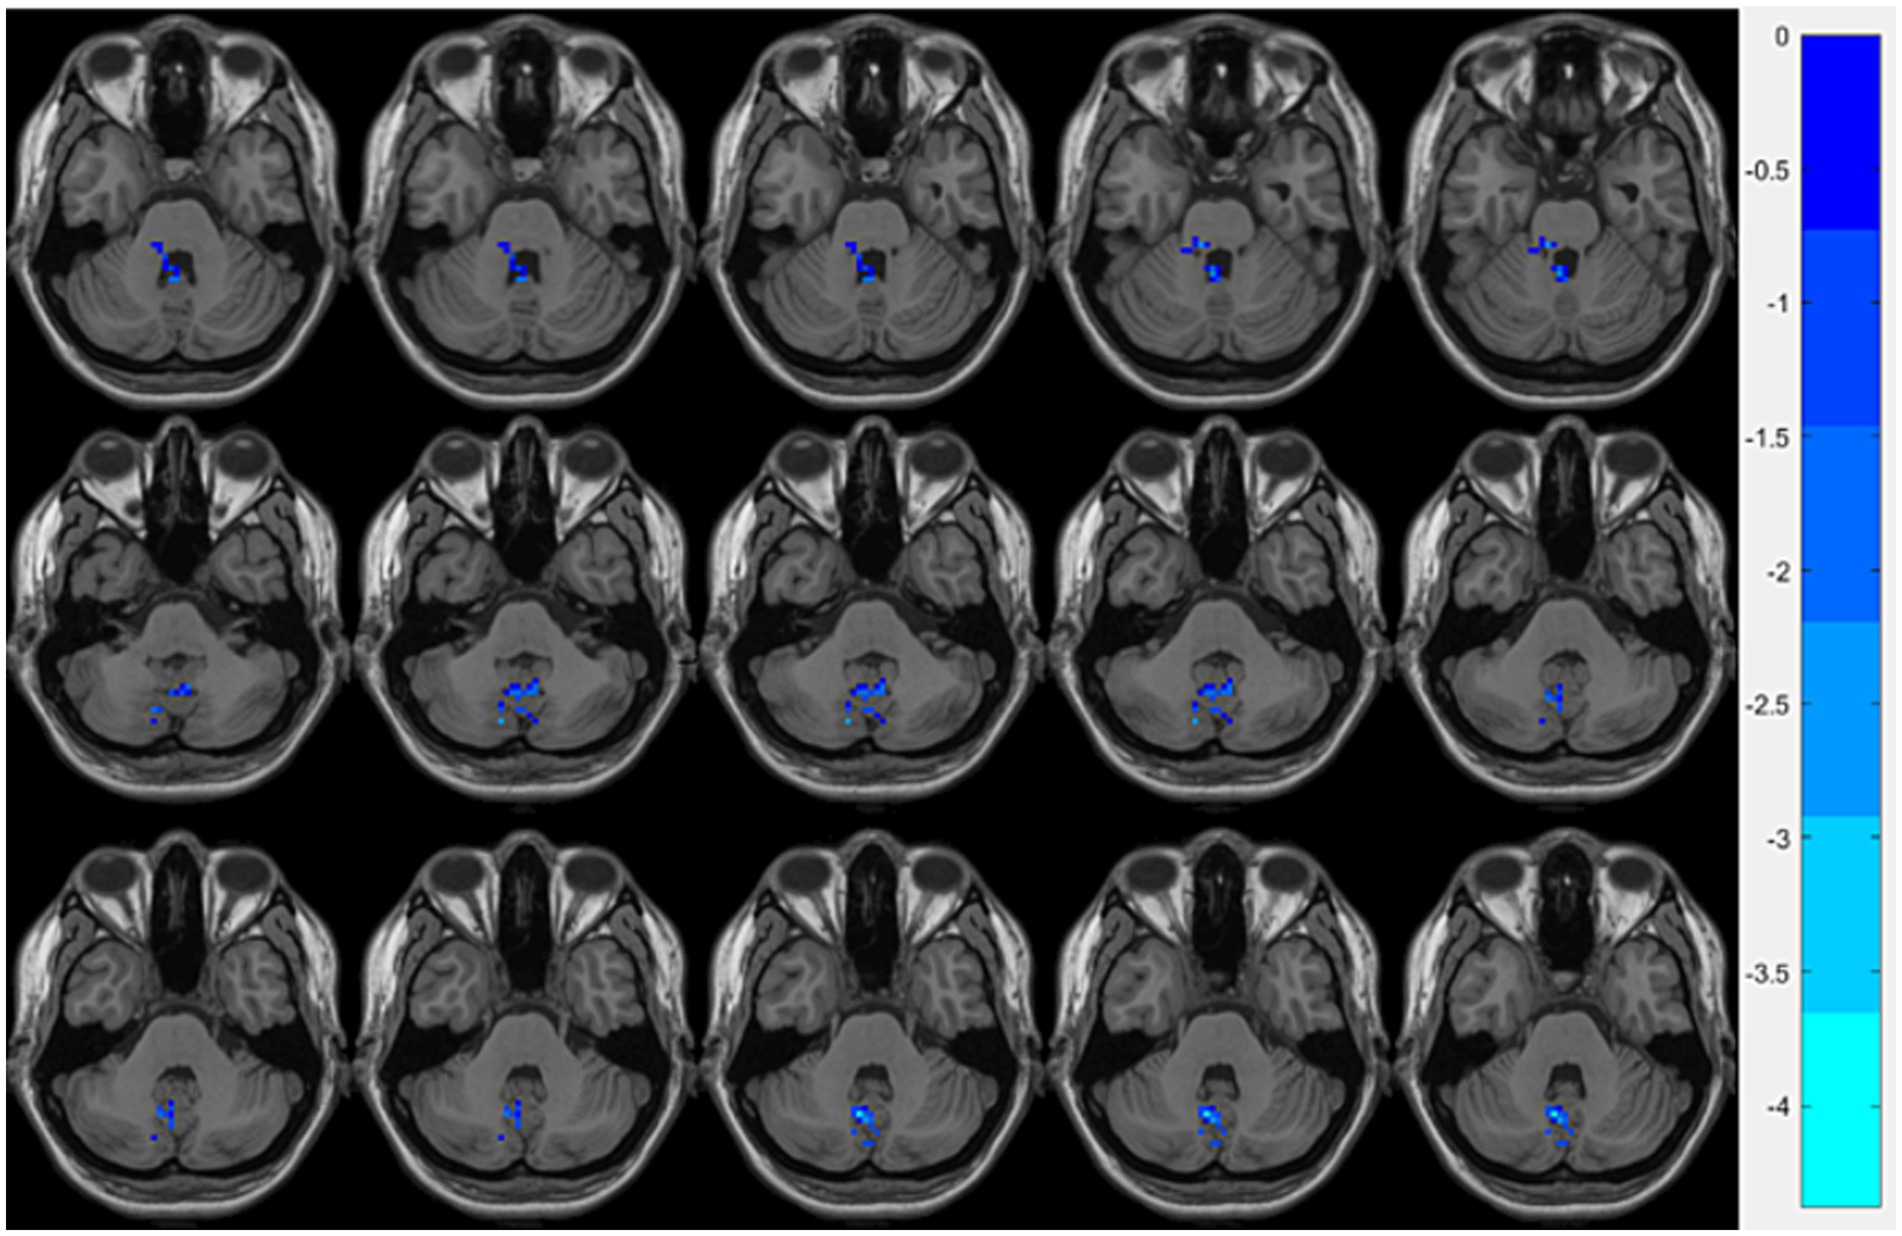
Figure 2. Brain regions showing significant FC differences between the OSA group and HCs. Cool-colored areas represent regions with significantly decreased FC values overlaid on axial slices of the MNI152 standard brain template. The color bar represents t-values, with deeper colors indicating greater t-values. FC, Functional Connectivity; MNI, Montreal Neurological Institute.
Compared with the OSA group, the OSA with T2DM group exhibited significantly reduced ReHo in the left middle occipital gyrus (Table 4; Figure 3). FC analysis using this region as a seed showed significantly increased FC between the left middle occipital gyrus and the left thalamus (Table 4; Figure 4).
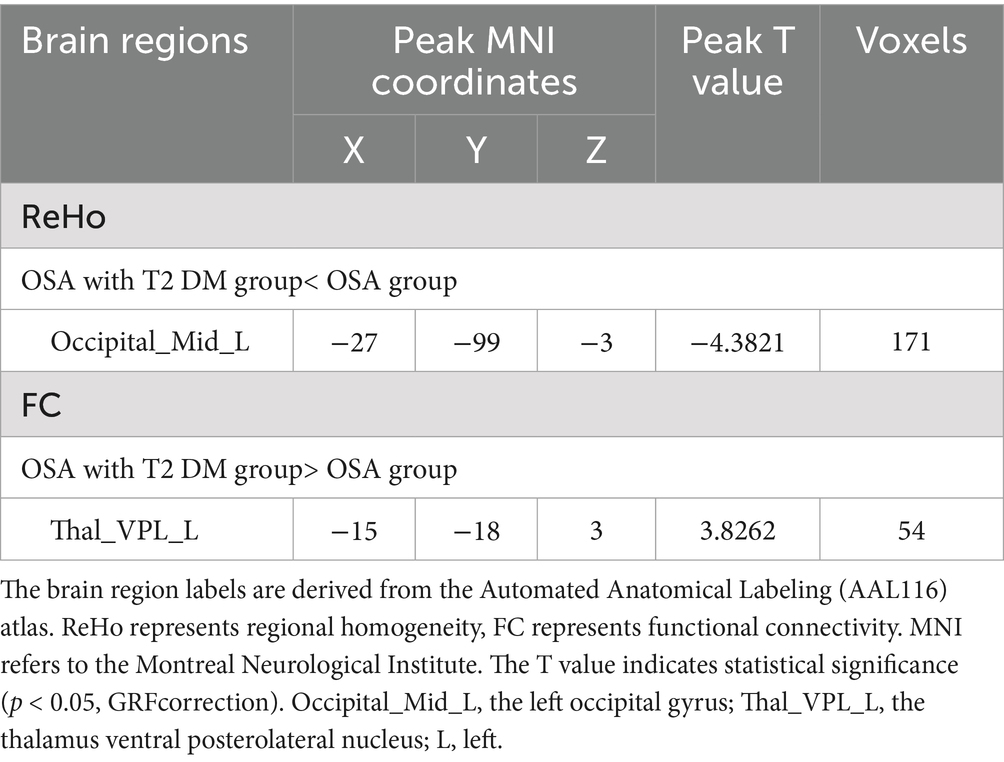
Table 4. Significant differences in ReHo and seed-based FC between OSA with T2DM group and OSA group.
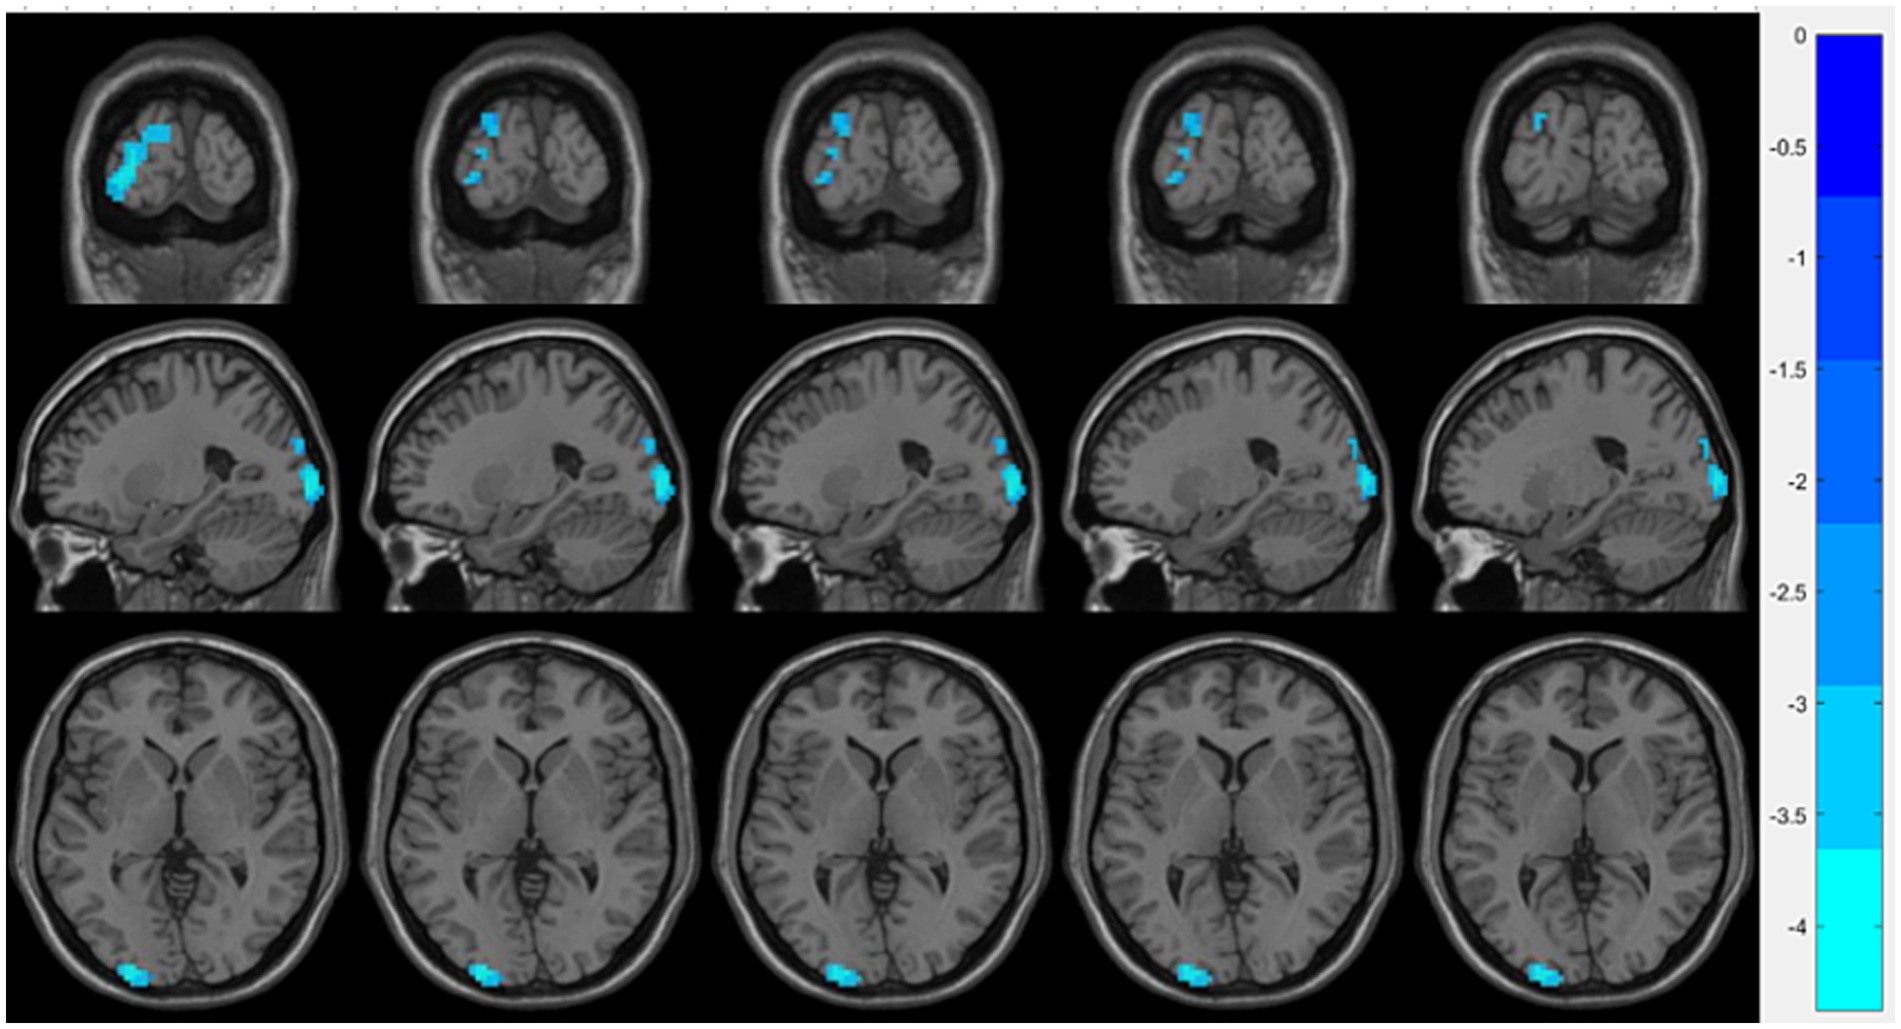
Figure 3. Brain regions showing significant ReHo differences between the OSA with T2DM group and the OSA group. Cool-colored areas represent regions with significantly decreased ReHo values overlaid on axial slices of the MNI152 standard brain template. The color bar represents t-values, with deeper colors indicating greater t-values. ReHo, Regional Homogeneity; MNI, Montreal Neurological Institute.
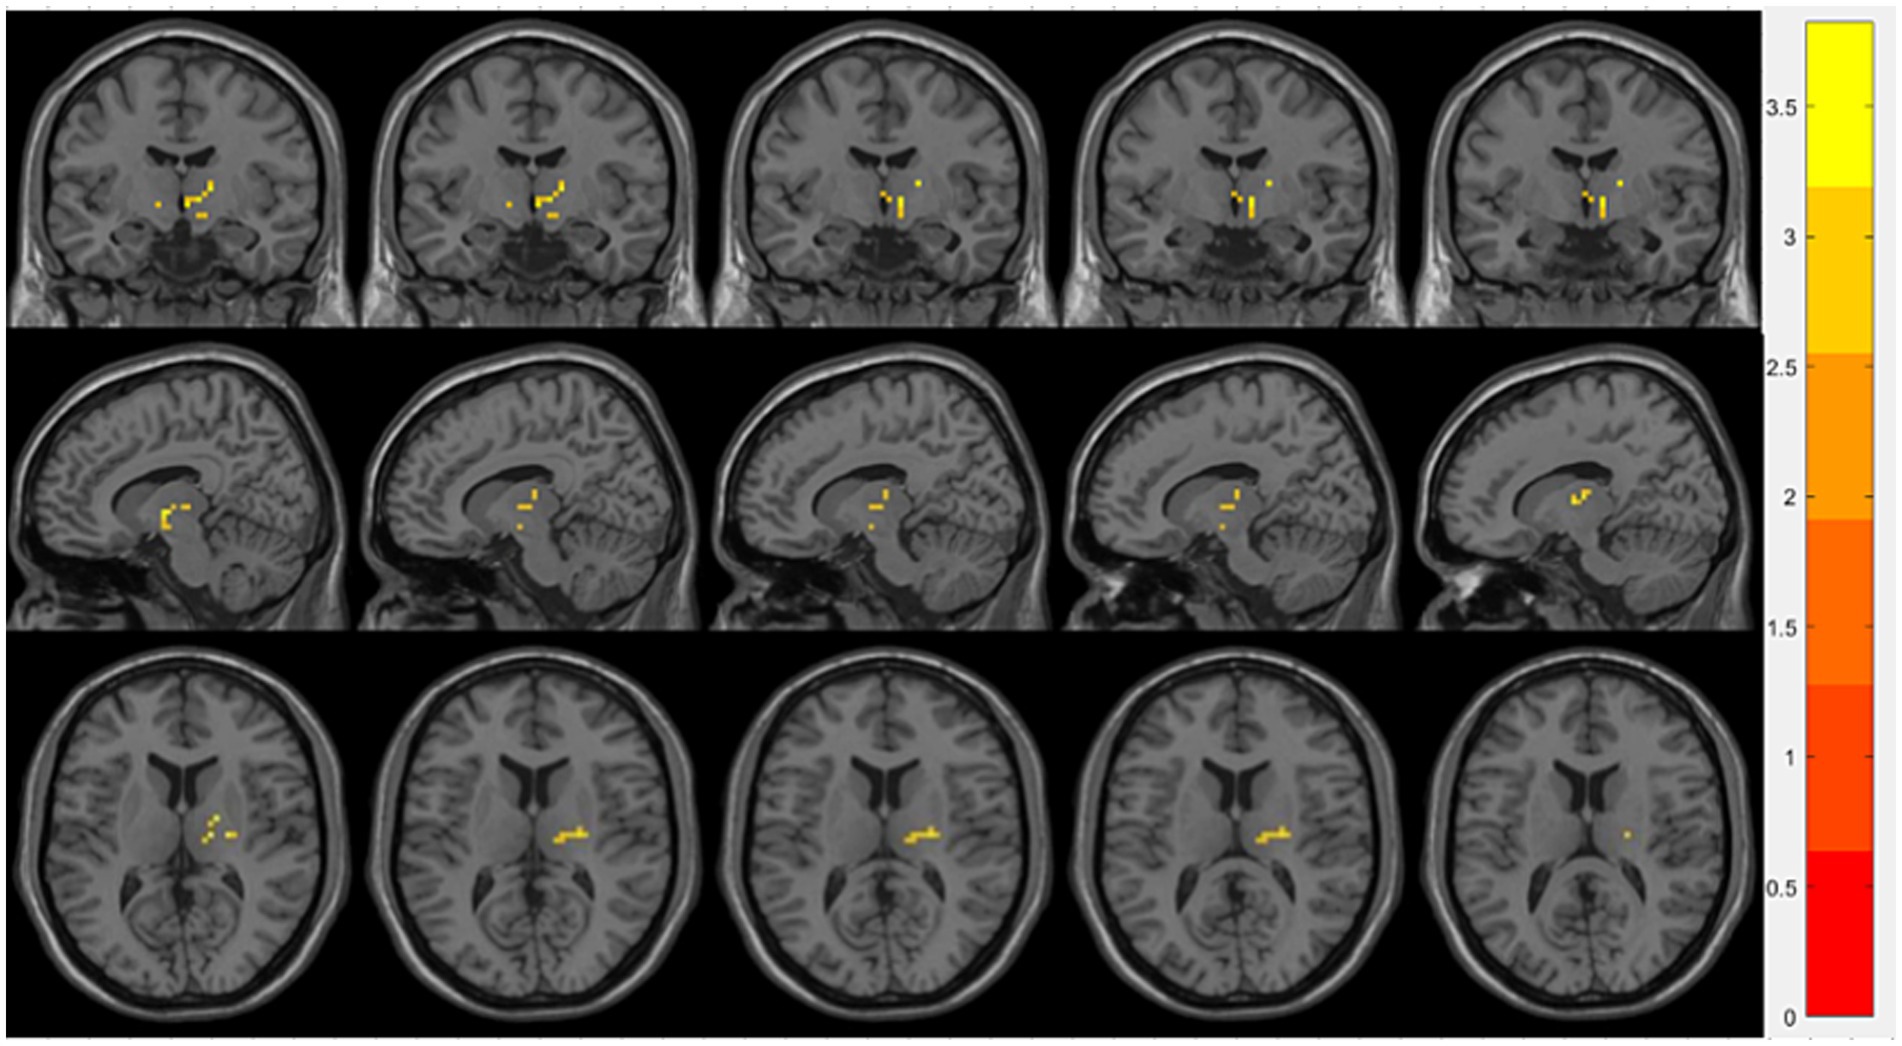
Figure 4. Brain regions showing significant FC differences between the OSA with T2DM group and the OSA group. Warm-colored areas represent regions with significantly increased FC values overlaid on axial slices of the MNI152 standard brain template. The color bar represents t-values, with deeper colors indicating greater t-values. FC, Functional Connectivity; MNI, Montreal Neurological Institute.
The brain region labels are derived from the Automated Anatomical Labeling (AAL116) atlas. ReHo represents regional homogeneity, FC represents functional connectivity. MNI refers to the Montreal Neurological Institute. The T value indicates statistical significance (p < 0.05, GRF correction). Fusiform_R, the right fusiform gyrus; Cerebelum_8_L, the left cerebellum region 8; Cerebelum_3_L, the left cerebellum region 3; Occipital_Mid_L, the left occipital gyrus; R, right; L, left.
3.4 Partial correlation analysis
Partial correlation analysis was performed with sex, age, BMI, and years of education as covariates. Compared with the HCs group, the OSA group showed a significant negative correlation between ReHo in the right fusiform gyrus and ODI (r = −0.612, p = 0.000; Figure 5A), and a significant positive correlation between FC in the left cerebellum region 8 and MMSE scores (r = 0.392, p = 0.029; Figure 5B). Compared with the OSA group, patients in the OSA with T2DM group showed a significant negative correlation between ReHo in the left middle occipital gyrus and the IRI (r = −0.783, p = 0.000; Figure 5C), a positive correlation between FC in the left thalamus and HbA1c (r = 0.769, p = 0. 000; Figure 5D), and a negative correlation between FC in the left thalamus and MoCA scores (r = −0.478, p = 0.007; Figure 5E).
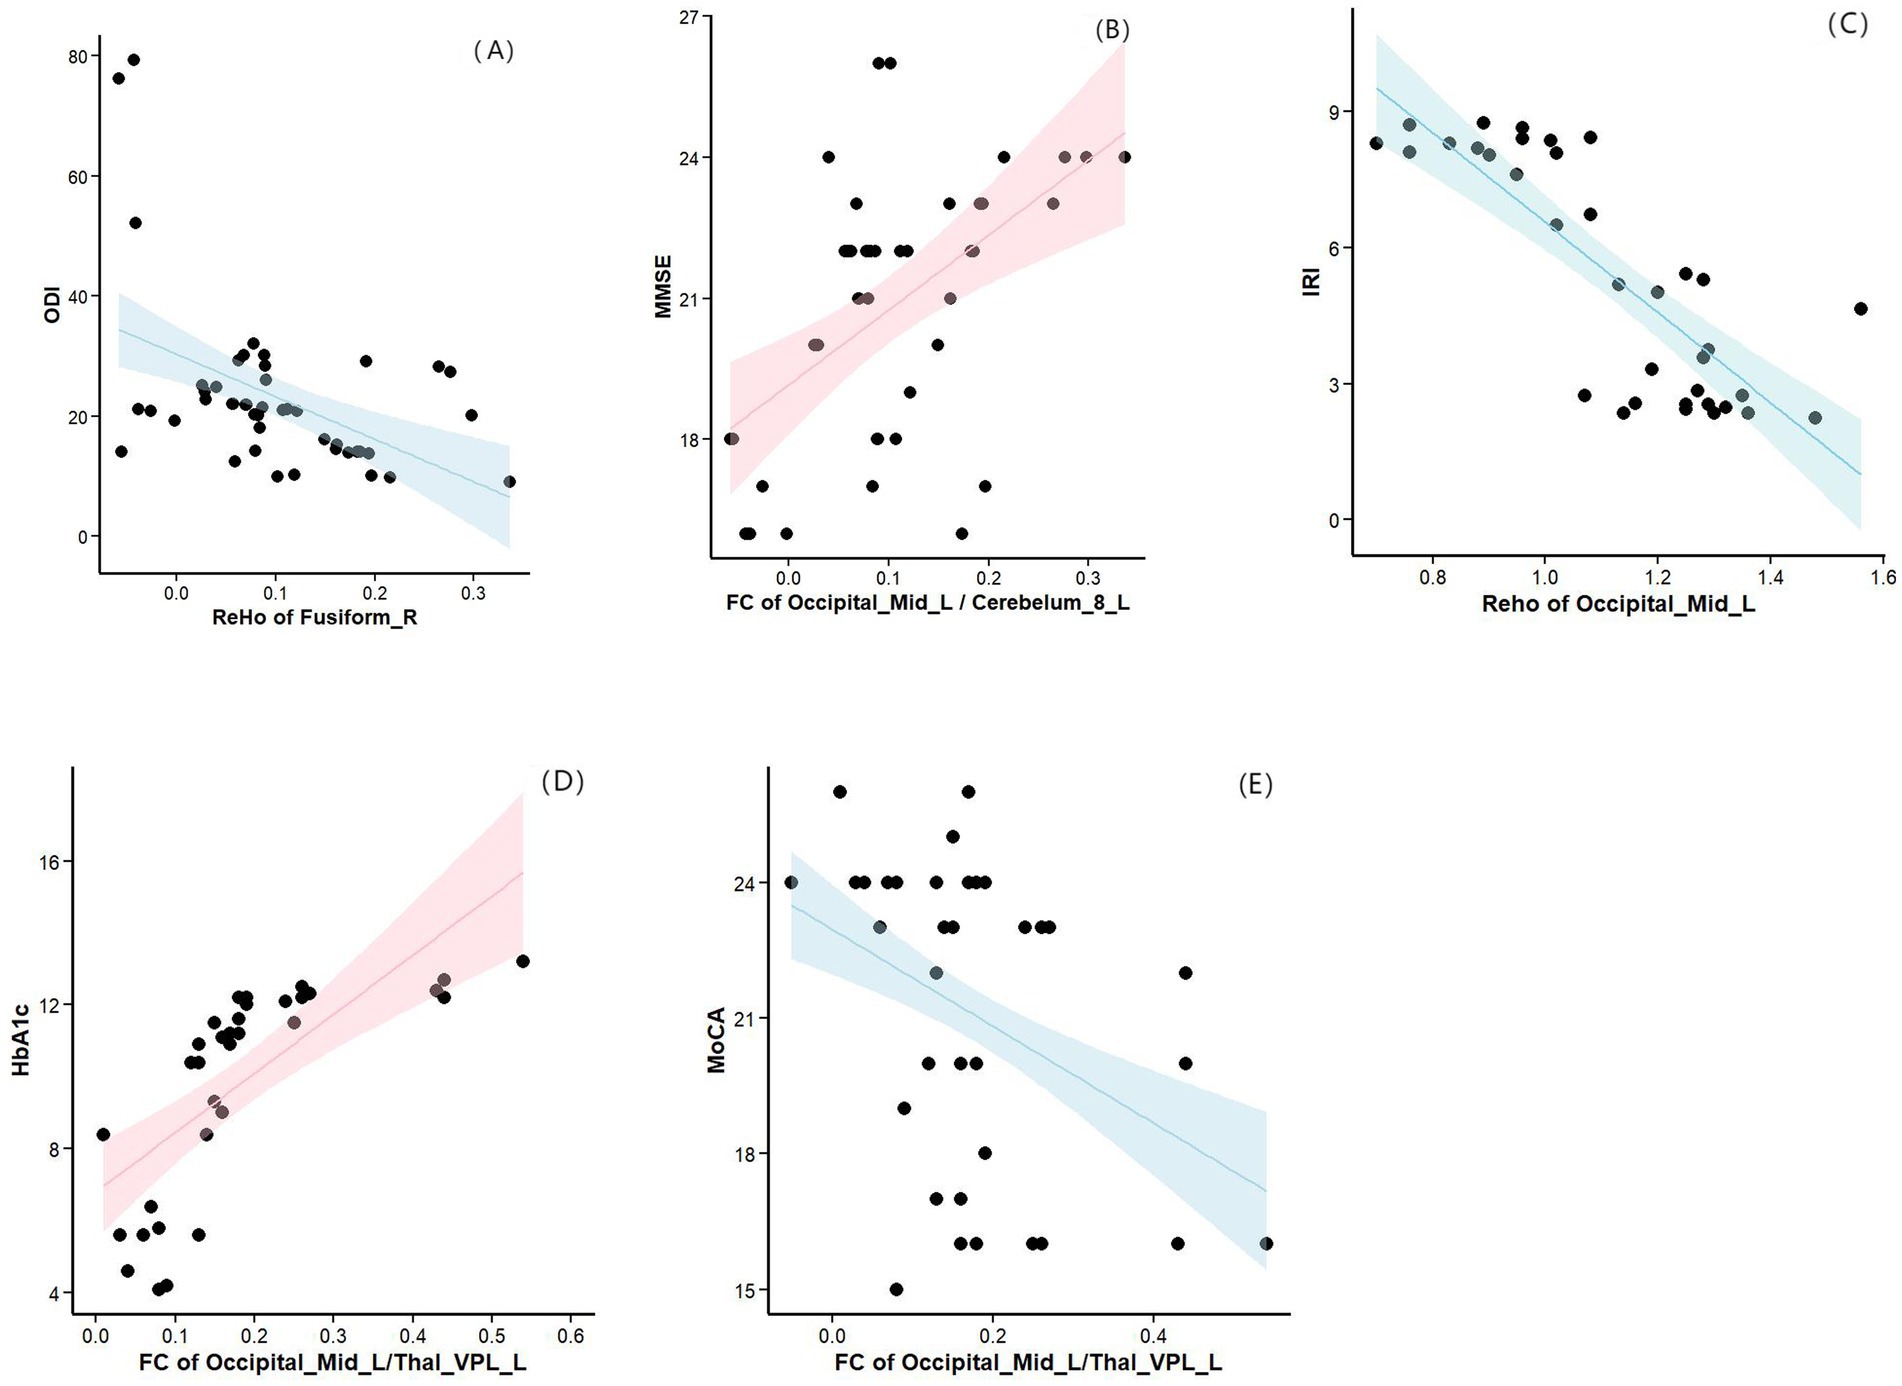
Figure 5. (A) Compared with the HCs group, the OSA group showed a significant negative correlation between ReHo in the right fusiform gyrus and ODI. (B) Compared with the HCs group, the OSA group showed a significant positive correlation between FC in the left cerebellum region 8 and MMSE scores. (C) Compared with the OSA group, patients in the OSA with T2DM group showed a significant negative correlation between ReHo in the left middle occipital gyrus and the IRI. (D) Compared with the OSA group, patients in the OSA with T2DM group showed a positive correlation between FC in the left thalamus and HbA1c. (E) Compared with the OSA group, patients in the OSA with T2DM group showed a negative correlation between FC in the left thalamus and MoCA scores. ReHo, Regional homogeneity; ODI, Oxygen Desaturation Index; MMSE, Mini-Mental State Examination; IRI, insulin resistance index; HbA1c, hemoglobinA1c; MoCA, Montreal Cognitive Assessment.
4 Discussion
This study employed a combined approach of ReHo and FC to investigate the impact of T2DM on brain function in OSA patients, and analyzed the correlation between brain region imaging differences, clinical variables, and cognitive scale scores. Our results indicated that, compared to the HCs group, the OSA group exhibited an increased ReHo in the left middle occipital gyrus, decreased ReHo in the right fusiform gyrus and left cerebellum 8 region, and reduced FC between the left middle occipital gyrus and left cerebellum 8 region, as well as between the right fusiform gyrus and left cerebellum 3 region. Furthermore, partial correlation analysis revealed that the ReHo of the right fusiform gyrus was significantly negatively correlated with ODI, while the FC between left middle occipital gyrus and the left cerebellum 8 region was significantly positively correlated with MMSE scores. Relative to the OSA group, the OSA with T2DM group showed a decreased ReHo in the left middle occipital gyrus and an increased FC between the left middle occipital gyrus and the left thalamus. Moreover, partial correlation analysis indicated that the ReHo of the left middle occipital gyrus was significantly negatively correlated with IRI, while the FC between the left middle occipital gyrus and the left thalamus was negatively correlated with MoCA scores and positively correlated with HbA1c levels. Overall, these findings reinforce the view of abnormal brain function changes in OSA patients and provide evidence that T2DM further affects brain function in OSA patients. This offers valuable insights into the neuro-pathological mechanisms of T2DM in OSA and supports the establishment of objective imaging biomarkers.
4.1 OSA–HCs
Compared with the HCs group, OSA patients exhibited decreased ReHo values in the right fusiform gyrus and the left cerebellum 8 region, while increased ReHo was observed in the left middle occipital gyrus. In addition, OSA patients showed significantly lower MoCA and MMSE cognitive scores than healthy controls, indicating marked cognitive impairment. This finding is consistent with previous studies, which have reported that OSA patients commonly experience persistent cognitive deficits, particularly in attention, episodic memory, and executive function (Bucks et al., 2017).
As an important component of the occipital visual processing area, the middle occipital gyrus is located in the higher visual cortex and is primarily involved in visuospatial processing and visual memory, serving as a key hub in the visual pathway (Villoslada and Alba-Arbalat, 2024). Previous studies have shown that the structural and functional integrity of the visual network has a significant impact on cognitive function. A study combining resting-state and task-based fMRI found that reduced functional connectivity within the visual network in patients with Alzheimer’s disease was closely associated with cognitive impairment, and disruption of this network may also promote the progression of mild cognitive impairment (MCI) (Huang et al., 2021). In addition, Yang et al. (2022) revealed from an electrophysiological perspective that OSA patients require significantly more time to process visual information, suggesting impaired visual perception, which may be a potential mechanism of OSA-related cognitive dysfunction. Supporting this view are brain network analysis results (Hayasaka et al., 2016) showing that the degree centrality (DC) of the left middle occipital gyrus is reduced in OSA patients, with significant negative correlations between DC and both the AHI and arousal index (AI). This suggests that functional connectivity impairment in the middle occipital gyrus is closely related to the severity of OSA and arousal frequency, with sleep fragmentation likely being a major cause of abnormal connectivity in this region. However, in the present study, increased ReHo was observed in this region among OSA patients, indicating enhanced local neural synchrony. We speculate that this change may reflect a neuroadaptive compensatory mechanism under chronic intermittent hypoxia, aimed at maintaining functional stability in this region.
The fusiform gyrus, located between the inferior temporal gyrus and the parahippocampal gyrus, is a key early visual cortex region, playing an important role in speech recognition, cognitive emotions, and emotional motor expression (Rhone et al., 2023; Picó-Pérez et al., 2017). A previous study (Kong et al., 2022) reported decreased functional connectivity between the ventral anterior insula and the fusiform gyrus in OSA patients. Additionally, the amplitude of low-frequency fluctuation (ALFF) in the right fusiform gyrus was found to be correlated with minimum SaO2, AI, and ODI, suggesting that this region is particularly sensitive to nocturnal hypoxia and sleep fragmentation. These findings imply that the fusiform gyrus may play a mediating role in OSA-related emotional disturbances and cognitive impairments. Our study indicates that OSA patients have reduced ReHo in the right fusiform gyrus, and the decreased ReHo is significantly negatively correlated with ODI, further supporting previous findings. OSA leads to changes in fusiform gyrus function due to nocturnal hypoxia and sleep fragmentation, which may contribute to emotional response deficits and cognitive impairments. This finding provides new evidence supporting the neuropathological basis of neuropsychiatric symptoms associated with OSA.
In recent years, the role of the cerebellum in OSA-related cognitive impairment has attracted increasing attention. Beyond its established function in motor control, the cerebellum is also extensively involved in sensorimotor integration, emotional regulation, learning, as well as higher-order cognitive processes such as attention and memory (Stoodley, 2011). Previous studies have demonstrated that the cerebellum is highly sensitive to hypoxia and ischemia, and its function can also be significantly affected by sleep deprivation (Kim et al., 2016; Li et al., 2024). Using resting-state fMRI, Park (2021) found that intermittent hypoxia may lead to impaired cerebellar network integration and functional connectivity, specifically showing reduced clustering coefficient and local efficiency of the left cerebellum within the salience network (SN), which was significantly associated with cognitive deficits. The SN serves as a critical “mediator” in the brain, primarily responsible for switching between the central executive network (CEN) and the default mode network (DMN). Damage to cerebellar function may weaken the SN’s regulatory role over these systems, thereby impairing task-switching abilities and contributing to the development and progression of mild cognitive impairment (MCI) (Deming et al., 2023). These findings provide a novel neural network perspective for understanding cognitive decline in OSA patients. In the present study, we further found that, compared with healthy controls, patients with OSA exhibited significantly reduced ReHo values in the left cerebellum 8 region. FC analysis also revealed decreased FC between the left middle occipital gyrus and the left cerebellum 8 region, as well as between the right fusiform gyrus and the left cerebellum 3 region. These results suggest abnormalities in both local neuronal activity and inter-regional connectivity in multiple cerebellar subregions associated with OSA. Functionally, cerebellum 8 region belongs to the neocerebellar cortex and is broadly involved in several intrinsic connectivity networks, including the CEN, DMN, SN, frontoparietal attention network, and language network. It supports cognitive functions such as working memory, episodic memory, spatial navigation, and attention (Habas, 2021). Although cerebellum 3 region has traditionally been regarded as mainly involved in motor coordination and balance, recent studies have shown that it also participates in cognitive regulation through cerebello-cortical loops, with consistent activation observed during working memory and attention tasks (Keren‐Happuch et al., 2012). Importantly, our partial correlation analysis further demonstrated a significant positive association between the FC of the left cerebellum 8 region and MMSE scores, reinforcing the notion that OSA may impair cognitive function by disrupting cerebellar-cortical connectivity. Taken together, cerebellar dysfunction may serve as a potential neuroimaging biomarker for early brain functional abnormalities and provide a promising target for early identification and clinical intervention in patients with OSA.
Unfortunately, compared to the HCs patients, we did not observe any brain function abnormalities in OSA with T2DM patients. One possible explanation is that certain brain regions in patients with T2DM may undergo metabolic adaptations. For example, they may maintain basic energy metabolism through insulin-independent glucose transport pathways, such as GLUT1 or GLUT3, which could account for the lack of significant differences in fMRI metrics (Kullmann et al., 2016). Additionally, the heterogeneity in the OSA group with T2DM (due to variations in OSA severity and the impact of T2DM treatment regimens) may have increased data variability, reducing statistical significance. Therefore, increasing the sample size in future studies may help detect corresponding brain function changes.
4.2 T2DM with OSA–OSA
Our findings indicate that, compared to the OSA group, the OSA with T2DM group showed further decreases in MoCA and MMSE scores, along with functional changes in certain brain regions, most notably a reduction in ReHo in the left occipital middle gyrus and an increase in FC between the left occipital middle gyrus and the left thalamus. The occipital middle gyrus, one of the most vulnerable areas in the brain to T2DM, plays a vital role in processing visual information related to visual cognition (Zhang et al., 2020). Its abnormal neural activity may also contribute to the pathophysiological mechanisms underlying cognitive impairments. Notably, we observed an increased ReHo value in the left middle occipital gyrus in the OSA-only group, which may represent an early compensatory mechanism of neural activity. However, in patients with comorbid T2DM, the ReHo value in this region was significantly decreased, suggesting that the compensatory mechanism in the middle occipital gyrus may be disrupted or exhausted under the combined influence of T2DM. Therefore, we speculate that T2DM may accelerate neuropathological changes in brain regions associated with OSA, leading to a decline in local neural synchronization. The exact pathophysiological mechanisms by which T2DM affects the central nervous system remain unclear, but most studies suggest that possible contributors include hyperglycemia, vascular complications, and insulin resistance (Lin et al., 2023). Insulin resistance, a characteristic pathophysiological defect in most T2DM patients, directly disrupts the insulin signaling pathway. The insulin signaling pathway plays a critical role in cognitive function by supporting various neuronal processes, including growth, survival, differentiation, migration, energy metabolism, gene expression, protein synthesis, cytoskeletal assembly, synapse formation, neurotransmitter function, and plasticity (Zheng et al., 2024). Therefore, damage to the insulin signaling pathway compromises the structural and functional integrity of the central nervous system, leading to the development of cognitive impairments. Our research revealed a negative correlation between the ReHo value in the left occipital middle gyrus and IRI, further confirming the critical role of insulin resistance in neurodamage among OSA patients. Further analysis in our study revealed a significant negative correlation between ReHo values in the left middle occipital gyrus and the IRI. This finding provides neuroimaging evidence for the association between insulin resistance and brain dysfunction, and further elucidates the exacerbating effect of T2DM on OSA-related brain abnormalities.
The thalamus, serving as a relay nucleus in the cerebral cortex, is anatomically and functionally divided into multiple distinct nuclei. These nuclei, through thalamocortical circuits, regulate information across various cortical regions, which explains the heterogeneity and complexity ofthalamic function (Wang et al., 2022). This complexity allows the thalamus to play a comprehensive role in cognition by regulating neuronal activity, supporting inter-region connectivity, promoting changes in network topology, enhancing neuronal variability, and modulating subtle and significant shifts in system-level arousal (Shine et al., 2023). Our research revealed that, in the OSA with T2DM group, the FC between the left occipital middle gyrus and the left thalamus was increased, and the FC value in the left thalamus showed a negative correlation with MoCA scores. This suggests that, compared to OSA patients, cognitive impairments were more pronounced in the OSA with T2DM group, with the body compensating through enhanced thalamic functional connectivity to sustain fundamental cognitive function. Several prior studies have also confirmed similar compensatory mechanisms. For instance, Wang found that selective thalamocortical hyperconnectivity helps maintain basic cognitive function in T2DM patients (Wang et al., 2022). Jing’s study indicated that enhanced FC between the bilateral thalamus and brain functional networks (including the visual network and DMN) in T2DM patients might serve as a compensatory mechanism for reduced brain region volumes associated with cognitive dysfunction (Jing et al., 2023). However, this hypothesis remains speculative due to the lack of supporting task-based fMRI or cognitive-behavioral data. Future studies may consider incorporating task paradigms involving executive control or visual processing, as well as analyses linking brain function with behavioral performance, to further verify its compensatory significance. Additionally, we observed a positive correlation between the FC value in the left thalamus and HbA1c levels. HbA1c reflects the percentage of glycated hemoglobin, which is an approximate indicator of the average plasma glucose concentration over the past 3 months and is regarded as the gold standard for evaluating diabetes treatment effectiveness. Research has shown that the abnormal accumulation of advanced glycation end-products (AGEs) due to hyperglycemia increases the production of reactive oxygen species (ROS), which in turn activates downstream APP-related pathways, enhances Aβ production, and upregulates NAD + -dependent deacetylase sirtuin 1 (Sirt1) and glucose-regulated protein 78 (GRP78), leading to neuronal cell death pathways and ultimately contributing to the onset of cognitive impairments (Kong et al., 2020). Additionally, GSK-3β plays a pivotal role in tau protein phosphorylation and in insulin signaling. Disruptions in insulin signaling that regulate the GSK-3β pathway in diabetes, combined with hyperglycemia, may trigger tau phosphorylation and subsequent cleavage, which increases the risk of cognitive disorders, such as Alzheimer’s disease, in diabetic patients (Wee et al., 2023). Finally, hyperglycemia can trigger apoptotic processes, including caspase activation, which leads to tau protein cleavage and increases neuronal susceptibility to Aβ-induced damage (Kim et al., 2013). These findings underscore the critical role of hyperglycemia in mediating cognitive impairment in OSA patients.
It is worth noting that although the comorbidity of T2DM and OSA may exacerbate brain functional impairments, this process may be, to some extent, reversible. Previous research has shown that good glycemic control—such as maintaining HbA1c within an optimal range—is closely associated with preserved cognitive function and improved cerebral metabolism (Sanchez-Rangel et al., 2022; Zhao et al., 2025). Therefore, future studies are warranted to investigate whether glycemic control interventions could help ameliorate functional connectivity abnormalities in patients with T2DM and OSA, thereby providing evidence to support more targeted clinical management strategies.
4.3 Limitation
This study has several limitations. First, it only included moderate to severe OSA patients, and the potential impact of mild OSA on diabetes incidence cannot be ruled out. Future cohort studies with more robust designs are needed to explore this finding, as mild OSA is more prevalent than moderate to severe OSA and has greater public health significance. Secondly, we observed functional abnormalities in the occipital gyrus in both the OSA and OSA with T2DM groups. Since the occipital gyrus plays a crucial role in visual processing, future research should incorporate visual tests to assess patients’ ability to process visual information. Furthermore, potential bias may exist in the use of hypoglycemic medications among T2DM patients in this study. Variations in drug type and dosage may influence brain functional activity. Future studies should collect more detailed medication information and control for both drug categories and dosages to minimize such confounding effects. Lastly, although the sample size in this study was determined with reference to previous literature and practical feasibility, the number of participants in the OSA with T2DM group was relatively small, which may have resulted in insufficient statistical power to detect subtle brain functional alterations. Future research should aim to expand the sample size and incorporate multicenter data to enhance the robustness of the findings.
5 Conclusion
This study employed rs-fMRI ReHo combined with FC analysis to investigate the impact of T2DM on brain function in OSA patients, as well as the correlations between brain function abnormalities, IRI, HbA1c, and neuropsychological test scores. This study revealed the disruption of neural function in OSA patients with T2DM, providing additional evidence to elucidate the neural mechanisms through which T2DM affects brain function in OSA patients.
Data availability statement
The raw data supporting the conclusions of this article will be made available by the authors, without undue reservation.
Ethics statement
The studies involving humans were approved by Ethics Committee of Shiyan People’s Hospital. The studies were conducted in accordance with the local legislation and institutional requirements. The participants provided their written informed consent to participate in this study. Written informed consent was obtained from the individual(s) for the publication of any potentially identifiable images or data included in this article.
Author contributions
WZ: Writing – original draft, Writing – review & editing. XY: Writing – review & editing. XX: Writing – review & editing. LS: Methodology, Project administration, Resources, Software, Supervision, Validation, Writing – review & editing, Writing – original draft. MB: Writing – review & editing. SG: Writing – review & editing. LvY: Data curation, Methodology, Project administration, Validation, Software, Writing – review & editing, Writing – original draft. LiY: Conceptualization, Data curation, Formal analysis, Funding acquisition, Investigation, Methodology, Project administration, Resources, Software, Supervision, Validation, Visualization, Writing – review & editing.
Funding
The author(s) declare that financial support was received for the research and/or publication of this article. 2022 Shiyan City guided scientific research program 22Y69; Hubei Provincial Health Commission 2023-2024; and scientific research project establishment WJ2023F091.
Conflict of interest
The authors declare that the research was conducted in the absence of any commercial or financial relationships that could be construed as a potential conflict of interest.
Generative AI statement
The author(s) declare that no Gen AI was used in the creation of this manuscript.
Publisher’s note
All claims expressed in this article are solely those of the authors and do not necessarily represent those of their affiliated organizations, or those of the publisher, the editors and the reviewers. Any product that may be evaluated in this article, or claim that may be made by its manufacturer, is not guaranteed or endorsed by the publisher.
Footnotes
References
American Diabetes A (2010). Diagnosis and classification of diabetes mellitus. Diabetes Care 33, S62–S69. doi: 10.2337/dc11-S062
Arnold, S. E., Arvanitakis, Z., Macauley-Rambach, S. L., Koenig, A. M., Wang, H. Y., Ahima, R. S., et al. (2018). Brain insulin resistance in type 2 diabetes and Alzheimer disease: concepts and conundrums. Nat. Rev. Neurol. 14, 168–181. doi: 10.1038/nrneurol.2017.185
Benjafield, A. V., Ayas, N. T., Eastwood, P. R., Heinzer, R., Ip, M. S. M., Morrell, M. J., et al. (2019). Estimation of the global prevalence and burden of obstructive sleep apnoea: a literature-based analysis. Lancet Respir. Med. 7, 687–698. doi: 10.1016/S2213-2600(19)30198-5
Bucks, R. S., Olaithe, M., Rosenzweig, I., and Morrell, M. J. (2017). Reviewing the relationship between Osa and cognition: where do we go from here? Respirology 22, 1253–1261. doi: 10.1111/resp.13140
Deming, P., Cook, C. J., Meyerand, M. E., Kiehl, K. A., Kosson, D. S., and Koenigs, M. (2023). Impaired salience network switching in psychopathy. Behav. Brain Res. 452:114570. doi: 10.1016/j.bbr.2023.114570
Drager, L. F., Li, J., Reinke, C., Bevans-Fonti, S., Jun, J. C., and Polotsky, V. Y. (2011). Intermittent hypoxia exacerbates metabolic effects of diet-induced obesity. Obesity (Silver Spring) 19, 2167–2174. doi: 10.1038/oby.2011.240
Habas, C. (2021). Functional connectivity of the cognitive cerebellum. Front. Syst. Neurosci. 15:642225. doi: 10.3389/fnsys.2021.642225
Han, K., Dong, L., Liao, X., Long, J., Chen, J., Lu, H., et al. (2025). Alterations in brain function in patients with post-stroke cognitive impairment: a resting-state functional magnetic resonance imaging study. Front. Aging Neurosci. 17:1501082. doi: 10.3389/fnagi.2025.1501082
Hayasaka, S., Li, H., and Li, L. (2016). Abnormal intrinsic functional hubs in severe male obstructive sleep apnea: evidence from a voxel-wise degree centrality analysis. PLoS One 11:e0164031. doi: 10.1371/journal.pone.0164031
Huang, J., Beach, P., Bozoki, A., and Zhu, D. C. (2021). Alzheimer’s disease progressively reduces visual functional network connectivity. J Alzheimer's Dis Reports 5, 549–562. doi: 10.3233/ADR-210017
Huang, T., Sands, S. A., Stampfer, M. J., Tworoger, S. S., Hu, F. B., and Redline, S. (2022). Insulin resistance, hyperglycemia, and risk of developing obstructive sleep apnea in men and women in the United States. Ann. Am. Thorac. Soc. 19, 1740–1749. doi: 10.1513/AnnalsATS.202111-1260OC
Jing, J., Liu, C., Zhu, W., Pan, Y., Jiang, J., Cai, X., et al. (2023). Increased resting-state functional connectivity as a compensatory mechanism for reduced brain volume in prediabetes and type 2 diabetes. Diabetes Care 46, 819–827. doi: 10.2337/dc22-1998
Kapur, V. K., Auckley, D. H., Chowdhuri, S., Kuhlmann, D. C., Mehra, R., Ramar, K., et al. (2017). Clinical practice guideline for diagnostic testing for adult obstructive sleep apnea: an American Academy of sleep medicine clinical practice guideline. J. Clin. Sleep Med. 13, 479–504. doi: 10.5664/jcsm.6506
Keren‐Happuch, E., Chen, S. H. A., and Ho, M. H. R. (2012). A meta-analysis of cerebellar contributions to higher cognition from PET and fMRI studies. Hum. Brain Mapp. 35, 593–615. doi: 10.1002/hbm.22194
Kim, B., Backus, C., Oh, S., and Feldman, E. L. (2013). Hyperglycemia-induced tau cleavage in vitro and in vivo: a possible link between diabetes and Alzheimer's disease. J Alzheimer's Dis 34, 727–739. doi: 10.3233/JAD-121669
Kim, H., Joo, E., Suh, S., Kim, J. H., Kim, S. T., and Hong, S. B. (2016). Effects of long-term treatment on brain volume in patients with obstructive sleep apnea syndrome. Hum. Brain Mapp. 37, 395–409. doi: 10.1002/hbm.23038
Kong, L., Li, H., Shu, Y., Liu, X., Li, P., Li, K., et al. (2022). Aberrant resting-state functional brain connectivity of insular subregions in obstructive sleep apnea. Front. Neurosci. 15:765775. doi: 10.3389/fnins.2021.765775
Kong, Y., Wang, F., and Wang, J. (2020). Pathological mechanisms linking diabetes mellitus and Alzheimer’s disease: the receptor for advanced glycation end products (rage). Front. Aging Neurosci. 12:217. doi: 10.3389/fnagi.2020.00217
Kullmann, S., Heni, M., Hallschmid, M., Fritsche, A., Preissl, H., and Häring, H. U. (2016). Brain insulin resistance at the crossroads of metabolic and cognitive disorders in humans. Physiol. Rev. 96, 1169–1209. doi: 10.1152/physrev.00032.2015
Li, L., Long, T., Liu, Y., Ayoub, M., Song, Y., Shu, Y., et al. (2024). Abnormal dynamic functional connectivity and topological properties of cerebellar network in male obstructive sleep apnea. CNS Neurosci. Ther. 30:e14786. doi: 10.1111/cns.14786
Lin, Y., Gong, Z., and Ma, C. (2023). Relationship between glycemic control and cognitive impairment: a systematic review and meta-analysis. Front. Aging Neurosci. 15:1126183. doi: 10.3389/fnagi.2023.1126183
Mohammadi, M., Samadi, S., Batouli, S. A. H., Pestei, K., and Oghabian, M. A. (2025). Reduced oxygen extraction fraction as a biomarker for cognitive deficits in obstructive sleep apnea. Brain Behav 15:e70273. doi: 10.1002/brb3.70273
Pamidi, S., and Tasali, E. (2012). Obstructive sleep apnea and type 2 diabetes: is there a link? Front. Neurol. 3:126. doi: 10.3389/fneur.2012.00126
Park, H. R. (2021). Altered cerebrocerebellar functional connectivity in patients with obstructive sleep apnea and its association with cognitive function. Sleep 45:zsab209. doi: 10.1093/sleep/zsab209
Picó-Pérez, M., Radua, J., Steward, T., Menchón, J. M., and Soriano-Mas, C. (2017). Emotion regulation in mood and anxiety disorders: a meta-analysis of fmri cognitive reappraisal studies. Prog. Neuro-Psychopharmacol. Biol. Psychiatry 79, 96–104. doi: 10.1016/j.pnpbp.2017.06.001
Rhone, A. E., Rupp, K., Hect, J. L., Harford, E., Tranel, D., Howard, M. A. III, et al. (2023). Electrocorticography reveals the dynamics of famous voice responses in human fusiform gyrus. J. Neurophysiol. 129, 342–346. doi: 10.1152/jn.00459.2022
Ryan, S., Taylor, C. T., and Mcnicholas, W. T. (2005). Selective activation of inflammatory pathways by intermittent hypoxia in obstructive sleep apnea syndrome. Circulation 112, 2660–2667. doi: 10.1161/CIRCULATIONAHA.105.556746
Sanchez-Rangel, E., Gunawan, F., Jiang, L., Savoye, M., Dai, F., Coppoli, A., et al. (2022). Reversibility of brain glucose kinetics in type 2 diabetes mellitus. Diabetologia 65, 895–905. doi: 10.1007/s00125-022-05664-y
Shine, J. M., Lewis, L. D., Garrett, D. D., and Hwang, K. (2023). The impact of the human thalamus on brain-wide information processing. Nat. Rev. Neurosci. 24, 416–430. doi: 10.1038/s41583-023-00701-0
Spiegel, K., Tasali, E., Leproult, R., and van Cauter, E. (2009). Effects of poor and short sleep on glucose metabolism and obesity risk. Nat. Rev. Endocrinol. 5, 253–261. doi: 10.1038/nrendo.2009.23
Stoodley, C. J. (2011). The cerebellum and cognition: evidence from functional imaging studies. Cerebellum 11, 352–365. doi: 10.1007/s12311-011-0260-7
Subramanian, A., Adderley, N. J., Tracy, A., Taverner, T., Hanif, W., Toulis, K. A., et al. (2019). Risk of incident obstructive sleep apnea among patients with type 2 diabetes. Diabetes Care 42, 954–963. doi: 10.2337/dc18-2004
Van Sloten, T. T., Sedaghat, S., and Carnethon, M. R. (2020). Cerebral microvascular complications of type 2 diabetes: stroke, cognitive dysfunction, and depression. Lancet Diabetes Endocrinol 8, 325–336. doi: 10.1016/S2213-8587(19)30405-X
Villoslada, P. S. E., and Alba-Arbalat, S. (2024). Retinal damage and visual network re source. Neurol. Neuroimmunol. Neuroinflamm. Diabetes Care. 2011;34 Suppl 1(Suppl 1):S62-S69. doi: 10.1212/NXI.0000000000200288
Wang, J., Zhou, S., Deng, D., Chen, M., Cai, H., Zhang, C., et al. (2022). Compensatory thalamocortical functional hyperconnectivity in type 2 diabetes mellitus. Brain Imag Behav. 16, 2556–2568. doi: 10.1007/s11682-022-00710-0
Wee, A. S., Nhu, T. D., Khaw, K. Y., Tang, K. S., and Yeong, K. Y. (2023). Linking diabetes to Alzheimer’s disease: potential roles of glucose metabolism and alpha-glucosidase. Curr. Neuropharmacol. 21, 2036–2048. doi: 10.2174/1570159X21999221111102343
West, S. D., Prudon, B., Hughes, J., Gupta, R., Mohammed, S. B., Gerry, S., et al. (2018). Continuous positive airway pressure effect on visual acuity in patients with type 2 diabetes and obstructive sleep apnoea: a multicentre randomised controlled trial. Eur. Respir. J. 52:1801177. doi: 10.1183/13993003.01177-2018
Xu, K., Wang, J., Liu, G., Yan, J., Chang, M., Jiang, L., et al. (2024). Altered dynamic effective connectivity of the default mode network in type 2 diabetes. Front. Neurol. 14:1324988. doi: 10.3389/fneur.2023.1324988
Yang, C., Wang, C., Chen, X., Xiao, B., Fu, N., Ren, B., et al. (2022). Event-related potential assessment of visual perception abnormality in patients with obstructive sleep apnea: a preliminary study. Front. Hum. Neurosci. 16:895826. doi: 10.3389/fnhum.2022.895826
Yang, C., Zhang, H., Ma, Z., Fan, Y., Xu, Y., Tan, J., et al. (2024). Structural and functional alterations of the hippocampal subfields in T2dm with mild cognitive impairment and insulin resistance: a prospective study. J. Diabetes 16:e70029. doi: 10.1111/1753-0407.70029
Yu, W., Lu, Y., Chen, T., Xia, Y., Tang, J., Hussein, N. M., et al. (2023). Frequency-dependent alterations in regional homogeneity associated with puberty hormones in girls with central precocious puberty: a resting-state fmri study. J. Affect. Disord. 332, 176–184. doi: 10.1016/j.jad.2023.03.051
Zhang, D., Gao, J., Yan, X., Tang, M., Zhe, X., Cheng, M., et al. (2020). Altered functional connectivity of brain regions based on a meta-analysis in patients with T2dm: a resting-state fmri study. Brain Behav 10:e01725. doi: 10.1002/brb3.1725
Zhao, Y., Wang, H., Tang, G., Wang, L., Tian, X., and Li, R. (2025). Risk factors for mild cognitive impairment in type 2 diabetes: a systematic review and meta-analysis. Front. Endocrinol. 16:e70029. doi: 10.3389/fendo.2025.1617248
Keywords: T2DM, OSA, cognitive impairment, regional homogeneity, functional connectivity, resting-state functional magnetic resonance imaging
Citation: Zhezi W, Yanxi X, Xingwu X, Sheng L, Bencheng M, Guangping S, Yunyi L and Yue L (2025) Investigating the impact of type 2 diabetes mellitus on brain function in obstructive sleep apnea patients using regional homogeneity and seed-based functional connectivity methods. Front. Neurosci. 19:1581884. doi: 10.3389/fnins.2025.1581884
Edited by:
Lili Jiang, Chinese Academy of Sciences (CAS), ChinaReviewed by:
Zhenliang Xiong, Guizhou University, ChinaJiang Yuanliang, Wuhan People’s Liberation Army General Hospital, China
Copyright © 2025 Zhezi, Yanxi, Xingwu, Sheng, Bencheng, Guangping, Yunyi and Yue. This is an open-access article distributed under the terms of the Creative Commons Attribution License (CC BY). The use, distribution or reproduction in other forums is permitted, provided the original author(s) and the copyright owner(s) are credited and that the original publication in this journal is cited, in accordance with accepted academic practice. No use, distribution or reproduction is permitted which does not comply with these terms.
*Correspondence: Liu Yue, bHlfaGpoQDE2My5jb20=