 Meng Wang
 Jingjing Yang1
 Qiong Wu
 Fengxia Wu
- 1School of Artificial Intelligence, Changchun University of Science and Technology, Changchun, China
- 2Laboratory of Psychological Testing and Behavior Analysis, Liaoning University, Shenyang, Liaoning, China
- 3Department of Psychology, Suzhou University of Science and Technology, Suzhou, China
Symmetry is a crucial cue for perceptual grouping in human vision. This study investigates the neural and cognitive mechanisms underlying symmetry perception, focusing on hemispheric specialization and the effects of noise on symmetry detection. Using psychophysical and electrophysiological (EEG) experiments, participants were presented with reflection symmetric patterns (full circle vs. right-left quarter-circle), under varying noise levels. Behavioral results demonstrated noise-induced impairment in accuracy (p < 0.001), with Cycle outperforming Quarter in noiseless conditions (p < 0.05), highlighting the role of contour completeness in perceptual grouping. EEG recordings revealed distinct neural mechanisms associated with different stages of symmetry processing. Early sensory processing exhibited left-hemisphere dominance, while later stages implicated the right hemisphere in noise-modulated global integration. Noise disrupted early contour integration and attenuated higher-order object recognition processes, with right-hemisphere sensitivity to noise emerging during decision-making. These findings challenge the strong version of the callosal hypothesis, highlighting the complexity of hemispheric interactions in symmetry perception. This study provides new insights into the interplay between bottom-up sensory processing and top-down hemispheric interactions in perceptual organization.
1 Introduction
The human visual system is remarkably adept at organizing fragmented or incomplete visual input into coherent perceptual objects. This ability is governed by the principles of perceptual grouping, as outlined by the Gestalt laws of perception, which include principles such as good continuation, closure, proximity, similarity, and symmetry (Gorbunova, 2017; Mauro and David, 2024; Purves, 2024; Wang et al., 2022). Among these, symmetry has been identified as a particularly salient cue for perceptual grouping (Moscoso et al., 2023; Henle, 1963; Hu et al., 2024; Purves, 2024). Symmetry allows the visual system to efficiently segregate objects from their backgrounds and to infer the structure of partially occluded or ambiguous stimuli (Moscoso et al., 2022). Ernst Mach (Mach, 1914) was among the first to systematically categorize symmetry into three types: translational (repetition) symmetry, reflectional (mirror) symmetry, and centric (rotational) symmetry. Of these, reflectional symmetry, particularly mirror symmetry, has been shown to be processed more readily and rapidly than other forms of symmetry or asymmetrical patterns (Palmer and Hemenway, 1978; Wright, 1972). This efficiency in processing mirror symmetry is thought to play a critical role in the perceptual organization of visual scenes, helping to group and segregate visual input into meaningful objects and backgrounds (Machilsen et al., 2009).
1.1 Neural mechanisms of symmetry perception
Recent advances in neuroimaging and electrophysiological techniques have provided new insights into the neural mechanisms underlying symmetry perception (Beck et al., 2005; Carr et al., 2025). Functional magnetic resonance imaging (fMRI) and electroencephalography (EEG) studies have identified a distributed network of brain regions involved in processing symmetrical patterns. These include early visual areas such as the primary visual cortex (V1) and extrastriate areas (V2, V4), as well as higher-order regions like the lateral occipital complex (LOC) and the intraparietal sulcus (IPS) (Bertamini et al., 2018; Makin et al., 2021). These regions work in concert to encode local symmetrical features and integrate them into global perceptual representations. For example, Tyler et al. (2005) used fMRI to investigate the LOC exhibits strong neural responses to symmetry patterns (such as mirror and rotational symmetry), supporting its role in symmetry grouping and perception (Tyler et al., 2005). This suggests that the LOC plays a critical role in the perceptual grouping of symmetrical patterns. Similarly, Bertamini et al. (2018) demonstrated that symmetry processing involves both feedforward and feedback mechanisms, with early visual areas encoding local features and higher-order regions integrating these features into coherent perceptual objects (Bertamini et al., 2018).
1.2 Cognitive and contextual influences on symmetry perception
While neural mechanisms provide the foundation for symmetry detection, cognitive factors such as attention, expectation, and learning also play a significant role (Elena et al., 2021; Makin et al., 2023). Recent studies have shown that symmetry perception can be modulated by top-down processes, such as attentional focus and task demands. For instance, research by Bertamini and Makin (2014) demonstrated that attention can enhance the perception of symmetry, particularly when participants are explicitly instructed to focus on symmetrical patterns (Bertamini and Makin, 2014). This suggests that attention can amplify the neural responses to symmetry, making it more salient in the visual field. Moreover, understanding hemispheric specialization in symmetry perception is critical for cognitive neuroscience because it reveals fundamental principles of how the brain achieves perceptual organization (Rabbito et al., 2023). The two hemispheres exhibit distinct processing biases - with the left hemisphere preferentially analyzing local features and the right hemisphere specializing in global integration (Fink et al., 1997; Makin et al., 2021; Paulraj et al., 2018). As symmetry detection requires both local element processing and global configuration analysis, it provides an ideal paradigm to investigate how divided hemispheric computations are coordinated through callosal connections.
In this study, we aim to further explore the mechanisms underlying symmetry perception, with a particular focus on the role of the two cortical hemispheres in the detection of reflection symmetric patterns. Specifically, does there exist hemisphere specialization for the detection of reflection symmetric patterns? The callosal hypothesis posits that the anatomical symmetry of the human visual system underlies the efficiency of vertical symmetry detection. However, recent evidence suggests that symmetry perception may involve more complex interactions between the two hemispheres. We aim to examine whether there is a functional specialization of the left and right hemispheres for processing different orientations of reflection symmetry.
To address these issues, we conducted a series of psychophysical and electrophysiological experiments in which participants were presented with two types of symmetrical patterns: cycle and right-left quarter-circle. These patterns were presented in the right, left, or both visual fields to assess the role of hemispheric processing in symmetry detection. By combining behavioral measures with EEG recordings, we aim to provide a comprehensive understanding of the neural and cognitive mechanisms underlying symmetry perception.
2 Materials and methods
2.1 Participants
Fifteen students (10 males; mean age = 26.3; SD = 3.4) with normal or corrected-to-normal vision from Okayama University volunteered for the experiments. They provided written informed consent for their participation in this study, which was previously approved by the ethics committee of Okayama University.
2.2 Apparatus and stimuli
We used MATLAB (v 14; the MathWorks, Okayama, Japan) and GERT, the Grouping Elements Rendering Toolbox (Demeyer and Machilsen, 2012), to construct arrays of non-overlapping Gabor elements on a uniform gray background (Figure 1). The arrays comprised 496 × 496 pixels. Each Gabor element was defined as the product of a sine wave luminance grating (frequency of 3 cycles per degree of visual angle and presented at 100% Michelson contrast) and a circular Gaussian (standard deviation of 3 arc min). There were 512 Gabor elements, interior 62 elements, exterior 410 elements and outline 40 elements. The number of elements inside and outside the shape outline was adjusted to ensure a homogeneous spacing between the Gabor elements. The orientations of the inside and outside Gabors were randomly and unchanged. A subset of 40 Gabor elements were positioned along the contour outline of an artificial circle shape. The shape outline was generated by plotting the sum of 5 radial frequency components in polar coordinates. The orientation of Gabor on contour was defined by stimulus type and stimulus intensity. There were two kinds of stimulus type: circle, right-left quarter-circle, see Figure 1A. The elements had orientations parallel to the local tangent of the shape outline. For example, the orientation of left 20 Gabors were local tangent of the shape outline but right 20 Gabors were randomly when stimulus was left semicircle. In addition, we created three different noise levels by altering the orientations of the contour elements. As shown in Figure 1B, Stimuli noise 0.0 (SN0.0): The orientations of the Gabors are aligned with the local tangents of the shape contours; Stimuli noise 0.4 (SN0.4): Randomly change the orientations of the 8 Gabors; Stimuli noise 0.8 (SN0.8): Randomly change the orientations of the16 Gabors.
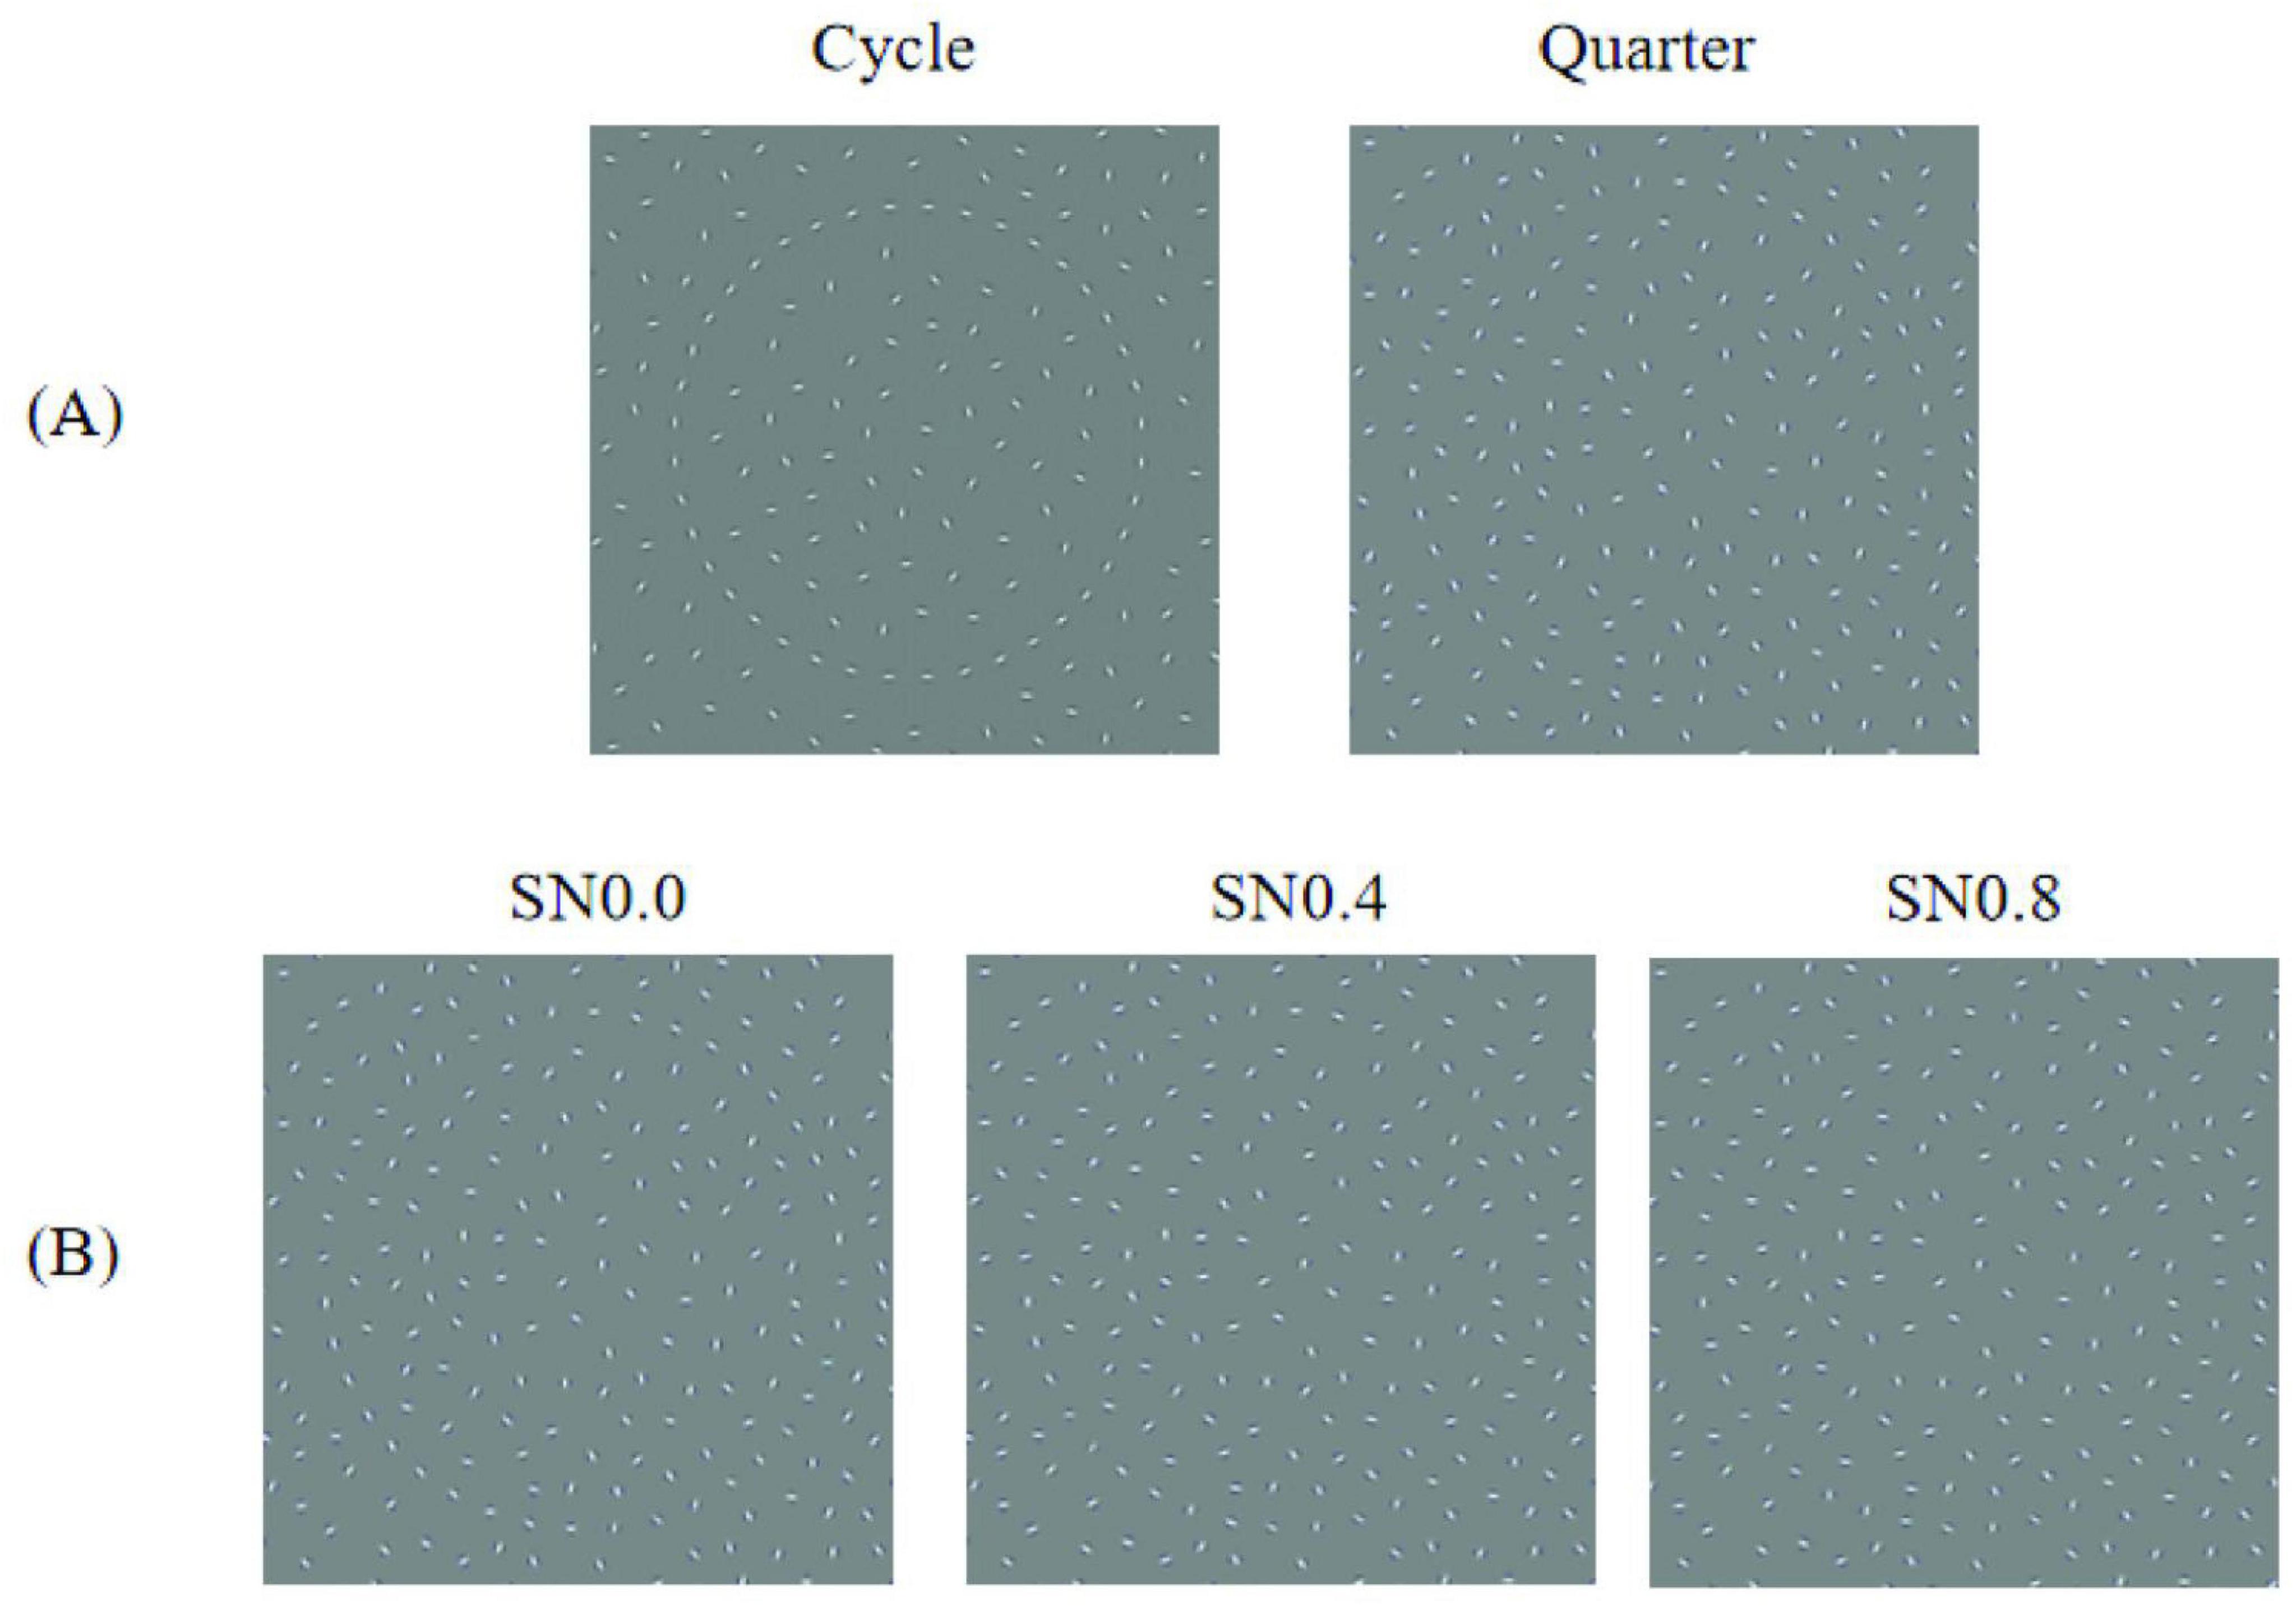
Figure 1. Base stimulus used in the experiment. (A) Examples of two types of stimuli. (B) Examples of three different noise levels.
2.3 Procedure and task
The subjects were instructed to perform the experiment in a dimly lit, electrically shielded and sound-attenuated room (laboratory room, Okayama University, Japan) with their head positioned on a chin rest. Stimulus presentation and response collection were conducted using E-prime 1.1 software (Psychology Software Tolls, Inc., Pittsburgh, PA, USA). Figure 2 showed the experiment consisted of three sessions of 120 trials each, all stimuli were presented randomly. For each stimulus condition, subjects were presented with a central fixation cross for a randomized duration between 1200 and 1800 ms, followed by the stimulus display for 150 ms. During the experiment, participants were instructed to press the “1” key on the keyboard when a “Cycle” stimulus was displayed, the “2” key for a “left quarter-circle” stimulus, and the “3” key for a “right quarter-circle” stimulus.
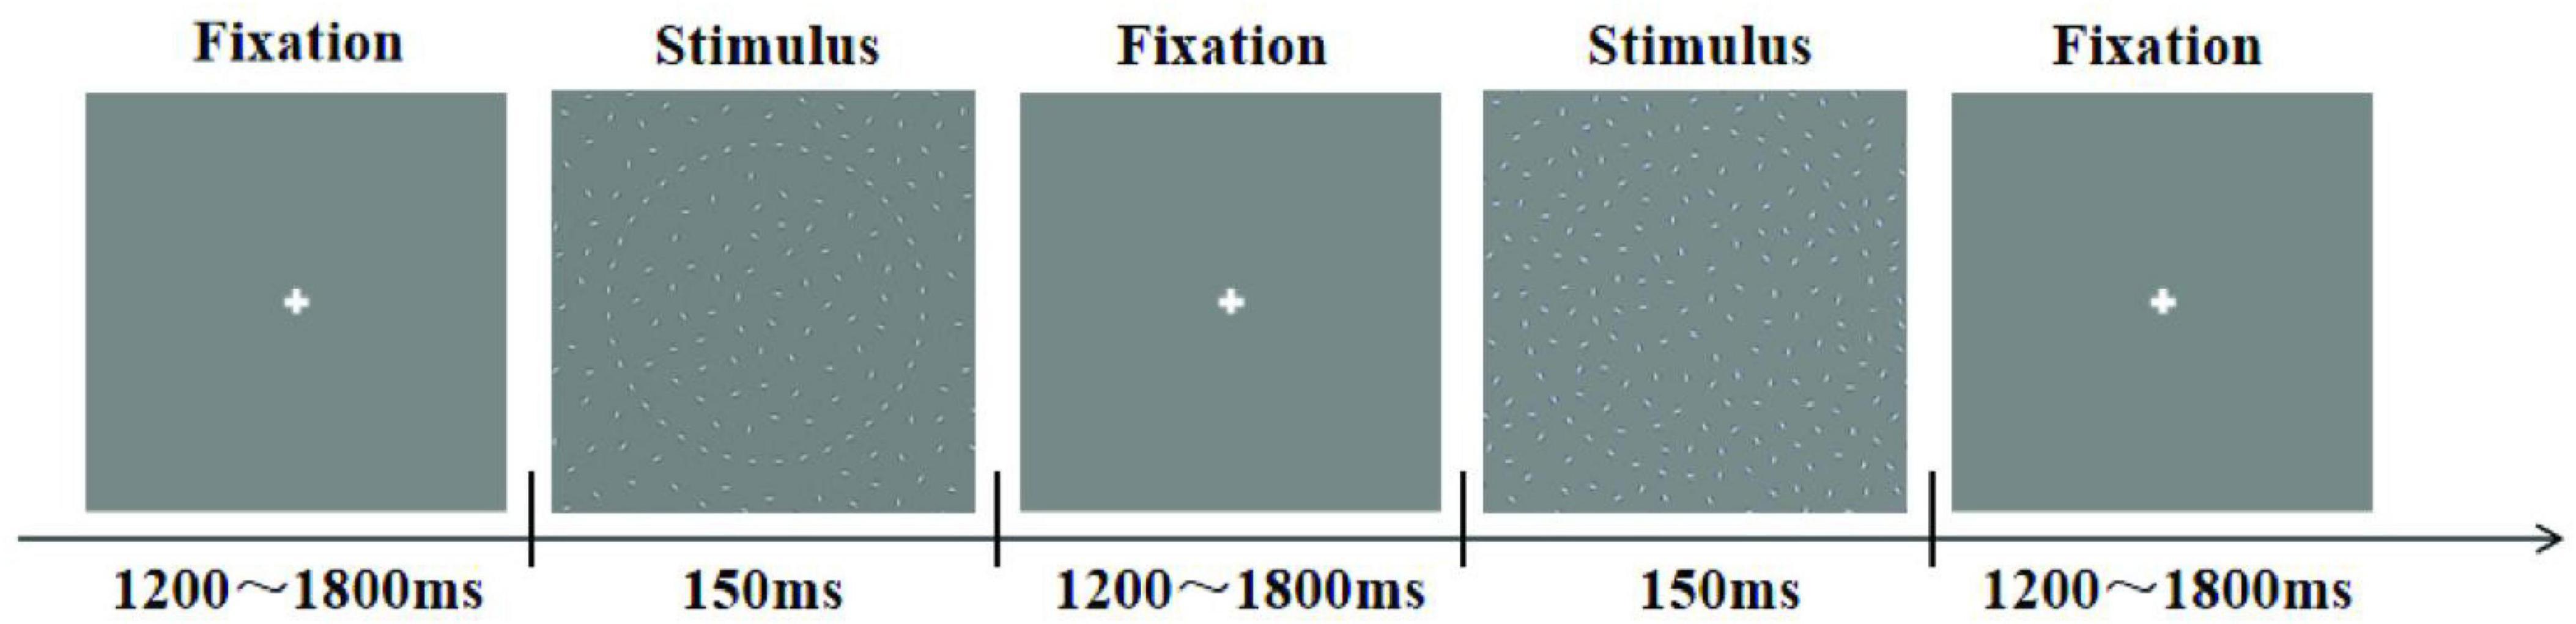
Figure 2. Trial structure of the experiment.
2.4 EEG recording and analyses
An EEG system (BrainAmp MR plus, Gilching, Germany) was used to record EEG signals through 32 electrodes mounted on an electrode cap (Easy Cap, Herrsching-Breitbrunn, Germany). Horizontal eye movements were measured by deriving the electrooculogram (EOG) from one electrode placed about 1cm from the outer canthi of the left eye. Vertical eye movements and eye blinks were detected by deriving an EOG from an electrode placed approximately 1.5 cm below the subject’s left eye. All signals were referenced to left and right earlobe, and the impedance was maintained below 5 kΩ. Raw signals were acquired at a sample rate of 500 Hz and stored for off-line analysis.
The ERPs elicited by target stimuli were analyzed by using the Brain Vision Analyzer software (version 1.05, Brain Products GmbH, Munich, Germany). The data were band-pass filtered from 0.01 to 30 Hz. Then, the data were divided into epochs, from −100 ms before stimulus onset to 500 ms after stimulus onset, and baseline corrections were made to the data from −100 ms to stimulus onset. Epochs contaminated by artifacts (i.e., eye movements, eye blinks, amplifier blocking) were rejected based on a threshold of ±100 μV in all channels before averaging. All averaged ERP waveforms were obtained across all participants for each stimulus type in each electrode.
Therefore, our analysis was performed across electrode regions of interest focused at left occipital region (O1), right occipital region (O2), left parietal region (P3 and P7), right parietal region (P4 and P8), see Figure 3.
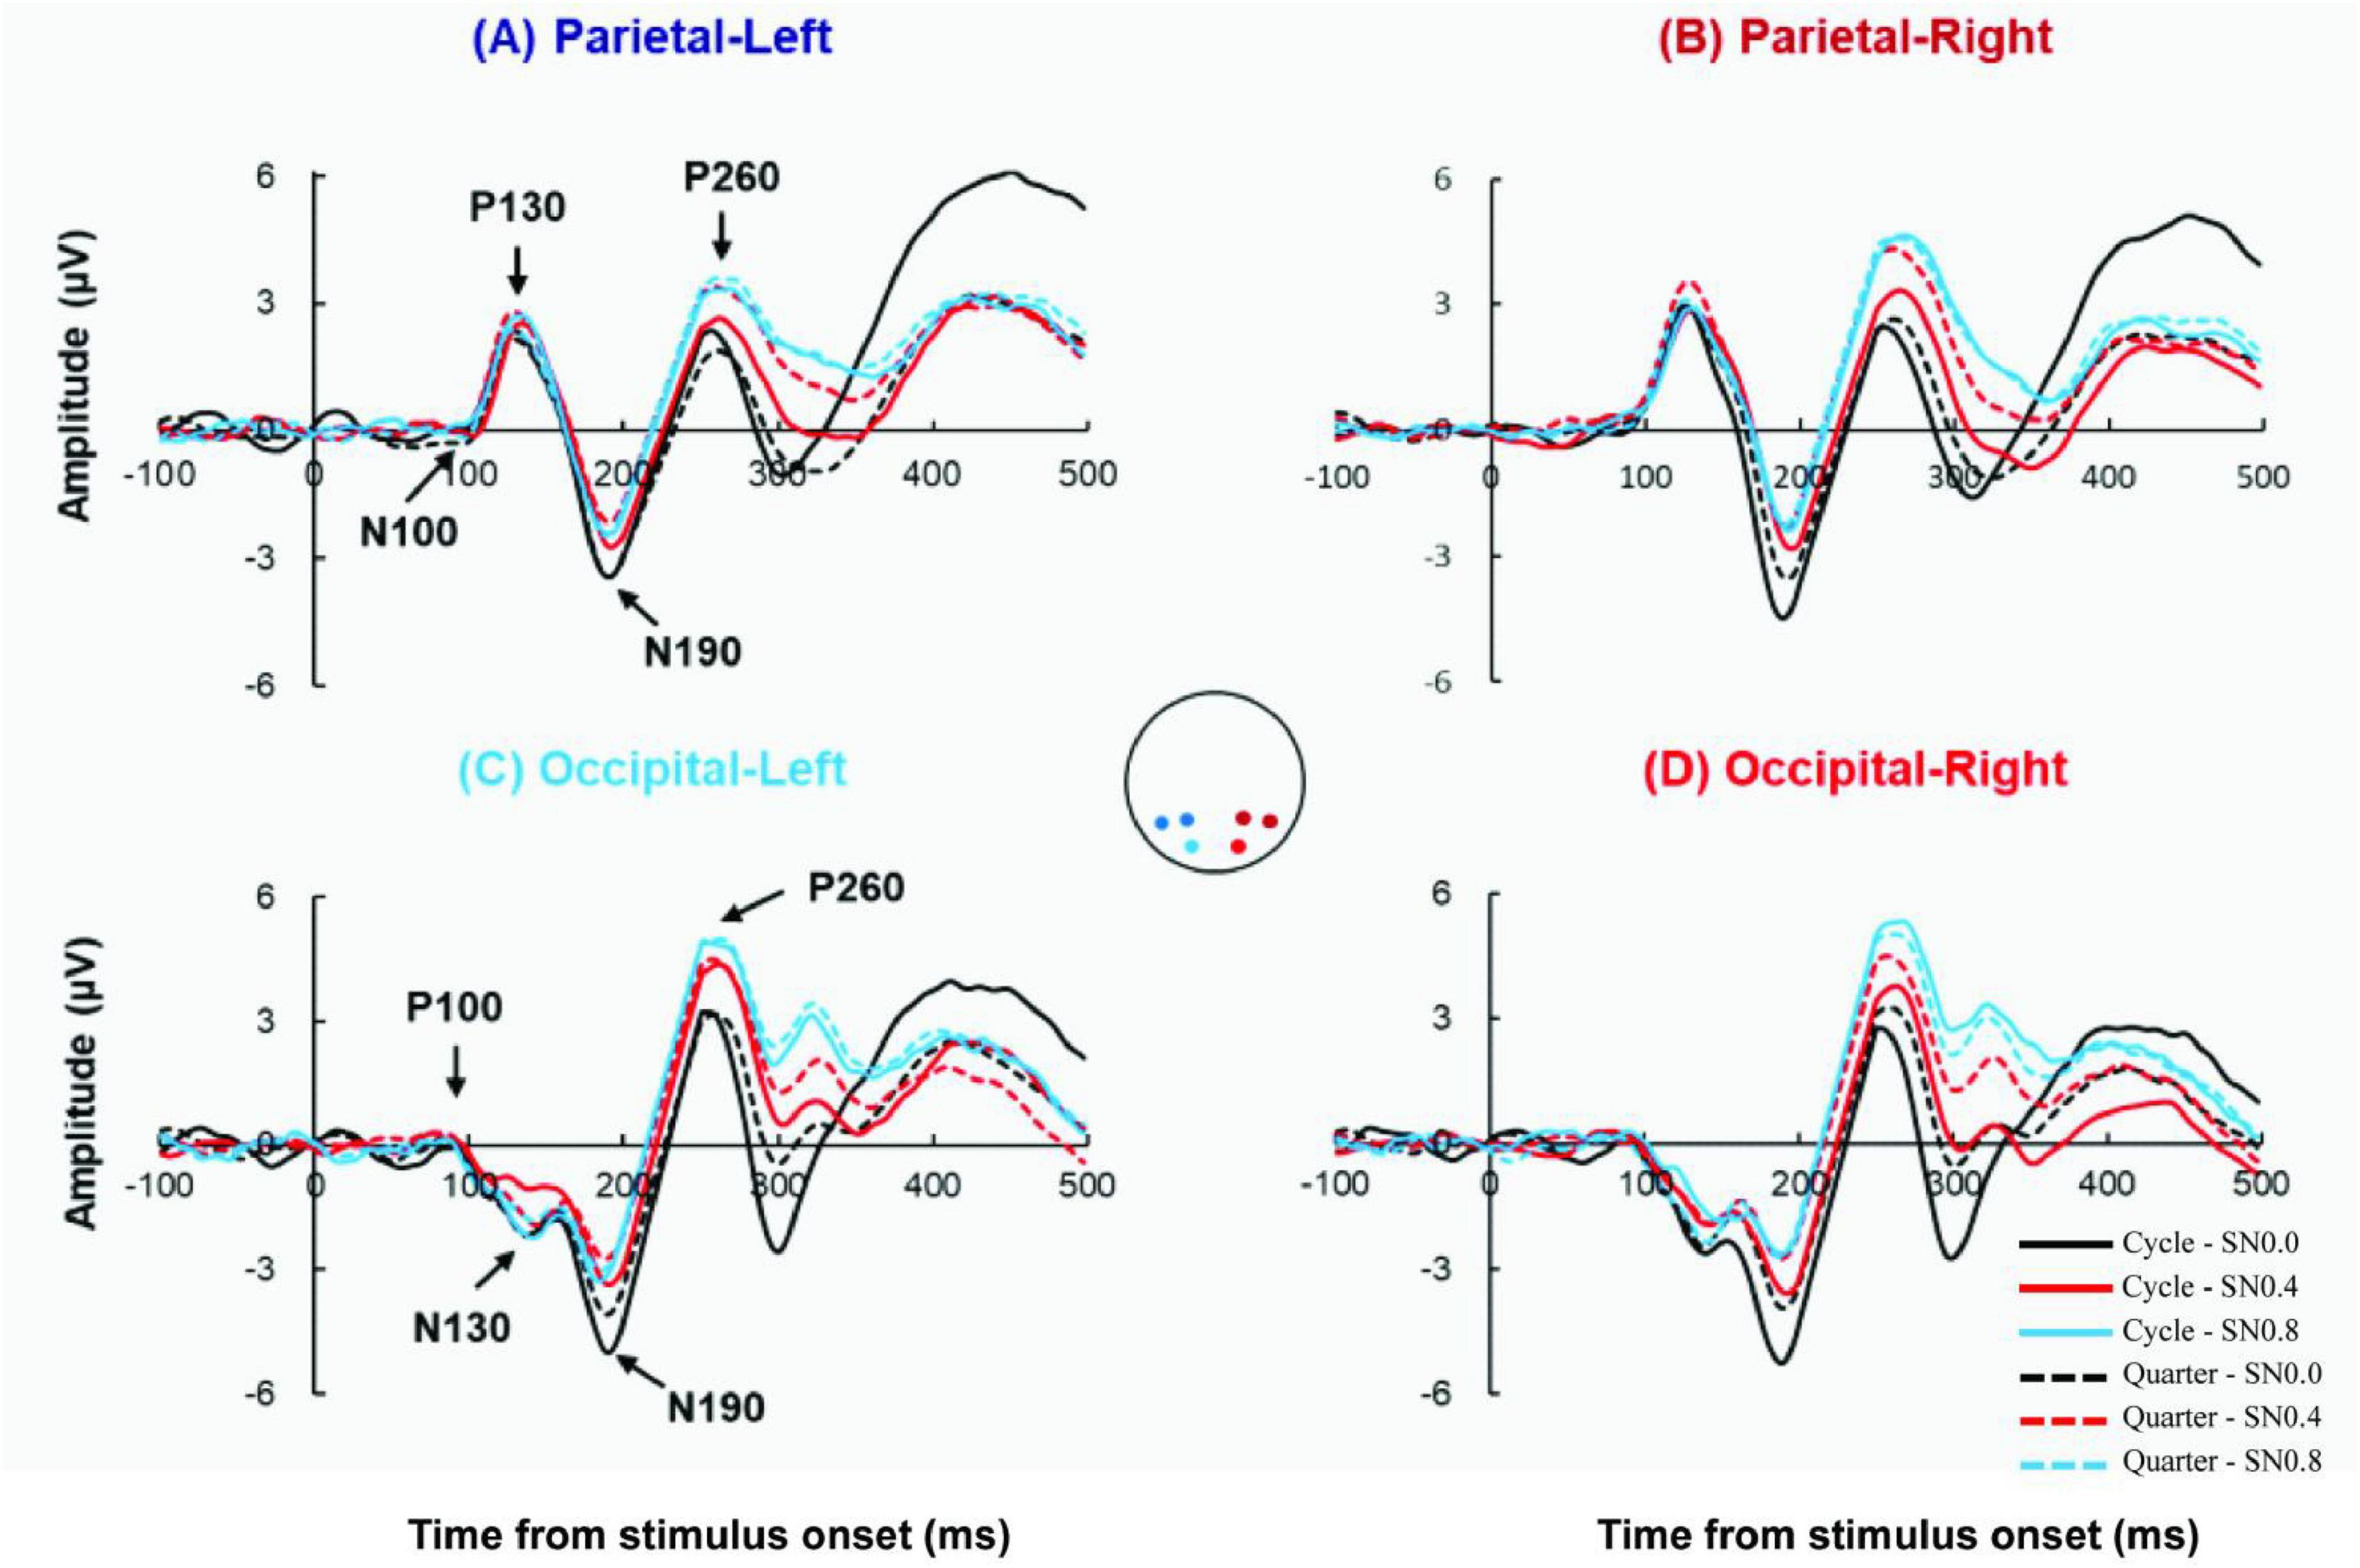
Figure 3. Grand-average ERP wave from 4 ROIs. (A) The Grand-average ERP waves from left parietal with 2 stimulus types (cycle: solid line; quarter: dot line) in SN0.0, SN0.4, SN0.8. Equivalent data from right parietal (B), left occipital (C) and right occipital (D).
Murray et al. (2006) found that both correct and incorrect responses did not affect the contour integration effect or shape detection within the first 300 milliseconds (Murray et al., 2006). Therefore, four main components before 300 ms were statistically analyzed. The first component was the P/N100 complex (peaking around 100 ms after stimulus onset); the second component was the P/N130 complex (peaking around 130 ms after stimulus onset); the third component was the N190 (peaking around 190 ms after stimulus onset); the last component was P260 (peaking around 260 ms after stimulus onset). Amplitudes of these component respectively measured as an average of 20 ms duration around the peak. ANOVA (Greenhouse-Geisser corrections with corrected degrees of freedom).
3 Results
3.1 Behavioral results
Table 1 showed the proportion correct for the 6 stimuli. Analysis of the proportion correct using 2 (stimulus type) × 3 (noise level) repeated measures ANOVA revealed a significant main effect in noise level [F (2, 28) = 190.008, p < 0.001, ηp2 = 0.931], showing that the identification ability of participants was decreased with noise enhancement. Whereas, no significant difference was found in stimulus type [F (1, 14) = 2.663, p = 0.125, ηp2 = 0.160]. The interaction between stimulus type and noise level was significant [F (2, 28) = 6.705, p = 0.012, ηp2 = 0.324], indicated that contour effect was different in varying noise level. The pairwise comparisons showed that for the SN 0.0 condition, the responses to cycle stimuli were significantly higher than the responses to quarter stimuli (p < 0.05). All reported statistics reflect Green-Geisser corrections at a significance level of 0.05.
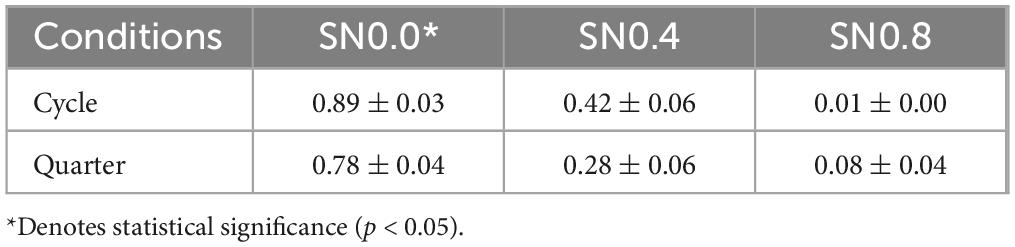
Table 1. Behavior results of the proportion correct.
3.2 ERP results
Figure 3 showed the ground-averaged ERPs across all participants for 6 stimuli. All stimuli evoked similar P100, N130, N190, P260 components at occipital electrode, and evoked N100, P130, N190, P260 components at parietal electrode. Analysis of the peak latency with 4 components revealed there was no significant difference in 6 stimuli across both hemispheres and electrodes (all p > 0.05). Analysis of the mean amplitude of 4 components (P/N100, P/N130, N190, P260) × 2 electrode (occipital, parietal) × 2 hemisphere (left, right) × 2 stimuli type (cycle, quarter) × 3 noise level (SN0.0, SN0.4, SN0.8) repeated measures ANOVA revealed a significant four-way component × electrode × hemisphere × stimuli type × noise level interaction [F (6, 84) = 3.937, p = 0.015, ηp2 = 0.219]. The results suggested different processing patterns for different noise conditions and for left hemisphere and right hemisphere. Therefore, we analyzed these differences in detail as follows.
3.2.1 P/N100 component
Apparently, for this component, there was a clear inversion across the electrode sites. Therefore, ANOVA tests were conducted separately for occipital and parietal electrode using the factors hemisphere, stimulus type and noise level. For the occipital electrode, the mean amplitude was submitted to a 2 hemisphere (left, right) × 2 stimuli type (cycle, quarter) × 3 noise level (SN0.0, SN0.4, SN0.8) ANOVA, no main effect or interaction were observed, see Figure 4A. Whereas, for the parietal electrode, a main effect of hemisphere was found [F (1, 14) = 8.056, p = 0.013, ηp2 = 0.365], with a more negative going response to left hemisphere than right hemisphere.
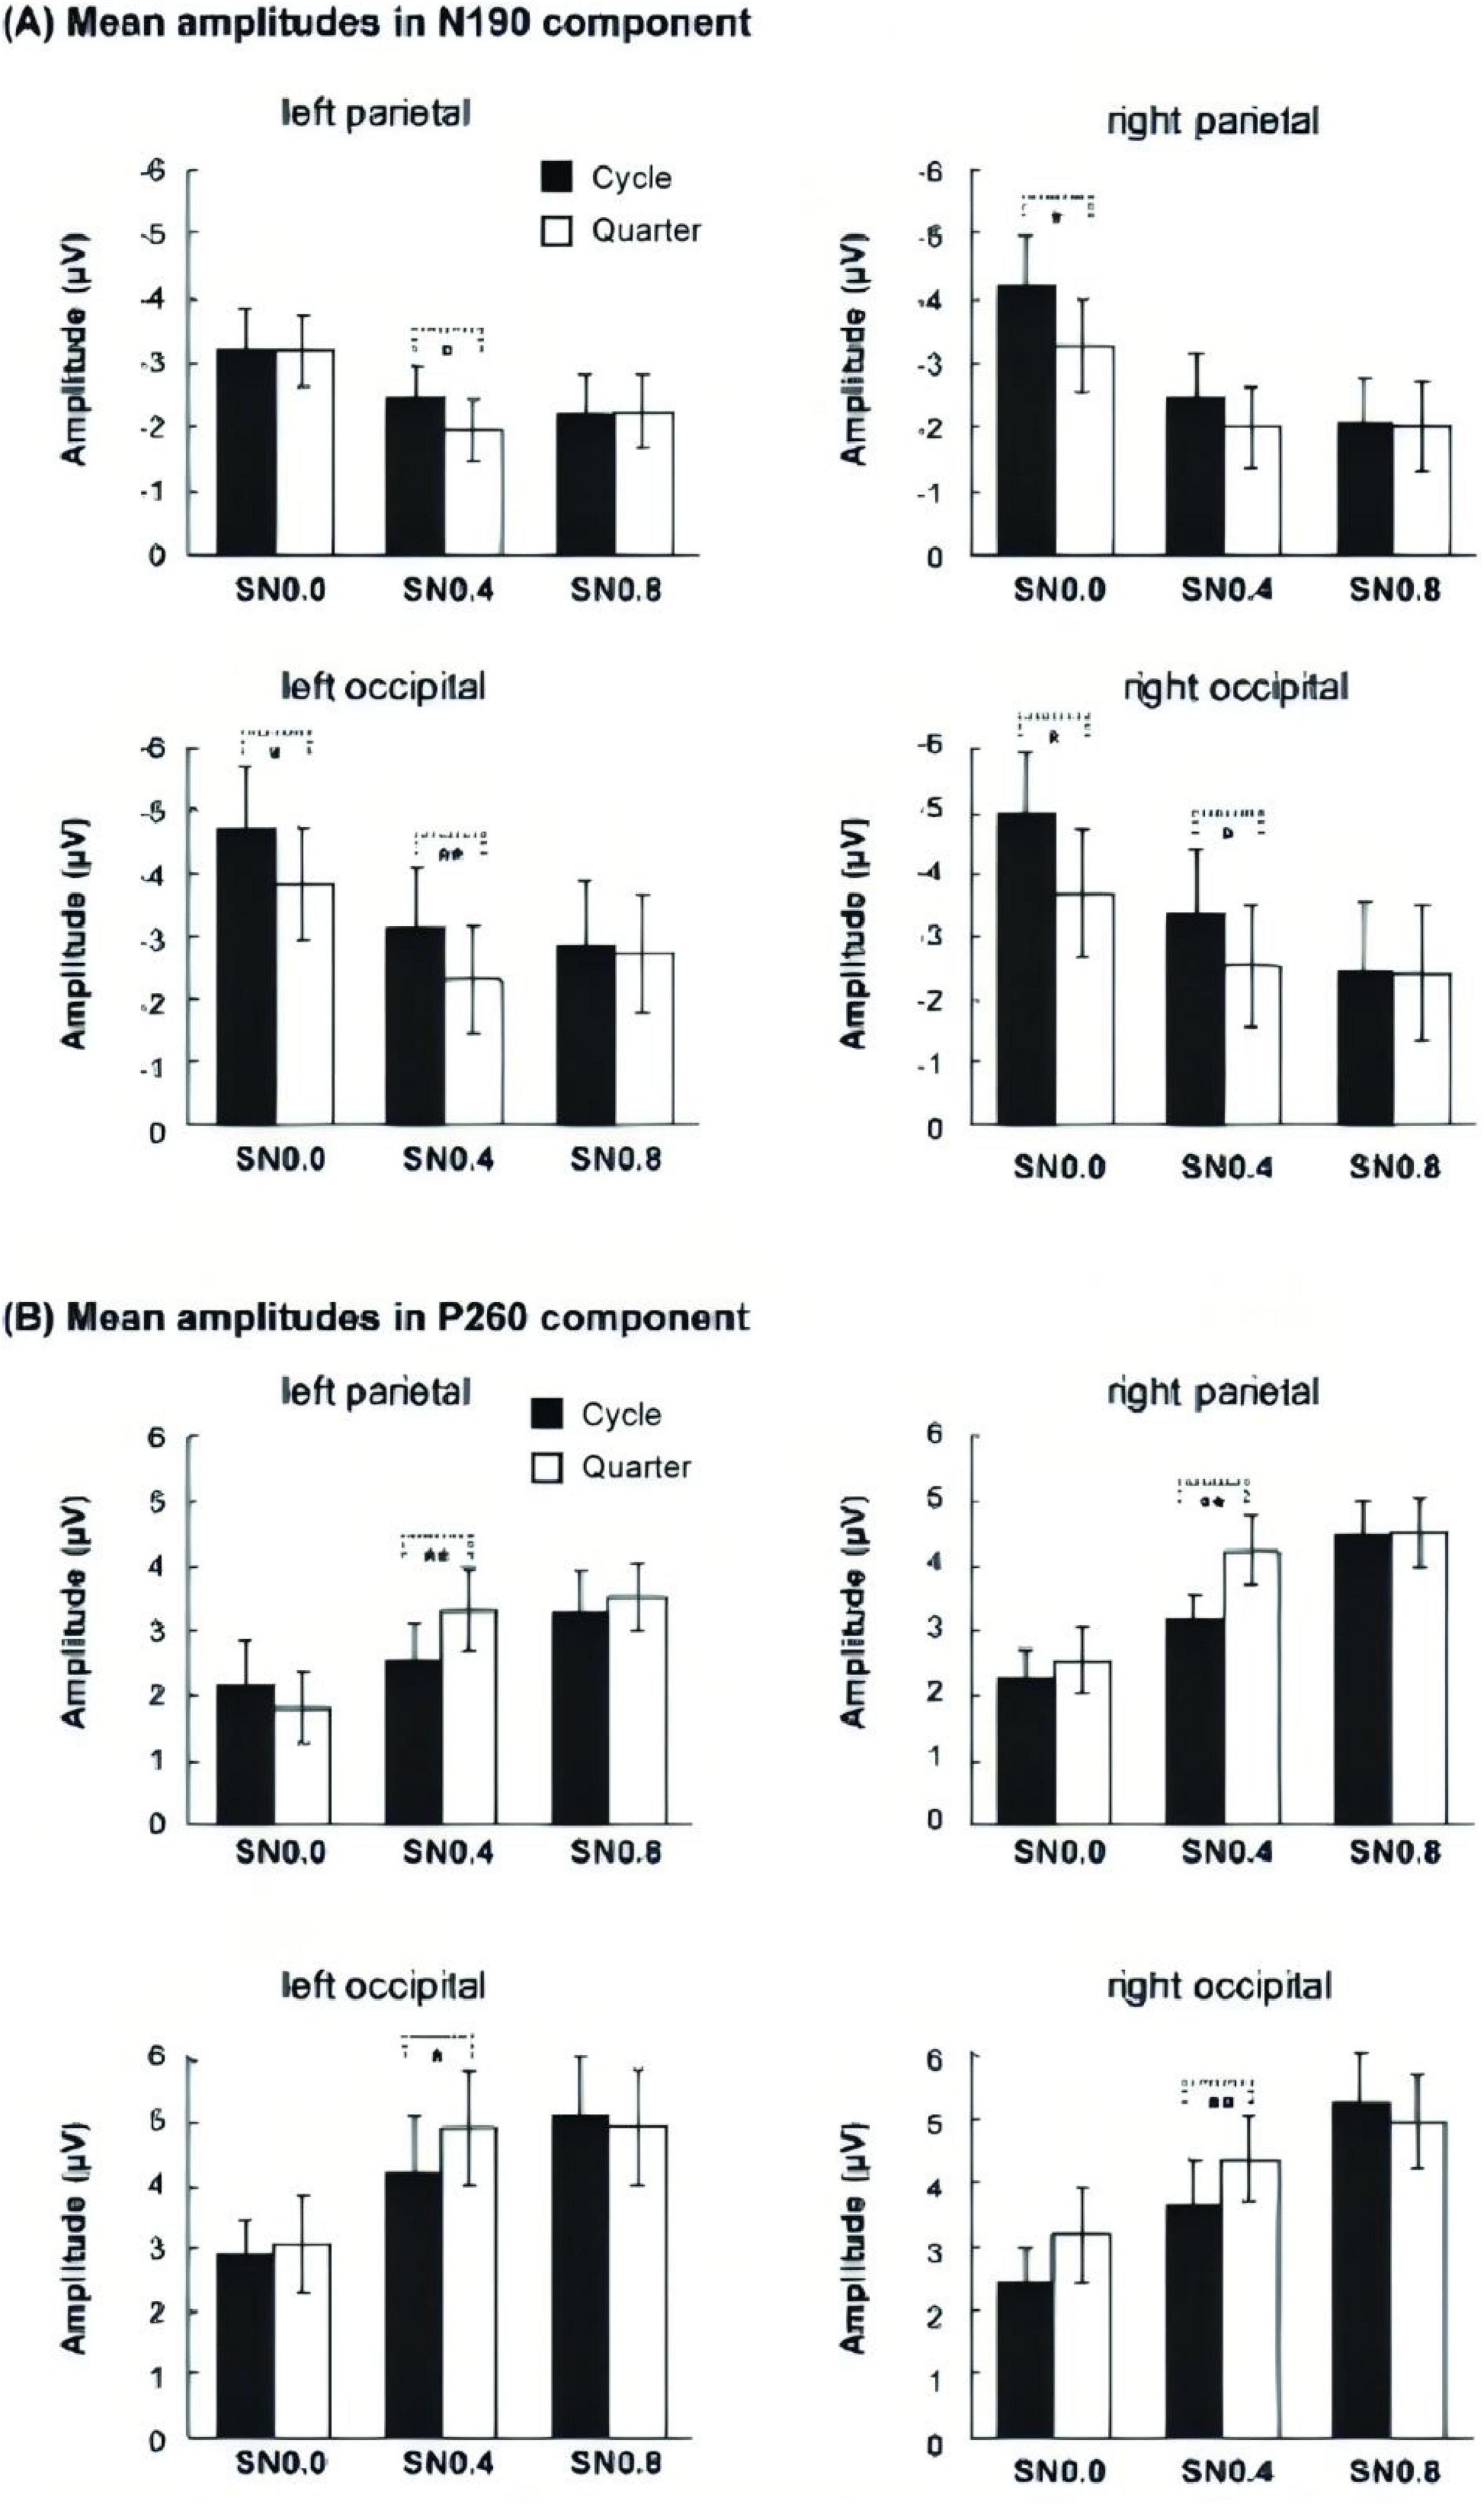
Figure 4. Mean amplitudes of three noise level across four components. (A) Mean amplitudes of P100 in occipital. (B) Mean amplitudes of N130 in occipital. (C) Mean amplitudes of N190 ms over four ROIs. (D) Mean amplitude of P260 over four ROIs. *p < 0.05; **p < 0.01; ***p < 0.001.
3.2.2 P/N130 component
Similar with P/N100 component, ANOVA tests in P/N130 component were conducted separately for occipital and parietal electrodes. The 2 hemispheres (left, right) × 2 stimuli type (cycle, quarter) × 3 noise level (SN0.0, SN0.4, SN0.8) ANOVA for occipital electrode revealed a main effect of noise level [F (2, 28) = 6.896, p = 0.005, ηp2 = 0.33], with N130 being less negative for noise increasing, see Figure 4B. Further post hoc analysis revealed a significant difference between SN0.0 and SN0.4 (p < 0.05), a marginally difference between SN0.0 and SN0.8 (p = 0.069), while the difference between SN0.4 and SN0.8 was not significant (p > 0.05). The 2 hemispheres (left, right) × 2 stimuli type (cycle, quarter) × 3 noise level (SN0.0, SN0.4, SN0.8) ANOVA for parietal electrode revealed that there were no main effect or interaction were observed (all p > 0.05).
3.2.3 N190 component
For the average amplitude of N190 component, 2 electrodes (occipital, parietal) × 2 hemisphere (left, right) × 2 stimuli type (cycle, quarter) × 3 noise level (SN0.0, SN0.4, SN0.8) ANOVA revealed a significant main effect of stimuli type [F (1, 14) = 9.778, p = 0.007, ηp2 = 0.411], noise level [F (2, 28) = 32.26, p < 0.001, ηp2 = 0.697]. The following two-way and three-way interactions were significant: electrode × stimuli type [F (1, 14) = 5.957, p = 0.029, ηp2 = 0.299], hemisphere × noise level [F (2, 28) = 4.439, p = 0.038, ηp2 = 0.241], electrode × stimuli type × noise level [F (2, 28) = 3.936, p = 0.037, ηp2 = 0.219], hemisphere × stimuli type × noise level [F (2, 28) = 4.962, p = 0.016, ηp2 = 0.262]. The post hoc analysis for stimulus type on each noise level and ROI showed that the amplitude of cycle stimulus in SN0.0 and SN0.4 was significantly more negative than that for quarter stimulus at left and right occipital (all p < 0.05). Whereas, this difference in parietal was only found in right hemisphere at SN0.0 (p = 0.032) and left parietal at SN0.4 (p = 0.030). However, no significant difference was found in SN0.8, see Figure 5. In addition, the post hoc analysis for noise level on both stimulus type revealed a significant difference between SN0.0 and SN0.4 (p < 0.001), between SN0.0 and SN0.8 (p < 0.01), while the difference between SN0.4 and SN0.8 was not significant (p > 0.05) in all four ROIs, see Figure 4C.
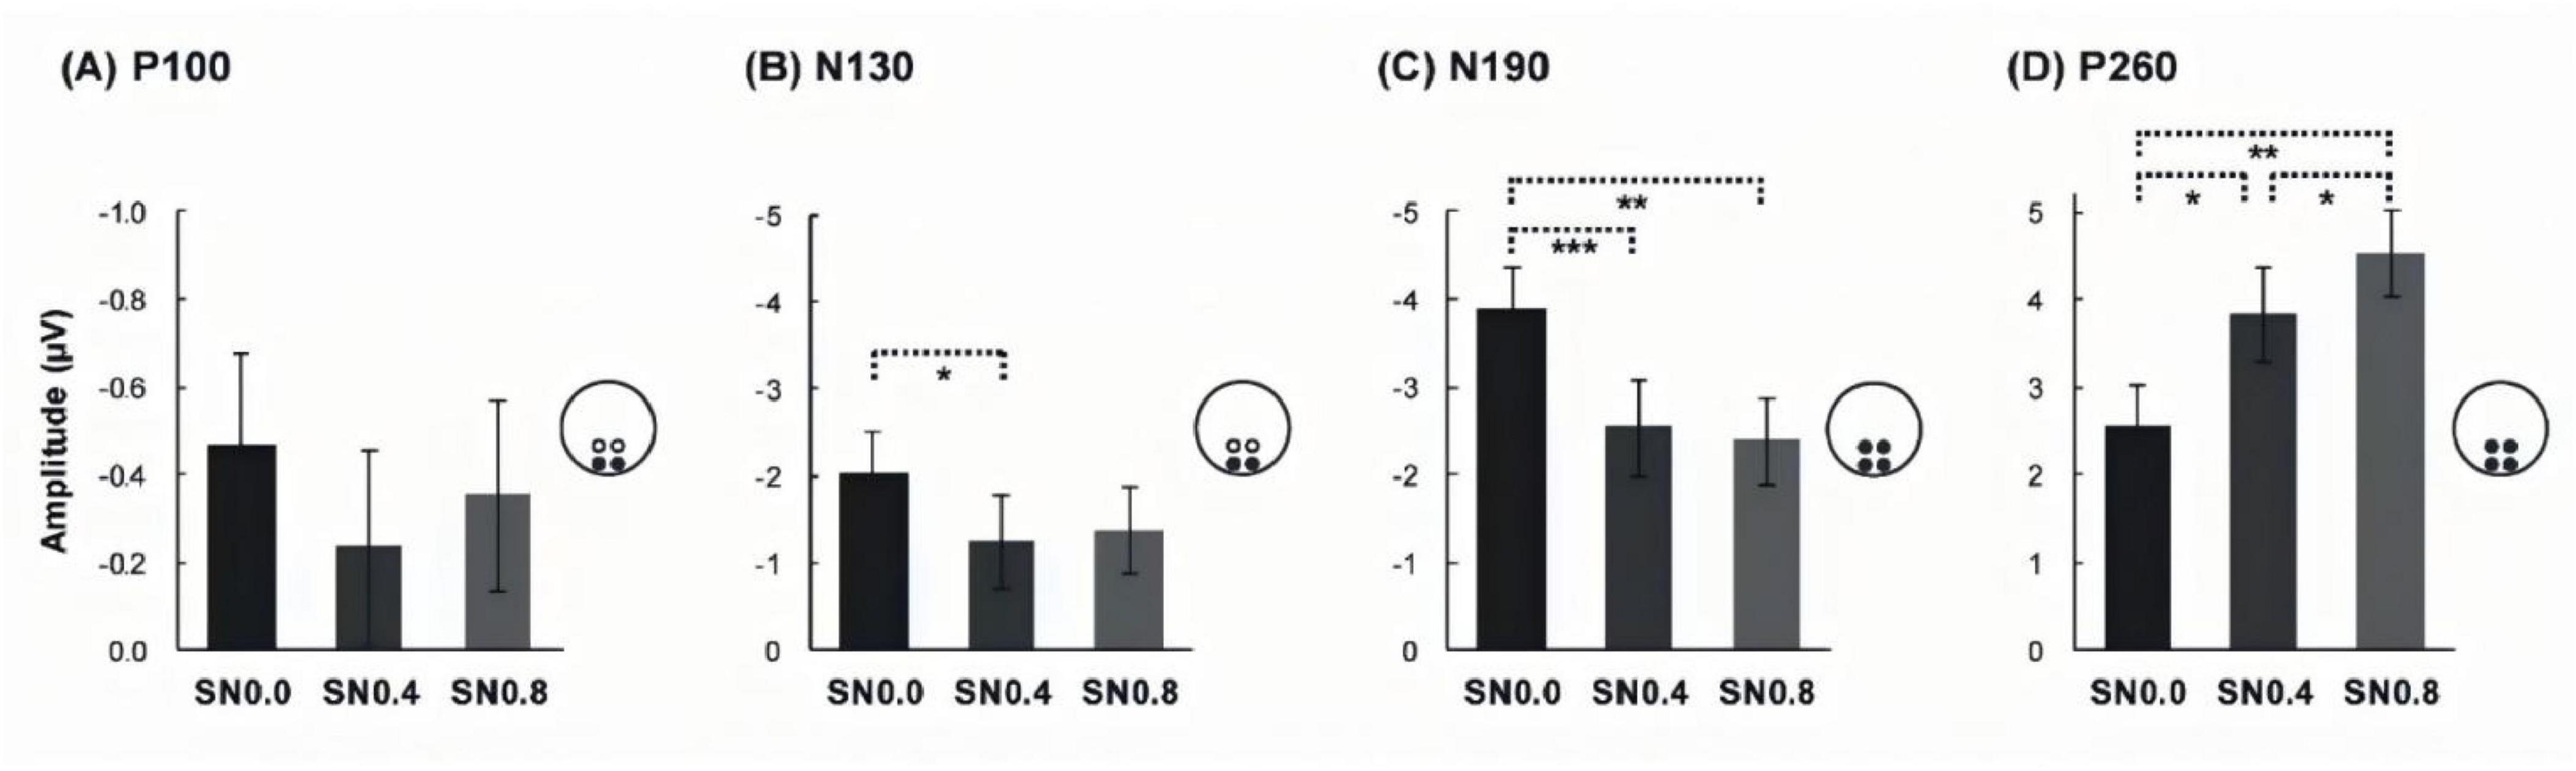
Figure 5. Mean amplitudes of two stimulus types across three noise level at (A) N190 component and (B) P260 component. *p < 0.05, **p < 0.01.
3.2.4 P260 component
For the average amplitude of P260 component, the 2 electrodes (occipital, parietal) × 2 hemisphere (left, right) × 2 stimuli type (cycle, quarter) × 3 noise level (SN0.0, SN0.4, SN0.8) ANOVA revealed a significant main effect of stimuli type [F (1, 14) = 6.569, p = 0.023, ηp2 = 0.319], noise level [F (2, 28) = 32.679, p < 0.001, ηp2 = 0.70]. In addition, three-way interactions of electrode × stimuli type × noise level [F (2, 28) = 6.417, p = 0.01, ηp2 = 0.314], and hemisphere × stimuli type × noise level [F (2, 28) = 4.218, p = 0.028, ηp2 = 0.232] were also significant. The post hoc analysis for stimulus type on noise level and ROI showed that the amplitude of cycle stimulus in SN0.4 was significantly less positive than that for quarter stimulus at four ROIs (all p < 0.05). In addition, further post hoc analysis for noise level on both cycle and quarter stimulus revealed a significant difference between SN0.0 and SN0.4 (p < 0.05), between SN0.0 and SN0.8 (p < 0.05), and the difference between SN0.4 and SN0.8 was also significant (p < 0.01) in all four ROIs, see Figure 4D.
4 Discussion
The present study aimed to investigate the neural and cognitive mechanisms underlying the perception of reflection symmetry, with a particular focus on the role of hemispheric specialization and the effects of noise on symmetry detection. By combining behavioral measures with high-density EEG recordings, we explored how different types of symmetrical patterns (full circle vs. quarter circle) and varying noise levels influence the efficiency of symmetry perception. Our findings provide new insights into the temporal dynamics and neural correlates of symmetry processing, as well as the interplay between bottom-up and top-down mechanisms in visual perception.
The behavioral results revealed that participants’ ability to identify symmetrical patterns decreased significantly as noise levels increased, consistent with previous studies demonstrating that noise disrupts contour integration and perceptual grouping (Field, 1992; Hess and Field, 1999; Baldwin et al., 2017). Interestingly, while there was no overall difference in accuracy between full circle and quarter circle stimuli, a significant interaction between stimulus type and noise level indicated that the contour effect was modulated by noise. Specifically, in the absence of noise (SN0.0), participants performed significantly better with full circle stimuli compared to quarter circle stimuli. This suggests that the completeness of the symmetrical contour plays a critical role in facilitating perceptual grouping under optimal viewing conditions. However, as noise levels increased, this advantage diminished, highlighting the vulnerability of contour integration to external noise. As shown in Table 1, analysis of the proportion correct using a 2 (stimulus type) × 3 (noise level) repeated measures ANOVA revealed a significant main effect of noise level [F (2, 28) = 190.008, p < 0.001, ηp2 = 0.931], showing that the identification ability of participants decreased with noise enhancement. Whereas, no significant difference was found in stimulus type [F (1, 14) = 2.663, p = 0.125, ηp2 = 0.160]. The interaction between stimulus type and noise level was significant [F (2, 28) = 6.705, p = 0.012, ηp2 = 0.324], indicating that the contour effect was different under varying noise levels. The pairwise comparisons showed that for the SN0.0 condition, the responses to cycle stimuli were significantly higher than the responses to quarter stimuli (p < 0.05).
The ERP results provided a detailed temporal profile of symmetry processing, revealing distinct neural components associated with different stages of visual perception (see Table 2). The P/N100 complex, peaking around 100 ms after stimulus onset, is thought to reflect early sensory processing in the primary visual cortex (V1) and extrastriate areas (V2/V4) (Francesco et al., 2002). In our study, the P/N100 component showed no significant differences across stimulus types or noise levels at occipital electrodes, suggesting that early sensory encoding of symmetrical patterns is relatively robust to noise. However, at parietal electrodes, a significant hemisphere effect was observed, with more negative amplitudes in the left hemisphere compared to the right. This asymmetry may reflect differential engagement of the two hemispheres in early visual processing, consistent with previous findings of hemispheric specialization in contour integration (Kovács et al., 1999).
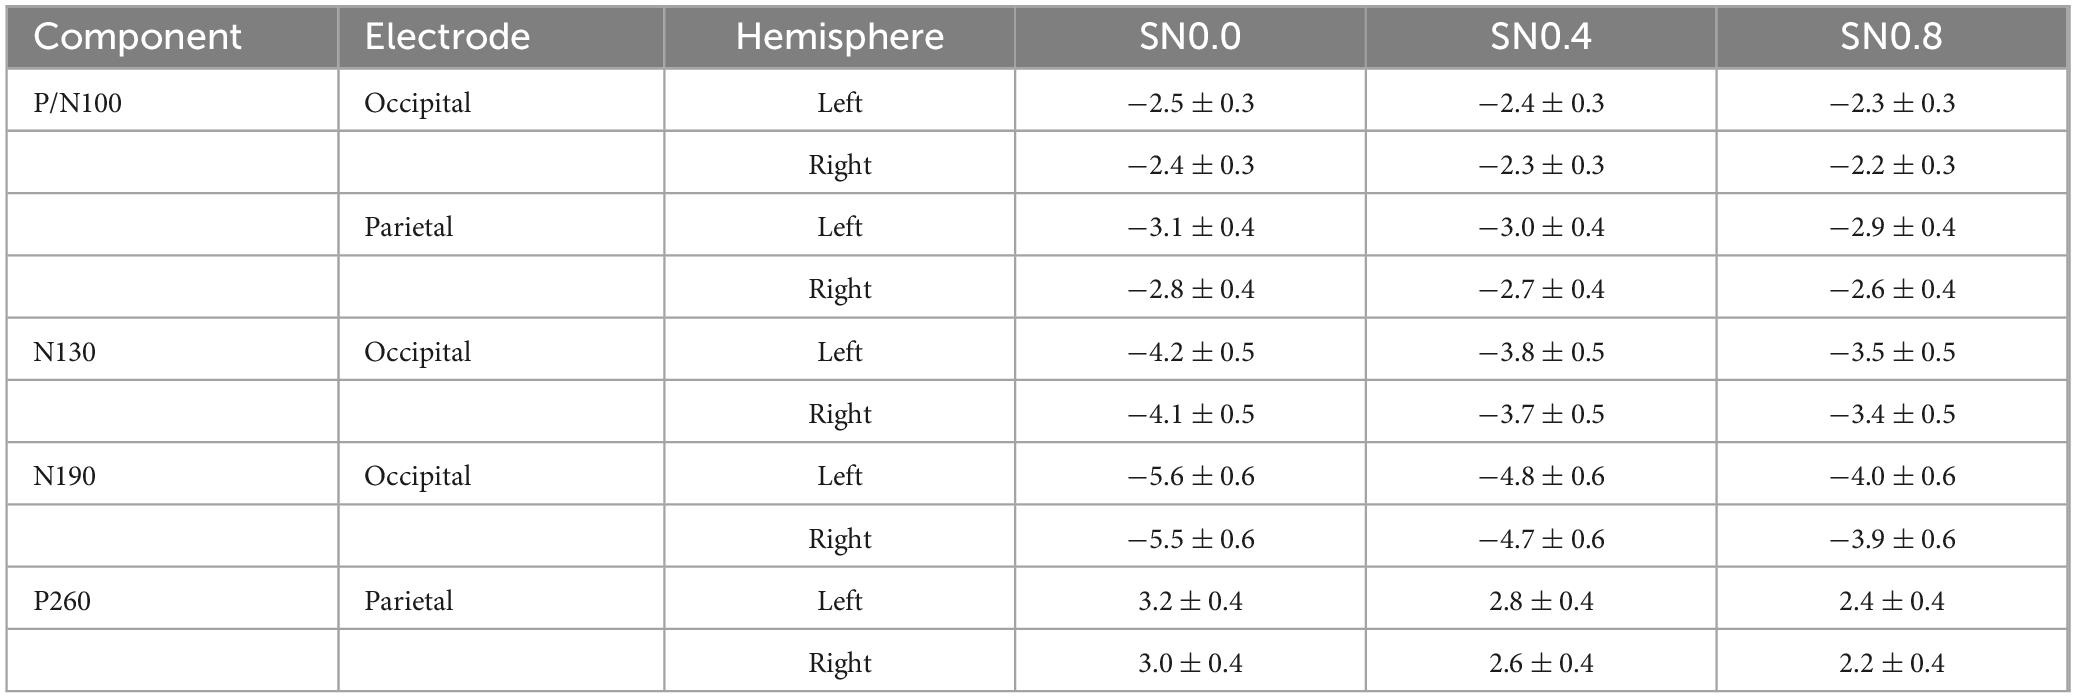
Table 2. Mean amplitudes of ERP components across noise levels.
The N130 component, peaking around 130 ms, is associated with the initial stages of contour integration and perceptual grouping (Murray et al., 2004). Our results showed that the N130 amplitude at occipital electrodes became less negative as noise levels increased, indicating that noise disrupts the early stages of contour integration. This finding aligns with the behavioral results, further supporting the idea that noise impairs the ability to group local elements into coherent global shapes.
The N190 component, peaking around 190 ms, is thought to reflect higher-order processing in the lateral occipital complex (LOC) and other extrastriate areas involved in object recognition (Kourtzi and Kanwisher, 2001). In our study, the N190 amplitude was significantly more negative for full circle stimuli compared to quarter circle stimuli, particularly at occipital electrodes and under low to moderate noise levels (SN0.0 and SN0.4). This suggests that the completeness of the symmetrical contour enhances object recognition processes, but this advantage is attenuated under high noise conditions. Additionally, the significant interactions between hemisphere, stimulus type, and noise level indicate that the two hemispheres may process symmetrical patterns differently, with the right hemisphere showing greater sensitivity to noise.
The P260 component, peaking around 260 ms, is associated with late-stage perceptual decision-making and response selection (Luck and Hillyard, 2010). Our results revealed that the P260 amplitude was less positive for full circle stimuli compared to quarter circle stimuli under moderate noise levels (SN0.4), particularly at parietal electrodes. This suggests that the completeness of the symmetrical contour facilitates decision-making processes, but this effect is modulated by noise. Furthermore, the significant differences in P260 amplitude across all noise levels indicate that noise affects not only early sensory processing but also later stages of perceptual decision-making.
4.1 Hemispheric specialization
One of the key questions addressed in this study was whether there is hemispheric specialization for the detection of reflection symmetry. Our ERP results provide partial support for this idea, with significant hemisphere effects observed at multiple stages of processing. For example, the P/N100 component showed more negative amplitudes in the left hemisphere at parietal electrodes, while the N190 and P260 components revealed significant interactions between hemisphere, stimulus type, and noise level. These findings suggest that the two hemispheres may play distinct roles in symmetry perception, with the left hemisphere potentially specializing in the processing of local features and the right hemisphere in the integration of global shapes (Fink et al., 1997; Sasaki et al., 2005). However, further research is needed to clarify the specific contributions of each hemisphere to symmetry perception.
4.2 Implications for the callosal hypothesis
The callosal hypothesis posits that the anatomical symmetry of the human visual system, particularly the role of the corpus callosum in interhemispheric communication, underlies the efficiency of vertical symmetry detection (Wright, 1972). While our findings do not directly contradict this hypothesis, they suggest that symmetry perception involves more complex interactions between the two hemispheres than previously thought. For example, the significant hemisphere effects observed in our study indicate that symmetry processing is not solely determined by the anatomical midline but is also influenced by functional specialization and task demands. This aligns with recent reviews suggesting that the strong version of the callosal hypothesis is unlikely to fully account for the observed phenomena in symmetry perception (Bertamini et al., 2018; Treder, 2010).
5 Conclusion
In conclusion, our study provides new insights into the neural and cognitive mechanisms underlying symmetry perception. The behavioral and ERP results demonstrate that noise disrupts contour integration and perceptual grouping, with significant effects observed at multiple stages of processing. Additionally, the findings suggest that the two hemispheres may play distinct roles in symmetry perception, with the left hemisphere potentially specializing in local feature processing and the right hemisphere in global shape integration. These results challenge the strong version of the callosal hypothesis and highlight the need for a more nuanced understanding of the factors influencing symmetry perception. Future research should continue to explore the interplay between neural, cognitive, and ecological factors in shaping our perception of symmetry.
Data availability statement
The raw data supporting the conclusions of this article will be made available by the authors, without undue reservation.
Ethics statement
The studies involving humans were approved by Ethics Committee of Okayama University. The studies were conducted in accordance with the local legislation and institutional requirements. The participants provided their written informed consent to participate in this study.
Author contributions
MW: Funding acquisition, Writing – original draft. JY: Funding acquisition, Writing – review and editing. YY: Writing – review and editing, Software. QW: Writing – review and editing, Methodology. FW: Methodology, Funding acquisition, Writing – review and editing.
Funding
The author(s) declare that financial support was received for the research and/or publication of this article. This work was supported by the Jilin Scientific and Technological Development Program (YDZJ202301ZYTS418), Scientific Research Project of Jilin Provincial Department of Education (JJKH20240949KJ), and the Natural Science Foundation of Jilin Province of China (20210101413JC).
Acknowledgments
We would like to thank all research participants in this study.
Conflict of interest
The authors declare that the research was conducted in the absence of any commercial or financial relationships that could be construed as a potential conflict of interest.
Generative AI statement
The authors declare that no Generative AI was used in the creation of this manuscript.
Publisher’s note
All claims expressed in this article are solely those of the authors and do not necessarily represent those of their affiliated organizations, or those of the publisher, the editors and the reviewers. Any product that may be evaluated in this article, or claim that may be made by its manufacturer, is not guaranteed or endorsed by the publisher.
References
Baldwin, A., Minnie, F., Reza, F., and Hess, R. (2017). The equivalent internal orientation and position noise for contour integration. Sci. Rep. 7:13048. doi: 10.1038/s41598-017-13244-z
Beck, D., Pinsk, M., and Kastner, S. (2005). Symmetry perception in humans and macaques. Trends Cogn. Sci. 9, 405–406. doi: 10.1016/j.tics.2005.07.002
Bertamini, M., and Makin, A. J. S. (2014). Brain activity in response to visual. Symmetry 6, 975–996. doi: 10.3390/sym6040975
Bertamini, M., Silvanto, J., Norcia, A., Makin, A., and Wagemans, J. (2018). The neural basis of visual symmetry and its role in mid- and high-level visual processing. Ann. N. Y. Acad. Sci. doi: 10.1111/nyas.13667 Online ahead of print.
Carr, J. T., Bertamini, M., Rampone, G., Jones, A., and Makin, A. D. J. (2025). When do we find a third neural response to visual symmetry? Cortex 184, 32–46. doi: 10.1016/j.cortex.2024.11.014
Demeyer, M., and Machilsen, B. (2012). The construction of perceptual grouping displays using GERT. Behav. Methods 44, 439–446. doi: 10.3758/s13428-011-0167-8
Elena, K., Giulia, R., John, T., and Marco, B. (2021). Neural responses to reflection symmetry for shapes defined by binocular disparity, and for shapes perceived as regions of background. Neuropsychologia 163, 108064–108064. doi: 10.1016/j.neuropsychologia.2021.108064
Field, D. (1992). Contour integration by the human visual system: Evidence for a local association field. Vision Res. 33.
Fink, G. R., Halligan, P. W., Marshall, J. C., Frith, C. D., Frackowiak, R. S., and Dolan, R. J. J. B. (1997). Neural mechanisms involved in the processing of global and local aspects of hierarchically organized visual stimuli. Brain 120, 1779–1791. doi: 10.1093/brain/120.10.1779
Francesco, D., Martínez, A., Sereno, M., Pitzalis, S., and Hillyard, S. (2002). Cortical sources of the early components of the visual evoked potential. Hum. Brain Mapp. 15, 95–111. doi: 10.1002/hbm.10010
Gorbunova, E. (2017). Perceptual similarity in visual search for multiple targets. Acta Psychol. 173, 46–54. doi: 10.1016/j.actpsy.2016.11.010
Hess, R., and Field, D. (1999). Integration of contours: New insights. Trends Cong. Sci. 3, 480–486. doi: 10.1016/s1364-6613(99)01410-2
Hu, F., Sinha, D., and Diamond, S. (2024). Perception of wide-expanse symmetric patterns. Vision Res. 223:108455. doi: 10.1016/j.visres.2024.108455
Kourtzi, Z., and Kanwisher, N. (2001). Representation of perceived object shape by the human lateral occipital complex. Science 293, 1506–1509. doi: 10.1126/science.1061133
Kovács, I., Kozma, P., Fehér, A., and Benedek, G. (1999). Late maturation of visual spatial integration in humans. Proc. Natl. Acad. Sci. U S A. 96, 12204–12209. doi: 10.1073/pnas.96.21.12204
Luck, S. J., and Hillyard, S. A. (2010). Electrophysiological correlates of feature analysis during visual search. Psychophysiology 31, 291–308. doi: 10.1111/j.1469-8986.1994.tb02218.x
Mach, E. (1914). The Analysis of Sensations and the Relation of the Physical to the Psychical, Tr. By C.M. Williams. Revised and Supplemented From the 5th Germ. Ed. By S. Waterlow. New York: Legare Street Press.
Machilsen, B., Pauwels, M., and Wagemans, J. (2009). The role of vertical mirror symmetry in visual shape detection. J. Vis. 9, 11.1–11. doi: 10.1167/9.12.11
Makin, A. D. J., Roccato, M., Karakashevska, E., Carr, J. T., and Bertamini, M. (2023). Symmetry perception and psychedelic experience. Symmetry 15:1340. doi: 10.3390/sym15071340
Makin, A. D. J., Tyson-Carr, J., Rampone, G., Morris, A., and Bertamini, M. (2021). Right lateralized alpha desynchronization increases with the proportion of symmetry in the stimulus. Eur. J. Neurosci. 53, 3175–3184. doi: 10.1111/ejn.15176
Mauro, M., and David, W. (2024). Continuity fields enhance visual perception through positive serial dependence. Nat. Rev. Psychol. 3, 352–366. doi: 10.1038/s44159-024-00297-x
Moscoso, A. P., Giovanni, A., Burr, D., Roberto, A., and Elisa, C. (2022). Symmetry as a grouping cue for numerosity perception. Sci. Rep. 12, 14418–14418. doi: 10.1038/s41598-022-18386-3
Moscoso, A., Giuseppe, M., Giovanni, A., Roberto, A., and Elisa, C. (2023). The symmetry-induced numerosity illusion depends on visual attention. Sci. Rep. 13, 12509–12509. doi: 10.1038/s41598-023-39581-w
Murray, M., Foxe, D., Javitt, D., and Foxe, J. (2004). Setting boundaries: Brain dynamics of modal and amodal illusory shape completion in humans. J. Neurosci. 24, 6898–6903. doi: 10.1523/JNEUROSCI.1996-04.2004
Murray, M., Imber, M., Javitt, D., and Foxe, J. (2006). Boundary completion is automatic and dissociable from shape discrimination. J. Neurosci. 26, 12043–12054. doi: 10.1523/JNEUROSCI.3225-06.2006
Palmer, S. E., and Hemenway, K. (1978). Orientation and symmetry: Effects of multiple, rotational, and near symmetries. J. Exp. Psychol. Hum. Percept. Perform. 4, 691–702. doi: 10.1037//0096-1523.4.4.691
Paulraj, S., Schendel, K., Curran, B., Dronkers, N., and Baldo, J. (2018). Role of the left hemisphere in visuospatial working memory. J. Neurolinguistics 48, 133–141. doi: 10.1016/j.jneuroling.2018.04.006
Purves, D. (2024). Understanding visual perception. J. Cogn. Neurosci. 37, 791–801. doi: 10.1162/jocn_a_02292
Rabbito, R., Guiot, C., and Roatta, S. (2023). Functional transcranial doppler (fTCD) investigation of brain lateralization following visual stimuli. Annu. Int. Conf. IEEE Eng. Med. Biol. Soc. 2023, 1–4. doi: 10.1109/EMBC40787.2023.10340934
Sasaki, Y., Vanduffel, W., Knutsen, T., Tyler, C., and Tootell, R. (2005). Symmetry activates extrastriate visual cortex in human and nonhuman primates. Proc. Natl. Acad. Sci. U S A. 102, 3159–3163. doi: 10.1073/pnas.0500319102
Treder, S. (2010). Behind the looking-glass: A review on human symmetry perception. Symmentry 2, 1510–1543. doi: 10.3390/sym2031510
Tyler, C., Baseler, H., Kontsevich, L., Likova, L., Wade, A., and Wandell, B. (2005). Predominantly extra-retinotopic cortical response to pattern symmetry. Neuroimage 24, 306–314. doi: 10.1016/j.neuroimage.2004.09.018
Wang, M., Wu, F., van Tonder, G., Wu, Q., Feng, Y., Yu, Y., et al. (2022). Electrophysiological response to visual symmetry: Effects of the number of symmetry axes. Neurosci. Lett. 770:136393. doi: 10.1016/j.neulet.2021.136393
Keywords: symmetry perception, hemispheric specialization, EEG, neural mechanisms, event-related potentials (ERPs)
Citation: Wang M, Yang J, Yu Y, Wu Q and Wu F (2025) Neural mechanisms of symmetry perception: hemispheric specialization and the impact of noise on reflection symmetry detection. Front. Neurosci. 19:1599112. doi: 10.3389/fnins.2025.1599112
Received: 24 March 2025; Accepted: 25 April 2025;
Published: 14 May 2025.
Edited by:
Zhilin Zhang, Chinese Academy of Sciences (CAS), ChinaReviewed by:
Bin Wang, Taiyuan University of Technology, ChinaShu Yanping, The Second People’s Hospital of Guizhou Province, China
Copyright © 2025 Wang, Yang, Yu, Wu and Wu. This is an open-access article distributed under the terms of the Creative Commons Attribution License (CC BY). The use, distribution or reproduction in other forums is permitted, provided the original author(s) and the copyright owner(s) are credited and that the original publication in this journal is cited, in accordance with accepted academic practice. No use, distribution or reproduction is permitted which does not comply with these terms.
*Correspondence: Fengxia Wu, d3VmZW5neGlhQGN1c3QuZWR1LmNu