 Hanyu Yang
 Lu Wang
 Caixia ZangYue WangJunmei Shang
 Zihong ZhangHui Liu
 Xiuqi Bao
 Xiaoliang Wang
 Dan Zhang*
- State Key Laboratory of Bioactive Substrate and Function of Natural Medicine, Department of Pharmacology, Institute of Materia Medica, Chinese Academy of Medical Sciences and Peking Union Medical College, Beijing, China
A Correction on
Src inhibition attenuates neuroinflammation and protects dopaminergic neurons in Parkinson's disease models
by Yang, H., Wang, L., Zang, C., Wang, Y., Shang, J., Zhang, Z., Liu, H., Bao, X., Wang, X., and Zhang, D. (2020). Front. Neurosci. 14:45. doi: 10.3389/fnins.2020.00045
In the published article, there were errors in Figure 2A and Figure 5A as published. During assembly of Figure 2A by Adobe Illustrator, a technical error occurred where the DAPI channel in the LPS + PP2-20μM group was partially overlapped by the LPS + PP2-2μM image. However, MERGED panels were not affected. We have provided a corrected version with the proper DAPI alignment.
Due to a mistake during the scanning process of brain slices by the CRO company, one image in Figure 5 from the Model group was inadvertently mislabeled as Control, which caused a mistake in Figure 5A when composing the layouts of the figures. We have re-verified all raw data and replaced the incorrect image with the accurate Control image.
The corrected Figure 2, Figure 5 and their captions appear below.
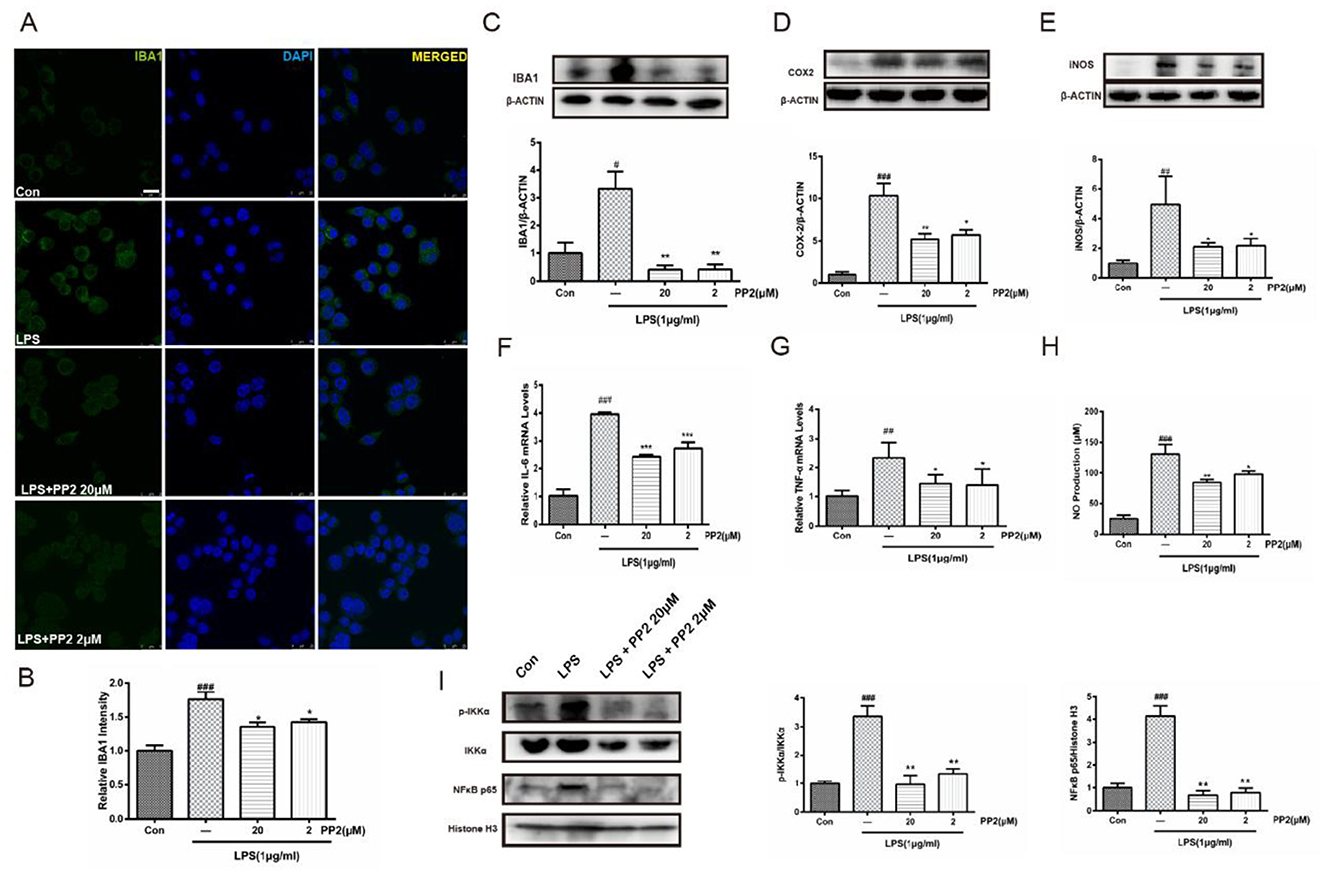
Figure 2. Src inhibition prevented the activation of BV2 microglia and the production of neuroinflammatory molecules subjected to lipopolysaccharide (LPS). (A) Cultured BV2 cells were treated with two concentrations of PP2 (2 and 20 μM) in the presence of LPS (1 μg/ml) for 24 h, and then the cells were stained with anti-IBA1 antibody (green) and DAPI stain (scale bar: 8 μm). (B) Quantification of the IBA1 staining was provided in a histogram. Each bar represents the mean ± SEM. n = 4. ###P < 0.001 vs. control group, *P < 0.05 vs. LPS group. (C) BV2 cells were treated with two concentrations of PP2 (2 and 20 μM) in the presence of LPS (1 μg/ml) for 24 h. The protein level of IBA1 was analyzed by western blot with anti-IBA1 antibody. β-Actin was used as an internal loading control. Each bar represents the mean ± SEM. n = 4. #P < 0.05 vs. control group, **P < 0.01 vs. LPS group. (D, E) The protein level of cyclooxygenase-2 (COX2) and iNOS were examined by western blot. Each bar represents the mean ± SEM. n = 4. ###P < 0.001 and ##P < 0.01 vs. control group, **P < 0.01 and *P < 0.05 vs. LPS group. (F, G) The mRNA levels of IL-6 and TNF-α were analyzed by quantitative reverse transcription (qRT)-PCR. Each bar represents the mean ± SEM. n = 4. ##P < 0.01 and ###P < 0.001 vs. control group, *P < 0.05 and ***P < 0.001 vs. LPS group. (H) The level of NO production was determined using the Griess reaction. Each bar represents the mean ± SEM. n = 5. ###P < 0.001 vs. control group, *P < 0.05 and **P < 0.01 vs. LPS group. (I) The protein expression level of p-IKKα, IKKα, NF-κB p65, and histone H3 were measured by western blot. Each bar represents the mean ± SEM. n = 4. ###P < 0.001 vs. control group, **P < 0.01 vs. LPS group.
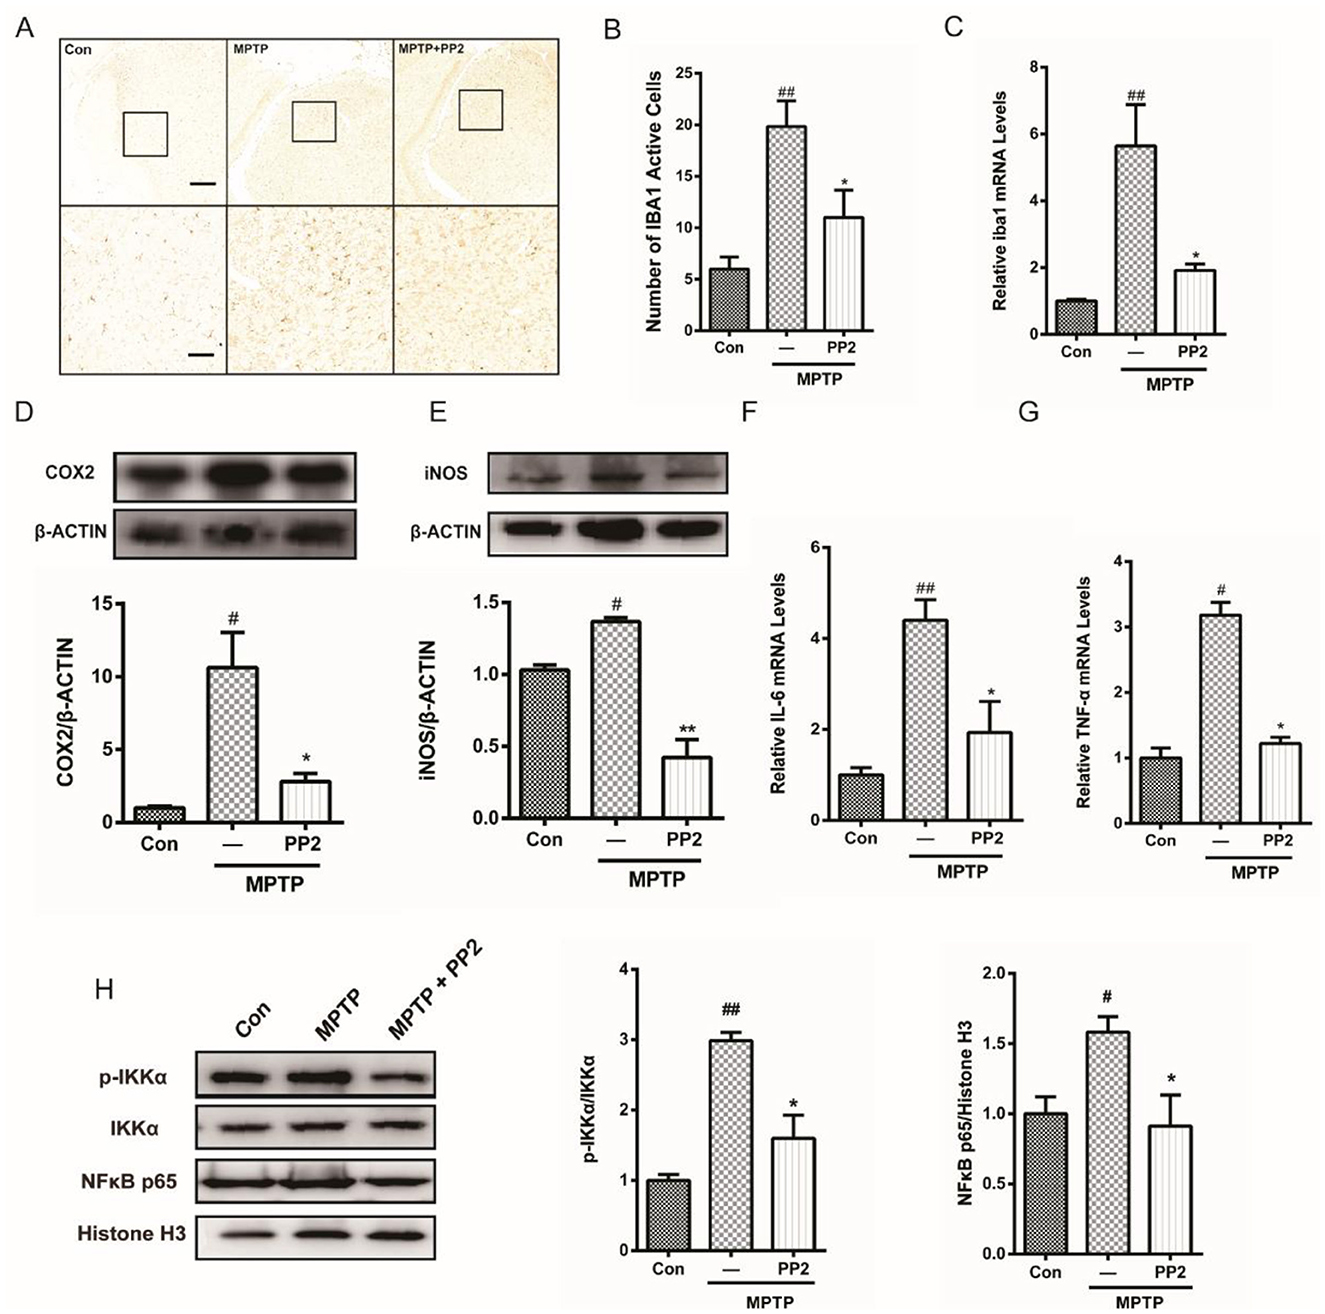
Figure 5. Src inhibition reduced activation of microglial cells and neuroinflammation in 1-methyl-4-phenyl-1,2,3,6-tetrahydropyridine (MPTP)-treated mice. (A) The activation of microglia in SNpc showed by IBA1 immunostaining (scale bar: top, 200 μm; bottom, 50 μm). (B) The number of IBA1-positive cells per 100 cells was counted and provided in a histogram. Data are expressed as means ± SEM. n = 4. ##P < 0.01 vs. control group*P < 0.05 vs. MPTP group. (C) The mRNA expression level of IBA1 in SNpc was determined by quantitative reverse transcription (qRT)-PCR. Data are expressed as means ± SEM. n = 4. ##P < 0.01 vs. control group, *P < 0.05 vs. MPTP group. (D, E) The protein expression level of cyclooxygenase-2 (COX2) and iNOS were determined by western blot with anti-COX2 and anti-iNOS antibodies. Data are expressed as means ± SEM. n = 4. #P < 0.05 vs. control group, *P < 0.05 and **P < 0.01 vs. MPTP group. (F, G) The mRNA expression level of IL-6 and TNF-α was determined by qRT-PCR. Each bar represents the mean ± SEM. n = 4. #P < 0.05 and ##P < 0.01 vs. control group, *P < 0.05 vs. MPTP group. (H) The protein expression level of p-IKKα, IKKα, NF-κB p65, and histone H3 were measured by western blot. Each bar represents the mean ± SEM. n = 4. #P < 0.05 and ##P < 0.01 vs. control group, *P < 0.05 vs. MPTP group.
In the published article, there were errors in the legends for Figures 4B–D, Figures 5B–E, and 6B, C as published. In these legends, “MPTP group” was mistakenly written as “LPS group”. The corrected legends appear below.
Figure 4. The efficiency of Src inhibitor PP2 was confirmed in 1-methyl-4-phenyl-1,2,3,6-tetrahydropyridine (MPTP)-treated mice. (A) The experimental arrangement. (B–D) The protein level of p-Src and Src in SNpc of MPTP-treated mice was analyzed by western blot with anti-p-Src and anti-Src antibodies. Data are expressed as means ± SEM. n = 4. #P < 0.05 vs. control group, ***P < 0.001 vs. MPTP group. (E) The brown stain represented p-Src-immunoreactive cells in SNpc (scale bar: top, 600 μm; bottom, 25 μm). (F) The number of p-Src-positive cells per 100 cells in SNpc was counted and provided in a histogram. Data are expressed as means ± SEM. n = 4. #P < 0.05 and ##P < 0.01 vs. control group, **P < 0.01 and ***P < 0.001 vs. MPTP group.
Figure 5. Src inhibition reduced activation of microglial cells and neuroinflammation in 1-methyl-4-phenyl-1,2,3,6-tetrahydropyridine (MPTP)-treated mice. (A) The activation of microglia in SNpc showed by IBA1 immunostaining (scale bar: top, 200 μm; bottom, 50 μm). (B) The number of IBA1-positive cells per 100 cells was counted and provided in a histogram. Data are expressed as means ± SEM. n = 4. ##P < 0.01 vs. control group, *P < 0.05 vs. MPTP group. (C) The mRNA expression level of IBA1 in SNpc was determined by quantitative reverse transcription (qRT)-PCR. Data are expressed as means ± SEM. n = 4. ##P < 0.01 vs. control group, *P < 0.05 vs. MPTP group. (D, E) The protein expression level of cyclooxygenase-2 (COX2) and iNOS were determined by western blot with anti-COX2 and anti-iNOS antibodies. Data are expressed as means ± SEM. n = 4. #P < 0.05 vs. control group, *P < 0.05 and **P < 0.01 vs. MPTP group. (F, G) The mRNA expression level of IL-6 and TNF-α was determined by qRT-PCR. Each bar represents the mean ± SEM. n = 4. #P < 0.05 and ##P < 0.01 vs. control group, *P < 0.05 vs. MPTP group. (H) The protein expression level of p-IKKα, IKKα, NF-κB p65, and histone H3 were measured by western blot. Each bar represents the mean ± SEM. n = 4. #P < 0.05 and ##P < 0.01 vs. control group, *P < 0.05 vs. MPTP group.
Figure 6. Src inhibition enhanced the survival of dopaminergic neurons of the 1-methyl-4-phenyl-1,2,3,6-tetrahydropyridine (MPTP)-treated mice. (A) Representative images showed tyrosine hydroxylase (TH)-immunoreactive neurons in the SNpc (scale bar: top, 500 μm; bottom, 250 μm). (B) The number of TH-positive neurons per slide in SNpc was counted for each section and provided in a histogram. Data are expressed as means ± SEM. n = 4. #P < 0.05 vs. control group, *P < 0.05 vs. MPTP group. (C) The protein expression level of TH in SNpc of MPTP-treated mice was analyzed by western blot. Data are expressed as means ± SEM. n = 4. #P < 0.05 vs. control group, *P < 0.05 vs. MPTP group. (D) The mRNA expression level of TH in SNpc of MPTP-treated mice was determined by quantitative reverse transcription (qRT)-PCR. Data are expressed as means ± SEM. n = 4. ###P < 0.001 vs. control group, *P < 0.05 vs. MPTP group.
The original version of this article has been updated.
Generative AI statement
Any alternative text (alt text) provided alongside figures in this article has been generated by Frontiers with the support of artificial intelligence and reasonable efforts have been made to ensure accuracy, including review by the authors wherever possible. If you identify any issues, please contact us.
Publisher's note
All claims expressed in this article are solely those of the authors and do not necessarily represent those of their affiliated organizations, or those of the publisher, the editors and the reviewers. Any product that may be evaluated in this article, or claim that may be made by its manufacturer, is not guaranteed or endorsed by the publisher.
Keywords: Src, microglia, neuroinflammation, Parkinson's disease, neuroprotection
Citation: Yang H, Wang L, Zang C, Wang Y, Shang J, Zhang Z, Liu H, Bao X, Wang X and Zhang D (2025) Correction: Src inhibition attenuates neuroinflammation and protects dopaminergic neurons in Parkinson's disease models. Front. Neurosci. 19:1640774. doi: 10.3389/fnins.2025.1640774
Received: 04 June 2025; Accepted: 17 September 2025;
Published: 29 September 2025.
Edited and reviewed by: Mark P. Burns, Georgetown University, United States
Copyright © 2025 Yang, Wang, Zang, Wang, Shang, Zhang, Liu, Bao, Wang and Zhang. This is an open-access article distributed under the terms of the Creative Commons Attribution License (CC BY). The use, distribution or reproduction in other forums is permitted, provided the original author(s) and the copyright owner(s) are credited and that the original publication in this journal is cited, in accordance with accepted academic practice. No use, distribution or reproduction is permitted which does not comply with these terms.
*Correspondence: Dan Zhang, ZGFuemhhbmdAaW1tLmFjLmNu