Abstract
Introduction:
The mangrove ecosystems are crucial marine ecosystems, providing various ecological and economic benefits to local communities. This study aims to analyze the influence of household socio-economic profiles on mangrove ecosystems resources in Benin.
Methods:
Based on semi-structured interviews, 464 households were surveyed in 73 localities. The Specific Multiple Correspondence Analysis (spMCA) combined with Hierarchical Ascendant Classification (HAC) was used to analyze the socio-economics, demographics, and environmental data collected. The priority scores of the surveyed households were used to perform the influence of households to mangrove resources by coupling HAC to Principal Component Analysis (PCA).
Results:
Five household categories (labeled CM1–CM5) were identified. They represent varying levels of vulnerability, access to resources, and modes of mangrove resource use. The household of CM1 are highly dependent on mangrove resources and distributed proportionally across the study sub-sectors whereas the CM5 household are the most vulnerable, located around the biosphere reserve, and facing land tenure insecurity, extreme poverty, and significant pressure on mangrove ecosystems. The household categories are strongly influenced by the dependency on biosphere reserve resources and sociolinguistic affiliation. The gender and education level play a secondary role on household categories structuring. Five groups of pressure factors on the mangroves were associated with the different household categories. Salt farming, wood cutting, and backfilling of waterways are predominant for CM1, CM2, CM3, and CM5. Land overexploitation, depletion of fishery resources, and climatic factors are the mainly determinants for CM4 and CM5. Land conflicts and declining agricultural yields are also mentioned by CM5.
Conclusion:
These results highlight the need for differentiated mangrove management strategies, tailored to the specific socio-economic characteristics of the households. Co-management, reforestation, and awareness-raising activities, represent strategic targets for sustainable conservation policies. Also, specific support measures, including the development of sustainable economic alternatives and improved access to basic services are needed. Taking this typology into account would improve the effectiveness and equity of environmental policies related to mangrove management.
1 Introduction
Mangrove ecosystems are in tropical and subtropical coastal zones worldwide (Ho and Mukul, 2021). It is widely accepted that these forests are crucial in maintaining biodiversity, providing essential goods and services (Duke and Schmitt, 2015), and protecting coastal areas in West Africa (Teka et al., 2018). Recent studies have provided scientific evidence of the contribution of these forests to improving energy efficiency, for example, by providing low-cost firewood for local households (Adanguidi et al., 2020), enhancing agricultural productivity by supplying nutrients and forage for livestock and crops (Ahouangan et al., 2022; Mohammad Abdullah et al., 2016; Ameen and Al-Homaidan, 2021). These ecosystems thus play an essential role in reducing community vulnerability to natural disasters and economic crises (Begum et al., 2021). On a global scale, the collective economic value of mangrove ecosystem services has been estimated at 1,940 USD per km2 per year, giving a global value of 2,700 billion USD per year (Barbier, 2016). Among these services, carbon storage plays a major role. Around 11.5 billion tons of carbon are stored by blue carbon ecosystems, with mangroves representing the largest reservoir at 6.5 billion tons (Siikamäki et al., 2013).
The economic values of mangroves vary according to regional contexts, reflecting local ecological and socio-economic specificities. In West Africa, mangroves produce ecosystem services worth between 300 million and 1.35 billion USD every year (Spalding et al., 2010). For example, in Benin, a recent study identified 29 ecosystem services (ES), with regulating and recreational services as the main contributors to the total annual economic value (vet), estimated at 1.29 billion USD, or 195,223.69 USD/hectare (Sinsin et al., 2023). Carbon sequestration potential is also a significant source of income. In the Djilor region of Senegal, mangrove stands have shown an average value of 24.70 tons of carbon per hectare. This carbon stock is associated with an economic value of 2.38 billion F CFA, likely to be valued on carbon markets as additional income in the context of poverty reduction initiatives (Gomis et al., 2023).
In Asia, the Sundarbans mangroves provide a diversity of services (fishing, honey, crab, fuelwood, timber, and tourism), supporting around 20 million inhabitants (Uddin et al., 2013). In Egypt, the value of ecotourism in mangroves reaches up to 130.000 USD per hectare per year (Spurgeon, 2002). On a national or local scale, some specific assessments highlight the direct contribution of mangroves to meeting energy needs. In Ghana, the economic value of mangroves as a source of fuelwood has been estimated at 2.765 USD/ha (Ajonina et al., 2014).
Mangroves act as effective carbon sinks, capturing carbon dioxide from the atmosphere and storing it in their soil, plants, and other sediments, thus contributing to climate change mitigation (Kauffman et al., 2020). In Benin, mangroves play a crucial role in the livelihoods of local communities by providing essential resources such as firewood, construction wood, and fishery products such as fish and shellfish (Daïnou et al., 2008; Orekan et al., 2019). Despite the foregoing crucial role of mangrove ecosystems, there has been a significant deterioration of these resources in recent decades, mainly due to anthropogenic pressures. Between 1986 and 2022, the area of mangroves in Benin decreased from 5117.2 to 3052.4 ha, with an estimated loss of 40.30% (Kochoni et al., 2025).
As reported by Padonou et al. (2021), the area covered by West African mangroves has decreased significantly, approximately by 30%, over the past 25 years. In Benin Republic, a country situated on the Atlantic coast of northwest Africa, mangrove ecosystems are experiencing considerable strain as a result of overexploitation, increasing human population, and rural expansion (Teka et al., 2018). The intensive fishing and unregulated collection of shellfish and mollusks have compromised the reproduction of aquatic species, jeopardizing the sustainability of local economic activities in the country (Gnansounou et al., 2022). The expansion of agriculture and uncontrolled urbanization also contribute to the deforestation of mangroves, converting these areas into rice fields, salt farms, or residential spaces (Orekan et al., 2019; Agoungbome et al., 2020). In addition to the anthropogenic pressures, climate change is affecting the natural regeneration of mangrove ecosystems by altering water salinity, causing sea-level rise, and intensifying coastal erosion. Unfortunately, climate changes are anticipated to significantly affect the mangrove ecosystems in the country (Sinsin, 2021; Teka et al., 2018). The overexploitation of current mangrove ecosystems, combined with anticipated climate change, may increase the vulnerability of local communities and affect their means of living, as many coastal inhabitants in the country rely on these forests for their basic needs and income.
In many countries in Africa, mangrove ecosystems decline as a result of human and climate interferences have serious implications for the means of living of the local communities (Aheto et al., 2016). As argued by Ntibona et al. (2022), there is a fundamental link between the means of living of the local communities and the advanced degradation of mangrove forests. In Tanzania, for instance, mangrove ecosystem degradation is associated with socioeconomic factors such as the residence time of household, household size, and household main occupation (Nyangoko et al., 2022). The understanding of the influence of the socioeconomic profile of households has reduced income inequality in Sundarbans, Bangladesh (Mohammad Abdullah et al., 2016) and enhanced the active participation of local communities in conserving resources and improving their livelihood (Nchimbi and Lyimo, 2019) in Zanzibar, and enriched policy knowledge on the interaction between local communities and mangrove ecosystems in the Pangani River Estuary in Tanzania (Nyangoko et al., 2022). In Benin Republic, where mangrove ecosystems are not exempted from anthropogenic pressures, the understanding of the socio-economic factors influencing the use and management of mangrove resources remains insufficiently studied. This study aims to identify the socioeconomic and demographic profile of households influencing their use of mangrove resources.
2 Material and methods
2.1 Study area
The Benin coastline (6°10′-6°40′N and 1°40′-2°45′E) covers 8,692 km2, i.e. 7.70% of the national territory (Orekan et al., 2019). It is located in the Guineo-Congolese zone. The climate is sub-tropical with a bimodal precipitation distribution. The mean annual rainfall and temperature recorded were 1,300 mm and 33°C, respectively (Oyede et al., 2022). Soils are mainly undeveloped soils, vertisols, tropical ferruginous soils, hydromorphic soils and ferralitic soils. The density of population was estimated to 230 inhabitants/km2. Mangrove ecosystems, which are found along the coast, are not exempted from such anthropogenic pressures (Teka et al., 2018). This high density puts heavy pressure on coastal natural resources, particularly mangrove swamps. Moreover, the coastline represents the economic hub of the Benin Republic, bringing together a diverse group of people living and sustaining their livelihoods through agriculture, fishing, and salt farming (Plaiphum and Tansuchat, 2022) (Figure 1).
Figure 1

Map of the study area showing the study site and the localities where the survey took place.
2.2 Sampling process for the household survey
In southern Benin, mangrove ecosystems extend across 35 districts and 12 municipalities. These districts are further subdivided into 1,855 localities, including 828 hamlets, 179 villages, and 857 neighborhoods (INSAE, 2015). Moreover, the geographical coordinates of each locality (hamlet, neighborhood, and village) were extracted from the geospatial database of the Benin National Geographical Institut (IGN).
2.2.1 Mangrove ecosystems boundaries delineation
The data published by Giri et al. (2010) were combined with current mangrove occurrence data and Google Earth images to delineate mangrove ecosystems using photogrammetric analysis.
2.2.2 Selection of surveyed localities
The selection of surveyed localities was conducted through successive filtering based on their proximity to mangrove ecosystems. The fundamental assumption was that local communities located closer to mangroves exert a more direct influence on its resources. To assess proximity, haversian method was used. This enabled us to estimate the geographical distance of each locality from the mangrove ecosystems (Karney, 2013). The discretization method base on quantile was used to categorize this geographical distance. The distance threshold used to select localities is the first quartile (Q25%). Thus, 481 localities (203 hamlets, 58 villages, and 220 urban districts) with a distance less than or equal to the first quartile (Q25% = 971.50 m) were initially selected. Subsequently, the value of Q25% was rounded to 1,000 m for further analysis. Buffer zone of 1 km created around the mangrove ecosystems. Tessellation process was applied to mesh the entire mangrove ecosystems with 1 km grids. The number of localities per grid was calculated, and the density of localities was estimated per square kilometer. A second filtering step was performed base on the fact that “the density of localities must be one per square kilometer.” To this, the discretization method base on quantile was again used. Only localities within the first quartile (Q25% = 315 m) of proximity to the mangrove ecosystems were retained. Thus, 121 localities (57 hamlets, 19 villages, and 45 districts) were selected. These localities were grouped into 87 plot units (1 km2 grid cells). In each plot, the locality closest to the mangrove ecosystems was selected to ensure one locality per square kilometer. This process ultimately resulted in 73 selected localities for socio-economic surveys. These selected localities are distributed across 53 administrative villages.
2.2.3 Determination of sample size
The households considered in this study are those whose activities have a direct or indirect impact on mangrove ecosystems. Households were selected from the identified localities using a simple random sampling technique. The 73 selected localities are distributed across 53 administrative villages, which are home to a total of 2,512 farming households (INSAE, 2015). Among these, 1,003 farm households were noted in the selected localities, representing 39.93% of the total farm households in the studied villages. To determine the sample size (na) of farm households to be surveyed, the formula of Dagnelie (1998) was applied, assuming a normally distributed population. The proportion (p) of farm households in the selected localities was associated with a margin of error (d) of 5%, resulting in an estimated sample size of 383,775 ≈ 384 farm households. After adjusting for proportional weighting and rounding, the final number of surveyed farm households was set at 417. The number (na) of households surveyed was calculated as follows:
(for α = 0.05); p: proportion of households surveyed; d: marginal error set at 0.05.
2.3 Data collection
2.3.1 Household interviews
The semi-structured interviews were conducted from January to March 2024 using the KoboCollect digital tool (KoBoToolbox, 2023). A total of 464 head of households were interviewed trough the localities selected in the study area. The head of household is described as “individual male or female who is in charge of the main decision-making regarding the household” (Pol et al., 2004). For each household considered in this research, we interviewed the head or the representative using a questionnaire developed in French and discussed in four local languages, Fon, Goun, Adja, and Xweda. A local young translator was recruited in the study area to assist in translating the questionnaire to the participants. Prior to the interview, we explained the study objective to the participants, and oral consent was given before their participation. The information collected included the demographic, socio-economic and environment characteristics of households the; the activities carried out by the households; the financial trends and economic interactions of the households. This information was specifically aimed for better understanding the profile of households, the influence of household structuring factors and the socio-environmental determinants.
2.3.2 Direct observation
It consists of geographic coordinates of the households recording, photos illustrating the pressures on the mangroves and the survey of agricultural plots based on the declarations of the respondents.
2.4 Data analysis
2.4.1 Household typology and description
2.4.1.1 Household typology
The household typology was based on 29 variables (12 quantitative and 17 qualitative variables) covering several characteristics, including demographic, socio-economic, production and proximity factors. Due to the high skewness displayed by the distribution of 85% of the quantitative variables, a discretization was performed on each of them using Jenk's method (Jenks, 1967). This analysis made it possible to transform these variables into ordinal qualitative variables in order to fully integrate them into the household typification process. A specific multiple correspondence analysis (spMCA) (Robette, 2023) was performed on the matrix formed by the households and the preceding factors. The MCA was then coupled with a Hierarchical Ascending Classification (HAC) to better categorize the households into the homogeneous groups. Several factorial maps were created using the most relevant factors. For this study, these factors are those with a correlation ratio of at least 25% with the factor axes. The coefficient of information conservation (R2) was used to assess the explanatory power of the HAC.
2.4.1.2 Descriptive analysis
To compare quantitative variables across different household categories, the median test with multiple comparison (Conover, 1999) was used at 5% significance level. This test was selected to handle the skewness and the existence of outliers in these variables' distribution. To test dependency between qualitative variables and household categories, the Fisher exact test (Agresti, 2002) was used with a Monte Carlo simulation (10,000 iterations) at 5%.
2.4.2. Influence of structuring factors on households' distribution
2.4.2.1 Influential structuring factors
To identify these factors, ellipses centered on mean point and encompassing 86% of households of their modalities were constructed. The typicality test enabled the identification of modalities that have a significant effect on the organization of households (Le Roux and Rouanet, 2004). A modality—mean point of household's distribution—is considered atypical when this test presents a low combinatorial probability at 5% significant level. Following this, the homogeneity test was performed to determine the independence of household subgroups. Two household subgroups represented by two different modalities are distinct when the probability values of the test are closed to zero at 5%.
2.4.2.2 Structuring factors relationship
The relationship between structuring factors and household categories was tested using Fisher's exact test at 5% level. The intensity of this relationship was apprehended and tested on the basis of Cramer's V statistic. Interpretation of V values followed Lovakov and Agadullina (2021).
2.4.3 Analysis of socio-environmental determinants
To categorize socio-environmental determinants that affect the integrity of mangrove ecosystems, a Hierarchical Ascending Classification (HAC) was performed using Euclidean distance and Ward method (Ward, 1963). It was based on the priority scores matrix of the surveyed households. The information conservation coefficient (R2) was used to assess the quality of this classification.
To describe the homogeneous classes of determinant derived from the CAH, a Principal Component Analysis (PCA) was performed with the household categories. These classes of determinant were then projected onto the PCA axis system. The first two components were chosen for their ability to account for most of the variance contained in the score matrix.
All these analyses were performed in R 4.4.1 (R Core Team, 2024; https://cran.r-project.org/bin/windows/base/old/4.4.1/).
3 Results
3.1 Household typology around mangrove ecosystems
3.1.1 Relationship of households' characteristics and factorial axis
The first two axes of the spMCA explained 93.55% (Axis 1: 73.97%; Axis 2: 19.58%) of the variations in the socio-economic and demographic characteristics of households surrounding mangrove ecosystems (Figure 2). The variables with highest correlation ratio (eta2) on axis 1 are Total value of goods owned (TVG), Total plot area (TPA), Total energy expenditure (TEE), Member of a professional farmers' organization (MFO), Location of household plots reported to mangrove ecosystems (LHP) and Effects of activities on mangrove ecosystems (EAME) while those with highest correlations on axis 2 are Household size (HZ), Average annual income (AAI), and Age of household decision-maker (AGE) (Figure 3, Supplementary Table 3).
Figure 2

Scatterplot of socioeconomic and demographic characteristics of households in the factorial space (1–2). Age, AGE; AAI, average annual income; TPA, land area owned; TEE, total energy expenditure; TVG, total value of goods owned; HZ, household size; MFO, member of a professional farmers' organization; EAME, effects of activities on mangrove ecosystems; AMCE, activities with mixed or complex effects; ADE, activities with direct effects; AIE, activities with indirect effects; LHP, location of household plots reported to mangrove ecosystems.
Figure 3

Correlation ratios of the relationships between households' characteristics and factorial axis 1–2.
The correlation values of the variables' modalities are ranged from −0.777 and 0.777 (p = 0.000) on axis 1. The modalities MFO.YES, TEE.0-4, EAME.ADE, LHP.YES, TPA.1.3–3.4, and TVG.160–400 have a strong positive and significant correlation (p = 0.000) with axis 1. However, the modalities MFO.NO, EAME.AMCE, LHP.NO, TPA.0-1.3, and TVG.0.15–160 show a strong negative and significant correlation (p = 0.000) with axis 1 (ADE, activities with direct effects; AMCE, activities with mixed or complex effects; Table 1). These different modalities contribute 88.92% to the formation of axis 1. Modalities on the positive side of the axis contributed to 53.26%, while those on the negative side contributed to 35.66%. The modalities as a whole account for 66.82%−100% of the information contained in the variables from which they are derived. The loss of information relative to their deviation on the axis is very low (0%−1.06%). The variables MFO, LHP, TVG, EAME and TPA have a very high contribution to the formation of the axis (85%−100%). The contributions of TEE and AAI are also above 50% (Table 2).
Table 1
| Variable | Modality | Factorial axis 1 | Factorial axis 2 | ||
|---|---|---|---|---|---|
| cor | p | cor | p | ||
| MFO | YES | 0.777 | 0.0000 | 0.007 | 0.2000 |
| NO | −0.777 | 0.0000 | −0.007 | 0.3000 | |
| TEE | 0–4 | 0.715 | 0.0000 | 0.357 | 0.0000 |
| Avr−13 | −0.409 | 0.0000 | 0.07 | 0.0000 | |
| 13–26 | −0.232 | 0.0000 | −0.142 | 0.0000 | |
| 26–60 | −0.215 | 0.0000 | −0.499 | 0.0000 | |
| EAME | ADE | 0.637 | 0.0000 | −0.054 | 0.1000 |
| AMCE | −0.61 | 0.0000 | 0.18 | 0.0000 | |
| AIE | −0.087 | 0.0000 | −0.176 | 0.0000 | |
| LHP | YES | 0.584 | 0.0000 | −0.459 | 0.0000 |
| NO | −0.584 | 0.0000 | 0.459 | 0.0000 | |
| TPA | 0–1.3 | −0.591 | 0.0000 | 0.355 | 0.0000 |
| 1.3–3.4 | 0.545 | 0.0000 | −0.117 | 0.0000 | |
| 3.4–8.1 | 0.206 | 0.0000 | −0.239 | 0.0000 | |
| 8.1–20.1 | −0.079 | 0.0000 | −0.414 | 0.0000 | |
| TVG | 0.15–160 | −0.738 | 0.0000 | −0.191 | 0.0000 |
| 160–400 | 0.539 | 0.0000 | 0.276 | 0.0000 | |
| 400–800 | 0.411 | 0.0000 | −0.052 | 0.0000 | |
| 800–1,600 | 0.042 | 0.0000 | −0.112 | 0.0000 | |
| AAI | 2.5–40 | 0.425 | 0.0000 | 0.642 | 0.0000 |
| 40–125 | −0.429 | 0.0000 | −0.494 | 0.0000 | |
| 125–350 | −0.047 | 0.3000 | −0.302 | 0.0000 | |
| 350–700 | 0.022 | 0.2000 | −0.147 | 0.0000 | |
| HZ | 01–avr | −0.223 | 0.0000 | 0.566 | 0.0000 |
| 04–juil | 0.239 | 0.0000 | −0.124 | 0.0000 | |
| 07–nov | −0.048 | 0.2000 | −0.403 | 0.0000 | |
| ≥11 | 0.03 | 0.2000 | −0.225 | 0.0000 | |
| AGE | 25–32 | −0.257 | 0.0000 | 0.502 | 0.0000 |
| 32–43 | 0.113 | 0.0000 | 0.075 | 0.1000 | |
| 43–56 | 0.165 | 0.0000 | −0.112 | 0.1000 | |
| 56–79 | −0.048 | 0.2000 | −0.447 | 0.0000 | |
Correlation of the modalities of structuring factors on factorial axis 1 and 2.
cor, correlation coefficient; p, significance probability.
Table 2
| Variable | Modality | Quality of representation | Contribution (left) | Contribution (right) | Total contribution | Cumulative contribution | Contribution to deviation | Proportion of variable |
|---|---|---|---|---|---|---|---|---|
| Axis factorial 1 | ||||||||
| MFO | YES | 0.604 | – | 13.53 | 18.85 | 18.85 | 18.85 | 100.00 |
| NO | 0.604 | 5.32 | – | |||||
| TVG | 0.15–160 | 0.545 | 5.97 | – | 17.60 | 36.45 | 17.21 | 97.50 |
| 160–400 | 0.291 | – | 6.79 | |||||
| 400–800 | 0.169 | – | 4.84 | |||||
| EAME | ADE | 0.405 | – | 5.89 | 13.54 | 49.99 | 13.51 | 98.29 |
| AMCE | 0.372 | 7.65 | – | |||||
| TEE | 0–4 | 0.512 | – | 9.87 | 13.38 | 63.37 | 12.32 | 76.84 |
| avr−13 | 0.167 | 3.51 | – | |||||
| TPA | 0–1.3 | 0.350 | 3.69 | – | 10.79 | 74.16 | 10.70 | 87.85 |
| 1.3–3.4 | 0.297 | – | 7.09 | |||||
| LHP | YES | 0.341 | – | 5.25 | 10.64 | 84.80 | 10.64 | 100.00 |
| NO | 0.341 | 5.39 | – | |||||
| AAI | 40–125 | 0.184 | 4.12 | – | 4.12 | 88.92 | 4.12 | 66.82 |
| Axis factorial 2 | ||||||||
| AAI | 2.5–40 | 0.412 | – | 6.74 | 18.96 | 18.96 | 18.57 | 93.05 |
| 40–125 | 0.244 | 8.20 | – | |||||
| 125–350 | 0.091 | 4.02 | – | |||||
| AGE | 25–32 | 0.252 | – | 9.33 | 16.54 | 35.50 | 16.51 | 96.25 |
| 56–79 | 0.200 | 7.22 | – | |||||
| HZ | 01–avr | 0.321 | – | 10.07 | 16.14 | 51.64 | 15.16 | 80.50 |
| 07–nov | 0.162 | 6.07 | – | |||||
| TEE | 0–4 | 0.127 | – | 3.68 | 14.16 | 65.80 | 14.11 | 93.59 |
| 26–60 | 0.249 | 10.48 | – | |||||
| LHP | YES | 0.210 | 4.86 | – | 9.85 | 75.65 | 9.85 | 100.00 |
| NO | 0.210 | – | 4.99 | |||||
| TPA | 8.1–20.1 | 0.171 | 7.91 | – | 7.91 | 83.56 | 7.91 | 61.65 |
Contribution of the modalities to the formation of the first two factorial axes.
The correlation values of the variables' modalities are ranged from −0.499 and 0.642 (p = 0.000) on axis 2. The modalities AAI.2.5-40, HZ.1-4, and AGE.25-32 show a strong positive and significant correlation with axis 2. However, the modalities TEE.26-60, AAI.40-125, AGE.56-79, TPA.8.1-20.1, and HZ.7-11 have a moderate negative correlation with axis 2 (Table 1). These modalities with a moderate to strong correlation with axis 2 contribute 83.56% to the formation of the latter. The contribution of modalities located on the positive side of the axis is estimated at 48.76%, while that of modalities located on the negative side of the axis is 34.80%. On this axis, these modalities account for 61.65%−100% of the information contained in the variables from which they are derived. The loss of information relative to their deviation on the axis is also very low (0%−0.98%). Variables such as LHP, AGE, TEE, AAI, and HZ contribute strongly to the formation of axis 2 (80%−100%). However, the contribution of TPA is over 60% (Table 2).
3.1.2 Description of the category of households around mangrove ecosystems
The combination of specific Multiple Correspondence Analysis (spMCA) and Hierarchical Ascending Classification (HAC) enabled us to group households into five main categories (Figures 4, 5). The dendrogram obtained from HAC shows the homogeneous clusters, represented by colored branches. Each category (cluster) was associated to one color which is the same on the Figures 4, 5. The total variance retained when grouped households into five categories was estimated to 79.39% (pseudo-R2). This classification helps synthesize the profiles of the households in the study area.
Figure 4
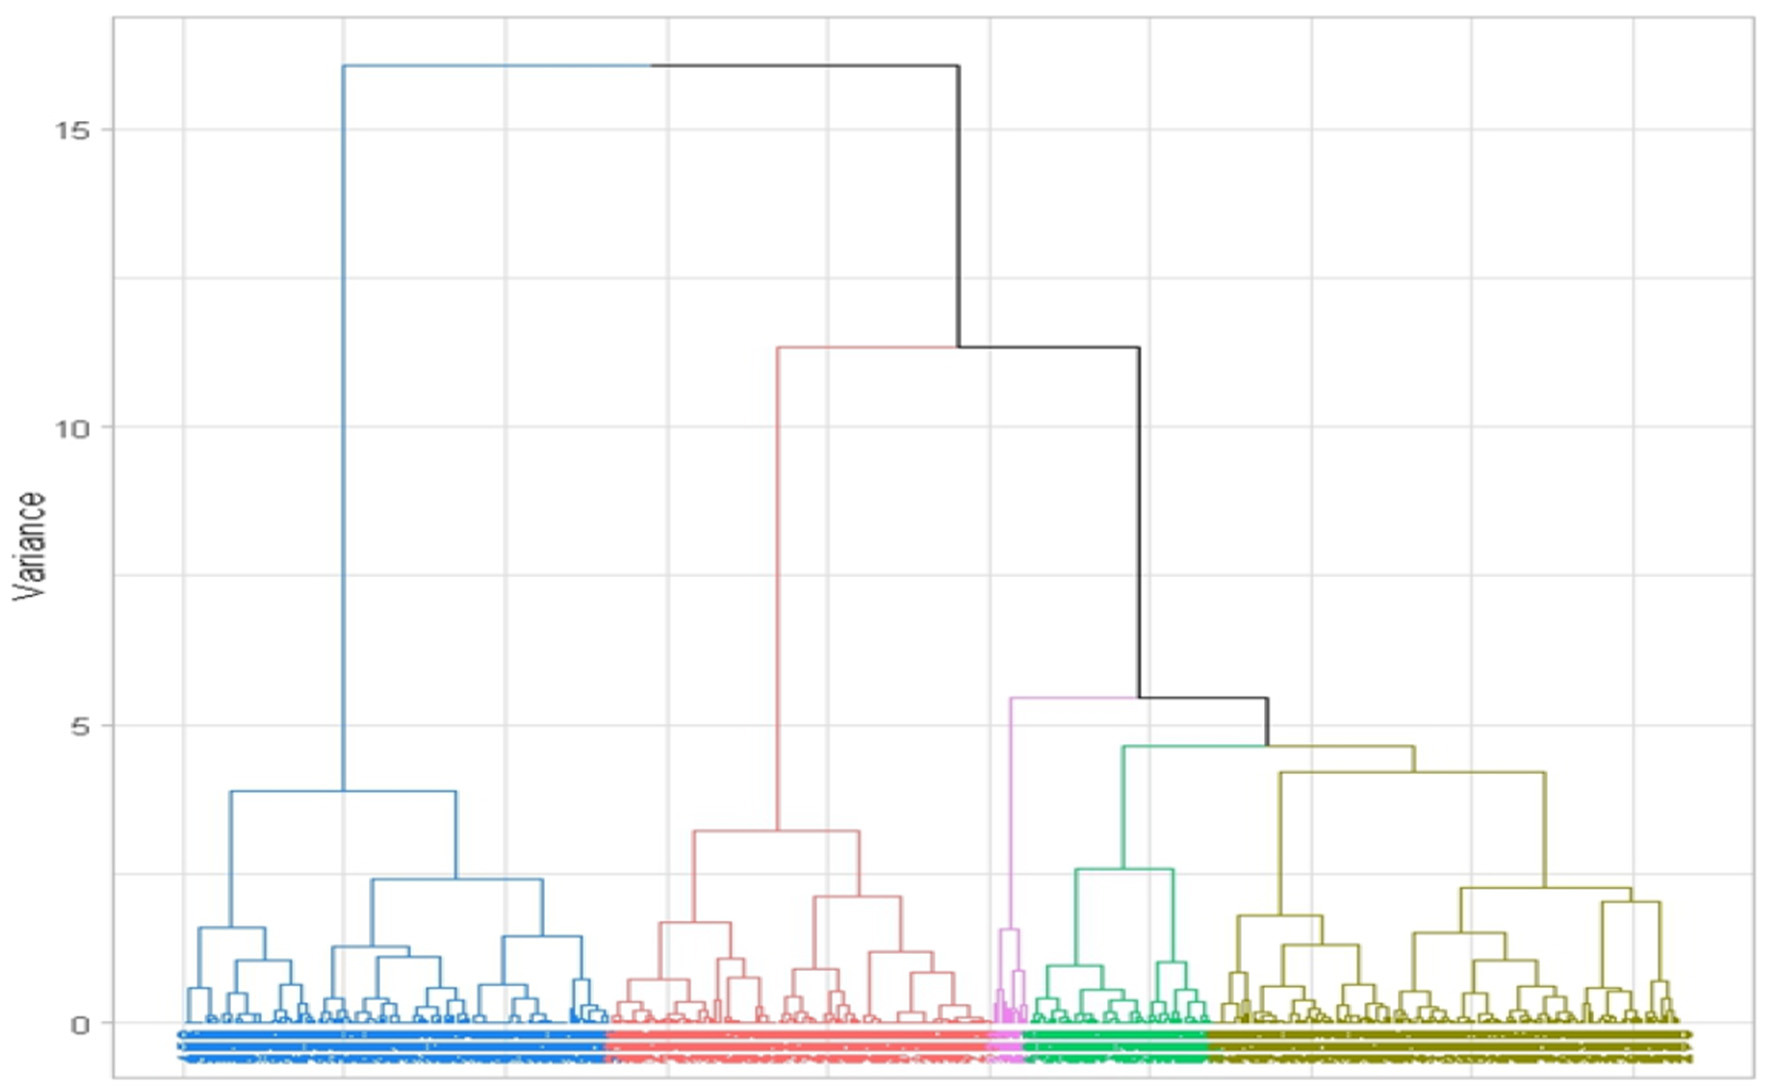
Dendrogram of the ascending hierarchical classification of the five household categories.
Figure 5

Distribution of household categories in the factorial plane 1–2. Each dot represents a household.
The five categories of households (CM) were identified and labeled 1–5 on the Figure 5. For description, these categories of households were labeled as CM1, CM2, CM3, CM4, and CM5. The category of households (CM4) is positively related to axis 1, and opposed to the other four categories on this axis (Figure 5). The category of households (CM1) is opposed to CM5, positioned in the negative part of axis 2. The category of households (CM3) is almost at the center of the factorial plane 1–2. The category of households (CM2) is relatively close to the center of the plane, and opposed to CM1 on axis 2. There is significant socio-economic and socio-demographic diversity among these groups, especially regarding AGE (age), household size (HZ), average annual income (AAI), total value of goods owned (TVG), total energy expenditure (TEE), and total plot area (TPA).
The category CM1, which accounts for 25.65% of households, includes small families with modest earnings and a minimal impact on mangrove ecosystems. The category CM2, representing 31.25% of households, consists of larger families and older heads of households and shows a direct impact on mangrove ecosystems, along with higher incomes. The category CM3, comprising 12.28% of households, has moderate earnings and a mixed impact on mangrove ecosystems. The category CM4, encompassing 28.45% of households, is defined by larger household sizes, significant engagement in mangrove management, and steady incomes. Lastly, the category CM5, the smallest group at 2.37%, is made up of large, elderly families with a considerable direct impact on mangrove ecosystems and notably higher incomes. The categories CM1 (25.65%) and CM3 (12.28%) have a minimal impact on mangrove ecosystems due to their low economic reliance on the ecosystems. Yet, the category CM3 has a lower annual income compared to CM1. Conversely, the categories CM2 and CM4, representing nearly 60% of households, put direct pressure on mangroves through their activities, despite often having modest incomes, particularly in the case of the category CM4. Although not widely represented (2.37%), the category CM5 achieves higher income levels through more intensive exploitation of mangrove resources, resulting in a significant ecological impact.
The description of household's categories by the original variables revealed that the quantitative variables selected show a statistically significant difference between household categories at 5% level (Supplementary Table 4). As for the qualitative variables, they all show a statistically significant dependence on household categories. The intensity of this relationship is strong with the MFO and LHP variables, but moderate with the EAEM.
3.2 Influence of structuring factors on household categories
Four potentially structuring factors were used in the analysis: sector, sociolinguistic group (SLG), gender, and education level (LOE). Figure 6 shows the relationship between these structuring factors and the factorial plane. The sector and GSL are related to both factorial axes, with their categories generally distributed across the northeast and southeast quadrants. In contrast, gender and education level are more closely associated with axis 2 than with Axis 1. Regarding gender, women are positioned in the upper part of the plane, while men are located in the lower part. As for education level, individuals with no formal education are situated at the origin of the plane, progressing toward those with a university-level education as one moves toward the positive side of axis 2.
Figure 6

Distribution of structuring factors in factorial plane 1–2. SLG, Sociolinguistic groups; AdEA, Adja and related groups; GoEA, Goun and related groups; FoEA, Fon and related groups; YoEA, Yoruba and related groups; NRB, Non-Biosphere Reserve; RBVO, Biosphere reserve of lower “Ouémé” Valley; RBM, Biosphere reserve of mono; LOE, Level of education.
The sector strongly associated with axis 1, explains 41.30% of household coordinates variance. It is followed by the SLG, which explained 21.70% of household coordinates variance. The Gender and LOE factors weakly associated with axis 1, explain respectively 3 and 2.40% of household coordinates variance. On axis 2, the percentage of household coordinates variance explained by the SLG is 32.70%, compared with 30.30% for the sector factor. The Gender and LOE factors are always very weakly associated with axis 2, and explained respectively 4.30 and 3.60% of household coordinates variance. The correlation of modalities with factorial axes (Supplementary Table 5), revealed that the Sector.NRB (NRB, non-biosphere reserve) modality has a strong positive and significant correlation with axis 1 at the 5% level. This modality is opposed to the Sector.RBVO (RBVO, biosphere reserve of lower “Ouémé” Valley, r = −0.524; p = 0.000) and SLG.GoEA (GoEA, Goun and related groups, r = −0.462; p = 0.000) modalities. These two modalities also have a strong negative and significant correlation with axis 2.
The level of education has relatively modest influence on households' category structure. A slight shift is noted between the concentration ellipses of educational level modalities. However, it is much more pronounced between “secondary” and the others (Figure 7A). The typicality test reveals that “none,” “secondary” and “university” sub-clusters are not significantly different from household population on axis 1. On axis 2, the mean points of “primary” and “university” sub-clusters do not differ significantly from the reference mean point of the household population (Supplementary Table 6). The homogeneity test shows that “none,” “primary,” and “secondary” sub-clusters are significantly distinct on both axes (Supplementary Table 7). However, “secondary” and “university” sub-clusters are not totally distinct at 5% level. The influence of gender is relatively modest on households' category structure. The female-headed and male-headed households forming distinct sub-clusters across both axes (Figure 7B). The results of the typicality test show that the mean points of men and women sub-clusters are significantly different from household population on both factorial axes (Supplementary Table 6). The homogeneity test reveals that women sub-cluster is significantly distinct from that of men on both axes (Supplementary Table 8). The sociolinguistic groups have also a strong influence on households' category structure. The Figure 7C indicates a transition between GoEA (Goun) sub-cluster and those of other SLGs. The GoEA sub-cluster is positioned in the southwest quadrant, whereas the AdEA, FoEA, and YoEA are situated in the northeast quadrant of factorial plane 1-2. The typicality test reveals that only the mean points of YoEa sub-cluster does not deviate significantly from the origin point of the household population on axis 1 at 5% level (Supplementary Table 6). The results of homogeneity test show that there is a significant distinction between the GoEA sub-cluster and others (AdEA, FoEA, and YoEa) on both factorial axes (Supplementary Table 9). However, AdEA, FoEA, and YoEa sub-clusters are not significantly distinct at the 5% on either axis. The sector factor has a very strong influence on household population (Figure 7D). The mean points of NRB, RBVO and RBM sub-clusters are located in three different quadrants of the factorial plane. These mean points are significantly different from that of the household population on both factorial axes at 5% level (Supplementary Table 6). The homogeneity test shows that NRB, RBVO and RBM sub-clusters are distinct on both axes (Supplementary Table 10).
Figure 7

Influence of structuring factors on the distribution of households around mangrove ecosystems. (A) Level of education. (B) Gender. (C) Sociolinguistic group. (D) Sector.
Considering the description of household categories according to structuring factors, the Fisher's exact test indicates a statistically significant relationship (p = 0.000) between the various structural factors and household categories at 5% (Table 3). However, the strength of this relationship varies depending on the factors examined. Specifically, the sector exhibits a strong link intensity (V = 0.621) with household categories. The link is of moderate intensity (V = 0.417) when the SLG is taken into account. Household categories show a relatively weak intensity association with gender (V = 0.208) and education level (V = 0.159) at the 5% significance level.
Table 3
| Factor | Modality | CM1 (n = 119) | CM2 (n = 145) | CM3 (n = 57) | CM4 (n = 132) | CM5 (n = 11) | Statistic V of Cramer (p) | Probability of the statistic Fisher |
|---|---|---|---|---|---|---|---|---|
| Sector | NRB | 37 (31%) | 5 (3.40%) | 6 (11%) | 120 (91%) | 0 (0.00%) | 0.621 (p = 0.000) | 0.0000 |
| RBVO | 39 (33%) | 132 (91%) | 30 (53%) | 0 (0.00%) | 11 (100%) | |||
| RBM | 43 (36%) | 8 (5.50%) | 21 (37%) | 12 (9.10%) | 0 (0.00%) | |||
| SLG | AdEA | 51 (43%) | 10 (6.90%) | 22 (39%) | 75 (57%) | 1 (9.10%) | 0.417 (p = 0.000) | 0.0000 |
| FoEA | 39 (33%) | 12 (8.30%) | 15 (26%) | 53 (40%) | 0 (0.00%) | |||
| GoEA | 27 (23%) | 123 (85%) | 20 (35%) | 0 (0.00%) | 10 (91%) | |||
| YoEA | 2 (1.70%) | 0 (0.00%) | 0 (0.00%) | 4 (3.00%) | 0 (0.00%) | |||
| Gender | Male | 40 (34%) | 87 (60%) | 29 (51%) | 71 (54%) | 7 (64%) | 0.208 (p = 2.17e−12) | 0.0000 |
| Female | 79 (66%) | 58 (40%) | 28 (49%) | 61 (46%) | 4 (36%) | |||
| LOE | None | 57 (48%) | 92 (63%) | 32 (56%) | 67 (51%) | 9 (82%) | 0.159 (p = 2.23e−6) | 0.0000 |
| Primary | 30 (25%) | 42 (29%) | 18 (32%) | 50 (38%) | 1 (9.10%) | |||
| Secondary | 28 (24%) | 11 (7.60%) | 7 (12%) | 15 (11%) | 1 (9.10%) | |||
| University | 4 (3.40%) | 0 (0.00%) | 0 (0.00%) | 0 (0.00%) | 0 (0.00%) |
Description of household categories according to structuring factors.
CM, household category; p, probability of signification; V, Cramer statistic.
3.3 Socio-environmental determinants according to household categories
The Hierarchical Ascending Classification (HAC) based on the average priority scores of socio-environmental factors enabled us to establish five homogeneous classes (Figure 8). The proportion of information retained by obtaining these classes is 90.46%. The classes of socio-environmental determinants are labeled as FCM1 to FCM5.
Figure 8

Socio-environmental factors classes affecting mangrove ecosystem.
The class 1 (FCM1) identified the most significant impacts as stemming from the salt farming (FEMS), intensive logging (CIB), and filling of river basins and water bodies (CBCPE). For the class 2 (FCM2), the most impacting factors relate to overexploitation of mangrove ecosystem lands (STEM), intensive fishing resource exploitation (EIRH), and vegetation cover destruction (DCV), along with overexploitation of local biodiversity (SBL), excessive agricultural usage of mangrove lands (FEAT), heightened climatic event intensity leading to flooding and drought (AIFC), zoonosis outbreaks (AZ), overgrazing of forest massifs and their surrounding areas (SMFP), and soil erosion (EDS). The class 3 (FCM3) comprises the factors which mainly relate to the rising land conflicts around mangrove ecosystems (ACFEM) and the drop in IGA yields (BRAGR). With regard to the class 4 (FCM4), the factors which impact significantly the mangrove ecosystem are related to poaching (BRA), heavy use of chemical inputs (FUIC), and chemical and organic pollution of surface and groundwater (PCOES). The class 5 (FCM5) is made up of important factors such as wastewater discharge (DEU), increased frequency of human-animal conflicts (AFCHA), and food and water poisoning (IAH).
The description of the previous factor classes was based on the Principal Component Analysis (PCA) of the average priority scores calculated by household category. The first component of ACP explains 69.51% of the priority matrix variance, and mainly takes into account the household categories CM1, CM2, CM3, and CM5. The second component accounts for 20.95% of the initial information and, primarily takes into account the household categories CM4 and CM5.
The class FCM1 of socio-environmental factors is located in the negative part of the two-factorial axis (Figure 9). This class comprises the factors which have an importance for the households' categories CM1, CM2, CM3, and CM5. For these households, salt farming, intensive logging, and the filling of river basins and water bodies are the main factors impacting mangrove ecosystems. The class FCM2, located in the positive part of axis 2, is made up of the factors which have the greatest impact for the CM4, and accessorily for CM1. These factors are related to overexploitation of mangrove ecosystem lands, intensive fishing resource exploitation, vegetation cover destruction, overexploitation of local biodiversity, excessive agricultural usage of mangrove lands, heightened climatic event intensity leading to flooding and drought, zoonosis outbreaks, overgrazing of forest massifs and their surrounding areas, and soil erosion. The class FCM3 is positioned in the negative part of axis 2. It includes factors such as the increase in land conflicts around mangrove ecosystems and the drop in IGA yields, which are more important for CM5 households than for other households. As for the class FCM4 and FCM5, they are composed of factors which have a very low impact or are less relevant for the different households' categories of the study area.
Figure 9

Relationship between socio-environmental determinants and household categories.
4 Discussion
4.1 Influence of the sector on household distribution around mangrove ecosystems
In this study, the sector (NRB, RBVO, and RBM) has a significant influence on household structuring around mangrove ecosystems. Whether the area is a biosphere reserve or not can strongly impact the distribution of households around these ecosystems. This difference reflects variations in access to resources and management practices. In biosphere reserves, human activities are often regulated to protect the environment, which may limit the settlement of new households or restrict certain economic activities like fishing, logging, or agriculture. This often leads to a lower concentration of households in these areas to preserve biodiversity and sensitive ecosystems. Conversely, in areas not protected by a biosphere reserve, households can settle more freely and exploit natural resources more intensively, which may result in a higher population density around mangroves. This suggests that land management and regulation in biosphere reserves play a crucial role in shaping population distribution, protecting ecosystems while limiting direct access to natural resources, and guiding human activities toward more sustainable practices. Similar studies have shown that proximity to protected areas and environmental regulations affect household structuring and their dependence on natural resources (Coad et al., 2019). Moreover, households outside reserves may have more freedom in resource exploitation. This implies that land management and regulation in biosphere reserves are key to population distribution, balancing ecosystem protection with sustainable use of natural resources.
4.2 Influence of sociolinguistic groups on household distribution around mangrove ecosystems
The sociolinguistic groups (SLG) strongly influence the distribution of households around mangrove ecosystems. The fact that the SLG affects household distribution highlights the importance of cultural ties and perceptions of resource access rights in residential choices. Members of the same SLG often share cultural practices, beliefs, and traditions that draw them closer to mangrove ecosystems. For example, some communities have ancestral practices related to fishing, harvesting mangrove wood, or the medicinal use of specific plants, which may motivate these groups to settle near mangroves, reinforcing their collective identity. Some communities may have traditional or customary rights over these lands, providing them with a sense of ownership or authority over the resources (Agrawal, 2001).
The same observation was made by Adjahossou et al. (2019), who showed that ethnic groups in Benin tend to settle near natural resources that they consider part of their cultural heritage. Social networks within an SLG facilitate the transmission of local knowledge about resource management, thus promoting sustainable occupation of mangrove areas. A similar study by Diatta et al. (2020) in Senegal demonstrated that communities with strong sociocultural ties were more likely to organize themselves to protect and sustainably manage mangroves. These findings highlight the importance of considering sociolinguistic specificities in mangrove management policies. Ignoring these complex dynamics could undermine the effectiveness of conservation strategies. Therefore, it is crucial to integrate traditional knowledge and local perceptions into management strategies to ensure their success and social acceptability.
4.3 Influence of educational level on household distribution around mangrove ecosystems
In this study, the educational levels of respondents had little influence on the distribution of households around mangrove ecosystems. This may be explained by the fact that even more educated individuals do not necessarily consider proximity to mangrove ecosystems as an advantage or disadvantage in their residential choices. A similar trend was reported by Fonta and Ayuk (2013), who showed that the education level of residents living near a forest in southwestern Nigeria did not affect their distribution. In other words, both less educated and more educated households can live around mangrove ecosystems. This indicates that other factors, perhaps economic or cultural, are more influential in this residential choice. Therefore, mangrove management strategies must take into account the diversity of educational levels while focusing on interventions that address the economic and practical motivations of local communities.
4.4 Influence of gender on household distribution around mangrove ecosystems
Gender influences household distribution around mangrove ecosystems due to the traditional roles assigned to men and women within the community (Padonou et al., 2023). These roles not only affect how mangrove resources are exploited but also where households choose to settle. Traditionally, in many societies, men are more involved in activities related to wood, such as collecting firewood for sale, carpentry, and construction (Timko et al., 2010; Padonou et al., 2023), as well as gathering honey and hunting wildlife (Shackleton and Shackleton, 2004). Women, on the other hand, are often responsible for domestic tasks and managing local resources such as firewood and non-timber forest products (Padonou et al., 2023; Quisumbing and Pandolfelli, 2010). This division of labor can influence the geographic distribution of households around mangrove ecosystems. For instance, in areas where fishing activities predominate, men may prefer to settle closer to mangroves to have easier access to fishing zones. Conversely, women, who may be more involved in activities related to managing domestic resources, might live farther from the mangroves in areas less directly connected to these ecosystems. Similar studies have shown that gender plays a crucial role in land occupation and natural resource use. For example, a study conducted by Bennett (2016) in Ghana revealed that men, being more involved in fishing activities, are more inclined to live near mangroves, while women, whose domestic responsibilities may take them away from fishing zones, choose different locations. Further reinforcing this perspective, a study by Daw et al. (2011) on the exploitation of coastal and marine ecosystem services found that gender determines differences in the regulation of ecosystem service flows. Similarly, research conducted in Kenya's Diani Chale and Kisite Mpunguti Marine Protected Areas revealed that perceived access to and use of coastal and marine ecosystems for wellbeing varied by gender. Women faced limitations in accessing deeper waters due to sociocultural expectations and fears that deep waters were dangerous or inhabited by spirits, while men played a dominant role in exploiting marine resources due to their ability to own advanced fishing and tourism equipment. Lau et al. (2019) further demonstrated that gender-based differences in ecosystem service preferences across ecosystem types could be attributed to sociocultural roles, beliefs, identity, property rights, and land tenure systems.
Additionally, Bennett (2016) argues that perceptions of ecosystem services are influenced by knowledge, experience, and motivations toward a given resource. This perspective aligns with the findings of this study, as gendered perceptions of mangrove ecosystem services shape household settlement patterns and resource utilization. Traditional gender roles influence not only access to resources but also residential choices based on economic activities and family responsibilities (Pravalprukskul and Resurrection, 2018). Thus, the distribution of households around mangrove ecosystems is closely linked to traditional gender roles, which determine the economic and domestic activities of men and women. However, other research, such as that by Badola et al. (2012) in India, suggests that the role of women may be underestimated in conservation policies. This implies that the influence of gender on household structuring is contextual and depends on local dynamics of governance and access to resources.
Mangrove management policies should, therefore, take into account these gender dynamics to better address the specific needs of each group and promote sustainable management of natural resources.
4.5 Socio-economic context of households and specific challenges for mangrove management in Benin
The results of this study reveal the diversity of socio-economic profiles among households living near mangroves in Benin and highlight the multiple human pressures affecting these fragile ecosystems. The five (05) identified household categories (CM1–CM5) clearly illustrate differences in vulnerability and dependence on natural resources, particularly mangroves. The findings show that households heavily rely on mangrove resources, especially for salt production and wood harvesting for fishing activities (Roy, 2016). These results are consistent with other studies conducted in West Africa's coastal areas, where pressure on mangrove ecosystems is closely linked to the strong dependence of local communities on these resources for their livelihoods (UNEP, 2007; Cisse et al., 2004; Zannou et al., 2017; Adanguidi et al., 2020). In contrast, households in category CM3, which are less dependent on mangrove resources, are more engaged in diversified economic activities, reflecting a higher level of resilience to environmental challenges. These findings underscore the importance of income-generating activities (IGAs) in empowering communities (FAO, 2013). The key role of economic activities such as salt production, fishing, and fish processing within households highlights the importance of these sectors for food security and the incomes of coastal populations (Begum et al., 2022; Adounkpe et al., 2021). The lower vulnerability of some households may suggest that economic diversification is an effective adaptation strategy to reduce pressure on natural resources (Ellis, 2000). The study also revealed that geographic and sociolinguistic factors play a major role in structuring households, affecting their access to natural resources and basic services. In general, practices such as wood cutting (Adanguidi et al., 2020), salt production (Orekan et al., 2019), and waterway reclamation (Alongi, 2002) are major pressure factors on mangrove ecosystems. These results align with previous studies, such as Zannou et al. (2017), which emphasized the close relationship between overexploitation of natural resources and mangrove degradation in Benin. For effective and equitable mangrove management in Benin, it is essential to adopt differentiated strategies that take into account the specific socio-economic profiles of households. Households in categories CM1 and CM3, who are more educated and economically diversified, should be involved in co-management initiatives, reforestation, and awareness-raising programs. Households in category CM5, facing high vulnerability, require targeted interventions such as access to sustainable economic alternatives and basic services to reduce their pressure on mangroves (Figure 10).
Figure 10
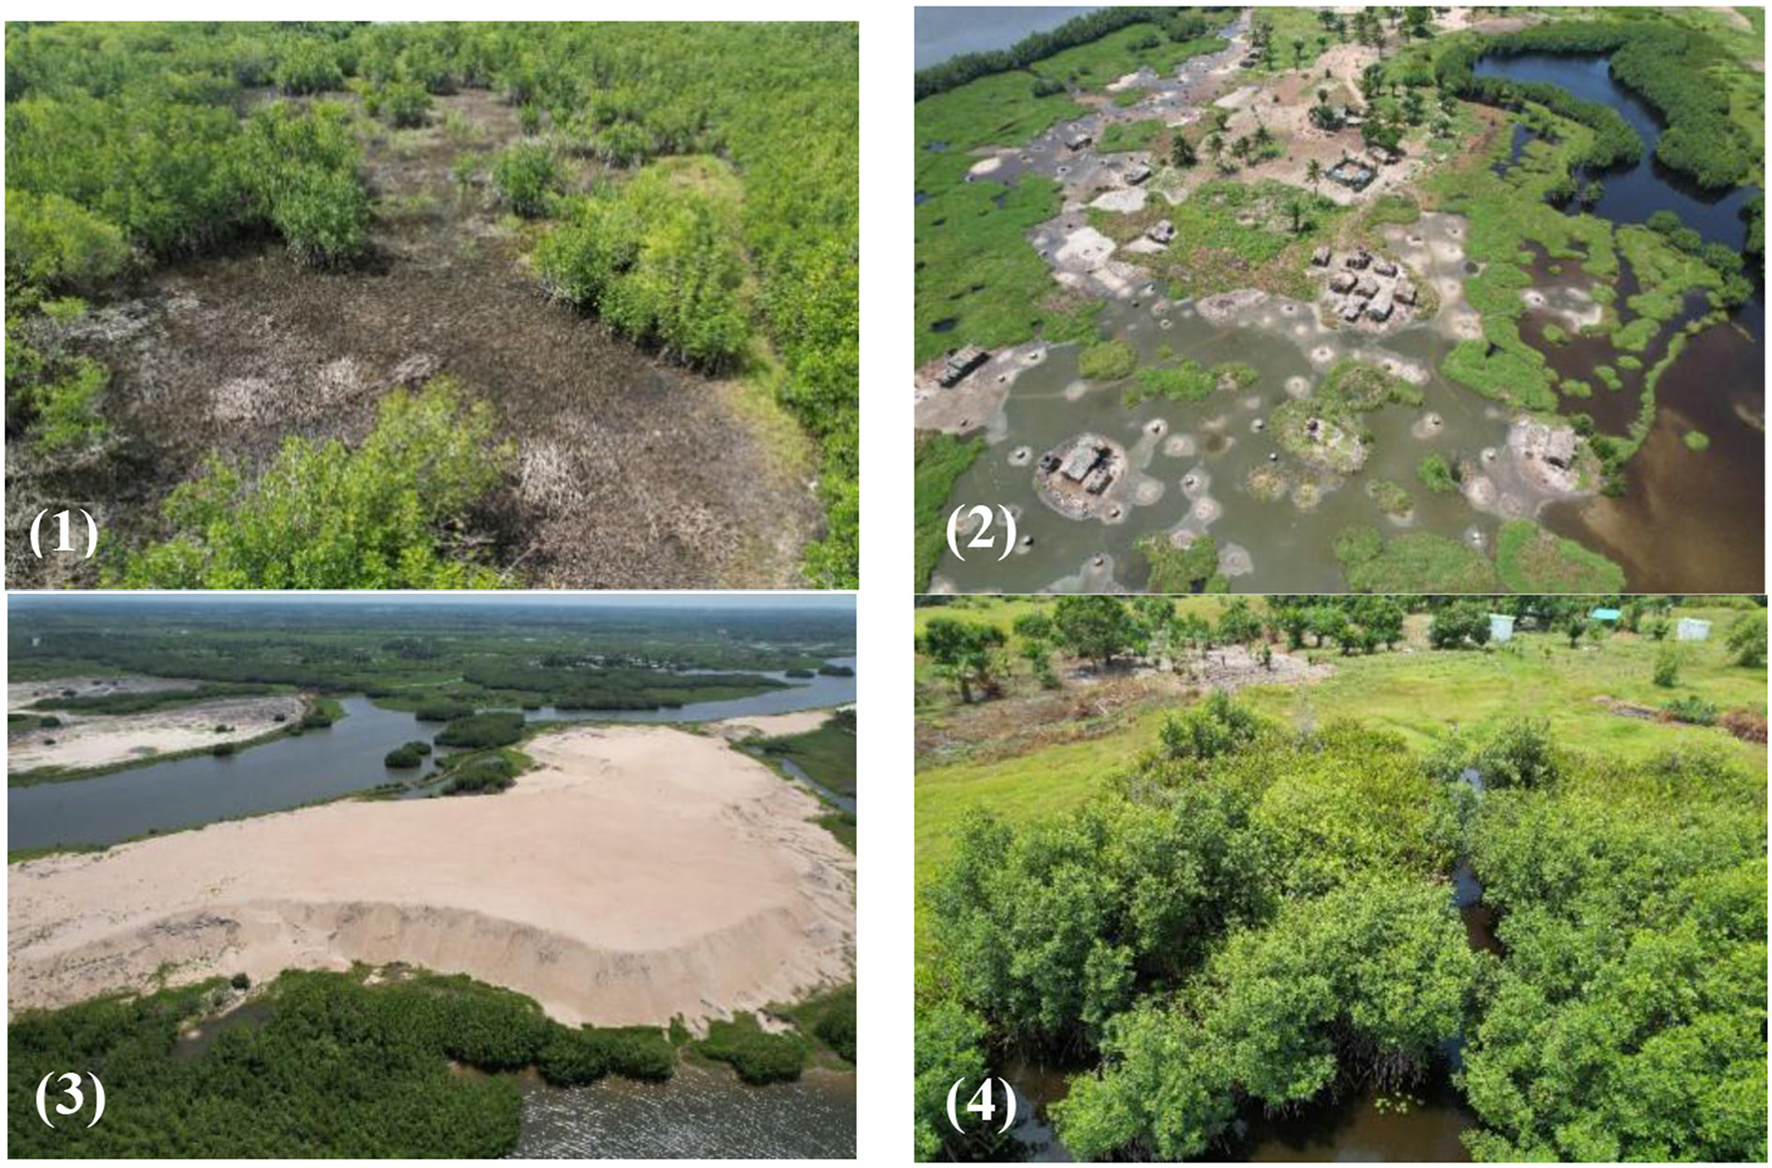
(1) Mangrove logging site at Ahouandji; (2) Djègbadji salt exploitation site; (3) Sand dredging in Djondji; (4) Farming activities near mangroves. Source: Photos taken from the field (coastal Benin) by the first author between January and March 2024.
5 Study limitations
This study has some limitations. Further analysis could be carried out by incorporating additional variables, such as market access. In addition, future studies could better understand how external pressures, such as climate change or conservation policies, influence the long-term structuring of households.
6 Conclusion
The sustainable management of mangrove ecosystems requires a thorough understanding of the social and environmental dynamics that affect them. This study, conducted across three sites—the “Mono” Biosphere Reserve, the Lower “Ouémé” Valley Biosphere Reserve, and a non-protected area—highlights the influence of households' socio-economic profiles on the integrity of mangrove ecosystems. Five categories of households were identified based on their demographic, socio-economic, and environmental characteristics. The results reveal that the distribution of households and their interactions with mangrove ecosystems are strongly influenced by geographic location (inside or outside a biosphere reserve), sociolinguistic group, and to a lesser extent, by education level and gender. This relatively weak influence of education and gender represents an opportunity for conservation policies to focus more on the economic motivations and daily practices of local communities. Moreover, the analysis of socio-environmental factors shows that their perception and impact vary between household categories, revealing differentiated profiles of pressures exerted on mangroves. This diversity calls for management strategies that are adapted, targeted, and sensitive to local specificities. The importance of sociolinguistic dynamics and traditional knowledge is also emphasized, suggesting that disregarding these social dimensions in mangrove management policies could undermine their effectiveness and social acceptability. Integrating local knowledge and community perceptions thus appears essential for designing sustainable management approaches rooted in the local context. This study helps fill a gap in the literature on the interactions between household socio-economic profiles and mangrove management in sub-Saharan Africa, where such relationships remain relatively underexplored. A better understanding of the links between community dependence and environmental pressures will make it possible to better reconcile conservation goals with local development needs. Future research could further explore the impact of seasonal variations and local policies on these dynamics, with a view to identifying the most effective levers for sustainable and inclusive management of mangrove ecosystems.
6.1 Recommendations
The findings from this study recommend that to adopt a mangrove resource management approach that takes into account the significant influence of the geographic sector on the distribution of households. Management policies should be tailored to the specific economic activities of different sectors to minimize their impact on mangroves. Given the limited impact of gender and educational level on household distribution, it is crucial to strengthen the capacities of communities by providing training on sustainable practices adapted to their activities. Regarding gender dynamics, mangrove management policies should consider the specific needs of each group to promote sustainable natural resource management. Additionally, they should facilitate the active participation of local communities in the management and conservation of mangrove ecosystems. Diversifying income sources for households highly dependent on mangroves could also reduce pressure on these ecosystems by supporting alternatives such as sustainable aquaculture or ecotourism. Continuous monitoring and evaluation of implemented interventions are necessary to adapt strategies based on observed results. Finally, stakeholder engagement in resource management is essential, promoting collaboration between local communities, authorities, and non-governmental organizations for an integrated and effective approach.
Statements
Data availability statement
The raw data supporting the conclusions of this article will be made available by the authors, without undue reservation.
Ethics statement
Ethical approval was not required for the studies involving humans because the University of Parakou does not have an Ethics Committee for reviewing research applications. No formal ethic certificate was obtained. An official authorization for data collection, written in French and translated into English, was issued by the Doctoral School of Agricultural and Water Sciences. The studies were conducted in accordance with the local legislation and institutional requirements. The participants provided their written informed consent to participate in this study. Confidentiality, anonymity, and participants' rights were guaranteed throughout the data collection and analysis process.
Author contributions
TA: Conceptualization, Data curation, Formal analysis, Funding acquisition, Investigation, Methodology, Writing – original draft. YH: Conceptualization, Supervision, Validation, Visualization, Writing – review & editing. BS: Writing – review & editing. ST: Methodology, Validation, Visualization, Writing – review & editing. AW: Validation, Visualization, Writing – review & editing. TH: Visualization, Writing – review & editing. SS: Formal analysis, Methodology, Visualization, Writing – review & editing. KS: Validation, Visualization, Writing – review & editing. CO: Conceptualization, Supervision, Validation, Visualization, Writing – review & editing.
Funding
The author(s) declare that financial support was received for the research and/or publication of this article. This research and/or publication was made possible thanks to the support of Canada's International Development Research Centre (IDRC), under project no. 109799-001, and UNESCO's Man and the Biosphere (MAB) Programme through the Young Scientists Programme, project no. 4023977, which provided financial support for the implementation of this study.
Conflict of interest
The authors declare that the research was conducted in the absence of any commercial or financial relationships that could be construed as a potential conflict of interest.
Generative AI statement
The author(s) declare that no Gen AI was used in the creation of this manuscript.
Publisher’s note
All claims expressed in this article are solely those of the authors and do not necessarily represent those of their affiliated organizations, or those of the publisher, the editors and the reviewers. Any product that may be evaluated in this article, or claim that may be made by its manufacturer, is not guaranteed or endorsed by the publisher.
Supplementary material
The Supplementary Material for this article can be found online at: https://www.frontiersin.org/articles/10.3389/focsu.2025.1585622/full#supplementary-material
References
1
Adanguidi J. Padonou E. A. Zannou A. Houngbo S. B. Saliou I. O. Agbahoungba S. et al . (2020). Fuelwood consumption and supply strategies in mangrove forests - insights from RAMSAR sitesm in Benin. For. Policy Econ.116:102192. 10.1016/j.forpol.2020.102192
2
Adjahossou S. G. C. Houéhanou D. T. Toyi M. Salako V. K. Ahoyo C. C. Lesse P. et al . (2019). Dépendance socioculturelle des connaissances locales des usages de Isoberlinia spp. au MoyenBénin, Afrique de l'Ouest. Bois For. Trop.339, 33–43. 10.19182/bft2019.339.a31702
3
Adounkpe J. Agboton C. Hounkpatin W. Kounouhewa B. Ahouannou C. Sinsin B. et al . (2021). Qualitative assessment of table salt production techniques in southern benin republic, and related mangrove destruction and health issues. Food Nutr. Sci.12, 759–773. 10.4236/fns.2021.127057
4
Agoungbome S. M. D. Gbenontin E. Thiam M. (2020). “Mangroves under demographic pressure and salt production threats in the municipality of Ouidah (Benin),” in Innovations and Interdisciplinary Solutions for Underserved Areas. InterSol 2020. Lecture Notes of the Institute for Computer Sciences, Social Informatics and Telecommunications Engineering, Vol 321, eds. J. Thorn, A. Gueye, and A. Hejnowicz (Cham: Springer), 105–118. 10.1007/978-3-030-51051-0_8
5
Agrawal A. (2001). Common property institutions and sustainable governance of resources. World Dev.29, 1649–1672. 10.1016/S0305-750X(01)00063-8
6
Agresti A. (2002). Categorical Data Analysis. 2nd Edition.New York, NY: John Wiley and Sons, 734. 10.1002/0471249688
7
Aheto D. W. Kankam S. Okyere I. Mensah E. Osman A. Jonah F. E. et al . (2016). Community-based mangrove forest management: implications for local livelihoods and coastal resource conservation along the Volta estuary catchment area of Ghana. Ocean Coast. Manage.127, 43–54. 10.1016/j.ocecoaman.2016.04.006
8
Ahouangan B. S. C. M. Koura B. I. Sèwadé C. Toyi M. C. Lesse A. D. P. Houinato M. R. B. et al . (2022). Ruminant keeping around mangrove forests in Benin (West Africa): herders' perceptions of threats and opportunities for conservation of mangroves. Discov. Sustain.3:13. 10.1007/s43621-022-00082-x
9
Ajonina G. N. Agardy T. Lau W. Agbogah K. Gormey B. (2014). “Mangrove conditions as indicator for potential payment for ecosystem services in some estuaries of Western Region of Ghana, West Africa,” in The Land/Ocean Interactions in the Coastal Zone of West and Central Africa, Estuaries of the World, eds. S. Diop, J.-P. Barusseau, and C. Descamps (Cham: Springer), 151–166. 10.1007/978-3-319-06388-1_13
10
Alongi D. M. (2002). Present state and future of the world's mangrove forests. Environ. Conserv. 29, 331–349. 10.1017/S0376892902000231
11
Ameen F. Al-Homaidan A. A. (2021). Compost inoculated with fungi from a mangrove habitat improved the growth and disease defense of vegetable plants. Sustainability13:124. 10.3390/su13010124
12
Badola R. Barthwal S. Hussain S. A. (2012). Attitudes of local communities towards conservation of mangrove forests: a case study from the east coast of India. Estuar. Coast. Shelf Sci.96, 188–196. 10.1016/j.ecss.2011.11.016
13
Barbier E. B. (2016). The protective service of mangrove ecosystems: a review of valuation methods. Mar. Pollut. Bull. 109, 676–681. 10.1016/j.marpolbul.2016.01.033
14
Begum F. de Bruyn L. L. Kristiansen P. Islam M.A. (2021). Institutionalising co-management activities for conservation of forest resources: evidence from the Sundarban mangrove forest management of Bangladesh. J. Environ. Manage.12:113504. 10.1016/j.jenvman.2021.113504
15
Begum F. de Bruyn L. L. Kristiansen P. Islam M. A. (2022). Forest co-management in the sundarban mangrove forest: impacts of women's participation on their livelihoods and sustainable forest resource conservation. Environ. Dev.43:100731. 10.1016/j.envdev.2022.100731
16
Bennett N. J. (2016). Using perceptions as evidence to improve conservation and environmental management. Conserv. Biol. 30, 582–592. 10.1111/cobi.12681
17
Cisse A. T. Ghysel A. Vermeulen C. (2004). “Systèmes de croyances Niominka et gestion des ressources naturelles de mangrove,” in International Symposium Tropical Forests in a Changing Global Contexp, 307–322.
18
Coad L. Watson J. E. Geldmann J. Burgess N. D. Leverington F. Hockings M. et al . (2019). Widespread shortfalls in protected area resourcing undermine efforts to conserve biodiversity. Front. Ecol. Environ.17, 259–264. 10.1002/fee.2042
19
Conover W. J. (1999). Practical Nonparametrics Statistics, 3rd Edition.Hoboken, NJ: John Wiley and Sons, 608.
20
Dagnelie P. (1998). Tome I. Statistique Théorique et Appliquée. Bruxelles: De Boeck, 517.
21
Daïnou K. Vermeulen C. Doucet J. L. (2008). Consommation de bois en zones humides du complexe ouest du Bénin: besoins et gestion locale des formations ligneuses. Bois For. Trop.298, 13–24.
22
Daw T. I. M. Brown K. Rosendo S. Pomeroy R. (2011). Applying the ecosystem services concept to poverty alleviation: the need to disaggregate human well-being. Environ. Conserv.38, 370–379. 10.1017/S0376892911000506
23
Diatta C. S. Diouf M. Sow A. A. Karibuhoye C. (2020). La civilisation Joola et la gestion des mangroves en basse Casamance, Sénégal. Rev. Ethnoécol.17, 1–20. 10.4000/ethnoecologie.5855
24
Duke N. C. Schmitt K. (2015). “Mangroves: unusual forests at the Seas Edge,” in: Tropical Forestry Handbook, eds. M. Köhl, and L. Pancel (Berlin: Springer), 1–24. 10.1007/978-3-642-41554-8_129-1
25
Ellis F. (2000). Rural Livelihoods and Diversity in Developing Countries. Oxford: Oxford University Press.
26
FAO (2013). Sustainable Livelihoods and Livelihood Diversification. Rome: Food and Agriculture Organization of the United Nations, 114.
27
Fonta W. M. Ayuk E. T. (2013). Measuring the role of forest income in mitigating poverty and inequality: evidence from south-eastern Nigeria. For. Trees Livelihoods22, 86–105. 10.1093/oso/9780198296959.001.0001
28
Giri C. Ochieng E. Tieszen L. L. Zhu Z. Singh A. Loveland T. et al . (2010). Status and distribution of mangrove forests of the world using earth observation satellite data. Glob. Ecol. Biogeogr.20, 154–159. 10.1111/j.1466-8238.2010.00584.x
29
Gnansounou S. C. Salako K. V. Sagoe A. A. Mattah P. A. D. Aheto D. W. Glèlè Kakaï R. et al . (2022). Mangrove ecosystem services, associated threats and implications for wellbeing in the mono transboundary biosphere reserve (Togo-Benin), West-Africa. Sustainability14:2438. 10.3390/su14042438
30
Gomis D. Mbengue N. P. Badiane S. D. Thiaw-Benga A. D. Guisse A. Ndiaye A. et al . (2023). Potentialités et avantages économiques de la mangrove dans la lutte contre le réchauffement climatique: cas de l'arrondissement de Djilor (Fatick, Sénégal). Int. J. Biol. Chem. Sci.17, 154–172. 10.4314/ijbcs.v17i1.12
31
Ho Y. Mukul S. A. (2021). Publication performance and trends in mangrove forests: a bibliometric analysis. Sustainability13:12532. 10.3390/su132212532
32
INSAE (2015). RGPH4 : Que Retenir des Effectifs de Population en 2013? 35.
33
Jenks G. F. (1967). The data model concept in statistical mapping. Int. Yearb. Cartogr.7, 186–190.
34
Karney C. F. F. (2013). Algorithms for geodesics. J. Geod.87, 43–55. 10.1007/s00190-012-0578-z
35
Kauffman J. B. Adame M. F. Arifanti V. B. Schile-Beers L. M. Bernardino A. F. Bhomia R. K. et al . (2020). Total ecosystem carbon stocks of mangroves across broad global environmental and physical gradients. Ecol. Monogr.90:e01405. 10.1002/ecm.1405
36
KoBoToolbox (2023). KoBoCollect (Version 2023.2.4) [Mobile application software]. Harvard Humanitarian Initiative. Available online at: https://www.kobotoolbox.org (accessed December 13, 2023).
37
Kochoni B. I. Salako K. V. Danquah J. A. Sinsin C. B. L. Mensah S. Glèlè Kakaï R. et al . (2025). Contribution of the Ramsar convention to the conservation of West-African mangroves: a case study in Benin. Wetl. Ecol. Manag. 33:15. 10.1007/s11273-024-10026-z
38
Lau J. D. Hicks C. C. Gurney G. G. Cinner J. E. (2019). What matters to whom and why? Understanding the importance of coastal ecosystem services in developing coastal communities. Ecosyst. Serv.35, 219–230. 10.1016/j.ecoser.2018.12.012
39
Le Roux B. Rouanet H. (2004). Geometric Data Analysis: From Correspondence Analysis to Stuctured Data Analysis.Cham: Springer Science and Business Media, 475. 10.1007/1-4020-2236-0
40
Lovakov A. Agadullina E. R. (2021). Empirically derived guidelines for effect size interpretation in social psychology. Eur. J. Soc. Psychol. 51, 485–504. 10.1002/ejsp.2752
41
Mohammad Abdullah A. N. Stacey N. Garnett S. T. Myers B. (2016). Economic dependence on mangrove forest resources for livelihoods in the Sundarbans, Bangladesh. For. Policy Econ.64, 15–24. 10.1016/j.forpol.2015.12.009
42
Nchimbi A. A. Lyimo L. D. (2019). Socioeconomic determinants of mangrove exploitation and seagrass degradation in zanzibar: implications for sustainable development. J. Mar. Biol.2019, 1–11. 10.1155/2019/7684924
43
Ntibona L. N. Shalli M. S. Mangora M. M. (2022). Incentives and disincentives of mangrove conservation on local livelihoods in the Rufiji Delta, Tanzania. Trees For. People10:100326. 10.1016/j.tfp.2022.100326
44
Nyangoko B. P. Berg H. Mangora M. M. Shalli M. S. Gullström M. (2022). Local perceptions of changes in mangrove ecosystem services and their implications for livelihoods and management in the Rufiji Delta, Tanzania. Ocean Coastal Manage.219:106065. 10.1016/j.ocecoaman.2022.106065
45
Orekan V. O. A. Plagbeto H. Edea E. Sossou M. (2019). “Evolution Actuelle des Ecosystèmes de Mangrove dans le Littoral Beninois, in Conférence OSFACO : Des images satellites pour la gestion durable des territoires en Afrique, Mar 2019, Cotonou, Bénin, 16.
46
Oyede M. I. Hounzime S. Agbokou I. Alhassane A. Yabi I. (2022). Caractéristiques spatio–temporelles de la variabilité climatique au benin (Afrique de L'ouest). Eur. Sci. J.18, 240–261. 10.19044/esj.2022.v18n30p240
47
Padonou E. A. Avocevou-Ayisso C. M. Zanou M. Obe M. M. Agbahoungba S. Sinsin B. et al . (2023). Effects of unpaid caring activities and social norms on women's employment in mangrove areas of Ramsar site 1017 in Benin (West Africa). Soc. Sci. Humanit. Open7:100387. 10.1016/j.ssaho.2022.100387
48
Padonou E. A. Gbaï N. I. Kolawolé M. A. Idohou R. Toyi M. (2021). How far are mangrove ecosystems in Benin (West Africa) conserved by the Ramsar Convention?Land Use Policy108:105583. 10.1016/j.landusepol.2021.105583
49
Plaiphum S. Tansuchat R. (2022). Cultural capital of sea salt farming in Ban Laem District of Phetchaburi Province as per the globally important agricultural heritage systems (GIAHS). Sustainability15:11947. 10.3390/su151511947
50
Pol T. D. S. Deney A. Monso O. (2004). Ménage et chef de ménage: deux notions bien ancrées. Travail Genre Soc. 63−78. 10.3917/tgs.011.0063
51
Pravalprukskul P. Resurrection B. (2018). Gender in Coastal and Marine Resource Management: A Literature Review. Stockholm: Stockholm Environment Institute, 31.
52
Quisumbing A. R. Pandolfelli L. (2010). Promising approaches to address the needs of poor female farmers: resources, constraints, and interventions. World Dev.38, 581–592. 10.1016/j.worlddev.2009.10.006
53
R Core Team (2024). R: A Language and Environment for Statistical Computing. Vienna: R Foundation for Statistical Computing. Available online at: http://www.R-project.org/ (accessed September 20, 2024).
54
Robette N. (2023). GDAtools: Geometric Data Analysis in R. version 2.0. Available online at: https://nicolas-robette.github.io/GDAtools/ (accessed October 20, 2024).
55
Roy A. K. D. (2016). Local community attitudes towards mangrove forest conservation: lessons from Bangladesh. Mar. Pol. 74, 186–194. 10.1016/j.marpol.2016.09.021
56
Shackleton C. Shackleton S. (2004). The importance of non-timber forest products in rural livelihood security and as safety nets: a review of evidence from South Africa. S. Afr. J. Sci.100, 659−664.
57
Siikamäki J. Sanchirico J. N. Jardine S. McLaughlin D. Morris D. (2013). Blue carbon: coastal ecosystems, their carbon storage, and potential for reducing emissions. Environ. Sci. Policy Sustain. Dev. 55, 14–29. 10.1080/00139157.2013.843981
58
Sinsin C. (2021). Resilience of Mangrove Ecosystems to Climate Change in Benin, West Africa (Thèse de doctorat Unique). Abidjan: Université Félix Houphouët-Boigny, 174.
59
Sinsin C. B. Bonou A. Salako K. L. Gbedomon R. C. Romain L. Glèlè Kakaï. R.l. (2023). Economic valuation of mangroves and a linear mixed model-assisted framework for identifying its main drivers: a case study in Benin. Land12, 1–15. 10.3390/land12051094
60
Spalding M. Kainuma M. Collins L. (2010). World atlas of Mangroves. Why are mangroves important? Librairy of Congress Cataloging-in-Publication Data. Matla 310. 10.4324/9781849776608
61
Spurgeon G. (2002). Socio-economic Assessment and Economic Valuation of Egypt's Mangroves. Rome: FAO Consultancy Report, TCP/EGY/0168 (A). Available online at: https://www.fao.org/docrep/fao/007/ae212e/ae212e00.pdf (accessed 7 March 2011).
62
Teka O. Houessou L. G. Djossa B. A. Oumorou M. Bachmann Y. Sinsin B. et al . (2018). Mangroves in Benin, West Africa: threats, uses and conservation opportunities. Environ. Dev. Sustain.21, 1153–1169. 10.1007/s10668-017-0075-x
63
Timko J. A. Waeber P. O. Kozak R. A. (2010). The socio-economic contribution of non-timber forest products to rural livelihoods in Sub-Saharan Africa: knowledge gaps and new directions. Int. For. Rev.12, 284–294. 10.1505/ifor.12.3.284
64
Uddin M. S. van Steveninck E. D. R. Stuip M. Shah M. A. R. (2013). Economic valuation of provisioning and cultural services of a protected mangrove ecosystem: a case study on Sundarbans Reserve Forest, Bangladesh. Ecosyst. Serv. 88–93. 10.1016/j.ecoser.2013.07.002
65
UNEP (2007). Mangroves of Western and Central Africa. UNEP-Regional Seas Programme/UNEP-WCMC. Available online at: https://wedocs.unep.org/handle/20.500.11822/7768 (accessed June 1, 2025).
66
Ward J. H. (1963). Hierarchical grouping to optimize an objective function. J. Am. Stat. Assoc.58, 236–244. 10.1080/01621459.1963.10500845
67
Zannou A. Allou N. Z. Biaou G. (2017). Déterminants sociotechniques et économiques de la dégradation des forêts de mangrove dans la lagune côtière du Bénin. Ann. Sci. Agron.21, 77–88. 10.4000/vertigo.41383
Summary
Keywords
biodiversity conservation, ecosystem management, wetland, biosphere reserve, environment
Citation
Akoton TP, Hountondji YC, Sourou BN, Tcheton S, Wedjangnon AA, Houètchégnon T, Sogbossi SE, Salako KV and Ouinsavi CAIN (2025) The influence of household socio-economic profiles on the use of mangrove resources along the Benin coastline. Front. Ocean Sustain. 3:1585622. doi: 10.3389/focsu.2025.1585622
Received
28 February 2025
Accepted
19 May 2025
Published
23 June 2025
Volume
3 - 2025
Edited by
Dorota Kołbuk, University College Dublin, Ireland
Reviewed by
Hong Ching Goh, University of Malaya, Malaysia
Muhammad Nur Arkham, Politeknik Kelautan dan Perikanan Dumai, Indonesia
Updates
Copyright
© 2025 Akoton, Hountondji, Sourou, Tcheton, Wedjangnon, Houètchégnon, Sogbossi, Salako and Ouinsavi.
This is an open-access article distributed under the terms of the Creative Commons Attribution License (CC BY). The use, distribution or reproduction in other forums is permitted, provided the original author(s) and the copyright owner(s) are credited and that the original publication in this journal is cited, in accordance with accepted academic practice. No use, distribution or reproduction is permitted which does not comply with these terms.
*Correspondence: Tété Pérugine Akoton peruginea@gmail.comSènankpon Tcheton senankpon.tcheton@gmail.com
Disclaimer
All claims expressed in this article are solely those of the authors and do not necessarily represent those of their affiliated organizations, or those of the publisher, the editors and the reviewers. Any product that may be evaluated in this article or claim that may be made by its manufacturer is not guaranteed or endorsed by the publisher.