Abstract
In the recent decade, local fishers in the Jammer Bay, western Skagerrak, experienced declining landings of cod (Gadus morhua) and plaice (Pleuronectes platessa) and were unable to fish up their quotas making it difficult to earn a livelihood. To enable an Ecosystem Based approach to Management (EBM), we applied the Systems Approach Framework (SAF). The fishers' concerns and perceptions of the system were brought forward and integrated into the analysis. We examined whether the declined coastal landings were due to over-fishing, changes in adult cod and plaice distribution, climate change or discards. To address these issues, we integrated data from different, sources including international landings data for Skagerrak, fisheries survey data for the Greater North Sea, Danish landings data and hydrographic models of thermal seabed habitats for the Jammer Bay area, and Danish landings and discards data from the Skagerrak. Our results showed that declines in landings of cod and plaice in the Skagerrak appeared unrelated to quotas and effort. The fisheries survey data showed a regional shift in adult cod and plaice distribution from the southern and central North Sea areas to the northern North Sea areas. However, in the Jammer Bay area changes in where adult cod were caught were related to the distribution of suitable thermal habitats. No effects of changes in thermal seabed habitat were evident for adult plaice. The fisheries survey data showed that juveniles of both species occurred in high densities in the Jammer Bay area as compared to the remaining Skagerrak area and adjacent seas. Their occurrence coincided with the areas that were intensively fished, and high discards of juvenile cod and plaice were registered in the area during the period of the study. These results pointed to the need to implement protection measures for the juveniles of both species. The implementation of an Other Effective Area-based Conservation Measure (OECM) would allow spatio-temporal closures to protect the juveniles while maintaining sustainable fisheries. In this study, we demonstrate how multi-sourced empirical data can be mobilized to provide knowledge-based advice for OECM implementation.
Introduction
Once thriving fish populations that supported rich artisanal fisheries along the Danish coasts have declined likely due to multifactorial impacts from human activities necessitating an ecosystem approach to improve management. The EU Common Fisheries Policy (CFP) in conjunction with the Marine Strategy Framework Directive (MSFD) call for Ecosystem Based Management (EBM) (European Commission, 2023). This is achieved through policy outcomes that ensure economic efficiency, social equity and conservation of environmental elements that support the system. Several frameworks have been developed toward this end (Ostrom, 2009; Hopkins et al., 2011; Elliott et al., 2017; Gillgren et al., 2018), such as the Systems Approach Framework (SAF) that guides transparent management processes and stakeholder engagement (Hopkins et al., 2011; Gillgren et al., 2018; Støttrup et al., 2019). Spatio-temporal management, such as implementation of Marine Protected Areas (MPAs), has proven to be instrumental in protecting seabed habitats, sensitive species, spawning grounds and restoring local fish populations (Vinther and Eero, 2013; Moland et al., 2013; McDermott et al., 2017; MMO, 2024).
Other Effective Area-based Conservation Measures (OECMs) aim toward sustainable resource management and cultural preservation with an added benefit of biodiversity conservation (FAO, 2022). OECMs provide an opportunity for introducing flexibility in fisheries regulation (Rice et al., 2012; Garcia et al., 2022). In this study we explore how multisource-empirical data can be applied to provide knowledge based advise for implementation of OECMs in Ecosystem Based Fisheries Management (EBFM). In terms of conserving biodiversity, OECMs can be assessed based on how fisheries management protect (a), marine species, and (b), habitats (FAO, 2022). In this study, we focus on two commercially important marine fish species and their habitat boundaries.
In the Jammer Bay area (Skagerrak), Danish coastal fishers and their local communities raised concerns about the recent decadal declines in cod (Gadus morhua L.) quotas and landings and in plaice (Pleuronectes platessa L.) landings despite increased quotas. In response to the widespread outcry by fishers across Denmark, interviews with 74 commercial coastal fishers from 30 Danish harbors were conducted to elucidate the issue (Støttrup et al., 2014). The interviews revealed drastic declines in the coastal fishery sector, mostly related to declining landings of cod and plaice in the North Sea and inner Danish waters to the extent that the number of smaller vessels in many of the harbors were significantly reduced (Nielsen et al., 2013). The declines in landings could be due to local over-fishing, changes in adult cod and plaice distribution, climate change or discards. As these potential causes are interrelated, the observed declines in landings may be a combination and difficult to discern.
Fisheries assessment for management often encompasses large geographical areas that may not match the ecological or genetic structure of the fish population (Reiss et al., 2009). Thus, quotas may be set to a higher level than available at the local scale resulting in conflicts between fishery segments and risk of over-fishing. Over-fishing may also result from changes in fish habitat use due to e.g., increasing seawater temperatures. Changes in thermal habitats appeared to have affected the distribution of cod in the Baltic Sea resulting in a mismatch with spatial allocation of quotas (Dinesen et al., 2019). An offshore shift in distribution of juvenile fish may render them susceptible to higher mortalities from unwanted by-catch. Juvenile fish discards could thus be another possible cause of local declining landings.
In this study, we examined whether declines in coastal landings of cod and plaice could be explained by (i) over-fishing; (ii) regional or local changes in fish distribution; (iii) changes in extent of thermal habitats, (iv) discards of juveniles, or (v) a combination of these causes. To this end, we integrated data from different sources including international landings data for Skagerrak, fisheries survey data for the Greater North Sea, Danish landings data and hydrographic models of thermal seabed habitats for the Jammer Bay area, and Danish landings and discards data from the Skagerrak.
Materials and methods
Issue identification
We applied the Systems Approach Framework (SAF; www.safhandbook.net) to guide the process of issue identification. The main issue was identified through a process that engaged stakeholders and using the DPSIR (Drivers, Pressures, State, Impact, Response) framework. This approach helped to develop the relevant questions and identify the type of data and analyses required to address the issue.
Study area
The study area comprised the North Sea, Skagerrak and Kattegat (Figure 1A). The focus area for the EOCM considerations was the Jammer Bay (in Danish “Jammerbugt”) which constitutes the southwestern part of the Skagerrak (Figures 1A, B).
Figure 1

Maps of the study area. (A) Southern and central North Sea (blue, ICES areas 4.bc), northern North Sea (green, ICES area 4.a), the Jammer Bay area (black, ICES statistical rectangles 48F, 48G, 49F, 49G), the eastern Skagerrak (yellow, part of ICES area 3a.20); the Kattegat and the Sound (purple, ICES area 3a.21 and 23). (B) Fisheries surveys stations (crosses) during 2014-2022 in the Jammer Bay area.
Data and models
To provide an overview, the flow diagram in Figure 2 shows the data input and methods used and the resulting outputs of the analyses presented herein.
Figure 2

Flow diagram of the data used and the results of the analyses presented herein. The shape colors indicate the following types of data, and the corresponding analyses and outputs: light green, fisheries survey data; dark blue, European Union (EU) Member States (MS) commercial fisheries landings data; light blue, Danish (DK) commercial fisheries landings data; orange, hydrographic empirical modeled data; dark green, fish Data Storage Tags (DST) information; turquoise, Danish commercial fisheries discard data. FDI, Fisheries Dependent Information; VMS, Vessel Monitoring System and logbook information; AIS, Automatic Identification System Information.
Fish survey data
Data were retrieved for five different area: (i) the southern and central North Sea (i.e., ICES statistical areas 4.b & 4.c); (ii) the northern North Sea (i.e., ICES statistical area 4.a); (iii) the Skagerrak (i.e., ICES statistical area 3.a.20); (iv) the Jammer Bay area (i.e., ICES statistical rectangles 43F8, 43F9, 44F8, and 44F9), and (v) the Kattegat (ICES statistical areas 3.a.21 & 3.b.23) (Figure 1A). For details of ICES statistical areas, see https://www.ices.dk/data/maps/pages/default.aspx.
We included international fisheries survey data for the Greater North Sea, including the Skagerrak (incl. the Jammer Bay area), Kattegat and the Sound from 2005 to 2022 to investigate population trends at regional and local scales. The fish survey data for cod and plaice data were retrieved from the ICES DATRAS database (https://www.ices.dk/data/data-portals/Pages/DATRAS.aspx). DATRAS database included NS-IBTS Q1 (January–March), NS-IBTS Q3 (July–September), BITS Q1, BITS Q4 (October–December), Cod survey Q4, Sole survey Q4, BTS Q3 (plaice only). Catch Per Unit Effort (CPUE) data from quarter one (Q1) and three (Q3) were analyzed at the four spatial scales (Figure 1A). The fish survey stations in the Jammer Bay area are shown in Figure 1B.
Data from 2005 to 2022 were divided into two size groups, small below and large above landing size. The official minimum landing sizes in the Skagerrak are 30 cm for cod and 27 cm for plaice. The small size group for cod mainly includes age-1 cod. Age-0 cod can be caught in the fisheries surveys in Q3, and since the average length of age-2 cod is >30 cm, slow growing age-2 may also be caught [ICES FishMap, (cod)]. Plaice with lengths < 27 cm are generally age-1 and age-2 fish [ICES FishMap, (plaice)] (see FishMap links in the References). We refer to the small size group as juveniles in this study.
Abundance distribution model
The fish distribution model is a Delta-Lognormal GAM with the following structure:
g(μi) = Gear(i) + f1 (utm.xi, utm.yi) + f2 (timei) + (1)
f 3 (utm.xi, utm.yi, timeOfYeari) +
f 4 (utm.xi, utm.yi, timei) +
f 5 (√ depthi, timeOfYeari) + U(i)ship + log (HaulDuri + 5)
where the response variable μi is biomass in the ith haul and f1 to f5 are splines. For the geographical coordinates (utm.x, utm.y), time, timeOfYear, and depth, Duchon splines with first order derivative penalization were used everywhere. U(i)ship ~ N(0, σμ) is a random effect for the vessel collecting hauli. The function g is the link function, which is the logit function for the binomial model. The lognormal part of the delta-lognormal model is fitted by log-transforming the response and using the Gaussian distribution with a unit link. Models were fitted independently for small and large individuals. The abundance maps produced cover the entire North Sea, Skagerrak, Kattegat and the Sound, and further was analyzed independently for the Jammer Bay area.
Danish commercial fisheries data
Commercial fisheries data from the Danish vessels were included to identify landings relative to thermal benthic habitat conditions. Vessel Monitoring System (VMS) data and Automated Identification System (AIS) data were combined with logbook, sales slips and vessel register information of the Danish fisheries from 2014 to 2022 for four different fisheries (métiers) in the case study area: otter trawl (OTB), Danish seine (SDN), gill net (GNS) and other demersal fisheries (OTH). These four gear groups combined are denoted “All gears”. For the métiers using mobile bottom-contacting gears (OTB, SDN, OTH) a daily swept area ratio (SAR) was estimated for c-squares of 0.01 x 0.01 degrees longitude and latitude (approx. 0.6 x 1.0 km) using the methodology in Eigaard et al. (2016, 2017), and subsequently the landings in weight and monetary value by species and logbook fishing trip were assigned to each c-square in proportion to the spatially estimated SAR values for the same trip. For stationary gear (GNS) the landings were distributed along the hauling track for each trip.
International fisheries landings data
Commercial fisheries data from vessels of European Union (EU) Member States (MS) including Denmark, were retrieved to identify landings in all of Skagerrak. The Fisheries Dependent Information (FDI) data origin from an EU requested annual data call (see https://dcf.ec.europa.eu/data-calls/fdi_en). Data are made publicly available on the data-dissemination website (https://stecf.ec.europa.eu/data-dissemination/fdi_en). The data submitted are by country, year, quarter, vessel length, fishing technique, métier level 6, area, EEZ indicator and species. It is possible for EU MSs to indicate if the landings data submitted are confidential. Data marked confidential (C) usually indicates situations with >3 vessels at the aggregation level of data submission. Data is published at two output levels, one that shows the total data summarized across all EU MSs, and one that shows the data at the MS level in which all confidential values are marked by a C instead of the value.
Discards data
Since 2002, a sea-observer programme has registered the discard part of the catch in a portion of the Danish commercial vessels. This discards survey data was used to calculate the discard rate of cod and plaice in the sampled fisheries (McAfee and Wigley, 2023; Håkansson and Storr-Paulsen, 2024). The spatial distribution of the discard in the Skagerrak was calculated by multiplying a discard rate per species, year, quarter and type of fishery per grid with the total landings in the Skagerrak (Dinesen et al., 2024).
Fish Data Storage Tags (DSTs)
Cod Data Storage Tag (DST) data was available from previous studies (Neuenfeldt et al., 2007, 2009) and were used in the study by Dinesen et al. (2019) to identify three thermal habitats for adult cod. These same cod thermal habitats; < 12 °C, 12–16 °C, >16 °C, were applied here.
Hunter et al. (2003) showed that plaice avoided water with temperatures above 9 °C in the English Channel throughout the year. These results were based on DST data from 7 plaice individually recording experienced temperature every 10 min during an entire year. DST data recovered from 21 plaice that had been recording for at least 1 year in the English Channel were provided by David Righton (personal contact). These data showed that single individuals briefly experienced water temperatures up to 16 °C in late summer and autumn (i.e., between the 250th−300th day in the calendar year). Approximately 5% of the temperature observations (i.e., recordings) were above 16 °C. No DST data was available for the Skagerrak, and we therefore assumed a conservative upper temperature limit of 16 °C for plaice.
Temperature model
A spatio-temporal bottom temperature dataset for mapping thermal habitats was generated by the Danish Met Office (DMI) by rerunning the NEMO4-ERGOM model in the operational configuration reanalysis setup for 2014–2022 (NEMO4-ERGOM, 2023) delivering data for Copernicus with a high spatial resolution of 1 nm for the Skagerrak, North Sea, Kattegat and western Baltic Sea, and up to 56 vertical layers, so that the variable hydrodynamics in the transition zone are well described and mesoscale structures in the hydrodynamics are well represented. This setup is well-validated against diverse sets of observations. The native model domain for the NEMO-ERGOM system covers the North Sea and Baltic Sea with open boundaries at Scotland-Norway and the English Channel. At the lateral boundaries, daily mean values from the CMEMS Northwest Shelf multi-year product (NWSHELF_MULTIYEAR_PHY_004_009, https://doi.org/10.48670/moi-00059) of sea level, temperature, salinity and horizontal velocities are used. Additionally, hourly tidal information is added at the open boundaries based on 9 tidal constituents from a tidal model. The temporal resolution in the database was 1 h for physical variables, so that direct and indirect tidal effects can be addressed. The dataset covers the entire water column for physical and biogeochemical variables. The physical model includes the effects of wave action and transport using the wave model WAM (Janssen, 2008) version 4.6.2 adapted to the Baltic Sea. The ERA5 data set available from Copernicus Climate Service is used as atmospheric forcing data for both NEMO and WAM. Both model systems run with the same bathymetry grid based on GEBCO data (GEBCO Bathymetric Compilation Group, 2013). For reanalysis, the setup used the data assimilation system PDAF (Nerger et al., 2020), with the LESTKF filter. Satellite observations of SST and in-situ profile observations were assimilated into the NEMO analysis field using the PDAF tool at every mid-night.
Thermal habitat modeling
To examine changes in the extent of thermal habitat, we integrated Danish fisheries landings data with hydrographic spatio-temporal model outputs of bottom seawater temperature. In this study, only temperature was considered as an explanatory variable of thermal habitat changes. Often, other covariates are considered, such as salinity, depth, seabed shear stress and sediment type for plaice (Lauria et al., 2008) or cod (Guan et al., 2017). However, demographic and non-equilibrium effects, as well as omitted biotic variables, limit the degree of variance explained by a simple habitat suitability model. Therefore, habitat suitability modeling is often limited to temperature variability, which is considered to be the most important covariate (e.g., Bigman et al., 2025; Cote et al., 2021; Xu et al., 2024).
Results
Issue identification
The relevant stakeholders were identified related to the human activities active in the area. Human activities included commercial fishing with different gears (e.g., beam and bottom trawling, Danish seining, gillnetting), recreational fishing, sailing and diving, tourist cruises and general tourism, military marine shooting range, agriculture and forestry and nature protection on land. The main issue concerned the conflict arising among EU commercial fishers who targeted the same resources deploying different gear types in the Jammer Bay area. Since 2006, the small-scale artisanal fishery deploying from the sandy beach in the Jammer Bay is organized in a Guild, the Thorupstrand coastal fisher Guild (in Danish “Thorupstrand Kystfiskerlaug”, www.thorupstrandfisk.dk/kystfiskerlauget/) that procures a common cooperative quota for cod and plaice fished by gill net and Danish seine (Højrup and Jul Nielsen, 2024). These local Danish fishers' perceptions of the system were brought forward and integrated into the analysis.
The DPSIR results are presented in Table 1. We identified three periods from 1997 to 2006, 2007 to 2016, and 2017 to the present, based on changes in fisheries management. Fisheries policies that influenced the Danish fisheries in the Jammer Bay included changes in management measures that affected accessibility to the quota. In 2003, a new Individual Transferable Quota (ITQ) system was introduced for pelagic fish species, including herring, and subsequently mackerel in 2006, and industrial fish species in 2008 (https://fvm.dk/arbejdsomraader/fiskeri/erhvervsfiskeri-og-akvakultur/omsaettelige-kvoter). In 2007, transferable Vessel Quota Shares (VQSs) were introduced to improve the economic efficiency of the Danish demersal fishing fleet (Dinesen et al., 2018). Quotas previously a common good with regulated open access for all registered professional fishers in Denmark became exclusively assigned to the vessel owners. This increased inequity in fishing opportunity and economic gain that was further exacerbated by quotas being traded to fewer large-vessel owners (Højrup and Jul Nielsen, 2024). This specifically impacted on the small-scale coastal fishing companies, which could not afford to purchase sufficient quotas for economic viability. To counteract this imbalance and improve conditions for small-scale fishers, a national coastal fishery policy was revised in 2017 [Danish Coastal Fisher Regulations in 2017 (in Danish “Kystfiskerordning)”, www.retsinformation.dk/eli/lta/2023/1659]. Coinciding with this new policy and the increased coastal quotas, however, cod and place landings decreased further. This was perceived by the local coastal fishers as a lack of fish in the Jammer Bay area, possibly due to competition for resources with other EU fleet segments. Thus, the focus for this study addressed sustainability of coastal fisheries in the Jammer Bay area under pressure from climate change and fishery and potential management measures. We examined whether the declined coastal landings were fisheries related, caused by regional or local changes in fish distribution, or due to changes in extent of thermal habitats.
Table 1
| DPSIR | |||
|---|---|---|---|
| Periods | 1997-2006 | 2007-2016 | 2017-present |
| Drivers | Food provision, livelihood. | Food provision, livelihood. | Food provision, livelihood. |
| Pressures | Area-based and time-limited fishing “quota” system (ration fishery, days at sea) - management system inflexible and untransparent. 2003: ITQ for herring. 2006: ITQ for mackerel. | 2007: VQSs for demersal fish species (to reduce over-fishing, over-capacity and unprofitability of the fishing fleet, increase economic viability and management transparency and profitability. 2008: ITQs for industrial fish species. 2008: Global economic crisis and recession. |
Increase of coastal, open-ended VQSs (to mitigate uneven quota distribution), increased competition with foreign fleet with larger vessels and capacity (displacement). |
| State | Declining fish stocks. | Declining fish stocks | Climate change induced redistribution of fish stocks. |
| Impact | Local competition for fish (but economically viable for the individual fisher), time-limited access to fish, uncertainty regarding fishery management plans. | Expropriation of the commons resulting in insufficient access to quotas due to 1000-fold increase in value. | Sufficient quota, but decline of target species (plaice, cod) within their fishing range, increase of warm-water species (sole), displacement of fishing. |
| Response | Developed a lobby to mitigate competition from beam trawlers, and to avoid ITQ implementation | Formed a local common quota fishers guild formalized through a cooperative company, strengthening of lobby for neocultivation of a self-employed life mode to preserve coastal rural communities, upgraded local fish processing facilities and industry | Lobby increased focus on local self-employed life mode, and development of system sustainability incorporating all four pillars (ecological, social, cultural and economic concerns), MSP and MPA possibilities explored, developed collaboration with environmental NGO's, joined new sustainable fishing organization for low impact coastal fishers (FSK) |
The issue identified by the DPSIR (Drivers, Pressures, State, Impact, Response), to decide on the pertinent pressures and state of the system.
ITQ, Individual Transferable Quota (in Danish IOK “Individuelle Overdragelige Kvoter”); VQS, Vessel Quota Share (in Danish FKA “Fartøjskvoteandele”); MSP, Maritime Spatial Planning; MPA, Marine Protected Areas; NGO, Non-Governmental Organization; FSK, Foreningen for Skånsomt Kystfiskeri (in English “The Association for Sustainable Coastal Fishing”).
Landings, fishing effort and quotas
The landings data were used at the Danish national level, referred to as Danish vessels or fleet, and at the EU level, referred to as the EU vessels. The latter includes the fleets of all EU Member States, including the Danish.
Cod landings and quotas
Annual cod landings by EU vessels in the Skagerrak were around 5,000 tons from 2014 to 2018, whereafter they declined to below 2,000 tons (Figures 3A, C, E, G). The Danish landings dominated in all years (Figure 3A) and followed the same trend with Danish otter trawl (Figure 3C) and Danish Seine (Figure 3E) constituting nearly half of landed cod.
Figure 3

Total EU and national annual landings of cod (A, C, E, G) and plaice (B, D, F, H) from the Skagerrak (ICES area 3.a.20) reported by the European Union (EU) Member States (MS) for the period 2014–2022. Landings in tons by year and country based on FDI (Fisheries Dependent Information) data reported by MS (where data indicated as confidential are not available), and data aggregated across all MS (including confidential data but with MS made anonymous). The difference between the two data sources is marked by gray, which represents “MS unknown”. Member States include: blue, Denmark; green, Germany; orange, the Netherlands; yellow, Sweden and purple, United Kingdom. Gear métiers include: (A, B) All gears; (C, D) OTB_DEF, otter trawl for demersal fish species; (E, F) SDN_DEF, Danish seine for demersal fish; (G) OTB_CRU, otter trawl for crustaceans, and (H) TBB_DEF, beam trawl for demersal fish.
The cod quotas decreased dramatically from 18,000 tons in 1996 to 3,000 tons in 2003, reflecting a strong decline in the population (see Supplementary Table S1). The quota was efficiently fished from 2001 until 2016. With the introduction of the Danish Coastal Fisher Regulations in 2017, the Skagerrak cod quota for coastal fishers was raised. Despite the higher quota, the landings remained at the same low level, thus only utilizing 60–70% of the quota from 2017 to 2019. Since 2020, both quota and landings further declined to below 2,000 tons. The reason for the fluctuation of the quota utilization seems to be due to changes in the quota rather than the landings levels.
Plaice landings and quotas
The Danish plaice landings dominated in all years observed (Figures 3B, D, F, H). Annual plaice landings by EU vessels in the Skagerrak were between 9,000 and 10,000 tons from 2014–2016 (Figure 3B). During this period Danish Seine (Figure 3F) and otter trawl (Figure 3D) vessels landed the majority of plaice. In 2016, the Dutch landings by beam trawls peaked due to a several fold increase in effort. The following year (in 2017), the Danish Seine landings declined despite an unchanged effort. From 2018 to 2022, plaice landings declined. Decline in otter trawl landings coincided with lower effort, whereas Danish seine maintained the effort, but observed a decline in landings. The Dutch landings by beam trawling again increased effort in 2019, reflected in high landings (Figure 3H). In the following years a declining trend was observed in both effort and landings.
The Danish plaice quotas were relatively stable at 10,000 tons from 1996to 2000, after which it was reduced to around 6–8,000 tons until 2016 (see Supplementary Table S1). Despite the quota levels between 1996 and 2016, catch landings were stable at around 5,000–8,000 tons. Thus, the quota usage was close to 100% between 2001 and 2016. With the revision of the Danish Coastal Fisher Regulation, the coastal quotas were raised to between 12,000 and 14,000 tons. Coinciding with the increased quota, total annual catch landings declined dramatically to just over 2,000 tons in 2023. This demonstrated the increasing difficulty to fish up the quota with utilization declining to 40% in 2017 and further to 20% in 2023.
Fish distribution
General trends in changes of cod distribution in the winter months (Q1, Jan to March 2005–2022) in the Greater North Sea area showed a clear shift in distribution since 2012 with low abundances in the south-east and higher abundances to the north-west (see Supplementary Figure S1). A similar trend in plaice distribution in the greater North Sea area observed (see Supplementary Figure S2). This was more noticeable in the summer months (Q3, July to September 2005–2022) than in the winter months.
The abundance of larger cod in the Jammer Bay was lower in recent years and lower in the summer months than in the winter months, possibly due to a more dispersed distribution of the feeding cod (Figures 4A, B). During several years with a peak in 2016, adult cod abundance distribution in the winter months was highest in the eastern Skagerrak (see Supplementary Figure S3). The relative abundance of juvenile cod is significantly higher in the summer months compared to the winter months (Figures 4C, D) and evenly distributed throughout Skagerrak (see Supplementary Figure S3). The higher abundance during the summer months possibly reflects that the age-0 cod are now large enough to be caught in the fish surveys. Their presence in the Jammer Bay indicated that the deeper, offshore areas may be important cod nursery grounds. Nursery grounds for fish generally refer to those areas which are suitable for juvenile fish to grow and live in and mostly refer to age-0 fish (Gibson, 1994; Seitz et al., 2014). Here, we use a broader definition for nursery areas to include those areas occupied by older juveniles, i.e., age-1 and age-2 fish, which are generally pre-adult fish (herein referred to as juveniles). These would be discarded if caught in the fisheries as they are below the allowed landing size. It should be noted that no fisheries survey data were available from the near-shore, shallow areas (Figure 1B). Due to this lack of data, it is unclear whether the near-shore areas function as cod nursery grounds.
Figure 4

Abundance index of density of cod at different spatial scales covering the Southern and central North Sea (blue, ICES area IVbc), northern North Sea (green, ICES area IVa), Kattegat and the Sound (purple, ICES area 2123) and the Jammer Bay area (black, ICES statistical rectangles 43F8, 43F9, 44F8, 44F9). Cod abundances of allowable landing size (Large: body length ≥30 cm) between (A) January - March (Q1) and (B) July-September (Q3); and undersized cod (Small: body length <30 cm) in (C) Q1 and (D) Q3.
Large plaice were abundant in the Jammer Bay area but mostly in areas shallower than 100 m depth and significantly more abundant in the summer months compared to the winter months with a clear decline from 2018 to 2022 (Figures 5A, B). Juvenile plaice were more abundant in the Jammer Bay area in the summer than in the winter (Figures 5C, D). Within the Skagerrak, juvenile plaice were more abundant in the Jammer Bay area as compared to the rest of Skagerrak (see Supplementary Figure S3). These results indicated that the central and offshore areas of the Jammer Bay may be important areas for juvenile fish (i.e., age-1 and age-2) plaice. As mentioned above for cod, fisheries survey sampling does not take place in the near-shore shallow areas of the ICES rectangles. Thus, with no fisheries survey data available, it was not possible to identify where age-0 plaice were located, or if the near-shore areas function as nursery grounds for age-0 plaice.
Figure 5

Abundance index of density of plaice at different spatial scales covering the Southern and central North Sea (blue, ICES area IVbc), northern North Sea (green, ICES area IVa), Kattegat and the Sound (purple, ICES area 2123) and the Jammer Bay area (black, ICES statistical rectangles 43F8, 43F9, 44F8, 44F9). Plaice abundances of allowable landings size (Large: body length ≥27 cm) in (A) from January - March (Q1) and (B) July-September (Q3); and undersized plaice (Small: body length <27 cm) in (C) Q1 and (D) Q3.
Thermal habitats
The results from the hydrographic model showed that warm bottom seawater above 16 °C occurred coastally between June and October during the period 2014–2022. However, the geographic extent of the occurrence and the temperature magnitude varied between years (see Supplementary Figure S4). In most years, warming to between 12 and 16 °C occurred in June and July. Peak warming to above 16 °C occurred in August and September whereafter bottom waters cooled down to between 12 and 16 °C in October to November. It is worth noting that the extent and duration of sea bottom temperature above 16 °C was lower in the last 2 years, 2021–2022, compared to earlier years.
The fisheries survey data was too sparce in the near coastal areas to analyze thermal habitats. We therefore used the fisheries landings data from the Danish fleet in the Jammer Bay area in combination with the hydrographic model outputs of bottom seawater temperatures.
Cod thermal habitats
Total Danish annual cod landings per gear for the period 2014–2022 in the Jammer Bay are shown in Figure 6. Otter trawl landings dominated all years, with a high peak in 2018.
Figure 6

Danish fleet cod landings (in kg) by year and métiers in the Jammer Bay area 2014–2022. GNS (black, gillnets), OTB (red, otter trawls), Other (blue, other gears), and SDN (turquoise, Danish seines).
The GAM analyses showed that the landings of the gears examined (i.e., OTB, SDN, GNS) occurred at temperatures between 7 and 16 °C (Figure 7, All gears). This temperature range can be interpreted from the diagram (Figure 7), where the values above the zero line together with a narrow confidence interval (gray band: 95% CI) signify sufficient data and a reliable result. No cod landings were observed at bottom water temperatures above 16 °C, which reflects well the thermal boundaries set for cod. At temperatures between 7 and 11 °C, cod landings were above average in general and by Otter trawl, reflecting that most cod were caught by otter trawl (Figures 7, OTB). Fewer cod were caught by Danish seines with above average landings between 10 and 11 °C (Figure 7, SDN). Gill net fishery showed a different pattern with above average cod landings ranging from 10 to 14 °C (Figure 7, GNS).
Figure 7

Danish fleet cod landings in the Jammer Bay area 2014–2022. Estimated partial effect of bottom seawater temperature on cod landings weight (black curve) for the fishing gear métiers: All gears, OTB (otter trawls), SDN (Danish seines) and GNS (gillnets). Gray areas indicate 95% confidence interval. The red curves show the proportional distribution of landings data across bottom seawater temperature.
Plaice thermal habitats
During the years 2014–2016 Danish seine dominated the landings of plaice, whereafter landings were more evenly distributed between Danish seine and otter trawl (Figure 8). The GAMs showed that plaice landings data occurred at temperatures between 5 and 18 °C (Figure 9, All gears). The maximum temperature at which plaice landings occurred was not as defined as for cod. Otter trawl landings showed two peak landings above average between 5 and 7 °C and 11–18 °C (Figure 9, OTB). Danish seine landings above average occurred between 10 and 16 °C (Figure 9, SDN). Gillnet fishery showed a different pattern with above average landings between 6 and 15 °C (Figure 9, GNS).
Figure 8

Danish fleet plaice landings (in kg) by year and métiers in the Jammer Bay area 2014–2022. GNS (black, gillnets), OTB (red, otter trawls), Other (blue, other gears), and SDN (turquoise, Danish seines).
Figure 9

Danish fleet plaice landings in the Jammer Bay area 2014–2022. Estimated partial effect of bottom seawater temperature on plaice landings weight (black curve) for the fishing gear métiers: All gears, OTB (otter trawls), SDN (Danish seines) and GNS (gillnets). Gray areas indicate the 95% confidence interval. The red curves show the proportional distribution of landings data across bottom seawater temperature.
Detailed GAMs of all months (January-December) averaged over all years for each gear showed landings at higher temperatures by otter trawl and Danish seine than by gillnet fishery (Figure 10). The landing maximum in cold waters at 7 °C reflects the winter fishery from December to April during the plaice spawning season. On the other hand, the warm landing maximum above 16 °C occurred from July to September.
Figure 10
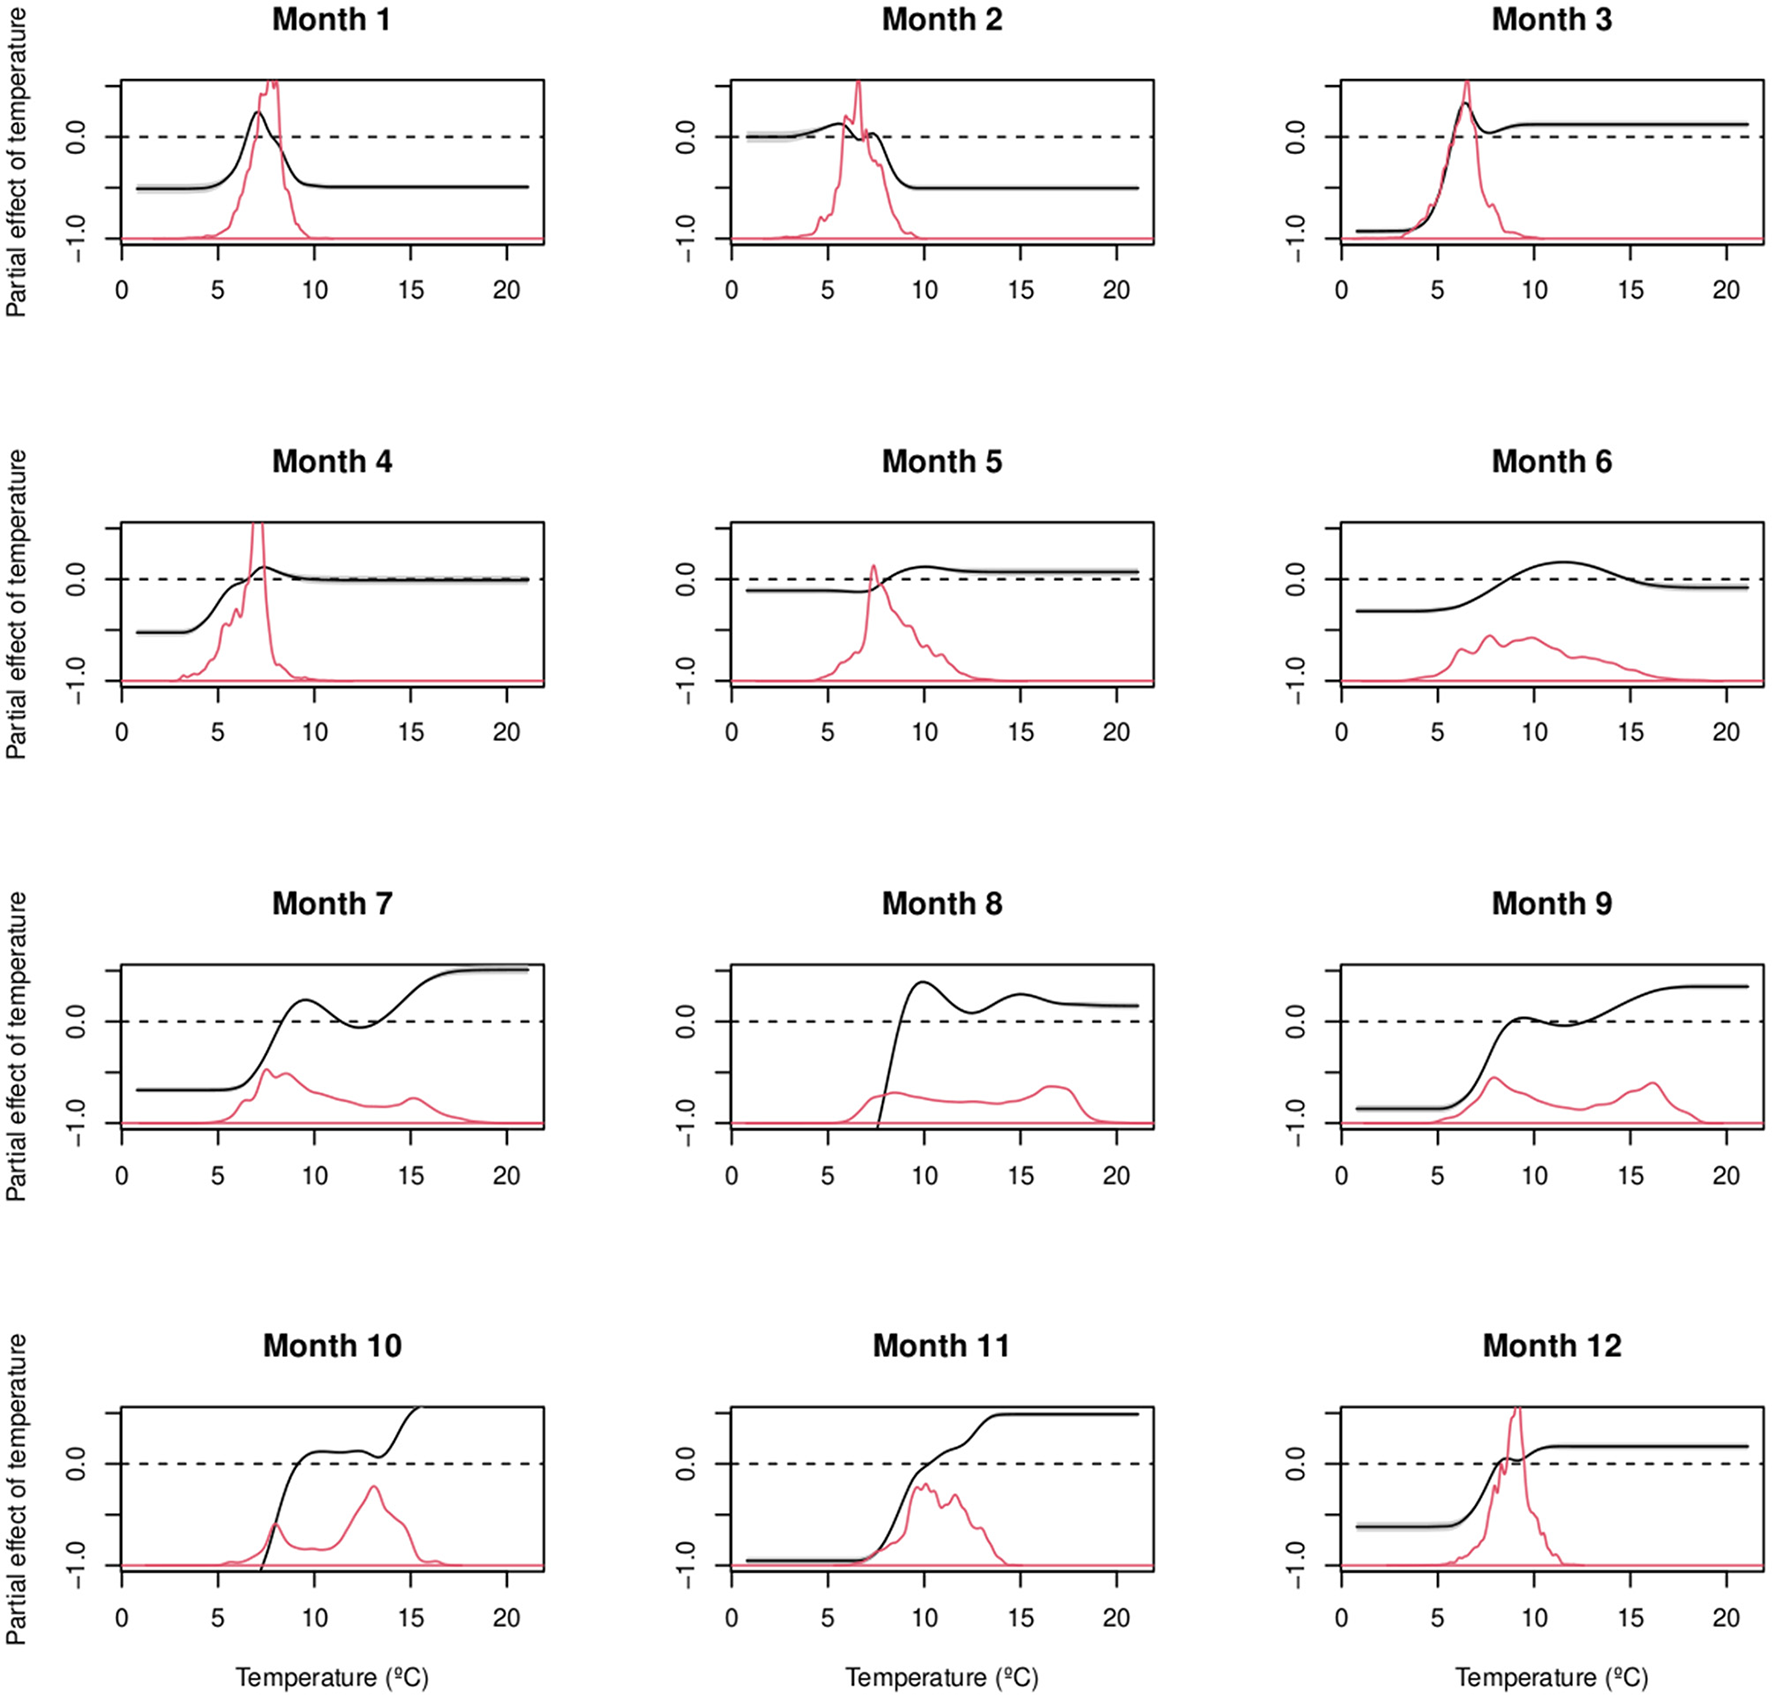
Danish fleet plaice landings by month in the Jammer Bay area 2014–2022. Estimated partial effect of bottom seawater temperature on cod landings weight (black curve) for All gears by month (1–12) from January to December. Gray areas indicate the 95% confidence interval. The red curves show the proportional distribution of landings data across bottom seawater temperature.
Distribution of landings and discards in the Skagerrak
Discard survey data averaged around 1% of the total fishery for cod and plaice. The maps in Figures 11, 12 therefore show the discards and corresponding landings from the survey trips registering the discards.
Figure 11

Distribution of the Danish fleet cod discards and landings (tons) in the Skagerrak 2015–2022 from the discards survey. The figure only shows data from the fisheries covered in the Danish discards survey.
Figure 12

Distribution of the Danish fleet plaice landings and discards (tons) in the Skagerrak 2015–2022 from the discards survey. The figure only shows data from the fisheries covered in the Danish discards survey.
Cod
The distribution of the Danish fleet in the Skagerrak showed that most cod discards in the years 2015–2022 derived from the outer shelf and slope area of the Norwegian trench (Figure 11). The Discard ratio for cod was highest (on average 45%) in the small mesh-sized otter trawls.
Plaice
The distribution of the Danish fleet in the Skagerrak showed that most plaice discards in the years 2015–2022 derived from the coastal areas of Jammer Bay and Tannis Bay and toward the shelf edge (Figure 12). The discard ratio for plaice was highest (on average 47%) in the small mesh-sized otter trawls.
Discussion
In this study we examined whether declines in coastal landings of cod and plaice were fisheries related, caused by regional or local changes in fish distribution, due to changes in extent of thermal habitats or a combination of these causes. Regional changes in the distribution of large cod and plaice from the south-central toward the northern North Sea were evident. Juvenile fish of cod and plaice were more abundant in the Jammer Bay area compared to the North Sea and Kattegat areas. Their occurrence coincides with the areas that are intensively fished, which is reflected in the high discards of both cod and plaice in the area (see results highlights in Table 2). These results point to the need to implement protection measures for the juvenile fish of both species. Implementation of an OECM seems the most suitable management measure as it would allow spatial closures that protect the juvenile fish while maintaining the fisheries. Furthermore, an OECM of seasonal or permanent closures could also improve the general biodiversity in the area (FAO, 2022).
Table 2
| Outputs | Species | Figure no. | Highlights of the results |
|---|---|---|---|
| Abundance distribution 2005–2022 (Greater North Sea) | Cod | 4 | Adult abundance distribution peaked in 2015–2016 but was lower in recent years in most areas. Abundance was low in all years and seasons in the southern North Sea. Juvenile abundance distribution was generally low in the winter months, but high during the summer months in the Jammer Bay area. |
| S3 | Adult abundance distribution was higher in the eastern Skagerrak in some winters but even across the Skagerrak during summer. Juvenile abundance distribution was even across the Skagerrak and highest during the summer months. | ||
| S1 | Adult abundance distribution in the Greater North Sea changed in a north-westerly direction between 2005 and 2022. | ||
| Plaice | 5 | Adult and juvenile abundance distributions were higher in the summer months in the Jammer Bay. Adult abundance declined from 2018 to 2022. | |
| S3 | Juvenile abundance distribution was higher in the Jammer Bay than in the Greater North Sea areas, including eastern Skagerrak. | ||
| S2 | North-westerly direction in change of distribution. | ||
| EU MS fisheries landings 2014–2022 (Skagerrak) | Cod | 3 | Landings primarily by Danish vessel, with a smaller proportion by Swedish vessels. |
| Plaice | 3 | Landings primarily by Danish vessels, with a significant proportion by Dutch vessels especially from 2018. | |
| DK landings by métier 2013–2022 (Jammer Bay area) | Cod | 6 | Otter trawls dominated landings by the Danish fleet. |
| Plaice | 8 | Danish seine dominated landings by the Danish fleet. | |
| Temperature effects on DK landings 2014–2022 (Jammer Bay area) | Cod | 7 | Landings by all gears originated from bottom water temperatures between 7 and 16 °C. |
| Plaice | 9 | Landings by all gears originated from bottom water temperatures between 5 and 18 °C. | |
| 10 | Gillnet landings from December to April at temperatures below 7 °C. Danish seine and otter trawl landings from July to September at maximum temperatures above 16 °C. | ||
| Thermal seabed habitats distribution 2014–2022 (Jammer Bay area) | Cod | S4 | Supported. The thermal habitat boundaries set to below 12 °C for suitable habitats and above 16 °C for unsuitable habitats were supported by the GAM results (Figure 7) of thermal effects on cod landings in the Jammer Bay area. |
| Plaice | S4 | Not supported. The upper thermal habitat boundary set to above 16 °C was not clearly reflected by the GAM results (Figures 9, 10) of thermal effects on plaice landings in the Jammer Bay area. | |
| DK landings and discards 2015–2022 (Skagerrak) | Cod | 11 | Discards ratio was highest for otter trawling on the outer shelf and slope area of the Norwegian trench (toward the border between the Danish and Norwegian EEZ). |
| Plaice | 12 | Discards ratio was highest for otter trawling in the coastal areas of the Jammer Bay and toward the shelf edge. |
Summary of the outputs presented in Figure 2, with reference to the relevant figure numbers and highlights of the results for cod (Gadus morhua) and plaice (Pleuronectes platessa).
EU MS, European Union Member States (all, including Denmark); DK, Danish; EEZ, Exclusive Economic Zone.
System changes perceived by users
The Thorupstrand Guild fishers in the Jammer Bay area are dependent on a continuing high coastal abundance of cod and plaice which are caught with gillnets and Danish seines. The recent declines in landings and the inability to catch the allocated quota in the area has given rise to concern about the future ability to operate. Failure to meet minimum 25% of the annual quota may lead to loss of the Guild's fishing license. Furthermore, a minimum number of Guild members are required to maintain the Guild's license and pay the interests and debt to the bank. This concern among the Guild fishers has given rise to conflicts with other fishery sectors, especially with foreign fleets that fish with heavy mobile bottom-contacting gears on the coastal fishing grounds scrambling for the same resources.
The ITQs introduced in 2007 [Danish Agrifish Agency (NaturErhverv), 2015], was intended toward economic efficiency of the Danish fisheries fleet. However, the change toward fewer and larger vessels and gears in the area resulted in spatial displacement rendering the sustainability of transferable quotas (i.e., ITQs and VQSs) questionable (Dinesen et al., 2018). As we do not yet have spatially explicit stock assessment at local scales it is not possible to manage quota allocations on a fine scale, particularly in coastal areas. Furthermore, local ecological, social and economic impacts are then difficult to integrate in EBM measures.
Adult cod distribution
During the period of this study (2014–2022), the cod stock in the Skagerrak (ICES Subdivision 20) was assessed as one sub-stocks (ICES, 2023, 2024). The declining cod landings in the Jammer Bay area may in part be explained by the overall change in distribution of large cod and the declined abundance in recent years in the Jammer Bay area. The results reflect well the fishers' perception that cod had moved offshore toward the northwest in the North Sea and there was a lack of cod in near-coastal waters in recent decades (Støttrup et al., 2014). A study where Baltic Sea fishers were unable to catch their cod quota showed a significant link between declining landings and suitable thermal habitats, thereby highlighting a mismatch between spatial allocation of quotas and local fish distribution as a challenge to adaptive management (Dinesen et al., 2019). Behavioral responses to climate change were observed in adult cod in the Skagerrak with changes in depth use and activity level (Freitas et al., 2015). A similar development may have occurred for Atlantic cod in the Jammer Bay.
Adult cod thermal habitat
In the Jammer Bay area, the fact that no large cod landed by the Danish fisheries were caught in sea bottom temperatures above 16 °C indicated an upper thermal habitat boundary. Optimal temperature for cod growth decreases with increasing body size (Imsland et al., 1996; Björnsson et al., 2001; Björnsson and Steinarsson, 2002; Peck et al., 2003). From laboratory experiments the optimum temperatures for maximum growth was established at 17 °C for juvenile Atlantic cod < 10 cm, decreasing to 13 °C for 15 cm cod and 8-9 °C for adult (mature) cod (Björnsson et al., 2001). However, this information on optima for growth does not indicate thermal preferences or thermal tolerance. Indeed, cod may occupy waters with higher temperatures than their thermal growth optima (Neat and Righton, 2007) but may experience thermal limitation in metabolic rates (Chung et al., 2021). The avoidance of bottom seawater temperatures above 16 °C and low tolerance for temperatures above 12 °C in adult cod was demonstrated from field work using DST (DST ref.). The combination of landings data and hydrographic model outputs revealed thermal habitat upper boundary for large cod in the Jammer Bay area similar to that observed for the Baltic Sea (Dinesen et al., 2019).
In the Jammer Bay, the spatial distribution of high bottom temperatures correlates with decline of cod landings. This suggests that suitable adult cod habitats have diminished in the coastal waters of Jammer Bay area. This may negatively affect the Guild fisheries that set to sea from, and land their boat on, the beach and only conduct day-fishing trips with their relatively small vessels (Højrup and Jul Nielsen, 2024). The preference of large cod for colder waters (< 12 °C) was evident in the landings data of the otter trawl and Danish seine. Most of the cod caught between 12 °C and 16 °C were caught in the gillnet fishery. Gillnets are static gears and catch fish that move around (Lobyrev and Hoffman, 2023), suggesting that these cod were searching for food possibly due to foraging excursions within that temperature range (Righton et al., 2010).
Juvenile cod distribution and discards risks
The occurrence of annual high abundances of juvenile cod in the deeper offshore areas of the Jammer Bay area indicated that this may be a nursery area. Nursery areas are “a part of the habitat where the growth and survival of the young (juveniles) are enhanced” (Gibson, 1994). Optimal nursery habitats function as on-growth grounds for age-1 and age-2 juveniles, where food availability and low predation pressure are the two main determining factors, but where appropriate environmental conditions for growth also play a role (Gibson, 1994). Among these environmental factors, temperature is an important growth controlling factor where the optimal temperature decreases with length (Brander, 1994; Björnsson and Steinarsson, 2002).
Adult plaice distribution
Fisheries management often encompasses large geographical areas that may not match the ecological or genetic structure of the fish population (Reiss et al., 2009). In 2010, the stock assessment was deemed unreliable because of the mix of different sub-stocks and the inability to track cohorts in the catch-at-age matrix (ICES, 2010). In a benchmark in 2015 (ICES, 2015), it was decided to assess plaice in the Skagerrak as part of the North Sea stock because Skagerrak seemed to provide habitat for adult North Sea plaice, and a local population. The presence of distinct plaice populations in the Skagerrak and in the Kattegat was confirmed in a study by Ulrich et al. (2013). These stocks are separate from the neighboring areas in the North Sea and the Baltic Sea, with strong natal spawning regions and mixing on the feeding and nursery grounds. The implications of this management are that the Skagerrak stock risks over-fishing where the quotas remain high guided by the abundance of the North Sea plaice stock. This may be the case in the Jammer Bay area reflecting the Guild fishers perception of high abundance of large plaice in the Jammer Bay during the summer months that declined in recent years.
Adult plaice thermal habitat
The combination of landings data and hydrographic model outputs did not reveal an upper thermal habitat boundary for large plaice in the Jammer Bay area. The plaice landings data in this study suggest that plaice is caught in slightly warmer waters when bottom trawled than when caught in gillnets. According to the fishers Danish seining for plaice is deployed only from May to November, whereas in the winter month plaice fishery is by gillnets. In this study, plaice were caught in warmer waters up to 18 °C which exceeds the upper temperature limits of 16 °C suggested by DST data from the English Channel (David Righton, pers.com.). It is possible at higher temperatures that large plaice become lethargic and do not actively forage, rendering them more susceptible to catches in trawls.
Juvenile plaice distribution and discards risks
Historically, the Danish coast of the Skagerrak, North Sea and the Wadden Sea in the south functioned as important nursery areas for plaice including age-0 plaice (Johansen, 1908; van der Veer, 1986; van der Veer et al., 1990; Zijlstra et al., 1982). Unfortunately, the international survey data does not cover near-coastal areas which function as spawning grounds, juvenile habitats and foraging areas for numerous fish species (Beck et al., 2001; Seitz et al., 2014). Few studies have focused on the plaice in the Skagerrak, but around the turn of the century, it was noted that most plaice juveniles were concentrated in the southern North Sea, Wadden Sea and German Bight [ICES FishMap, (plaice)].
Juvenile plaice have higher temperature tolerances than their adult conspecifics and can inhabit the warmer, shallow coastal areas and maximize growth during the summer and autumn (Fonds et al., 1992). However, if these areas have become warmer during the feeding months due to climate change, these areas may no longer be ideal as nursery areas. The first observations of an offshore shift in juvenile distribution were made in the late 1990s for age-1 plaice away from the Wadden Sea (van Keeken et al., 2007; Engelhard et al., 2011). Increased seawater temperature was implicated in this offshore shift, although changes in coastal predation pressures may also have played a role (van Keeken et al., 2007). Thus, in the recent decades, the Wadden Sea no longer functions as a nursery area (van der Veer et al., 2011, 2022). Along the Danish North Sea coast, the offshore shift in plaice abundance reduced the effectiveness of the Plaice Box established in 1989 in the North Sea to reduce bycatch of juvenile plaice and subsequent discard mortality (Pastoors et al., 2000; van Keeken et al., 2007).
In this study, we focused on the abundance distribution of juvenile plaice (age-1 and age-2) recorded in the fisheries surveys. Juvenile plaice in the Skagerrak are primarily concentrated in the Jammer Bay area. High abundances of juvenile plaice were found in the central and offshore areas of the bay where intensive fisheries by mobile bottom-contacting gears also took place which may render them susceptible to higher mortalities from unwanted bycatch. An experimental study on discard survival was conducted by Noack et al. (2020). Between 2011 and 2016 in the Skagerrak, an average (weight) of 24% of the total annual catches of plaice were discarded in fishery using bottom-contacting gears (mixed fishery). When caught in Danish seines, an average of 8% was discarded. As juveniles weigh considerably less than adults, the relative numbers of juvenile fish being discarded are high. Furthermore, discard survival depended on the gear type used, with more damage to fish caught by trawlers and a higher survival for those caught by Danish seiners (Noack et al., 2020). Temperature also affected survival and difference between air and sea bottom temperature was important for survivability for fish caught in the Danish seines. On the other hand, air exposure was the most important factor for survivability when caught in trawlers. The results in our study showed where the concentration of plaice discards was located. Furthermore, despite declining landings in the Danish fleets, discards remain relatively high. Discards reported in this study and in Noack et al. (2020) do not include discards from foreign fleets operating in the area. This is a major concern as the foreign fleets use heavy bottom-contacting gears and have increased their efforts since 2019, yet it is not possible to obtain information on the discards from these fisheries. Considering the discard magnitude from the Danish fleet and the unknown discard from the foreign fleets, together with the survival potential in different gears, restrictions should be imposed to protect these juvenile grounds.
Management implications and future perspectives
The results from this study point to the need to protect juvenile fish of two of the most important commercial species in the Jammer Bay area. At the same time, local communities depend on the direct and indirect income from the fisheries in the area. These factors point to the need to implement an OECM whereby resource utilization is managed in a way that protects the same resource. Furthermore, ongoing fieldwork has produced high resolution seabed habitat data that revealed vulnerable benthic habitats (Hansen et al., 2024) and are now examining fishing effects of bottom-contacting gear on these different habitat types. An OECM in the area could include the protection of these vulnerable habitats, thus considering species biodiversity. All in all, we demonstrate the multi-faceted issues using empirical data derived from various sources where local spatial fisheries management based on the OECM criteria may be the best solution.
Establishment of an OECM to support EBFM could have the following recommendations: (i) the conservation of nursery areas for juvenile fish of commercial species should be assured toward maintaining sustainable populations; (ii) the protection of benthic habitats and invertebrate species should improve biodiversity and productivity in the area and (iii) research should focus on integrating new high-resolution data on the spatial-temporal distribution and intensity of mobile bottom contacting gears with their impacts on benthic habitats, and with unwanted bycatch of juvenile and sensitive fish species. Finally, the OECMs should be sufficiently flexible in space and time to incorporate the development of declining suitable thermal habitats for specific species.
Statements
Data availability statement
Publicly available datasets were analyzed in this study. The international fisheries survey data supporting the conclusions of this article are publicly available at the ICES Database of Trawl Surveys (DATRAS, https://www.ices.dk/data/data-portals/pages/datras.aspx). The commercial fisheries data from the Vessel Monitoring System (VMS) and logbook information can be provided at the aggregated level allowed according to the European Union General Data Protection Regulation (EU GDPR) (https://eur-lex.europa.eu/eli/reg/2016/679/oj/eng).
Ethics statement
Ethical approval was not required for the study involving animals in accordance with the local legislation and institutional requirements because animal data (fish) comprise international fisheries survey data and commercial landings data.
Author contributions
GD: Funding acquisition, Data curation, Investigation, Conceptualization, Resources, Visualization, Writing – original draft, Formal analysis, Project administration, Writing – review & editing, Validation, Methodology. SN: Formal analysis, Writing – review & editing, Methodology, Conceptualization, Writing – original draft, Investigation. CB: Formal analysis, Visualization, Investigation, Software, Validation, Writing – review & editing, Writing – original draft, Methodology, Conceptualization. AC: Methodology, Validation, Formal analysis, Supervision, Writing – original draft, Software, Writing – review & editing, Data curation. JE: Visualization, Formal analysis, Validation, Data curation, Software, Methodology, Writing – original draft, Investigation, Writing – review & editing. OE: Writing – original draft, Formal analysis, Methodology, Investigation, Writing – review & editing, Validation. JO: Validation, Software, Writing – review & editing, Formal analysis, Writing – original draft, Data curation, Methodology. MS-P: Writing – review & editing, Methodology, Writing – original draft, Formal analysis, Validation, Data curation. KBH: Writing – review & editing, Methodology, Writing – original draft, Validation, Formal analysis, Data curation. TH: Writing – original draft, Investigation, Data curation, Writing – review & editing, Methodology. SQ: Data curation, Methodology, Writing – review & editing, Investigation, Writing – original draft. KMH: Writing – original draft, Writing – review & editing, Methodology, Data curation, Investigation. JS: Writing – original draft, Investigation, Formal analysis, Visualization, Validation, Conceptualization, Methodology, Writing – review & editing.
Funding
The author(s) declare that financial support was received for the research and/or publication of this article. The work was funded by the European Union through the European Maritime and Fisheries Fund (EMFF) and the Ministry of Food, Agriculture and Fisheries of Denmark, and the Danish Maritime, Fisheries and Aquaculture Programme (EHFAF) and the Danish Fisheries Agency, respectively via the projects “Mapping of seabed habitats and impacts of beam trawling and other demersal fisheries for spatial ecosystem-based management of the Jammer Bay (JAMBAY)” (EMFF grant agreement no. 33113-B-23-189) and “Ecosystem-based spatial high-resolution tools for marine fisheries management (ECOSPACE)” (EHFAF grant agreement no. EFMBV-23-0024).
Acknowledgments
We would like to thank Dr. David Righton, Center for Environment, Fisheries and Aquaculture Science, United Kingdom (Cefas, UK), for sharing the plaice DST-data. Also, we wish to thank the editor and reviewers for their insightful and valuable comments.
Conflict of interest
The authors declare that the research was conducted in the absence of any commercial or financial relationships that could be construed as a potential conflict of interest.
The author(s) declared that they were an editorial board member of Frontiers, at the time of submission. This had no impact on the peer review process and the final decision.
Generative AI statement
The author(s) declare that no Gen AI was used in the creation of this manuscript.
Any alternative text (alt text) provided alongside figures in this article has been generated by Frontiers with the support of artificial intelligence and reasonable efforts have been made to ensure accuracy, including review by the authors wherever possible. If you identify any issues, please contact us.
Publisher’s note
All claims expressed in this article are solely those of the authors and do not necessarily represent those of their affiliated organizations, or those of the publisher, the editors and the reviewers. Any product that may be evaluated in this article, or claim that may be made by its manufacturer, is not guaranteed or endorsed by the publisher.
Supplementary material
The Supplementary Material for this article can be found online at: https://www.frontiersin.org/articles/10.3389/focsu.2025.1643289/full#supplementary-material
References
1
Beck M. W. Heck K. L. Able K. W. Childers D. L. Eggleston D. B. Bronwyn M. et al . (2001). The identification, conservation and management of estuarine and marine nurseries for fish and invertebrates. Bioscience51:633. doi: 10.1641/0006-3568(2001)051[0633:TICAMO]2.0.CO;2
2
Bigman J. S. Laurel B. J. Kearney K. Hermann A. J. Cheng W. Holsman K. K. et al . (2025). Predicting Pacific cod thermal spawning habitat in a changing climate. ICES J. Marine Sci.82:fsad096. doi: 10.1093/icesjms/fsad096
3
Björnsson B. Steinarsson A. (2002). The food-unlimited growth rate of Atlantic cod (Gadus morhua).Can. J. Fish. Aquat. Sci. 59, 494–502. doi: 10.1139/f02-028
4
Björnsson B. Steinarsson A. Oddgeirsson M. (2001). Optimal temperature for growth and feed conversion of immature cod (Gadus morhua L.).ICES J. Mar. Sci. 58, 29–38. doi: 10.1006/jmsc.2000.0986
5
Brander K. (1994). Patterns of distribution, spawning, and growth in North Atlantic COD: the utility of interregional comparisons. ICES Marine Sci. Symposia198, 406–413.
6
Chung M.-T. Mose Jørgensen K.-E. Trueman C. N. Knutsen H. Jorde P. E. Grønkjær P. (2021). First measurements of field metabolic rate in wild juvenile fishes show strong thermal sensitivity but variation between sympatric ecotypes. OIKOS130, 287–299. doi: 10.1111/oik.07647
7
Cote D. Konecny C. A. Seiden J. Hauser T. Kristiansen T. Laurel B. J. (2021). Forecasted shifts in thermal habitat for cod species in the Northwest Atlantic and Eastern Canadian Arctic. Front. Marine Sci. 8:764072. doi: 10.3389/fmars.2021.764072
8
Danish Agrifish Agency (NaturErhverv) (2015). Dansk fiskeriregulering, bilag 1 til MOF alm. del – spm, 147. Available online at: http://www.ft.dk/samling/20142/almdel/mof/spm/147/svar/1266220/1551221/index.htm (Accessed November 14, 2025).
9
Dinesen G. E. Neuenfeldt S. Kokkalis A. Lehmann A. Egekvist J. Kristensen K. et al . (2019). Cod and climate: a systems approach for sustainable fisheries management of cod (Gadus morhua) in coastal Danish waters. J. Coastal Conservat. 23, 943–958. doi: 10.1007/s11852-019-00711-0
10
Dinesen G. E. Rathje I. W. Højrup M. Bastardie F. Larsen F. Sørensen T. K. et al . (2018). Individual transferable quotas, does one size fit all? Sustainability analyses of an alternative model for quota allocation in a small-scale coastal fishery. Marine Policy88, 23–31. doi: 10.1016/j.marpol.2017.10.038
11
Dinesen G. E. Rindorf A. Egekvist J. Eigaard O. R. Støttrup J. G. (2024). Fisheries Resources and Socio-Economy (JAMBAY WP4). DTU Aqua report No. 448-2024.Kongens Lyngby: National Institute of Aquatic Resources, 179. doi: 10.11581/c21c2573-bc77-4950-a02d-af65d4c18015
12
Eigaard O. R. Bastardie F. Breen M. Dinesen G. E. Hintzen N. T. Laffargue P. et al . (2016). Estimating seabed pressure from demersal trawls, seines, and dredges based on gear design and dimensions. ICES J. Mar. Sci. 73, i27–i43. doi: 10.1093/icesjms/fsv099
13
Eigaard O. R. Bastardie F. Hintzen N. T. Buhl-Mortensen L. Buhl-Mortensen P. Catarino R. et al . (2017). The footprint of bottom trawling in European waters: distribution, intensity, and seabed integrity. ICES J. Mar. Sci. J. du Cons. 74:fsw194. doi: 10.1093/icesjms/fsw194
14
Elliott M. Burdon D. Atkins J. P. Borja A. Cormier R. de Jonge V. N. et al . (2017). And DPSIR Begat DAPSI(W)R(M)! – a unifying framework for marine environmental management. Mar. Pollut. Bull. 118, 27–40. doi: 10.1016/j.marpolbul.2017.03.049
15
Engelhard G. H. Pinnegar J. K. Kell L. T. Rijnsdorp A. D. (2011). Nine decades of North Sea sole and plaice distribution. ICES J. Mar. Sci. 68, 1090–1104. doi: 10.1093/icesjms/fsr031
16
European Commission (2023). Common Fisheries Policy (CFP). Available online at: https://oceans-and-fisheries.ec.europa.eu/policy/common-fisheries-policy-cfp_en (Accessed November 14, 2025).
17
FAO (2022). A Handbook for Identifying, Evaluating and Reporting Other Effective Area-Based Conservation Measures in Marine Fisheries. Rome: FAO.
18
Fonds M. Cronie R. Vethaak A. D. van der Puyl P. (1992). Metabolism, food-consumption and growth of plaice (Pleuronectes platessa) and flounder (Platichthys flesus) in relation to fish size and temperature. Netherlands J. Sea Res. 29, 127–143. doi: 10.1016/0077-7579(92)90014-6
19
Freitas C. Olsen E. M. Moland E. Ciannelli L. Knutsen H. (2015). Behavioral responses of Atlantic cod to sea temperature changes. Ecol. Evol. 5, 2070–2083. doi: 10.1002/ece3.1496
20
Garcia S. M. Rice J. Himes-Cornell A. Friedman K. J. Charles A. Diz D. et al . (2022). OECMs in marine capture fisheries: key implementation issues of governance, management, and biodiversity. Front. Mar. Sci. 9:920051. doi: 10.3389/fmars.2022.920051
21
GEBCO Bathymetric Compilation Group (2013). Available online at: https://www.gebco.net/ (Accessed November 14, 2025).
22
Gibson R. N. (1994). Impact of habitat quality and quantity on the recruitment of juvenile flatfishes. Netherlands J. Sea Res. 32, 191–206. doi: 10.1016/0077-7579(94)90040-X
23
Gillgren C. Støttrup J. G. Schumacher J. Dinesen G. E. (2018). Working together: collaborative decision making for sustainable integrated coastal management (ICM). J. Coast. Conservat. 23, 959–968. doi: 10.1007/s11852-018-0631-z
24
Guan L. Chen Y. Wilson J. A. (2017). Evaluating spatio-temporal variability in the habitat quality of Atlantic cod (Gadus morhua) in the Gulf of Maine. Fisher. Oceanog. 26, 83–96. doi: 10.1111/fog.12188
25
Håkansson K. Storr-Paulsen M. (2024). “Udsmid af fisk og skaldyr i dansk fiskeri 2022,” in DTU Aqua-rapport nr. 444-2024. Kongens Lyngby: Institut for Akvatiske Ressourcer, Danmarks Tekniske Universitet, 34.
26
Hansen L. Ø, Andersen, M. S. Nørgaard-Pedersen N. Christensen N. Al-Hamdana Z. Ernstsen V. B. (2024). “Geophysical mapping of seabed substrates and habitats (JAMBAY WP1),” in GEUS Report no. 2024/24. Geological survey of Denmark and Greenland, 101. Available online at: https://data.geus.dk/pure-pdf/GEUS-R_2024-24_web.pdf (Accessed November 14, 2025).
27
Højrup T. Jul Nielsen N. (2024). Life-Modes in a Changing World Order. Volume 2. Copenhagen: Aalborg University Press.
28
Hopkins T. S. Bailly D. Støttrup J. G. (2011). A systems approach framework for coastal zones. Ecol. Soc.16:25. doi: 10.5751/ES-04553-160425
29
Hunter E. Metcalfe J. D. Reynolds J. D. (2003). Migration routes and spawning area fidelity by North Sea plaice. Proc. R. Soc. Lond. B. 270, 2097–2103. doi: 10.1098/rspb.2003.2473
30
ICES (2010). “Report of the ICES Advisory Committee 2010,” in ICES Advice, 2010, Book 6, 309.
31
ICES (2015). Report of the Benchmark Workshop on Plaice (WKPLE), 23–27 February 2015, ICES Headquarters. Copenhagen: ICES CM 2015\ACOM:33, 200. Available online at: https://ices-library.figshare.com/articles/report/Report_of_the_Benchmark_Workshop_on_Plaice_WKPLE_/19255286?file=34211705 (Accessed November 14, 2025).
32
ICES (2023). Workshops on Research Needs and a Roadmap for Further Research on cod in the Northern Shelf Seas (including cod in the Celtic Seas) (WKRRCOD2). Available online at: https://ices-library.figshare.com/articles/report/Workshops_on_research_needs_and_a_roadmap_for_further_research_on_cod_in_the_Northern_Shelf_seas_including_cod_in_the_Celtic_Seas_WKRRCOD2_/24825543?file=43722597 (Accessed November 14, 2025).
33
ICES (2024). “Working group on the assessment of Demersal Stocks in the North Sea and Skagerrak (WGNSSK),” in ICES Scientific Reports. Available online at: https://ices-library.figshare.com/articles/report/Working_Group_on_the_Assessment_of_Demersal_Stocks_in_the_North_Sea_and_Skagerrak_WGNSSK_24_-_30_April_2013/19282370?file=34240808 (Accessed November 14, 2025).
34
ICES FishMap (cod) . Available online at: https://www.ices.dk/about-ICES/projects/EU-FP/EU%20Repository/ICES%20FIshMap/ICES%20FishMap%20species%20factsheet-cod.pdf (Accessed November 14 2025).
35
ICES FishMap (plaice) . Available online at: https://www.ices.dk/about-ICES/projects/EU-RFP/EU%20Repository/ICES%20FIshMap/ICES%20FishMap%20species%20factsheet-plaice.pdf (Accessed November 14 2025).
36
Imsland A. K. Sunde L. M. Folkvord A. Stefansson S. O. (1996). The interaction of temperature and fish size on growth of juvenile turbot. J. Fish Biol. 49, 926–940. doi: 10.1111/j.1095-8649.1996.tb00090.x
37
Janssen P. A. E. M. (2008). Progress in ocean wave forecasting. J. Comp. Phys. 227, 3572–3594. doi: 10.1016/j.jcp.2007.04.029
38
Johansen A. C. (1908). Contributions to the biology of the plaice with special regard to the Danish plaice-fishery. Meddelelser fra kommissionen for havundersøgelser. Serie: Fiskeri, Bind III4:48.
39
Lauria V. Vaz S. Warembourg C. Eastwood P. D. Coppin F. Carpentier A. (2008). Modelling and Mapping Fish Habitat Suitability of European Plaice (Pleuronectes platessa) in the Eastern English Channel. ASC 2008 - Theme session M. Conference contribution. Available online at: https://www.ices.dk/sites/pub/cm%20doccuments/forms/allitems.aspx?RootFolder=%2Fsites%2Fpub%2FCM%20Doccuments%2FCM%2D2008%2FM&FolderCTID=0x0120005EBB620DAE608446B85F6C23744A8054&View=%7B7439C326%2D97DB%2D46D6%2D9B07%2DE89B6D82655E%7D (Accessed November 14, 2025).
40
Lobyrev F. Hoffman M. J. (2023). A method for estimating fish density through the catches of gillnets. Fish. Manag. Ecol. 30, 24–35. doi: 10.1111/fme.12597
41
McAfee B. Wigley S. E. (2023). “2023 discard estimation, precision, and sample size analyses for 14 federally managed species groups in the waters off the northeastern United States,” in NOAA Technical Memorandum NMFS-NE-300, 181. Available online at: https://repository.library.noaa.gov/view/noaa/52087 (Accessed November 14, 2025).
42
McDermott S. Buhl-Mortensen L. Dahle G. Hart D. Haynie A. C. Johannessen T. et al . (2017). Lessons on marine protected area management in northern boreal regions from the United States and Norway. Marine Fisher. Rev. 79, 28–51. doi: 10.7755/MFR.79.1.2
43
MMO (2024). “Impact evaluation framework for Lyme Bay fisheries management measures; Final Report,” in A Report Produced for the Marine Management Organisation, MMO Project No: 1414, March 2024. Available online at: https://www.gov.uk/government/publications/impact-evaluation-framework-for-lyme-bay-fisheries-management-measures-mmo1414 (Accessed November 14, 2025).
44
Moland E. Olsen E. M. Knutsen H. Garrigou P. Espeland S. H. Kleiven A. R. et al . (2013). Lobster and cod benefit from small-scale northern marine protected areas: inference from an empirical before–after control-impact study. Proc. Roy. Soc. B-Biol Sci. 280:20122679. doi: 10.1098/rspb.2012.2679
45
Neat F. Righton D. (2007). Warm water occupancy by North Sea cod. Proc. R. Soc. B274, 789–798. doi: 10.1098/rspb.2006.0212
46
NEMO4-ERGOM (2023). Available online at: 10.48670/moi-00012; https://doi.org/10.48670/moi-00013; for validation see https://documentation.marine.copernicus.eu/QUID/CMEMS-BAL-QUID-003-011.pdf (Accessed November 14, 2025).
47
Nerger L. Tang Q. Mu L. (2020). Efficient ensemble data assimilation for coupled models with the Parallel Data Assimilation Framework: example of AWI-CM. Geoscient. Model Dev.13, 4305–4321. doi: 10.5194/gmd-13-4305-2020
48
Neuenfeldt S. Andersen K. H. Hinrichsen H.-H. (2009). Some Atlantic cod Gadus morhua in the Baltic Sea visit hypoxic water briefly but often. J. Fish. Biol.75, 290–294. doi: 10.1111/j.1095-8649.2009.02281.x
49
Neuenfeldt S. Hinrichsen H.-H. Nielsen A. Andersen K. H. (2007). Reconstructing migrations of individual cod (Gadus morhua L.) in the Baltic Sea by using electronic data storage tags. Fish. Oceanogr.16, 526–535. doi: 10.1111/j.1365-2419.2007.00458.x
50
Nielsen J. R. Ulrich C. Hegland T. J. Voss B. D. Thøgersen T. T. Bastardie F. (2013). “Critical report of current fisheries management measures implemented for the North Sea mixed demersal fisheries,” in DTU Aqua Report No. 263-2013, 263, 62. Available online at: https://www.aqua.dtu.dk/english/-/media/institutter/aqua/publikationer/forskningsrapporter_251_300/263-2013_critical_report_of_current_fisheries_management_measures.pdf (Accessed November 14, 2025).
51
Noack T. Savina E. Karlsen J. D. (2020). Survival of undersized plaice (Pleuronectes platessa) discarded in the bottom otter trawl and Danish seine mixed fisheries in Skagerrak. Marine Policy115:103852. doi: 10.1016/j.marpol.2020.103852
52
Ostrom E. (2009). A general framework for analyzing the sustainability of social-ecological systems. Science325, 419–422. doi: 10.1126/science.1172133
53
Pastoors M. A. Rijnsdorp A. D. Van Beek F. A. (2000). Effects of a partially closed area in the North Sea (“plaice box”) on stock development of plaice. ICES J. Marine Sci. 57, 1014–1022. doi: 10.1006/jmsc.2000.0586
54
Peck M. A. Buckley L. J. Caldarone E. M. Bengtson D. A. (2003). Effects of food consumption and temperature on growth rate and biochemical-based indicators of growth in early juvenile Atlantic cod (Gadus morhua) and haddock (Melanogrammus aeglefinus).Mar. Ecol. Prog. Ser. 251, 233–243. doi: 10.3354/meps251233
55
Reiss H. Hoarau G. Dickey-Collas M. Wolf W. J. (2009). Genetic population structure of marine fish: mismatch between biological and fisheries management units. Fish Fisheries10, 361–395. doi: 10.1111/j.1467-2979.2008.00324.x
56
Rice J. Moksness E. Attwood C. Brown S. K. Dahle G. Gjerde M. et al . (2012). The role of MPAs in reconciling fisheries management with conservation of biological diversity. Ocean Coast. Manag. 69, 217–230. doi: 10.1016/j.ocecoaman.2012.08.001
57
Righton D. A. Andersen K. H. Neat F. Thorsteinsson V. Steingrund P. Svedäng H. et al . (2010). Thermal niche of Atlantic cod Gadus morhua: limits, tolerance and optima. Mar. Ecol. Prog. Ser.420, 1–13. doi: 10.3354/meps08889
58
Seitz R. D. Wennhage H. Bergström U. Lipcius R. N. Ysebaert T. (2014). Ecological value of coastal habitats for commercially and ecologically important species. ICES J. Mar. Sci. 71, 648–665. doi: 10.1093/icesjms/fst152
59
Støttrup J. G. Dinesen G. E. Schumacher J. Gillgren C. Inácio M. Schernewski G. (2019). The Systems Approach Framework for collaborative, science-based management of complex systems. J. Coast. Conservat. 23, 881–898. doi: 10.1007/s11852-018-00677-5
60
Støttrup J. G. Lund H. S. Kindt-Larsen L. Egekvist J. Munk P. Stenberg C. (2014). “KYSTFISK I. Kortlægning af de kystnære fiskebestandes udvikling på basis af fiskernes egne observationer i perioden fra 1980′erne til 2013,” in DTU Aqua-Rapport No. 278-2014, 45. Availabe online at: https://www.aqua.dtu.dk/english/-/media/institutter/aqua/publikationer/forskningsrapporter_251_300/278-2014_kystfisk-i-kortlaegning-af-de-kystnaere-fiskebestandes-udvikling.pdf (Accessed November 14, 2025).
61
Ulrich C. Boje J. Cardinale M. Gatti P. LeBras Q. Andersen M. et al . (2013). Variability and connectivity of plaice populations from the Eastern North Sea to the Western Baltic Sea, and implications for assessment and management. J. Sea Res. 84, 40–48. doi: 10.1016/j.seares.2013.04.007
62
van der Veer H. W. (1986). Immigration, settlement, and density-dependent mortality of a larval and early postlarval 0-group plaice (Pleuronectes platessa) population in the western Wadden Sea. Mar. Ecol. Prog. Ser. 29, 223–236. doi: 10.3354/meps029223
63
van der Veer H. W. Koot J. Aarts G. Dekker R. Diderich W. Freitas V. et al . (2011). Long-term trends in juvenile flatfish indicate a dramatic reduction in nursery function of the Balgzand intertidal, Dutch Wadden Sea. Mar. Ecol. Prog. Ser. 434, 143–154. doi: 10.3354/meps09209
64
van der Veer H. W. Pihl L. Bergman M. J. N. (1990). Recruitment mechanisms in North Sea plaice Pleuronectes platessa. Mar. Ecol. Prog. Ser. 64, 1–12. doi: 10.3354/meps064001
65
van der Veer H. W. Tulp I. Witte J. I. J. Poiesz S. S. H. Bolle L. J. (2022). Changes in functioning of the largest coastal North Sea flatfish nursery, the Wadden Sea, over the past half century. Mar. Ecol. Prog. Ser. 693, 183–201. doi: 10.3354/meps14082
66
van Keeken O. A. van Hoppe M. Grift R. E. Rijnsdorp A. D. (2007). Changes in the spatial distribution of North Sea plaice (Pleuronectes platessa) and implications for fisheries management. J. Sea Res. 57, 187–197. doi: 10.1016/j.seares.2006.09.002
67
Vinther M. Eero M. (2013). Quantifying relative fishing impact on fish populations based on spatio-temporal overlap of fishing effort and stock density. ICES J. Marine Sci. doi: 10.1093/icesjms/fst001
68
Xu L. Feiner Z. S. Frater P. Hansen G. J. A. Ladwig R. Paukert C. P. et al . (2024). Asymmetric impacts of climate change on thermal habitat suitability for inland lake fishes. Nat. Commun.15:10273. doi: 10.1038/s41467-024-54533-2
69
Zijlstra J. J. Dapper R. Witte J. I. J. (1982). Settlement, growth and mortality of post-larval plaice (Pleuronectes platessa) in the western Wadden Sea. Netherlands Journal of Sea. Research. 15, 250–272. doi: 10.1016/0077-7579(82)90007-2
Summary
Keywords
Other Effective Area-based Conservation Measures (OECMs), Ecosystem Based Fisheries Management (EBFM), thermal benthic habitats, over-fishing, cod, plaice, Skagerrak (Greater North Sea)
Citation
Dinesen GE, Neuenfeldt S, Berg CW, Christensen A, Egekvist J, Eigaard OR, Olsen J, Storr-Paulsen M, Håkansson KB, Højrup T, Qvist Eliasen S, Hansen KM and Støttrup JG (2026) Ensuring sustainable coastal fisheries under changing climate conditions and the scramble for fish resources. Front. Ocean Sustain. 3:1643289. doi: 10.3389/focsu.2025.1643289
Received
08 June 2025
Revised
16 November 2025
Accepted
18 November 2025
Published
06 January 2026
Volume
3 - 2025
Edited by
Erlend Moksness, Blue Growth & Marine Services, Norway
Reviewed by
José Lino Vieira De Oliveira Costa, University of Lisbon, Portugal
Richard Nash, Centre for Environment, Fisheries and Aquaculture Science (CEFAS), United Kingdom
Updates
Copyright
© 2026 Dinesen, Neuenfeldt, Berg, Christensen, Egekvist, Eigaard, Olsen, Storr-Paulsen, Håkansson, Højrup, Qvist Eliasen, Hansen and Støttrup.
This is an open-access article distributed under the terms of the Creative Commons Attribution License (CC BY). The use, distribution or reproduction in other forums is permitted, provided the original author(s) and the copyright owner(s) are credited and that the original publication in this journal is cited, in accordance with accepted academic practice. No use, distribution or reproduction is permitted which does not comply with these terms.
*Correspondence: Grete Elisabeth Dinesen, gdi@aqua.dtu.dk
ORCID: Casper Willestofte Berg orcid.org/0000-0002-3812-5269; Josefine Egekvist orcid.org/0000-0001-9619-1443; Jeppe Olsen orcid.org/0009-0000-9611-8449; Marie Storr-Paulsen orcid.org/0000-0002-8701-2121; Kirsten Birch Håkansson orcid.org/0000-0002-3453-9042
Disclaimer
All claims expressed in this article are solely those of the authors and do not necessarily represent those of their affiliated organizations, or those of the publisher, the editors and the reviewers. Any product that may be evaluated in this article or claim that may be made by its manufacturer is not guaranteed or endorsed by the publisher.