 Dina Maskileyson
 Daniel Seddig
 Eldad Davidov
- 1Faculty of Management, Economics and Social Sciences, Institute of Sociology and Social Psychology, University of Cologne, Cologne, Germany
- 2Department of Sociology and URPP Social Networks, University of Zurich, Zürich, Switzerland
- 3The Minerva Center on Intersectionality in Aging, Haifa, Israel
Most of the countries in Europe are experiencing a rapid aging of their populations and with this an increase in mental health challenges due to aging. Comparative research may help countries to assess the promotion of healthy aging in general, and mentally healthy aging in particular, and explore ways for adapting mental health policy measures. However, the comparative study of mental health indicators requires that the groups understand the survey questions inquiring about their mental health in the same way and display similar response patterns. Otherwise, observed differences in perceived mental health may not reflect true differences but rather cultural bias in the health measures. To date, research on cross-country equivalence of depression measures among older populations has received very limited attention. Thus, there is a growing need for the cross-country validation of existing depression measures using samples of the older population and establishing measurement equivalence of the assessment tools. Indeed, insights on mental health outcomes and how they compare across societies is paramount to inform policy makers seeking to improve mental health conditions of the populations. This study, therefore, aims to examine measurement equivalence of self-reported depressive symptoms among older populations in 17 European countries and Israel. The data for the current analysis are from the sixth wave (2015) of the Survey on Health, Ageing and Retirement in Europe (SHARE) and consist of the population of respondents 50 years of age and older. The measurement of depression is based on the EURO-D scale, which was developed by a European consortium. It identifies existing depressive symptoms and consists of the 12 items: depression, pessimism, suicidality, guilt, sleep, interest, irritability, appetite, fatigue, concentration, enjoyment, and tearfulness. We examine the cross-country comparability of these data by testing for measurement equivalence using multigroup confirmatory factor analysis (MGCFA) and alignment. Our findings reveal partial equivalence thus allowing us to draw meaningful conclusions on similarities and differences among the older population across 18 countries on the EURO-D measure of depression. Findings are discussed in light of policy implications for universal access to mental health care across countries.
Introduction
Most of the countries in Europe are experiencing the rapid aging of their populations that is accompanied by an increase in mental illness challenges due to aging (Chiu et al., 2017). Indeed, depression is one of the predominant mental disorders in old age (Blazer et al., 1987; Blazer, 2003). Therefore, a coherent and focused public health response is required to promote healthy aging across nations (Beard et al., 2016). Since the examination of mental health requires the exposure of personal feelings and emotions, the concept of depression for older adults may vary greatly across cultures. Thus, one of the biggest methodological challenges encountered in cross-national studies is to ensure the equivalence of mental health measurements across different national or cultural samples. Namely, the comparative study of depressive symptoms requires that the various groups understand the survey questions inquiring about their mental health in the same way and respond to them in a similar manner. Otherwise, observed differences in depression may not reflect true differences but rather cultural bias in the underlying measures. To date, only few researchers have considered this issue (e.g., Castro-Costa et al., 2008).
While several studies tried to assess and compare mental health across older populations in Europe (e.g., Castro-Costa et al., 2008; Fried 2015), findings on the incidence of mental health disorders among elderly are inconsistent (Alonso et al., 2004; Copeland et al., 2004; Andreas et al., 2017). Such inconsistency can be attributed not only to the cultural differences but also to a lack of measurement equivalence across different groups of older adults (e.g., Castro-Costa et al., 2008). That is to say, essential questions on precisely how to assess mental health and depression of the elderly populations are still unresolved, making policy evaluation and implementation difficult (Graeff-Buhl-Nielsen et al., 2020). Indeed, mental health indicators must provide policy makers seeking to improve mental health of the populations with meaningful and relevant information. Therefore, there is a growing need for a cross-country validation of existing mental health measures using samples of the older population and establishing measurement equivalence of the assessment tools. Moreover, the number of general cross-national health surveys that include mental health measures is constantly growing (e.g., Harpham et al., 2003). There is a need for valid mental health measures that provide policy makers and health care providers the information they require to address the potential gaps among population groups at the local and national levels.
This study aims to bridge this gap by examining the comparability of self-reported depressive symptoms among the older population in 17 European countries and Israel. The data for the analysis derive from the sixth wave (2015) of the Survey on Health, Ageing and Retirement in Europe (SHARE) and consist of the population of respondents aged 50 years and older. For our analysis, we selected EURO-D scale developed by a European consortium (Prince et al., 1999b), because it is one of the commonly used measures of depression among older adults (Copeland et al., 2004; Castro-Costa et al., 2008). The EURO-D scale identifies existing depressive symptoms and consists of 12 items assessing depression, pessimism, suicidality, guilt, sleep, interest, irritability, appetite, fatigue, concentration, enjoyment, and tearfulness.
The current study contributes to the literature on mental health in older age by providing an examination of whether one of the most the widely accepted measurement tools to assess depression displays equivalent measurement characteristics across 18 countries, thus enabling researchers to draw valid comparisons of mental health among various cultural members of the older population. Specifically, the results of this study present policy makers and health care providers with valid information on the comparability of EURO-D scale. This can help them to apply effective strategies to improve health care provision and reduce mental health disparities among groups.
In the following, we first review previous research on the comparability of measures of mental health. Second, we discuss the data sources, measurements of depression, and methods used in this article to assess measurement invariance. Third, we provide results from exploratory factor analysis (EFA), multigroup confirmatory factor analysis (MGCFA), and alignment to test the comparability of the mental health measures. Finally, we discuss the findings in light of national policy implications.
Theoretical Background
Mental health experts have long been addressing late-life depression and its consequences for the quality of life (Blazer, 2003). They emphasize that depression includes a large and heterogeneous number of symptoms that have direct causal effect on each other (Fried, 2015). For example, sleep disturbances may cause tiredness, which may then lead to a condition of poor psychomotor fitness, rendering the patients susceptible to a low level of concentration elicited by their sleep disturbances (Fried, 2015). In depression research, depressive symptoms are usually estimated using rating scales and added together to create sum-score indices. The EURO-D is an example of a frequently used and validated scale to measure depressive symptoms in adults (Marques et al., 2020; Santini et al., 2020). For example, Portellano-Ortiz et al. (2018) used the EURO-D scale to compare the presence of depressive symptoms across populations in 15 European countries. The authors found that having a poorer self-perception of health, being female, experiencing economic difficulties and widowhood, maintaining low levels of activity and exercise, and having a lower educational level were associated with higher depressive symptomatology. Similarly, Belvederi Murri et al. (2020) used the EURO-D scale to examine depressive symptoms in later life in 19 European countries. Richardson et al. (2020) explored cross-national variations in sociodemographic inequalities in depression among older populations in 18 countries using the EURO-D scale.
To allow a meaningful interpretation of similarities and differences in the scores of the scale in cross-country comparative studies, it must measure a single construct and be equivalent across different country samples (Castro-Costa et al., 2008; Fried, 2015). Therefore, it is necessary to establish that it measures the same concept in different cultural contexts (Castro-Costa et al., 2008). Indeed, various authors emphasized that culturally determined differences in norms or expressions of depression may have a large influence on self-reported symptoms (Jürges, 2007; Castro-Costa et al., 2008). Even though measurement invariance is a prerequisite for cross-country comparative studies, only few researchers have actually taken this issue into consideration (Janget al., 2001; Castro-Costa et al., 2008; Fried et al., 2016; Graeff-Buhl-Nielsen et al., 2020).
For example, Fried et al. (2016) analyzed whether unidimensionality and temporal invariance are tenable assumptions in typical studies of depression. They tested these two conditions in two large datasets with a total sample of 3,509 participants, in four widely used depression rating scales (one self-report and three clinician-reports), with varying intervals between measurement points (ranging from 6 weeks to 2 years). These researchers found neither unidimensionality nor temporal invariance. Specifically, they found that the analyzed instruments do not assess a single underlying construct, and they do not measure the same set of constructs in the same way across time (Fried et al., 2016). In another study by Jang and colleagues (2001), the structure and validity of the Geriatric Depression Scale-Short Form (GDS-SF) were examined in South Korean and American samples of older adults. The participants included 153 and 459 older adults living in South Korea and the United States, respectively. All participants completed the original English and the translated into the Korean language version of the GDS-SF, as well as additional demographic and health-related measures. The results revealed that the GDS-SF exhibited good reliability in both samples. However, the results of a principal components analysis indicated that the structure was not well replicated across the two countries. The authors concluded that despite the efforts to produce equivalent questionnaires, the concept of depression for older adults might vary greatly in South Korea and the United States (Jang et al., 2001). Graeff-Buhl-Nielsen et al. (2020) expanded on Huppert and So (2013) multidimensional subjective well-being framework by testing the replicability of the model in Brazil, Colombia, Uganda, and the United Kingdom. The authors applied Bayesian approximate measurement invariance on a sample of 381 young adult participants to test for measurement consistency across countries. The results showed that the Huppert and So (2013) model was comparable across non-European regions, where meaningful differences in well-being patterns across regions were observed. Graeff-Buhl-Nielsen et al. (2020) suggested that the 10-item measure proposed by Huppert and So (2013) is useful for assessing mental health outside of Europe (Graeff-Buhl-Nielsen et al., 2020).
Another example that is particularly relevant for the present study is provided by Castro-Costa et al. (2008) who investigated the psychometric properties of the EURO-D-scale across 10 European countries in the first wave of the SHARE data (2004). The results revealed a two-factor solution, with affective suffering and motivation as two subdimensions (similar to the findings of Prince et al., 1999a) in nine of the 10 countries after employing a principal component analysis (PCA) and in all countries after employing a Confirmatory Factor Analysis (CFA). However, only the affective suffering subscale was equivalent across countries, while the motivation subscale was not. In conclusion, there is evidence to suggest that the EURO-D reflects two dimensions of depressive symptoms in late-life across European countries, with the affective suffering subdimension showing more robust cross-cultural validity than the motivational subdimension (Castro-Costa et al., 2008). Notably, in the current study we examine whether findings are similar for the same scale but across a larger set of countries and at a later time point (2015). Moreover, we employ various robustness tests that take not only the categorical character of the data into account but also allow for a stricter or more liberal examination of measurement invariance.
Data, Variables, and Methods
Data
The data for the analysis derive from the sixth wave of SHARE (2015) (Börsch-Supan et al., 2013; Malter and Börsch-Supan, 2017; Börsch-Supan, 2019) The SHARE project is the largest pan-European panel data infrastructure that collects information on the health and well-being of the aging population in Europe and Israel. It collects comparable and longitudinal information at the individual level on diverse topics such as income, work, assets, pension plans, health insurance, disability, mental health, and physical health. In addition, SHARE’s focus on older populations (50 + ) offers a unique opportunity to compare health in general and depression symptoms in particular among these populations. The data were gathered by means of face-to-face interviews conducted in respondents’ homes using a computer-based questionnaire. In addition to face-to-face interviews, respondents provided additional detailed information about their assets by filling out a short questionnaire. For more information on the data collection documentation, see http://www.share-project.org/special-data-sets.html. Our data consisted of samples of the population aged 50 years and older from 18 countries: Austria (AT), Belgium (BE), Croatia (HR), Czech Republic (CZ), Denmark (DK), Estonia (EE), France (FR), Germany (DE), Greece (GR), Israel (IL), Italy (IT), Luxemburg (LU), Poland (PL), Portugal (PT), Slovenia (SI), Spain (ES), Sweden (SE), and Switzerland (CH).
Variables
The dependent variable in the current study is depression. We view depression as a mental disorder that cannot be observed or measured directly but can be assessed by measuring its symptoms (Fried, 2015). Thus, our conceptualization of depression resembles a reflective latent variable model (Bollen and Lennox, 1991) where different observed indicators (i.e., depressive symptoms) are reflective of an unobserved underlying and subjective latent construct (i.e., depression). Following this notion, the latent construct is assumed to determine any correlations between the observed indicators.
The measurement of self-reported depressive symptoms (i.e., the observed indicators) in this study is based on the EURO-D scale that was developed by a European consortium (Prince et al., 1999b). This scale contains 12 items tapping into depression, pessimism, suicidality, guilt, sleep quality, interest, irritability, appetite, fatigue, concentration (on reading or entertainment), enjoyment, and tearfulness (for the question formulations and response categories, see Table 1). The scale yields a potential range from 0 to 12, with the number of depressive symptoms denoting the score. Thus, a higher score implies a higher degree of depression. Each single item measures the self-reported presence of a particular symptom. The EURO-D scale was shown to correlate well with other well-known health measures (Prince et al., 1999b), and its validity has been examined and confirmed by several studies (Larraga et al., 2006).
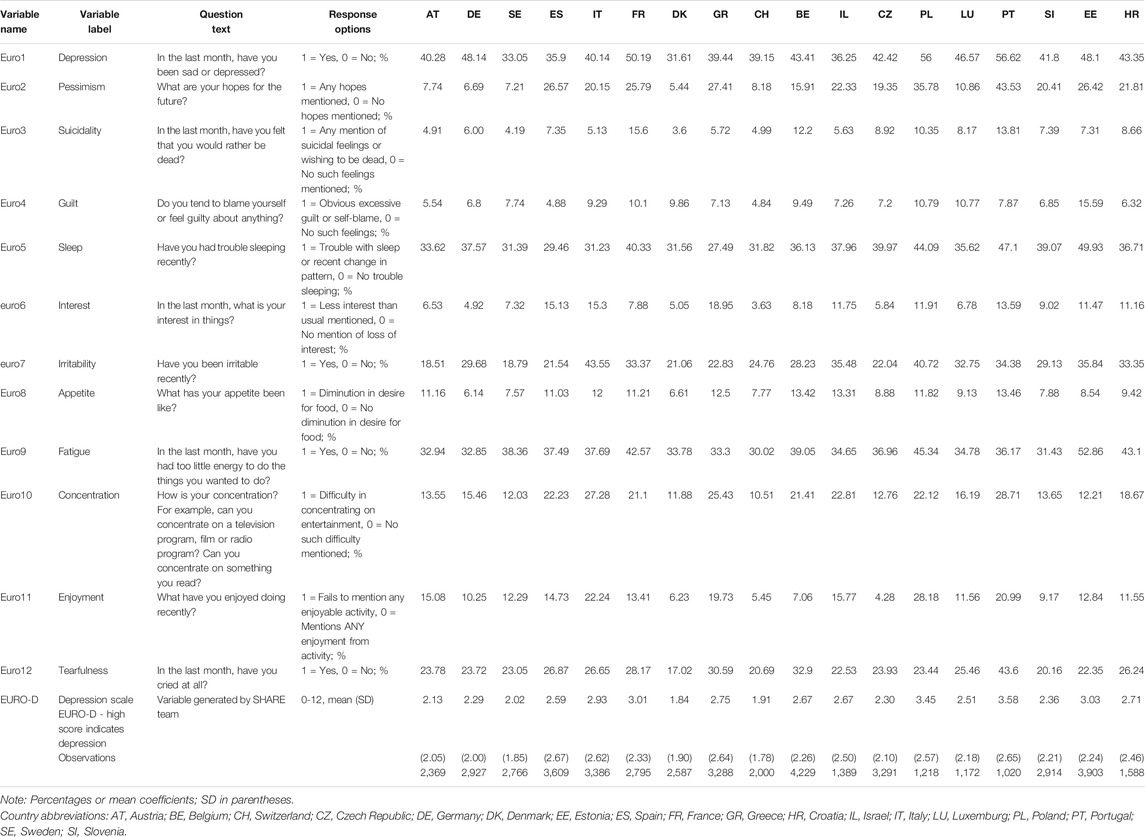
TABLE 1. The perceived depressive symptoms scales, response categories, percentage or mean (standard deviation [SD)], by country.
Method
Our analytical strategy consists of three steps. First, we use EFA (Barendse et al., 2015) to investigate the dimensionality of the 12 depressive symptom items across countries. Following Worthington and Whittaker (2006), we retain factors if the eigenvalue is larger than 1.00 and items if the factor loading is larger than 0.30 (Brown, 2015). Moreover, items are deleted if they load on two or more factors with a loading larger than 0.30. We also deleted an item if, in addition to its main loading, it had a cross-loading whose difference to the main loading was smaller than 0.15. We considered both cases as an indication of the lack of discriminant validity.
Second, we used MGCFA (Reise et al., 1993) to assess whether our a priori formulated common measurement model of depression assessed in the previous step exists in all countries and whether the measurement characteristics of this model are invariant across countries. Measurement invariance refers to “whether or not, under different conditions of observing and studying phenomena, measurement operations yield measures of the same attribute” (Horn and McArdle, 1992, p. 117), which is essential to ensure that a latent variable (in this case “depression”) measures the same construct in different groups (Davidov et al., 2014; Vandenberg and Lance, 2000). When measurement invariance is absent, comparisons of relationships among variables (e.g., correlations, regression coefficients) and comparisons of scores (e.g., means) may be biased (Chen, 2008). The MGCFA approach for binary indicators allows testing measurement invariance by successively constraining the measurement parameters (i.e., factor loadings, thresholds, and residual variances) in the measurement model across countries.1 The hierarchy of constraints reflects that group differences are increasingly attributed to differences in the latent factor and not to differences in the measurement characteristics. We test three levels of invariance (Millsap and Yun-Tein, 2004). Configural invariance refers to a model where only the number of factors, indicators, and the pattern of non-zero and zero factor loadings is invariant across countries. Strong invariance requires that the factor loadings and thresholds are held equal across countries.2 Strict invariance additionally requires that the residual variances are held equal across countries. When strict invariance holds, researchers may even compare variances, covariances, regression coefficients, and means of the observed indicators or using composite scores. If only strong invariance holds, then only the means of the factors (i.e., latent means) may be used for a meaningful comparison (Liu et al., 2017). For estimating the model we used the variance-adjusted weighted least squares (WLSMV) estimator (Muthén et al., 1997) and the software program Mplus (Muthén and Muthén, 1998-2017). The WLSMV estimator works reasonably well even with small sample sizes, and its estimates are considered unbiased and efficient (Li et al., 2017). Missing data were treated pairwise (Asparouhov and Muthén, 2010a). Moreover, we use the theta parameterization approach that allows specifying the residual covariances of the latent response variables as parameter in the model (Asparouhov and Muthén, 2010a).3 Models can be assessed and compared using the model chi-square test statistic (Asparouhov and Muthén, 2010b) and alternative indices such as the comparative fit index (CFI), root mean square error of approximation (RMSEA), and standardized root mean residual (SRMR). We follow common practice to recognize acceptable model fit when CFI ≥ 0.90 and RMSEA/SRMR < 0.08 (West et al., 2012). Moreover, for testing measurement invariance constraints, we use the following guidelines in this study: Differences in model fit were considered irrelevant if the deterioration in CFI was smaller than 0.004 and the deterioration in RMSEA was smaller than 0.01 when moving from less to more constrained models (Svetina et al., 2020).
Third, we tested for approximate measurement invariance using the alignment optimization procedure (Muthén and Asparouhov, 2014). Compared to the classical MGCFA method for testing measurement invariance across groups, alignment is a less strict approach with regard to the requirement of equality constraints of measurement parameters across groups. Whereas MGCFA assumes that measurement parameters are equal across groups, the alignment procedure does not rely on such a strict assumption but rather allows for many small and a few large differences in measurement parameters across groups while still guaranteeing that factor means may be compared without bias. Alignment uses an unconstrained (configural) model in which all parameters are estimated without equality constraints, for example, with maximum likelihood. In the next step, the parameter estimation follows a procedure that minimizes a component loss function that finds the most optimal arrangement of measurement parameters, in which parameter differences across groups are usually very small and larger differences are restricted to a minimum.4 Thus, the amount of measurement noninvariance is minimized without having to constrain any parameters to be exactly equal across groups (for technical details, see Asparouhov and Muthén, 2014). The final aligned factor means can be used for comparison if the degree of noninvariance in the alignment model is still tolerable. The degree of noninvariance is assessed with regard to the amount of noninvariant parameters in the model. When the amount of noninvariant parameters is smaller than 25% (Muthén and Asparouhov, 2014) or 29% (Flake and McCoach, 2018), the aligned factor means and the measurement parameters are considered trustworthy.5 In sum, alignment identifies the most comparable means even in the absence of full measurement invariance.
Results
Descriptive Statistics
Table 1 reveals considerable variations across countries in the reported levels of depressive symptoms as indicated by the single indicators (euro1-euro12) and the composite score (EURO-D). Older adults in Scandinavian countries (Denmark and Sweden), Southern Europe (Italy, Spain, and Greece), and Israel reported fewer depressive symptoms than individuals living in other European countries in the sample. While this pattern was similar for several depressive symptoms, mean differences for the EURO-D score were somewhat less consistent, although Sweden and Denmark are still representative of countries with low depression scores. Our examination of measurement invariance in the following sections will determine whether and to what extent we may rely on these reported cross-country score differences.
Exploratory Factor Analysis
We performed EFA for the 12 depressive symptom items across 18 countries and within each country separately. The rotated solution from the EFA across all countries is shown in Table 2. According to the eigenvalue criterion, two factors (eigenvalues 4.849 and 1.360) emerged that represented affective suffering (depression, sleep, guilt, irritability, tearfulness) and motivation (pessimism, interest, concentration, enjoyment). These two factors were measured by the same items as in previous research (Castro-Costa et al., 2008), and they corroborate the findings of earlier analyses of the EURO-D scale (Castro-Costa et al., 2007, 2008; Guerra et al., 2015; Portellano-Ortiz et al., 2018). However, the items reflecting suicidality, appetite, and fatigue show considerable cross-loadings that do not allow allocating them to either of the two factors. This analysis on the full sample is used as a benchmark for screening the data and its factorial structure. When the EFA is performed for each country separately, the eigenvalue criterion again suggested a two-dimensional structure for most countries, which was in line with previous findings (Prince et al., 1999a; Castro-Costa et al., 2008).6 In three countries, a third factor was suggested, which was, however, substantially meaningless and therefore ignored. According to the selection criteria described above, items measuring suicidality, sleep, appetite, and fatigue were dropped from further analysis because they either failed to load substantially on any factor or loaded on both factors in more than 25% of the countries (see Supplementary Appendix). We chose this cutoff value for the share of countries because we considered 25% to be indicative of a substantial number of countries in which the items did not operate well. Obviously, other researchers may choose a higher or a lower cutoff for item selection. However, we would like to note that keeping these items in our case would likely result in misspecifications of the factor structure.
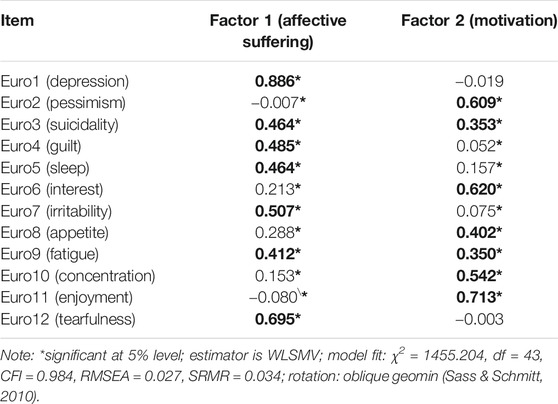
TABLE 2. Rotated standardized factor loadings for two dimensions of depression across 18 countries (n = 44,420).
Multigroup Confirmatory Factor Analysis
Next, we retained the two-dimensional structure obtained with EFA and tested whether it can be supported in each of the countries and whether it displays measurement invariance across countries using MGCFA. The general model structure is depicted in Figure 1.
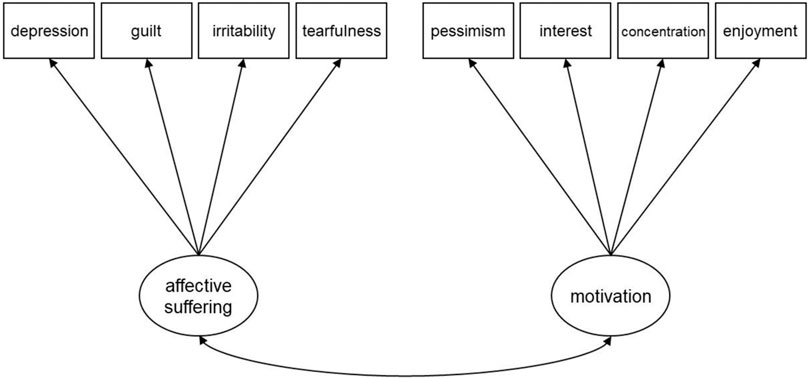
FIGURE 1. Two-dimensional confirmatory factor model for depression.
-First, we tested the model separately in each country. Results indicated good model fit, satisfactory factor loadings (higher than 0.3 in standardized terms; see Brown, 2015), and correlations between the two factors below 0.80 (indicating discriminant validity; Brown, 2015) in all countries with the exception of Denmark. In Denmark, the standardized factor loading of item euro2 (pessimism) on the motivation factor was low (0.18). Since we aimed at finding a model that applies to all countries, we omitted Denmark from further analysis.
Second, we examined the measurement invariance properties of the two subdimensions for the remaining 17 countries. These results are shown in Table 3. The fit indices indicated that the configural model fit the data well, suggesting that the same two-dimensional structure existed in all countries. The strong invariance model with cross-country equality constraints on the factor loadings and thresholds also fit the data well. However, the deterioration in model fit was outside the range of the recommended cutoff criteria. The modification indices suggested that the thresholds for items euro1 (depression), euro2 (pessimism), euro4 (guilt), euro7 (irritability), euro10 (concentration), euro11 (enjoyment), and euro12 (tearfulness) were not equal across countries. Austria, Czech Republic, Estonia, Germany, Greece, Italy, Sweden, and Switzerland contributed most to the noninvariance indicating that people used the item categories differently in these countries.7 Finally, also the strict invariance model showed a considerable deterioration in model fit compared to the strong invariance model with the CFI fit index value falling to below 0.90.
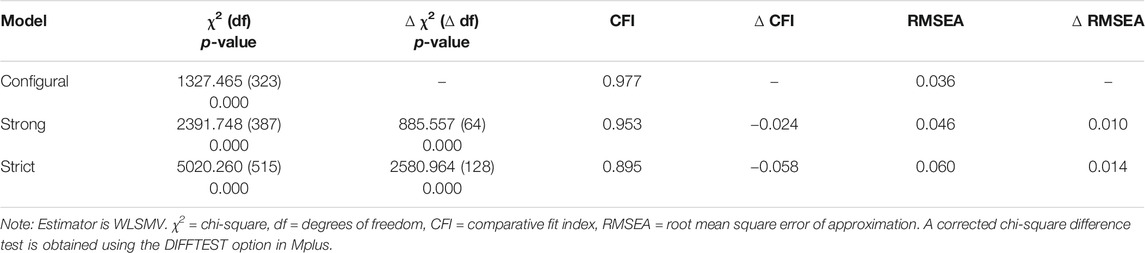
TABLE 3. Model fit for measurement invariance tests (17 countries, n = 41,863).
Alignment
We tested whether comparisons of factor means are nevertheless trustworthy using the alignment procedure. The alignment procedure is more lenient, and it could suggest that means may be compared after all, even when exact strong or strict measurement invariance is not supported by the data (Asparouhov and Muthén, 2014). We ran the procedure separately for each latent dimension8. The number of noninvariant parameter estimates is presented in Table 4. The table demonstrates that percentages of invariant parameters are far below the recommended cutoff criteria, and therefore, we conclude that the factor means may be trustworthy after all. However, items euro2 (pessimism), euro7 (irritability), and euro12 (tearfulness) were still significantly noninvariant in Austria, Germany, Sweden, Italy, France, Greece, Belgium, Israel, Poland, Luxemburg, Portugal, and Estonia (Table 5). Figure 2 shows the estimated factors means and the commonly used composite scores. The country rankings are quite different when using the more trustworthy aligned factor means compared to the composite score means. Moreover, the correlations of the latent and composite score means were only as high as 0.93 for the motivation subdimension and 0.80 for the affective suffering subdimension, suggesting that comparisons based on composite scores may be misleading. For example, based on the composite scores, older populations are the least depressed in Sweden, Austria, and Spain for both dimensions. However, based on the aligned means, it is Israel, Spain, Switzerland (affective suffering) as well as the Czech Republic, Austria, and Germany (motivation) where older populations display the lowest depression scores. The picture becomes more troubling when one relies on the general EURO-D composite score that includes all items in one dimension. In this case, the correlation of this composite score is only 0.64 with the affective suffering dimension and 0.90 with the motivation dimension. In other words, the bias in mean rankings is even larger when the general depression score is used as a single measure rather than considering the aligned means and the two-dimensionality of the construct.9

TABLE 4. Number of noninvariant parameter estimates (17 countries, n = 41,862).
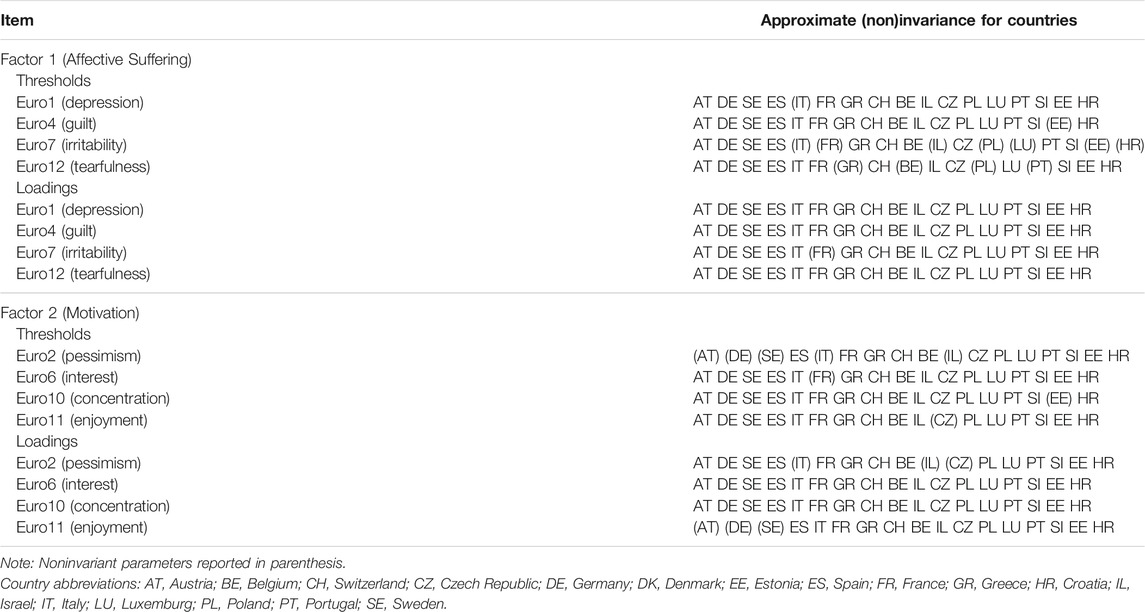
TABLE 5. Approximate measurement invariance (17 countries, n = 41,862).
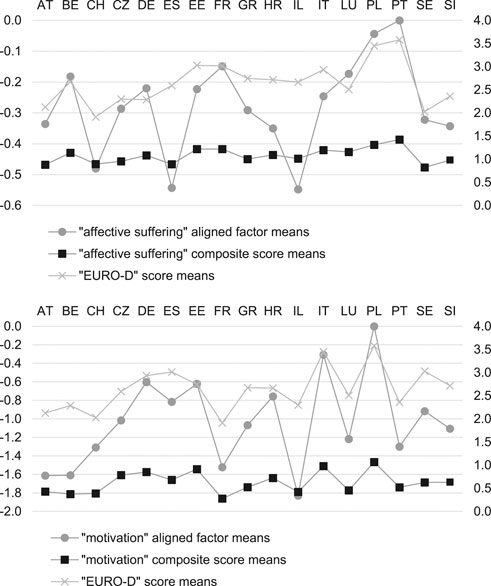
FIGURE 2. Comparison of aligned factor means and composite score means. Note: The aligned factor means follow the scale on the left side of the graph with Portugal as the reference group with a mean of zero. The composite score means follow the scale on the right side of the graph. Country abbreviations: AT, Austria; BE, Belgium; CH, Switzerland; CZ, Czech Republic; DE, Germany; DK, Denmark; EE, Estonia; ES, Spain; FR, France; GR, Greece; HR, Croatia; IL, Israel; IT, Italy; LU, Luxemburg; PL, Poland; PT, Portugal; SE, Sweden; SI, Slovenia.
Summary and Conclusion
The principal objective of the current study was to examine measurement equivalence of self-reported depressive symptoms among older populations in 17 European countries and Israel as measured by the EURO-D scale in the SHARE data. Indeed, existing literature on cross-country validation of depression measures using representative samples of the older population is lacking. This lacuna is unfortunate, since comparative research of depressive symptoms requires that the groups under study understand the survey questions in the same way and display similar measurement characteristics. Otherwise, observed differences in perceived depressive symptoms may not reflect true differences but rather methodological artefacts or other similar types of bias (e.g., cultural bias in response behavior). Accurate and reliable information on depression scores across populations is crucial to the evidence-based formulation of effective mental health policies and their successful implementation. Therefore, we aimed to fill this gap by examining the measurement equivalence of the cross-cultural assessment of depressive symptoms by the EURO-D scale in older European and Israeli adults aged 50 and over. We used different approaches to examine measurement invariance (stricter and more liberal, i.e., alignment) complemented by a series of robustness tests for the findings. By doing this, we attempted to provide researchers with reliable scores for conducting meaningful comparative analyses of depression across populations.
First, our results from the EFA indicated a two-dimensional structure of the depression scale across countries. The items measuring depression, guilt, irritability, and tearfulness represented the factor affective suffering, and the items measuring pessimism, interest, concentration, and enjoyment represented the factor motivation. However, the remaining items measuring suicidality, sleep, appetite, and fatigue were not clearly related to one of the factors and where therefore omitted from further analysis. Denmark had to be dropped from further analysis, because one of the items measuring pessimism did not load on its corresponding factor motivation in a satisfactory way. The two-dimensional structure we identified was concordant with previous findings (Prince et al., 1999a; Castro-Costa et al., 2007, Castro-Costa et al., 2008; Guerra et al., 2015; Portellano-Ortiz et al., 2018). For example, the pioneer study by Prince et al. (1999a) that tested the EURO-D scale in 14 European centers has reported that it can be reduced into two factors: affective suffering and motivation. Castro-Costa et al. (2008) results supported the EURO-D as either a unidimensional or bidimensional scale measure of depressive symptoms in late-life across European countries. Guerra et al. (2015) also found a two-factor structure (affective and motivation) of the EURO-D scale using large population-based survey samples of older people living in Latin America, India, China, and Nigeria. Finally, a more recent study by Portellano-Ortiz et al. (2018) analyzed the factor structure of the EURO-D depression scale in 15 European countries in an older wave (5: 2013) of SHARE. These authors also identified two factors.
Second, we tested the measurement invariance across the remaining 17 countries. Results showed that strong invariance may be given if one is willing to accept a certain drop in the MGCFA fit statistics. However, strict invariance was clearly rejected by the data. Thus, we then tested for the more liberal approximate invariance using the alignment procedure. This procedure revealed that the aligned latent factor means are comparable after all. These are encouraging results, as they imply that researchers may confidently draw meaningful and valid conclusions in cross-national comparative research on depression using the SHARE data and the EURO-D scale. However, the findings also imply that the current practice to perform comparative analysis based on sum scores of the scale should be viewed with skepticism. The strict requirements for sum scores (unidimensionality, strict measurement invariance) are not met with the current data (see also Fried et al., 2016; McNeish and Wolf, 2020). Contrary to the findings of Castro-Costa et al. (2008), for example, our results illustrate that even the sum scores of the single subdimensions are biased when compared to the aligned means. Thus, aligned factor means should be used instead. However, when researchers use other data or different sets of countries, measurement equivalence properties of the scores should be reevaluated, and the findings we reached are specific for the data at hand. Indeed, findings suggest that measurement invariance may still be given after all when using more liberal approaches like alignment to examine it, even when MGCFA fails to demonstrate measurement invariance. The knowledge obtained from this study may help policy makers to base their decisions on true evidence of mental health prevalence across different European countries and Israel rather than on methodological artefacts.
Despite its contribution, the present study is not without limitations. First, while our study examined one particular depression scale, the literature discusses several other self-reported measures of depression that may be subject to noninvariance across different countries. Second, our study was limited to the European context and Israel and to the older population of these countries. Whereas measurement equivalence was established for the data at hand, it does not necessarily suggest that it would be given also in other countries and across other age groups. Consequently, one needs to keep in mind that this may affect the results and potential comparability with other datasets. Future studies could address these important issues by further analyzing data in other countries, covering a diverse range of age groups, and using additional scales measuring respondents’ mental health.
Notwithstanding these limitations, the current study, to the best of our knowledge, offers the most comprehensive examination of the measurement invariance properties of the depression scale in the SHARE data across participating European countries and Israel. It suggests that the aligned country means of depression may be used in comparative studies with confidence. When the reduction of mental health disorders is of utmost importance in many countries with a growing older population, unbiased country scores of depression are important for the development of informed European health policy and interventions to reduce the prevalence of depression and increase quality of life for older members of the population. Based on our empirical findings, the SHARE cross-cultural depression data is a reliable information source to include in efforts to achieve this goal.
Data Availability Statement
Publicly available datasets were analyzed in this study. This paper uses data from SHARE Wave 6. National Institute on Aging (U01_AG09740-13S2, P01_AG005842, P01_AG08291, P30_AG12815, R21_AG025169, Y1-AG-4553-01, IAG_BSR06-11, OGHA_04-064, HHSN271201300071C), and from various national funding sources is gratefully acknowledged (see www.share-project.org).
Author Contributions
First and second author share equal contribution to the work and are presented in alphabetical order. DM, DS, and ED contributed to conception and design of the study. DM organized the database. DS performed the statistical analysis. DM and DS wrote sections of the manuscript. All authors contributed to manuscript revision, read, and approved the submitted version.
Conflict of Interest
The authors declare that the research was conducted in the absence of any commercial or financial relationships that could be construed as a potential conflict of interest.
The handling editor declared a past co-authorship with one of the authors ED.
Publisher’s Note
All claims expressed in this article are solely those of the authors and do not necessarily represent those of their affiliated organizations, or those of the publisher, the editors and the reviewers. Any product that may be evaluated in this article, or claim that may be made by its manufacturer, is not guaranteed or endorsed by the publisher.
Acknowledgments
The authors would like to thank Lisa Trierweiler for the English proof of the manuscript.This paper uses data from SHARE Wave 6 (DOI: 10.6103/SHARE.w6.710), see Börsch-Supan et al. (2013) for methodological details. The SHARE data collection has been funded by the European Commission through FP5 (QLK6-CT-2001-00360), FP6 (SHARE-I3: RII-CT-2006-062193, COMPARE: CIT5-CT-2005-028857, SHARELIFE: CIT4-CT-2006-028812), FP7 (SHARE-PREP: GA N°211909, SHARE-LEAP: GA N°227822, SHARE M4: GA N°261982, DASISH: GA N°283646), Horizon 2020 (SHARE-DEV3: GA N°676536, SHARE-COHESION: GA N°870628, SERISS: GA N°654221, SSHOC: GA N°823782), and by DG Employment, Social Affairs and Inclusion. Additional funding from the German Ministry of Education and Research, the Max Planck Society for the Advancement of Science, the U.S. National Institute on Aging (U01_AG09740-13S2, P01_AG005842, P01_AG08291, P30_AG12815, R21_AG025169, Y1-AG-4553-01, IAG_BSR06-11, OGHA_04-064, HHSN271201300071C), and from various national funding sources is gratefully acknowledged (see www.share-project.org). ED would like to thank the University of Zurich Research Priority Program “Social Networks” for their financial support during work on this study.
Supplementary Material
The Supplementary Material for this article can be found online at: https://www.frontiersin.org/articles/10.3389/fpos.2021.665004/full#supplementary-material
Footnotes
1We used a threshold model for the binary measures in the SHARE study assuming that the dichotomy in an observed response
2The step of testing factor loading invariance separately is omitted and conducted in tandem with testing threshold invariance to ensure model identification (Muthén and Muthén, 1998-2017).
3The residual variances were fixed at one for all variables in a reference group and freely estimated in all other groups. Only when testing for strict invariance were all residual variances fixed at one in all groups.
4In a similar manner, this principle is used in rotating factor loadings in EFA where researchers desire a simple structure with only a few large main factor loadings and many small and negligible cross-loadings.
5We do not consider the option of partial invariance (Byrne et al., 1989) because it may not be sufficient for comparing observed scores mean differences (Steinmetz, 2013), such as those resulting from the EURO-D scale.
6Result outputs for the analysis per country including factor eigenvalues and rotated loadings are presented in the Supplementary Appendix.
7The modification indices are presented in the Supplementary Appendix.
8Alignment is estimated using maximum likelihood and requires numerical integration when categorical indicators are analyzed. In the current analysis we experienced negative values in the absolute change of the loglikelihood across iterations even when we increased the number of integration points to improve numerical precision. Therefore, we decided to run the analysis for each latent variable separately to allow the models to converge more easily.
9We would like to note that a different choice of countries and items may result in different findings. Thus, researchers interested in comparing different sets of countries and/or different measures are encouraged to perform analyses similar to those presented here. We include, in an online appendix, the syntax for the models we examined. Furthermore, we conducted robustness tests without the pessimism item but including Denmark in the analysis. The findings were quite similar, and strict invariance was still not supported by the data, whereas approximate invariance was (see Online Supplementary Table S1, S2).
References
Alonso, J., Angermeyer, M. C., Bernert, S., Bruffaerts, R., Brugha, T. S., Bryson, H., et al. (2004). Prevalence of Mental Disorders in Europe: Results from the European Study of the Epidemiology of Mental Disorders (ESEMeD) Project. Acta Psychiatr. Scand. Suppl. 420, 21–27. doi:10.1111/j.1600-0047.2004.00327.x
Andreas, S., Schulz, H., Volkert, J., Dehoust, M., Sehner, S., Suling, A., et al. (2017). Prevalence of Mental Disorders in Elderly People: the European MentDis_ICF65+ Study. Br. J. Psychiatry 210 (2), 125–131. doi:10.1192/bjp.bp.115.180463
Asparouhov, T., and Muthén, B. (2014). Multiple-group Factor Analysis Alignment. Struct. Equation Model. A Multidisciplinary J. 21 (4), 495–508. doi:10.1080/10705511.2014.919210
Asparouhov, T., and Muthén, B. (2010a). Simple Second Order Chi-Square Correction. Mplus technical Appendix. Retrieved from http://www.statmodel.com/download/WLSMV_new_chi21.pdf.1–8.
Asparouhov, T., and Muthén, B. (2010b). Weighted Least Squares Estimation with Missing Data. Mplus Technical Appendix. Retrieved from https://www.statmodel.com/download/GstrucMissingRevision.pdf.
Barendse, M. T., Oort, F. J., and Timmerman, M. E. (2015). Using Exploratory Factor Analysis to Determine the Dimensionality of Discrete Responses. Struct. Equation Model. A Multidisciplinary J. 22 (1), 87–101. doi:10.1080/10705511.2014.934850
Beard, J. R., Officer, A., de Carvalho, I. A., Sadana, R., Pot, A. M., Michel, J.-P., et al. (2016). The World Report on Ageing and Health: A Policy Framework for Healthy Ageing. Lancet 387 (10033), 2145–2154. doi:10.1016/S0140-6736(15)00516-4
Belvederi Murri, M., Amore, M., Respino, M., and Alexopoulos, G. S. (2020). The Symptom Network Structure of Depressive Symptoms in Late-Life: Results from a European Population Study. Mol. Psychiatry 25 (7), 1447–1456. doi:10.1038/s41380-018-0232-0
Blazer, D. G. (2003). Depression in Late Life: Review and Commentary. Journals Gerontol. Ser. A. Biol. Sci. Med. Sci. 58 (3), M249–M265. doi:10.1093/gerona/58.3.M249
Blazer, D., Hughes, D. C., and George, L. K. (1987). The Epidemiology of Depression in an Elderly Community Population. Gerontologist 27 (3), 281–287. doi:10.1093/geront/27.3.281
Bollen, K., and Lennox, R. (1991). Conventional Wisdom on Measurement: A Structural Equation Perspective. Psychol. Bull. 110 (2), 305–314. doi:10.1037/0033-2909.110.2.305
Börsch-Supan, A., Brandt, M., Hunkler, C., Kneip, T., Korbmacher, J., Malter, F., et al. (2013). Data Resource Profile: The Survey of Health, Ageing and Retirement in Europe (SHARE). Int. J. Epidemiol. 42, 992–1001. doi:10.1093/ije/dyt088
Börsch-Supan, A. (2019). Survey of Health, Ageing and Retirement in Europe (SHARE) Wave 6. Release version: 7.1.0. SHARE-ERIC. doi:10.6103/SHARE.w6.710
Brown, T. A. (2006). Confirmatory Factor Analysis for Applied Research. New York, NY. Guilford press.
Brown, T. A. (2015). Confirmatory Factor Analysis for Applied Research. New York, NY. Guilford publications.
Byrne, B. M., Shavelson, R. J., and Muthén, B. (1989). Testing for the Equivalence of Factor Covariance and Mean Structures: The Issue of Partial Measurement Invariance. Psychol. Bull. 105 (3), 456–466. doi:10.1037/0033-2909.105.3.456
Castro-Costa, E., Dewey, M., Stewart, R., Banerjee, S., Huppert, F., Mendonca-Lima, C., et al. (2008). Ascertaining Late-Life Depressive Symptoms in Europe: an Evaluation of the Survey Version of the EURO-D Scale in 10 Nations. The SHARE Project. Int. J. Methods Psychiatr. Res. 17 (1), 12–29. doi:10.1002/mpr.236
Castro-Costa, E., Dewey, M., Stewart, R., Banerjee, S., Huppert, F., Mendonca-Lima, C., et al. (2007). Prevalence of Depressive Symptoms and Syndromes in Later Life in Ten European Countries. Br. J. Psychiatry 191 (5), 393–401. doi:10.1192/bjp.bp.107.036772
Chen, F. F. (2008). What Happens if We Compare Chopsticks with forks? the Impact of Making Inappropriate Comparisons in Cross-Cultural Research. J. Personal. Soc. Psychol. 95 (5), 1005–1018. doi:10.1037/a0013193
Copeland, J. R., Beekman, A. T., Braam, A. W., Dewey, M. E., Delespaul, P., Fuhrer, R., et al. (2004). Depression Among Older People in Europe: the EURODEP Studies. World psychiatry 3 (1), 45–49.
Davidov, E., Meuleman, B., Cieciuch, J., Schmidt, P., and Billiet, J. (2014). Measurement Equivalence in Cross-National Research. Annu. Rev. Sociol. 40, 55–75. doi:10.1146/annurev-soc-071913-043137
Flake, J. K., and McCoach, D. B. (2018). An Investigation of the Alignment Method with Polytomous Indicators under Conditions of Partial Measurement Invariance. Struct. Equation Model. A Multidisciplinary J. 25 (1), 56–70. doi:10.1080/10705511.2017.1374187
F. Malter, and A. Börsch-Supan (Editors) (2017). SHARE Wave 6: Panel Innovations and Collecting Dried Blood Spots (Munich: Munich Center for the Economics of Aging (MEA)).
Forero, C. G., Maydeu-Olivares, A., and Gallardo-Pujol, D. (2009). Factor Analysis with Ordinal Indicators: A Monte Carlo Study Comparing DWLS and ULS Estimation. Struct. Equation Model. A Multidisciplinary J. 16 (4), 625–641. doi:10.1080/10705510903203573
Fried, E. I. (2015). Problematic Assumptions Have Slowed Down Depression Research: Why Symptoms, Not Syndromes Are the Way Forward. Front. Psychol. 6, 309. doi:10.3389/fpsyg.2015.00309
Fried, E. I., van Borkulo, C. D., Epskamp, S., Schoevers, R. A., Tuerlinckx, F., and Borsboom, D. (2016). Measuring Depression over Time Or Not? Lack of Unidimensionality and Longitudinal Measurement Invariance in Four Common Rating Scales of Depression. Psychol. Assess. 28 (11), 1354–1367. doi:10.1037/pas0000275
Graeff-Buhl-Nielsen, S., Garcia-Garzon, E., Benzerga, A., Folke, T., and Ruggeri, K. (2020). Global Mental Health: an Improved Measure of Well-Being in Multiple Languages. Health Qual. Life Outcomes 18 (1), 1–14. doi:10.1186/s12955-020-01375-3
Guerra, M., Ferri, C., Llibre, J., Prina, A. M., and Prince, M. (2015). Psychometric Properties of EURO-D, a Geriatric Depression Scale: a Cross-Cultural Validation Study. BMC Psychiatry 15 (1), 1–14. doi:10.1186/s12888-015-0390-4
Harpham, T., Reichenheim, M., Oser, R., Thomas, E., Hamid, N., Jaswal, S., and Aidoo, M. (2003). Measuring Mental Health in a Cost-Effective Manner. Health Policy Plan. 18 (3), 344–349. doi:10.1093/heapol/czg041
Chiu, H., Shulman, K., and Ames, D. (2017). Mental Health and Illness of the Elderly. Springer Singapore.
Horn, J. L., and McArdle, J. J. (1992). A Practical and Theoretical Guide to Measurement Invariance in Aging Research. Exp. Aging Res. 18 (3-4), 117–144. doi:10.1080/03610739208253916
Huppert, F. A., and So, T. T. C. (2013). Flourishing across Europe: Application of a New Conceptual Framework for Defining Well-Being. Soc. Indic Res. 110 (3), 837–861. doi:10.1007/s11205-011-9966-7
Jang, Y., Small, B. J., and Haley, W. E. (2001). Cross-cultural Comparability of the Geriatric Depression Scale: Comparison between Older Koreans and Older Americans. Aging Ment. Health 5 (1), 31–37. doi:10.1080/13607860020020618
Jürges, H. (2007). True Health vs Response Styles: Exploring Cross-Country Differences in Self-Reported Health. Health Econ. 16 (2), 163–178. doi:10.1002/hec.1134
Larraga, L., Saz, P., Dewey, M. E., Marcos, G., and Lobo, A. (2006). Validation of the Spanish Version of the EURO-D Scale: an Instrument for Detecting Depression in Older People. Int. J. Geriat. Psychiatry 21 (12), 1199–1205. doi:10.1002/gps.1642
Liu, Y., Millsap, R. E., West, S. G., Tein, J.-Y., Tanaka, R., and Grimm, K. J. (2017). Testing Measurement Invariance in Longitudinal Data with Ordered-Categorical Measures. Psychol. Methods 22 (3), 486–506. doi:10.1037/met0000075
Marques, A., Gaspar de Matos, M., Bordado, J., Gouveia, É. R., Peralta, M., and Gomez-Baya, D. (2020). Different Levels of Physical Activity and Depression Symptoms Among Older Adults from 18 Countries: A Population-Based Study from the Survey of Health, Ageing and Retirement in Europe (SHARE). Eur. J. Sport Sci. 21, 887–894. doi:10.1080/17461391.2020.1795273
McNeish, D., and Wolf, M. G. (2020). Thinking Twice about Sum Scores. Behav. Res. 52, 2287–2305. doi:10.3758/s13428-020-01398-0
Millsap, R. E., and Yun-Tein, J. (2004). Assessing Factorial Invariance in Ordered-Categorical Measures. Multivariate Behav. Res. 39 (3), 479–515. doi:10.1207/S15327906MBR3903_4
Muthén, B., and Asparouhov, T. (2014). IRT Studies of many Groups: the Alignment Method. Front. Psychol. 5, 978. Available at: https://www.frontiersin.org/article/10.3389/fpsyg.2014.00978.
Muthén, B. O., du Toit, S. H. C., and Spisic, D. (1997). Robust Inference Using Weighted Least Squares and Quadratic Estimating Equations in Latent Variable Modeling with Categorical and Continuous Outcomes. Unpublished technical report. Retrieved from https://www.statmodel.com/download/Article_075.pdf.
Muthén, L. K., and Muthén, B. O. (1998-2017). Mplus User’s Guide. 8th ed. Los Angeles, CA: Muthén and Muthén.
Portellano-Ortiz, C., and Conde-Sala, J. L. (2018). Cognition and its Association with the Factors of the EURO‐D: Suffering and Motivation. Findings from SHARE Wave 6. Int. J. Geriatr. Psychiatry 33 (12), 1645–1653. doi:10.1002/gps.4967
Portellano-Ortiz, C., Garre-Olmo, J., Calvó-Perxas, L., and Conde-Sala, J. L. (2018). Factor Structure of Depressive Symptoms Using the EURO-D Scale in the Over-50s in Europe. Findings from the SHARE Project. Aging Ment. Health 22 (11), 1477–1485. doi:10.1080/13607863.2017.1370688
Prince, M. J., Beekman, A. T. F., Deeg, D. J. H., Fuhrer, R., Kivela, S.-L., Lawlor, B. A., et al. (1999a). Depression Symptoms in Late Life Assessed Using the EURO-D Scale. Br. J. Psychiatry 174, 339–345. doi:10.1192/bjp.174.4.339
Prince, M. J., Reischies, F., Beekman, A. T. F., Fuhrer, R., Jonker, C., Kivela, S.-L., et al. (1999b). Development of the EURO-D Scale - a European Union Initiative to Compare Symptoms of Depression in 14 European Centres. Br. J. Psychiatry 174, 330–338. doi:10.1192/bjp.174.4.330
Reise, S. P., Widaman, K. F., and Pugh, R. H. (1993). Confirmatory Factor Analysis and Item Response Theory: Two Approaches for Exploring Measurement Invariance. Psychol. Bull. 114 (3), 552–566. doi:10.1037/0033-2909.114.3.552
Richardson, R. A., Keyes, K. M., Medina, J. T., and Calvo, E. (2020). Sociodemographic Inequalities in Depression Among Older Adults: Cross-Sectional Evidence from 18 Countries. Lancet Psychiatry 7 (8), 673–681. doi:10.1016/S2215-0366(20)30151-6
Santini, Z. I., Jose, P. E., Koyanagi, A., Meilstrup, C., Nielsen, L., Madsen, K. R., et al. (2020). Formal Social Participation Protects Physical Health through Enhanced Mental Health: A Longitudinal Mediation Analysis Using Three Consecutive Waves of the Survey of Health, Ageing and Retirement in Europe (SHARE). Soc. Sci. Med. 251, 112906. doi:10.1016/j.socscimed.2020.112906
Sass, D. A., and Schmitt, T. A. (2010). A Comparative Investigation of Rotation Criteria within Exploratory Factor Analysis. Multivariate Behav. Res. 45 (1), 73–103. doi:10.1080/00273170903504810
Steinmetz, H. (2013). Analyzing Observed Composite Differences Across Groups. Methodology 9 (1), 1–12. doi:10.1027/1614-2241/a000049
Svetina, D., Rutkowski, L., and Rutkowski, D. (2020). Multiple-group Invariance with Categorical Outcomes Using Updated Guidelines: An Illustration Using Mplus and the lavaan/semTools Packages. Struct. Equation Model. A Multidisciplinary J. 27 (1), 111–130. doi:10.1080/10705511.2019.1602776
Vandenberg, R. J., and Lance, C. E. (2000). A Review and Synthesis of the Measurement Invariance Literature: Suggestions, Practices, and Recommendations for Organizational Research. Organ. Res. Methods 3 (1), 4–70. doi:10.1177/109442810031002
West, S. G., Taylor, A. B., and Wu, W. (2012). “Model Fit and Model Selection in Structural Equation Modeling,” in Handbook of Structural Equation Modeling. Editor R. H. Hoyle (New York, NY: The Guilford Press), 209–231.
Worthington, R. L., and Whittaker, T. A. (2006). Scale Development Research. Couns. Psychol. 34 (6), 806–838. doi:10.1177/0011000006288127
Keywords: depression, multigroup confirmatory factor analysis, exact or approximate measurement equivalence, alignment optimization, older populations, survey on health, aging and retirement in Europe, mental health policy
Citation: Maskileyson D, Seddig D and Davidov E (2021) The EURO-D Measure of Depressive Symptoms in the Aging Population: Comparability Across European Countries and Israel. Front. Polit. Sci. 3:665004. doi: 10.3389/fpos.2021.665004
Received: 06 February 2021; Accepted: 15 July 2021;
Published: 05 August 2021.
Edited by:
Katharina Meitinger, Utrecht University, NetherlandsReviewed by:
Gordon Arsenoff, Princeton University, United StatesErico Castro-Costa, René Rachou Institute, Oswaldo Cruz Foundation (FIOCRUZ), Belo Horizonte, Brazil
Copyright © 2021 Maskileyson, Seddig and Davidov. This is an open-access article distributed under the terms of the Creative Commons Attribution License (CC BY). The use, distribution or reproduction in other forums is permitted, provided the original author(s) and the copyright owner(s) are credited and that the original publication in this journal is cited, in accordance with accepted academic practice. No use, distribution or reproduction is permitted which does not comply with these terms.
*Correspondence: Dina Maskileyson, ZG1hc2tpbGVAdW5pLWtvZWxuLmRl
†These authors have contributed equally to this work