 Agnes Katalin Koos
 Kenneth Keulman
- 1SOM Academic Affairs, University of Nevada, Reno, Reno, NV, United States
- 2Department of Religious Studies, Loyola University New Orleans, New Orleans, LA, United States
The most venerable cross-national measure of inter-group political inequality, brought about by the Ethnic Power Relations project, relies on group representation in national governments and assesses the power of groups to co-determine the country’s future. Nevertheless, types of autonomy are also important factors in power relations, and they substantiate the minorities’ ability to self-govern. Territorially concentrated communal groups typically fight for territorial autonomies (TAs), while urban and dispersed minorities seek non-territorial autonomies (NTAs), such as ethnocultural self-governments. There is little quantitative data on NTAs, but their contribution to more peaceful inter-group relations is rarely challenged. The opposite is true for TAs. Majority groups in nation-states are reluctant to allow them, and scientific evidence thus far has not supported their effectiveness in mitigating inter-ethnic tensions and curbing secessionist tendencies. It appears that empirical studies of TAs are hindered by certain confounding factors that prevent clear-cut conclusions. First of all, regionally based minorities are more prevalent in developing countries, which tend to be less peaceful. The quality of autonomy and its overlap with other cleavages, such as an urban–rural divide, are also factors that may make a difference. This study explores a different confounder: the possibility that some minority groups may enjoy de facto regional autonomy even though nominal TAs exist. This may occur when a country’s administrative units are drawn around ethnic, religious, or linguistic settlement areas, and those administrative units also benefit from meaningful autonomy. An index constructed with the help of the QGIS software spatial join functions, which allowed for the quantification of the degree of overlap between the regional minorities’ settlement areas and the ADM01 units (
1 Introduction
Managing communal heterogeneity has always been a challenge for polities, and the importance of the issue has increased with the advent of modernity, which enshrines the ideals of the nation-state and democracy. Pre-modern empires typically consisted of a patchwork of territorially bound ethnic, linguistic, and religious groups, characterized by limited political and cultural interaction. Nevertheless, mass political mobilization in self-governing polities necessitates clarifying the political weight and competencies of the constituents. This is easiest to postulate at the level of individual citizens: all should be equal; that is, all should have the same political power. However, societies are structured, and they must address questions about how to ensure an equitable power balance among provinces, states, social classes, genders, political factions, and, yes, communal groups such as ethnic, linguistic, racial, religious, regional, tribal, and caste groups.
Historically, concerns regarding the balance of democratic political power within the framework of pre-existing social structures can be traced back to the establishment of the US Senate and the Electoral College, which were introduced to address the federal structure of the republic. Class-related legislation dates back to the abolition of servitude and slavery; however, literacy tests and the regulation of trade unions also exemplify the long struggle between the haves and the have-nots to maintain a say in public affairs. The issue of communal heterogeneity differs in that there has been strong scholarly support for the idea that the best approach to address it is to work toward erasing intra-state communal differences. An equally strong academic camp, however, claims that accommodation of communal groups and integrating them into the political life of host countries yields the most peaceful domestic relations, in addition to being the morally right choice in the spirit of the Enlightenment’s “liberty, equality, solidarity” triad.1
Communal groups may differ along several features, and each country’s demographic structure is different. No wonder the heterogeneity management’s toolbox is rich and variegated. Nevertheless, the majority of tools can be neatly classified as serving either the diversity-effacing centripetal goal or the accommodation of diversity. This is advantageous for empirical research that tries to assess the comparative value of the two basic proposals for handling heterogeneity. However, the majority of developing countries do not follow purely centripetal or purely accommodating policies and frequently switch between them (see, for instance, Lemarchand, 2007).
The majority of accommodating arrangements have been shown to lead to more peaceful inter-group relations and reduce the chances of violent conflict between communal groups, primarily between the country’s majority group and some minorities.2 Of all the accommodating policies considered, only one failed often, though not always, to support the assumption that it leads to more domestic peace. Ethnic regional autonomies (territorial autonomies, or TAs) behaved capriciously in quantitative tests, and qualitative analyses also failed to assess their impact with a single overarching claim. Cederman et al. (2015) listed several studies that reached opposite views,3 and the following decade brought more claims on both sides. For instance, Schulte (2018) found that territorial autonomies have mostly a pacifying impact, while Barter (2024) argued that at least some of the five often-invoked concerns about TAs are legitimate. The competing claims led to trials to disaggregate the notion of territorial autonomy. Lecours’ (2021) proposal, for instance, distinguishes between TAs of stationary and evolving nature, predicting that the former increases secessionist impulses while the latter improves inter-group relations.
This study joins the large-N-based efforts to shed light on the impact of territorial autonomies. We believe the issue is of utmost importance because for territorially concentrated groups, TAs are considered to be the single most important accommodating tool, which enables them to self-govern. Nevertheless, because of the reasons detailed in the following paragraph, our tests will not directly rely on the lists of ethnic autonomies. We substituted the question “Do communal territorial autonomies foster domestic peace?” with the question “Does territorial self-governing of communal groups foster domestic peace?” We believe that communal self-governance occurs not only within dedicated regional autonomies but, more generally, within administrative units drawn with respect to ethnic settlement patterns, provided those administrative units benefit from substantive decentralized power. This left us with the task of quantifying the congruence between ethnic settlement patterns and administrative boundaries, on the one hand, and the degree of decentralization in the countries, on the other. The combination of the two may serve as a measure of communal empowerment through territorial self-governance and, by the logic of the facts, the empowerment of communal minorities rather than of the countries’ majorities. We calculated this new measure of territorial self-governance for 2021. In the analytic part, we support its validity by also comparing its performance to that of the traditional TA measures.
Our dataset comprises the three most well-known lists of territorial autonomies (Ethnic Power Relations (EPR/Grow-up) Database, n.d.), sourced from the Ethnic Power Relations (https://icr.ethz.ch/data/epr/), the Database of Political Institutions (Cruz et al., 2017), and Panov and Semenov’s (2018) ERA. These lists do not correlate well with each other. On the one hand, their definitions of autonomy differ; on the other hand, there are real-world features of the territorial arrangements that make it difficult to neatly classify each of them as autonomy versus non-autonomy. For instance, there are gradations of their effective self-governing power, and there are communal composition issues that challenge the notion that they are the autonomies of a specific group. (For instance, there are small “titular” groups in large autonomies populated by other groups and small autonomies not including the entire group). The number of countries allowing for territorial autonomies is also small, which reduces the statistical power of the findings. Finally, we must address the challenge that territorial autonomies have value only for regionally concentrated groups, a fact that essentially restricts comparisons to countries that feature regionally concentrated groups.
The first part of the “Data and methods” section will introduce the measures of congruence and decentralization, and the third will test their impact on domestic conflict indicators.
Before switching to these methodological sections, there may be an ideological issue to address. Regionally concentrated groups have traditionally fought for autonomous regions; is not a decentralized administrative unit of its own much less than a dedicated autonomous region? For instance, ethnic autonomies are generally codified in constitutions; administrative units are at the discretion of lower-level legislation. We believe that history reveals a notable reluctance among nation-states to allow for ethnic TA-s, while there is an ostensible historical trend toward decentralization. And there is also a historical trend toward less territorial confinement of communal groups. This trend began long ago, with the advent of industrialization and urbanization, but in the context of the developing world, civil wars and climate change have introduced new migration patterns. From this perspective, more flexible administrative frames allowing for self-governance are not a disadvantage compared to more rigidly demarcated regional autonomies (Ethnic Power Relations (EPR/Grow-up) Database, n.d.). Of the 744 politically relevant groups listed by EPR for 2021, 64.5% are classified as “regionally based,” and we may assume that among the hundreds of communal groups4 not active in the political arena as communal groups, the proportion of regionals is smaller. Dispersed ethnic groups typically seek cultural and linguistic rights and may utilize associations other than political parties or movements to achieve these goals. Nevertheless, the goal of this study is not to compare the value of dedicated regional autonomies with that of decentralized administrative units for groups, specifically for minorities. Factually, the latter mimic regional autonomies well enough to use them as proxies in a study of the impact of territorial self-governance on inter-group relations.
Decentralization of power has become a defining institutional trend of the late 20th and early 21st centuries, emphatically promoted by institutions such as the World Bank in the developing world.5 The more developed a country, the more likely it is to practice political, administrative, and fiscal decentralization. Subnational governing bodies are increasingly elected and not appointed, and in 2016, subnational government spending “accounted for 24.1% of total public spending and 8.6% of GDP on average,” as measured on a sample of 106 countries by an OECD research team (OECD/UCLG, 2019).6 Decentralization can be viewed as a principled and valuable trend in itself, beneficial to the entire society. However, for minority groups living in concentration, its value grows exponentially when they are able to govern the administrative units in which they are in a majority. The countries’ majorities may be much less enthusiastic about allowing their minorities to self-govern, and they often trace the boundaries of the sub-national administrative units in ways to minimize the number of minority-majority units. Thus, administrative districting in heterogeneous countries is a matter of choice between “centripetal” and “accommodating” policies, and it belongs to the toolbox of diversity management policies. We would call the measure expressing the degree of congruence between communal settlement areas and administrative units “Congruence,” and the product of it with a decentralization measure, which expresses the degree of territorial empowerment of the groups, “Congruence*Decentralization.” Nevertheless, due to technical issues, as explained in the next section, we will have to work with the reverse scales, “Incongruence” and “Incongruence*Centralization.”
2 Data and methods
2.1 Introducing the new measures
The new measure, constructed to test the impact of territorial self-government on inter-group relations, intends to capture the congruence between administrative units and ethnic settlement areas. It was created using the EPR dataset’s geo-coded 2021 version (https://icr.ethz.ch/data/epr/geoepr/) (Ethnic Power Relations (EPR/Grow-up) Database, n.d.). In QGIS, we superimposed the map of ethnic settlement areas with the map of first-level administrative divisions from the Database of Global Administrative Areas (www.gadm.org). As territorial autonomy is an issue for regionally concentrated minorities only, the EPR data was restricted to groups marked as “regional” or “regional and urban” (Table 1). We also restricted the data to the year 2021.
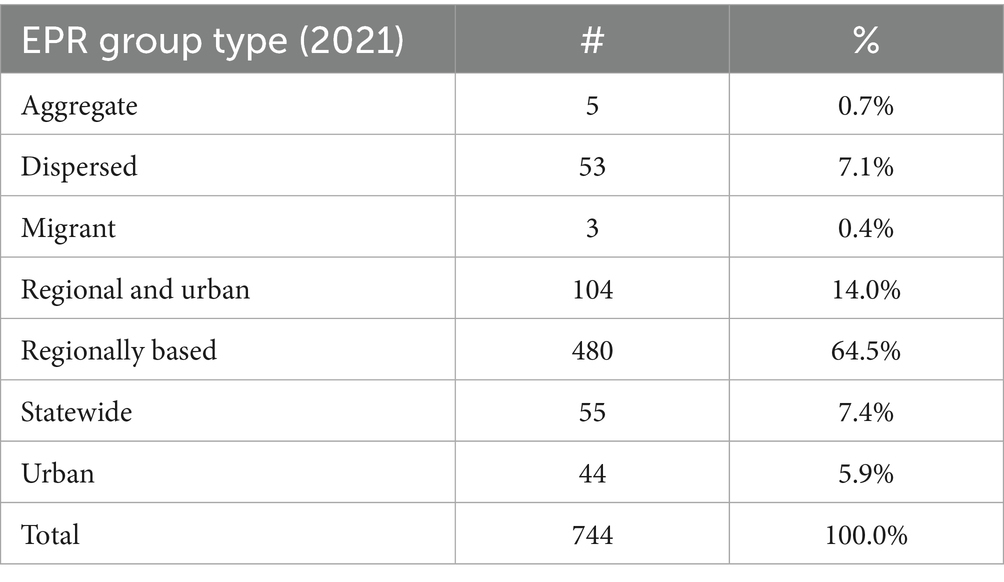
Table 1. Classification of communal groups in EPR for 2021. (Ethnic Power Relations (EPR/Grow-up) Database, n.d.)
We requested three types of spatial joins between the two maps: (1) Intersect; (2) Contains; and (3) Within.
With the first type of spatial join, “Intersect,” we obtained the list of all administrative units in which (parts of) an ethnic group resided. This spatial join counts units adjacent to the overlapping units, which tends to inflate the number of overlaps. Since, in real life, administrative boundaries rarely delimit groups sharply, and some “overflowing” normally occurs, we only dropped cases from the data when a unit in a foreign country was factored in due to its adjacent position. In group-level data, this piece of information on overlap shows up as the number of administrative units per group. In the country-level dataset, several measures have been entered, such as the total number of administrative units in a country (Total # of ADM01 divisions), the number of administrative units with regional groups (ADM01_with_regionals), the number of administrative units with regional majorities (ADM01_with_majorities), the number of administrative units with regional minorities (ADM01_with_minorities), the average number of regional groups in first-level administrative units (Avrg. Regional.groups.in. ADM01s), and the average number of regional minority groups in first-level administrative units (Avrg. Reg. Minorities.in. ADM01s). To calculate the congruence indicator, we compared the proportion of minorities within the population (Reg.minorities%All) with the proportion of ADM01 units populated by minorities within the total number of ADM01 units (ADM01_with_minorities / Total#ofADM01s). We deducted the population proportion from the ADM01 unit proportion. This “Difference” indicator is the basis for the Incongruence indicator, defined as.
((ADM01_with_minorities / Total#ofADM01s) – Reg.minorities%All) / (Reg.minorities%All)
“Difference” features a missing value for all countries where there are no regional minorities, but for “Incongruence,” we imputed 0 for those countries. This possibility elevates the reversed scale (“Incongruence”) above the straightforward “Congruence” scale. We believe it is essential to distinguish between countries that have regional minorities but do not permit minority-majority administrative units and those that do not have regional minorities. In this latter case, “Incongruence” may rightly take the value 0, while it would be difficult to invent a “Congruence” value for them. Finally, in calculations, an LN(Incongruence+2) transformation was used to improve distribution and moderate the impact of the spatial join’s handling of adjacent units.
• The second type of spatial join, “Contains,” provides the list of administrative units that are situated fully within the boundaries of a group’s settlement area, with a strong likelihood that the respective group will be an overwhelming majority there. A total of 57 countries have administrative units surrounded by a group’s settlement area, yet those groups are mostly the country’s communal majority. Only 29 minority groups in 26 countries have first-level administrative units fully contained within their settlement areas. Nevertheless, as a further limitation on their self-governing power, in the majority of cases (16 of 29), the groups are divided into two or more administrative units.
• Finally, the third spatial join, “Within,” provided the list of groups for which the settlement area was fully contained within a first-level administrative unit. As expected, only some relatively small groups fell into this category, such as the Assyrians in Armenia, the Xinca in Guatemala, the Bumiputera (Other) in Brunei, and China’s Qiang, Bai, Dongxiang, Mulam, Maonan, and Gelao minority groups.
The reason for the “Contains” and “Within” joins was to fine-tune the “Intersect”-based measure with information from these. We experimented with incorporating the information from the secondary spatial joins, but it did not result in a more convincing “Incongruence” measure. Thus, we kept the LN(Incongruence+2) as our main indicator.7 The indicator ranges from 0.647 to 5.065, with an average value of 1.263 and a median of 0.922.
A parallel incongruence measure was calculated for regional majorities only. The majority indicator returns considerably smaller incongruence values, ranging from 0.364 to 2.642, with a mean of 0.787 and a median of 0.693. This indicates that, among regionally based or regional and urban ethnic groups, majorities often enjoy administrative units tailored to their settlement areas, thereby maximizing their local political power. Minority groups are much more likely to live dispersed across several administrative units, which significantly reduces their voice in local and regional affairs, even in conditions of decentralized state political power. That is, in general, the first-level administrative boundaries clearly favor majorities and tend to cross-cut minority settlement areas, which reduces their political power and may cause constant frustration for the affected minorities.
The data analytic part of this study ventures into finding evidence of whether this frustration leads to more conflictual majority-minority relationships. Nevertheless, it only aims to showcase the potential of the new measure. It does not engage in full-blown disputes about the comparative value of the various explanatory variables proposed in the literature.
2.2 Other measures
The above-defined Incongruence index was incorporated in a dataset that contains dozens of country-level measurements about the demographic, economic, social, and political features of the countries. The majority of them came from the V-Dem project (Coppedge et al., 2024) dataset, but other variables were added from various academic, governmental, inter-governmental, and nonprofit think-tank websites, such as those of the World Bank’s World Development Indicators, the Ethnic Power Relations project, the Database of Political Institutions (DPI, Cruz et al., 2017), the Fragile States Index (https://fragilestatesindex.org/), the International Institute of Social Studies (ISS, https://www.indsocdev.org) and journal articles such as Ivanyna and Shah (2014) and Panov and Semenov (2018). The codebook of the dataset specifies the origin of each variable. The majority of them were used in their original form, while some were synthesized in more general indices.
2.2.1 Co-variable: decentralization/centralization
There is no reason to expect a positive impact of the minority-accommodating administrative units without those administrative units wielding some de facto power. This notion is operationalized with measures of decentralization in a country. However, it is a complex, multi-dimensional concept with at least four distinguishable aspects, generally referred to as electoral, political, fiscal, and administrative decentralization. Unfortunately, although the theory of decentralization is well-developed, we lack updated datasets with worldwide coverage to describe all these dimensions of decentralization. The most comprehensive undertaking in the field was the Ivanyna and Shah (2014) dataset, which constructed political, fiscal, and administrative part-indexes of their comprehensive decentralization index for the early 2010s (CEPII, 2016). Similarly, the French government’s data (CEPI: IPD) contains an electoral decentralization measure and one that addresses the fiscal and administrative powers of sub-national governments; however, the last year their data covers is 2016. DPI’s last year is 2017. Thus, we relied on the V-Dem data, which contains a regional government index (v2xel_regelec) and a local government index (v2xel_locelec) for the year 2021, as well. These focus on electoral decentralization, but other aspects, mainly political, are also touched upon, as the question to the expert raters was, “Are there elected regional governments, and—if so—to what extent can they operate without interference from unelected bodies at the regional level?” The ratings are aggregated into an interval variable ranging from 0 to 1 for each country, with higher values indicating greater decentralization.8 We used this scale but reversed it by subtracting the values from 1 and re-named it “Polit. Centralization.”9 This measure was combined with the incongruence index to form the main explanatory variable, “Incongruence*Centralization.”
2.2.2 Dependent variables
The outcome variable of interest is domestic peace or, otherwise, the presence or absence of internal conflict. More precisely, when testing the impact of minority territorial empowerment, we aim to determine whether it has an impact on internal conflicts of a communal nature. We were seeking datasets that distinguish between domestic conflicts of a predominantly communal nature and those rooted in other types of cleavages. The cross-sectional character of our dataset imposed further restrictions on the conflict data. For instance, the UCDP-PRIO measures incorporated in the Grow-up database relate to violent armed conflicts. These events are rare, and their causes, in general, take time to “buffer,” that is, to build up. We were seeking data on non-violent and less violent conflicts, which can be more convincingly linked to the state of affairs in a given year. These types of conflicts may also be coded as interval variables, typifying a country in a given year, which allows for more sensitive cross-country comparisons than event data.10 For instance, one of the World Bank’s good governance indicators (Kaufmann et al., 2010), called “Political Stability and Absence of Violence/Terrorism,” and the Fragile States Index’s part-indicator called “Group Grievances” (FSI_GG_2021) (Heidelberg Institute for International Conflict Research, 2022; FSI, 2021). We also constructed a measure based on the Heidelberg Institute for International Conflict Research’s (HIIK) 2022 Conflict Barometer. Their database, called CONTRA,11 records new or ongoing conflicts with a county*year granularity and classifies them into four types: interstate, substate, intrastate, or transstate. It also indicates the issue of conflict (called “items”), which may be autonomy, international power, national power, resources, secession, subnational predominance, system ideology, territory, decolonization, or the residual “other.” We selected the intrastate and substate types and coded each conflict as either communal or not and as a majority-minority conflict or not.12 Since a country may experience multiple conflicts in any given year, of varying types and intensities, on different issues, we had to make a decision about aggregating the majority-minority conflicts for the year. We settled on two aggregate indicators: one relying on the highest conflict intensity measured in a year (HIIK. MX. Intensity) and the other based on the average intensity (HIIK. Comm. MJ_Min. Avrg. Intensity) (Heidelberg Institute for International Conflict Research, 2022). As HIIK uses a 5-point scale to convey the conflict intensity, HIIK. MX. Intensity is a 6-point measure ranging from 0 to 5, while HIIK. Comm. MJ_Min. Avrg. Intensity is measured on an interval scale ranging from 0 to 5.
2.2.3 Alternate measures of minority empowerment
The logic of the “grievance” type explanations of internal conflict (such as those promoted by the MAR and EPR projects, though the label itself was promoted by a classic of Collier and Hoeffler, 2004) is that oppressed, wronged, or unequal groups rebel when their condition cannot obtain remedies within the frames of the socio-political structures in place. In this approach, the feeling of grievance comes first, and consideration of resources to achieve a positive change is the next step.
In today’s complex societies, however, some groups may experience cross-cutting effects on their well-being, and their inventory of the available resources may influence the articulation of grievances. For instance, loss of territorial autonomy has always been a main grievance of the affected communal groups. Still, it has not always led to violent conflict. On the one hand, some groups might have felt too weak to initiate a rebellion. Nevertheless, on the other hand, some groups might have put up with the loss of their territorial autonomy in exchange for gains such as more representation in the national government, more functional autonomy, all-level education in their mother tongue, noticeable economic progress, and an alternate form of territorial empowerment coming as decentralization of regional governments in which they can benefit from their numeric majority. Underlying all these, there may be a trend of the formerly concentrated minority to disperse across their country of citizenship, which makes functional autonomy more desirable than territorial autonomy. Because of these trade-offs among versions and forms of minority empowerment, predictions of inter-group conflict must factor in a gamut of grievances and multiple possibilities for remediation.
There have been attempts to work out synthetic indicators of minority conditions. The MAR project addressed the economic, political, and cultural aspects of the minority status (International Institute of Social Studies of Erasmus University Rotterdam, n.d.), and the Indices of Social Development team developed an index called “Inclusion of Minorities” (Yet MAR does not go beyond 2006, while ISD’s last available year is 2020). More recently, the V-Dem project has introduced numerous indicators on the comparative status of communal groups, which cover political, economic, and legal disparities, as well as social exclusion, at the granularity of country*year.13
Of all aspects of the minority condition, political equality has received the most dedicated measurement, primarily due to the historical dataset compiled by the EPR project, covering the period from 1946 to 2021. Their country-level variable, ExclPop, indicates the proportion of ethnic groups that lack national political representation. Territorial autonomies also received interest from various projects, but no common definition and operationalization has been achieved. The Database of Political Institutions flags the countries where regional autonomies of any kind exist, while EPR gives the number of groups in a country that benefit from ethnic territorial autonomy (out of the politically relevant groups included in EPR). Primarily due to differing definitions, the two sources disagree in approximately 17% of the countries they both cover. A third authoritative source, the Ethnic Regional Autonomies Dataset (ERAD), compiled by a group of Russian scholars and introduced to English readers by Panov and Semenov (2018), is better correlated with both DPI and EPR than they are with each other. Nevertheless, it has not been updated since 2018. Thus, we compiled a variable named Territorial.autonomy, which takes the value 1 when all three sources claim that there is territorial autonomy in a country and 0.5 when only one or two sources claim this.
There are many more ways in which minorities may feel empowered or, inversely, frustrated. For instance, a ban on ethnic and other communal parties is very likely a frustrating factor, and due to the V-Dem project’s work, we now have indicators showing restrictions on ethnic and religious parties worldwide.14 Nevertheless, we do not have good measures of minority functional autonomies, whether of a political or cultural character and, in general, of minority cultural rights.15 In regression models, we will use the V-Dem project’s comprehensive indicator of “Power distributed by social group” (v2pepwrsoc, VD. Power.by. Soc. GR) as the basis of comparison for our new measure.
2.2.4 Controls
Cross-national studies cannot do without controlling for the countries’ economic development level. It is almost everything related to this, including settlement profiles, division of labor, unemployment rates, and the quality of democracy. The countries’ ethnic, linguistic, and religious fractionalizations are also related to the development level, with all these factors inversely related: we find much more communal heterogeneity in the developing world than in the developed world. The classic development measures are GDP and the United Nations Human Development Index (HDI), which take into account gross national income, life expectancy, and schooling. This latter approach addresses some distribution issues as well, without explicitly involving a Gini index, which is a difficult-to-calculate measure, and, in fact, it should be accompanied by an even rarer horizontal inequality measure. V-Dem includes various inequality measures; however, these are expert-ranking-based rather than explicitly rooted in the actual income levels of individuals. HDI refers to the overall health and education of a population. Thus, higher values indicate that the benefits of the country’s wealth have been distributed to a larger segment of the population.
The other widely used control in cross-national analyses is democracy, including its level and type, specifically whether it is majoritarian or proportional representation (PR). It has been advocated and partly supported that PR is more advantageous for minorities (see, for instance, Reynal-Querol, 2005). Nevertheless, there are three important conditions for the advantages to minorities of proportional representation to materialize. First, we may expect minorities to reap the benefits of PR only when communal political mobilization is allowed, that is, not in countries where ethnic and religious parties are banned, as in the majority of Africa. Second, the electoral threshold has to be lower than the proportion of the respective minority in the country’s population. And third, for territorially concentrated minorities, the single-district majoritarian arrangements are certainly fine when they have a fair share of minority-majority electoral districts. With deference to these realities, we opted to include variables of the party bans in our regression models and a democracy flaw indicator that is most likely to sour intergroup relations: the level of clientelism in countries.
This study does not engage in a full-fledged dispute of whether some enabling conditions affect the likelihood of domestic conflict more than the grievances themselves, but we included some controls from the arsenal of approaches advocating supply-side theories of greed and opportunity: a fractionalization index (Alesina et al., 2003) and a measure of the labor force participation rate of males aged 15–24 years, as a modeled ILO estimate (wdi_lfpymilo, Labor.f.particip.1524male).
2.3 Data analysis
2.3.1 Exploratory steps
We assembled a dataset with several parallel measures of all covariates, dependent variables, and controls and requested a comprehensive correlation matrix of all variables included. The reason was twofold: to ascertain that the correlation between two variables is not a fluke of the data at hand but a pattern repeated across several measures of the same phenomenon and to identify the correlations between explanatory variables that may cause collinearity issues.
First, we ran the correlation matrix using the original dataset, which contained 196 sovereign polities and 95 numeric variables. This basic dataset had 10% missing values (empty cells). We asked for a multiple imputation in SPSS and obtained five iterations. A pooled version containing averages of the five imputed values in each previously empty cell was used for further analyses. The correlation matrices from the original data file and the pooled imputed data are very similar.
Figure 116 displays a number of correlations of interest.
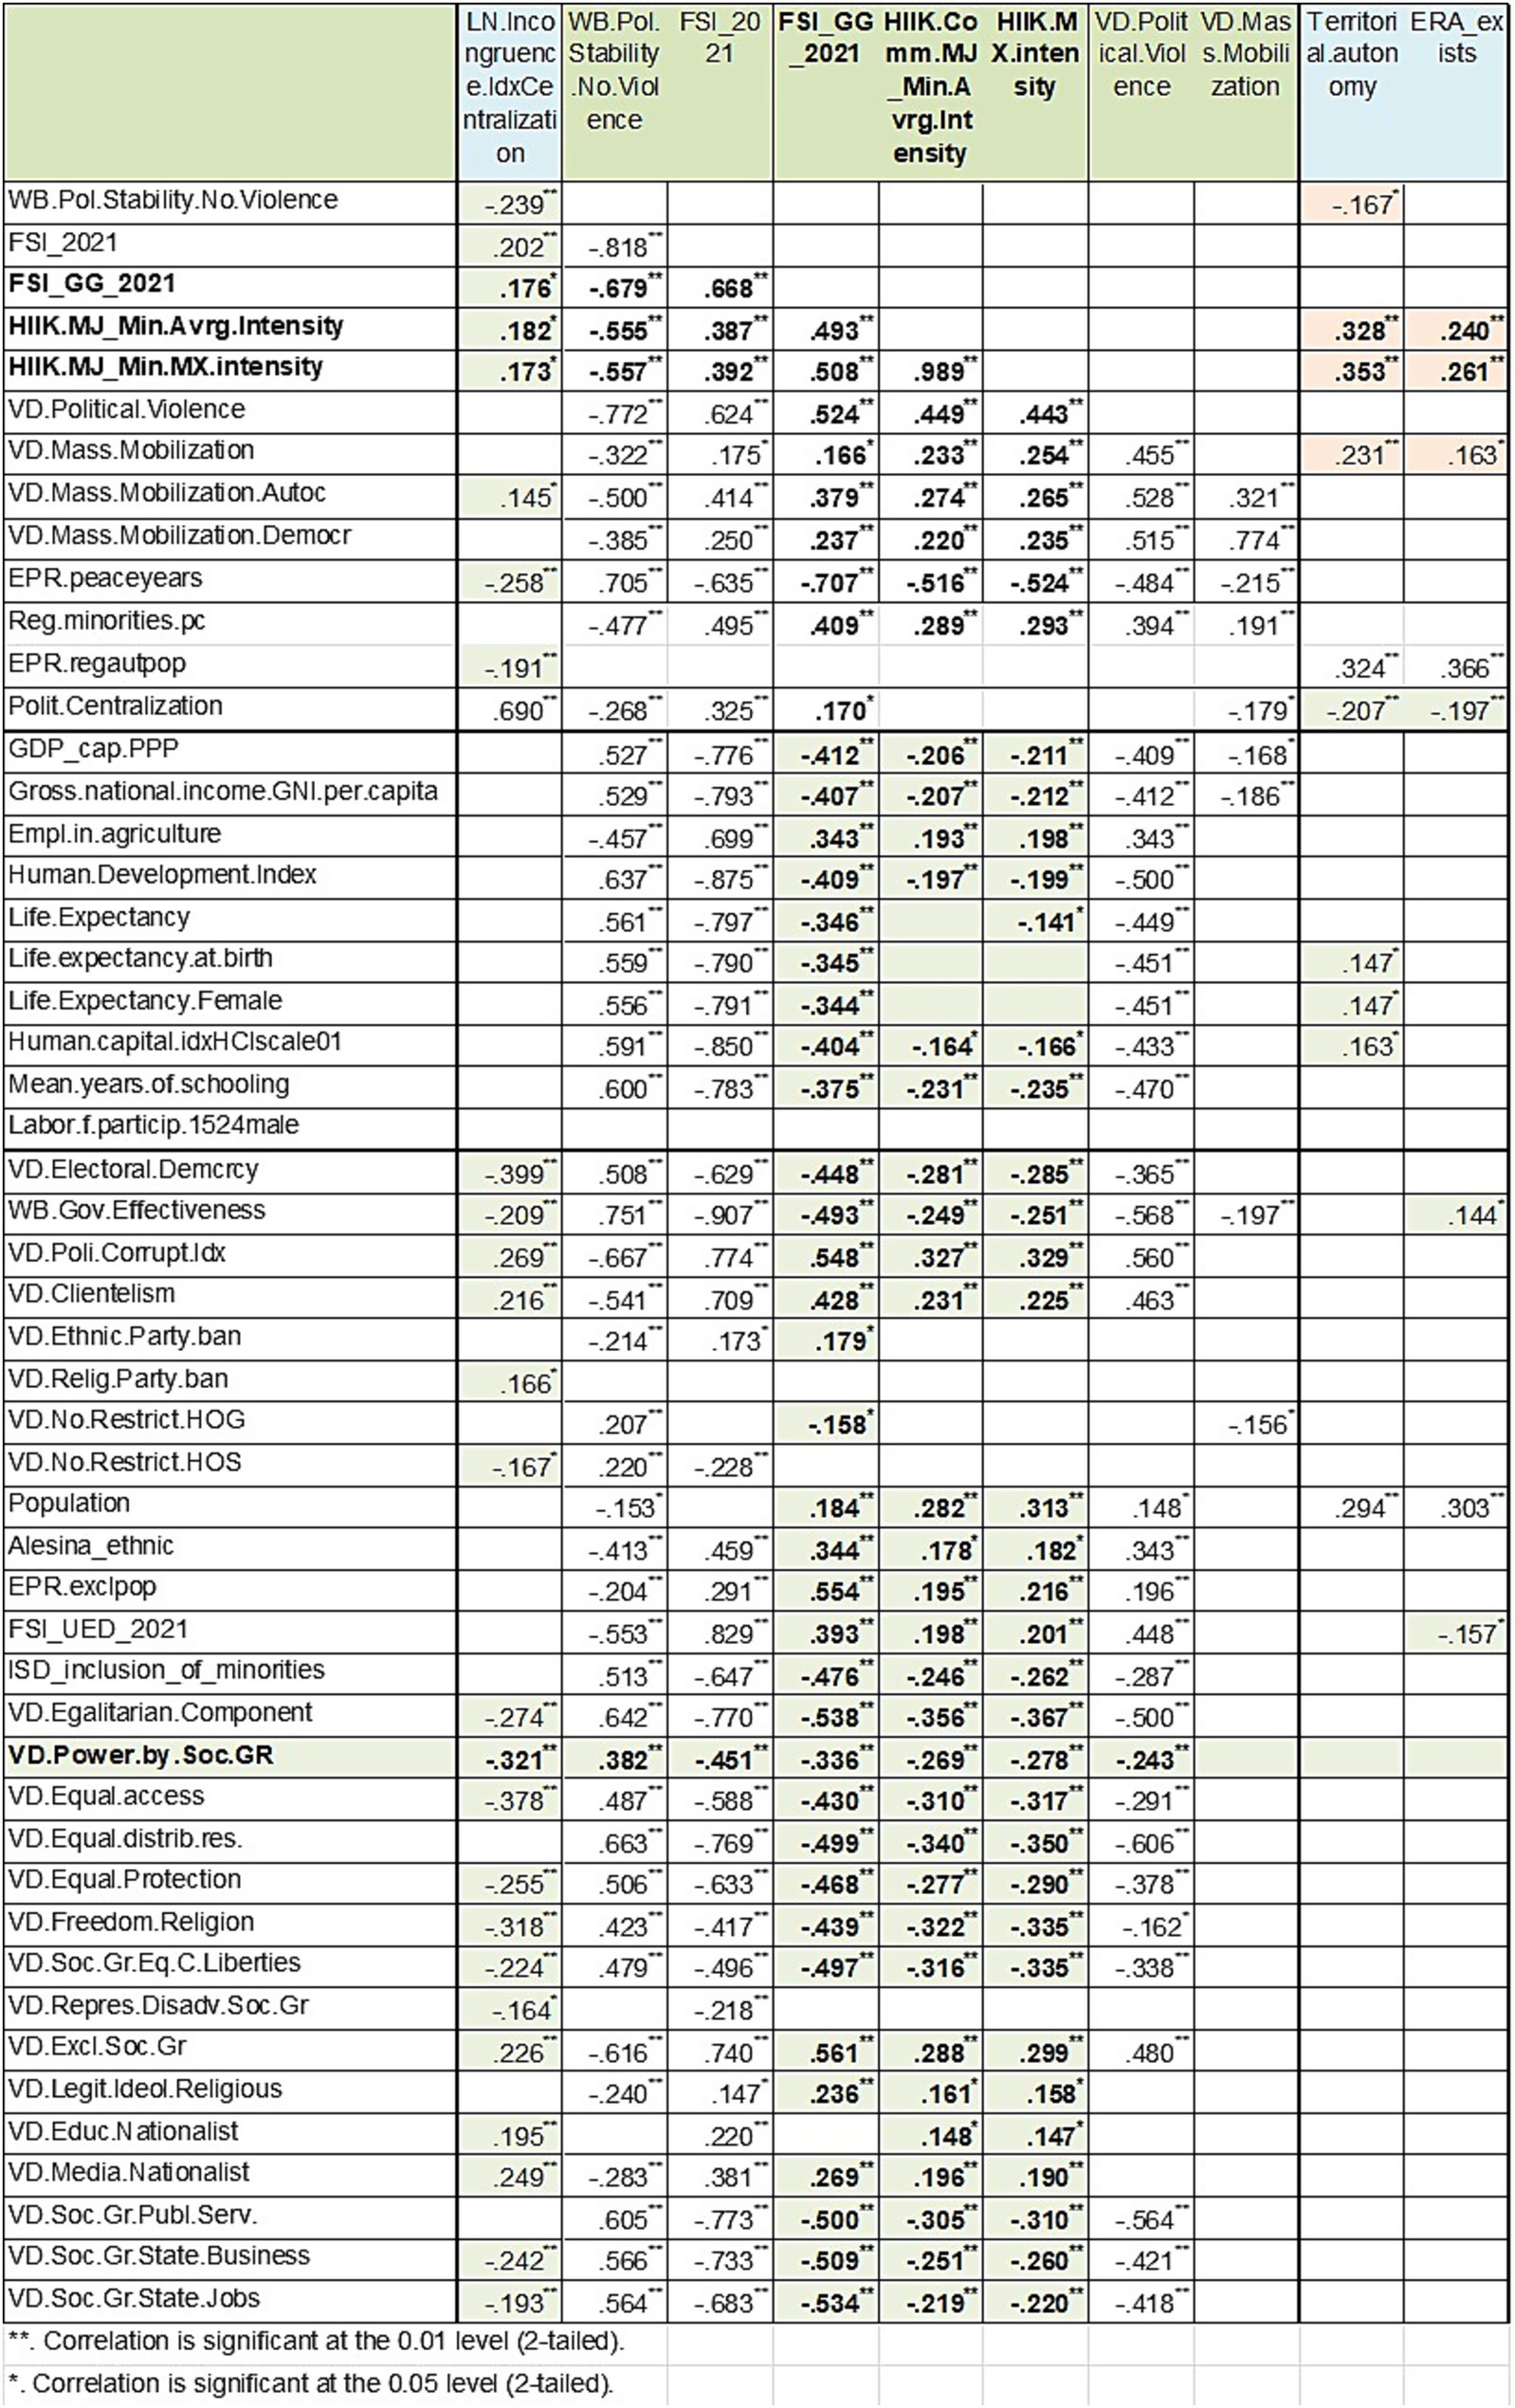
Figure 1. Correlation matrix with conflict indicators and explanatory variables.
First of all, our Incongruence*Centralization indicator shows a convincing, statistically significant association with 7 of the 10 conflict measures included, always in the theoretically expected direction, that is, toward an antagonizing effect. It is worth noting that only three of the ten are more precisely tailored to communal conflicts: FSI_GG_2021 and the two HIIK-derived indicators. With these, the LN.Incongruence.IdxCentralization measure never fails to return significant correlations and performs better than the simple political decentralization measure, which, in turn, also displays a pacifying effect, most likely because of its association with the development indicators.
LN. Incongruence. IdxCentralization is not correlated with the development indicators. Of its “parent” measures, decentralization is positively associated with them, while congruence tends to be negatively associated. However, our explanatory variable is significantly correlated with several democracy and egalitarianism indicators, always in the theoretically expected direction, when Congruence*Decentralization aligns with other positive social and political circumstances.
This is not the case with the Territorial.autonomy measure nor with its “parent” ERA.exists and EPR.regautpop indicators. These have a few rare positive correlations with the development measures, but their correlations with the conflict measures indicate that they associate with more, rather than less, turbulence. They are also unrelated to LN. Incongruence. IdxCentralization, with the exception of the EPR.regautpop, which shows a negative-sign correlation with it (meaning that more people benefit from regional autonomy in countries where Congruence*Decentralization is higher).
At the bottom of Figure 1, two measures of nationalism are presented, indicating that countries with more nationalist education and media are more likely to practice incongruent administrative units and/or centralization. V-Dem called these measures “Patriotic education in the curriculum” (v2edpatriot) and “Patriotism in the media” (v2medpatriot), not outright “nationalist.” Nevertheless, for minorities, the patriotism of majorities tends to come across as nationalism, and the nationalism measures’ correlation with inter-communal conflicts reinforces this interpretation. In addition, intense patriotic discourse is associated with lower development and democracy levels, less egalitarianism, and worse outcomes for minority communal groups on the majority of measures included in the dataset, such as the ISD_inclusion of_minorities, VD. Power.by. Soc. GR (power distributed by social group), and VD. Repres. Disadv. Soc. Gr (representation of disadvantaged social groups).
2.3.2 OLS regression models
An important indicator introduced by the V-Dem project is “Power distributed by social group” (v2pepwrsoc), which we collapsed into VD. Power.by. Soc. GR. The expert ratings answered whether “Is political power distributed according to social groups?” That is, the project aimed at a comprehensive measure that takes into account group representation in all institutions of political power. We benefitted from the existence of this dedicated measure of empowerment to compare and assess the predictive value of our LN. Incongruence. IdxCentralization. In the first step, we built models to explain communal conflict with this variable and a few circumstantial political facts, such as the existence of territorial autonomies and bans on ethnic parties. We also included controls for development (life expectancy) and quality of democracy (clientelism).
Table 2 summarizes two models with the same explanatory variables but run on different measures of inter-group hostility.
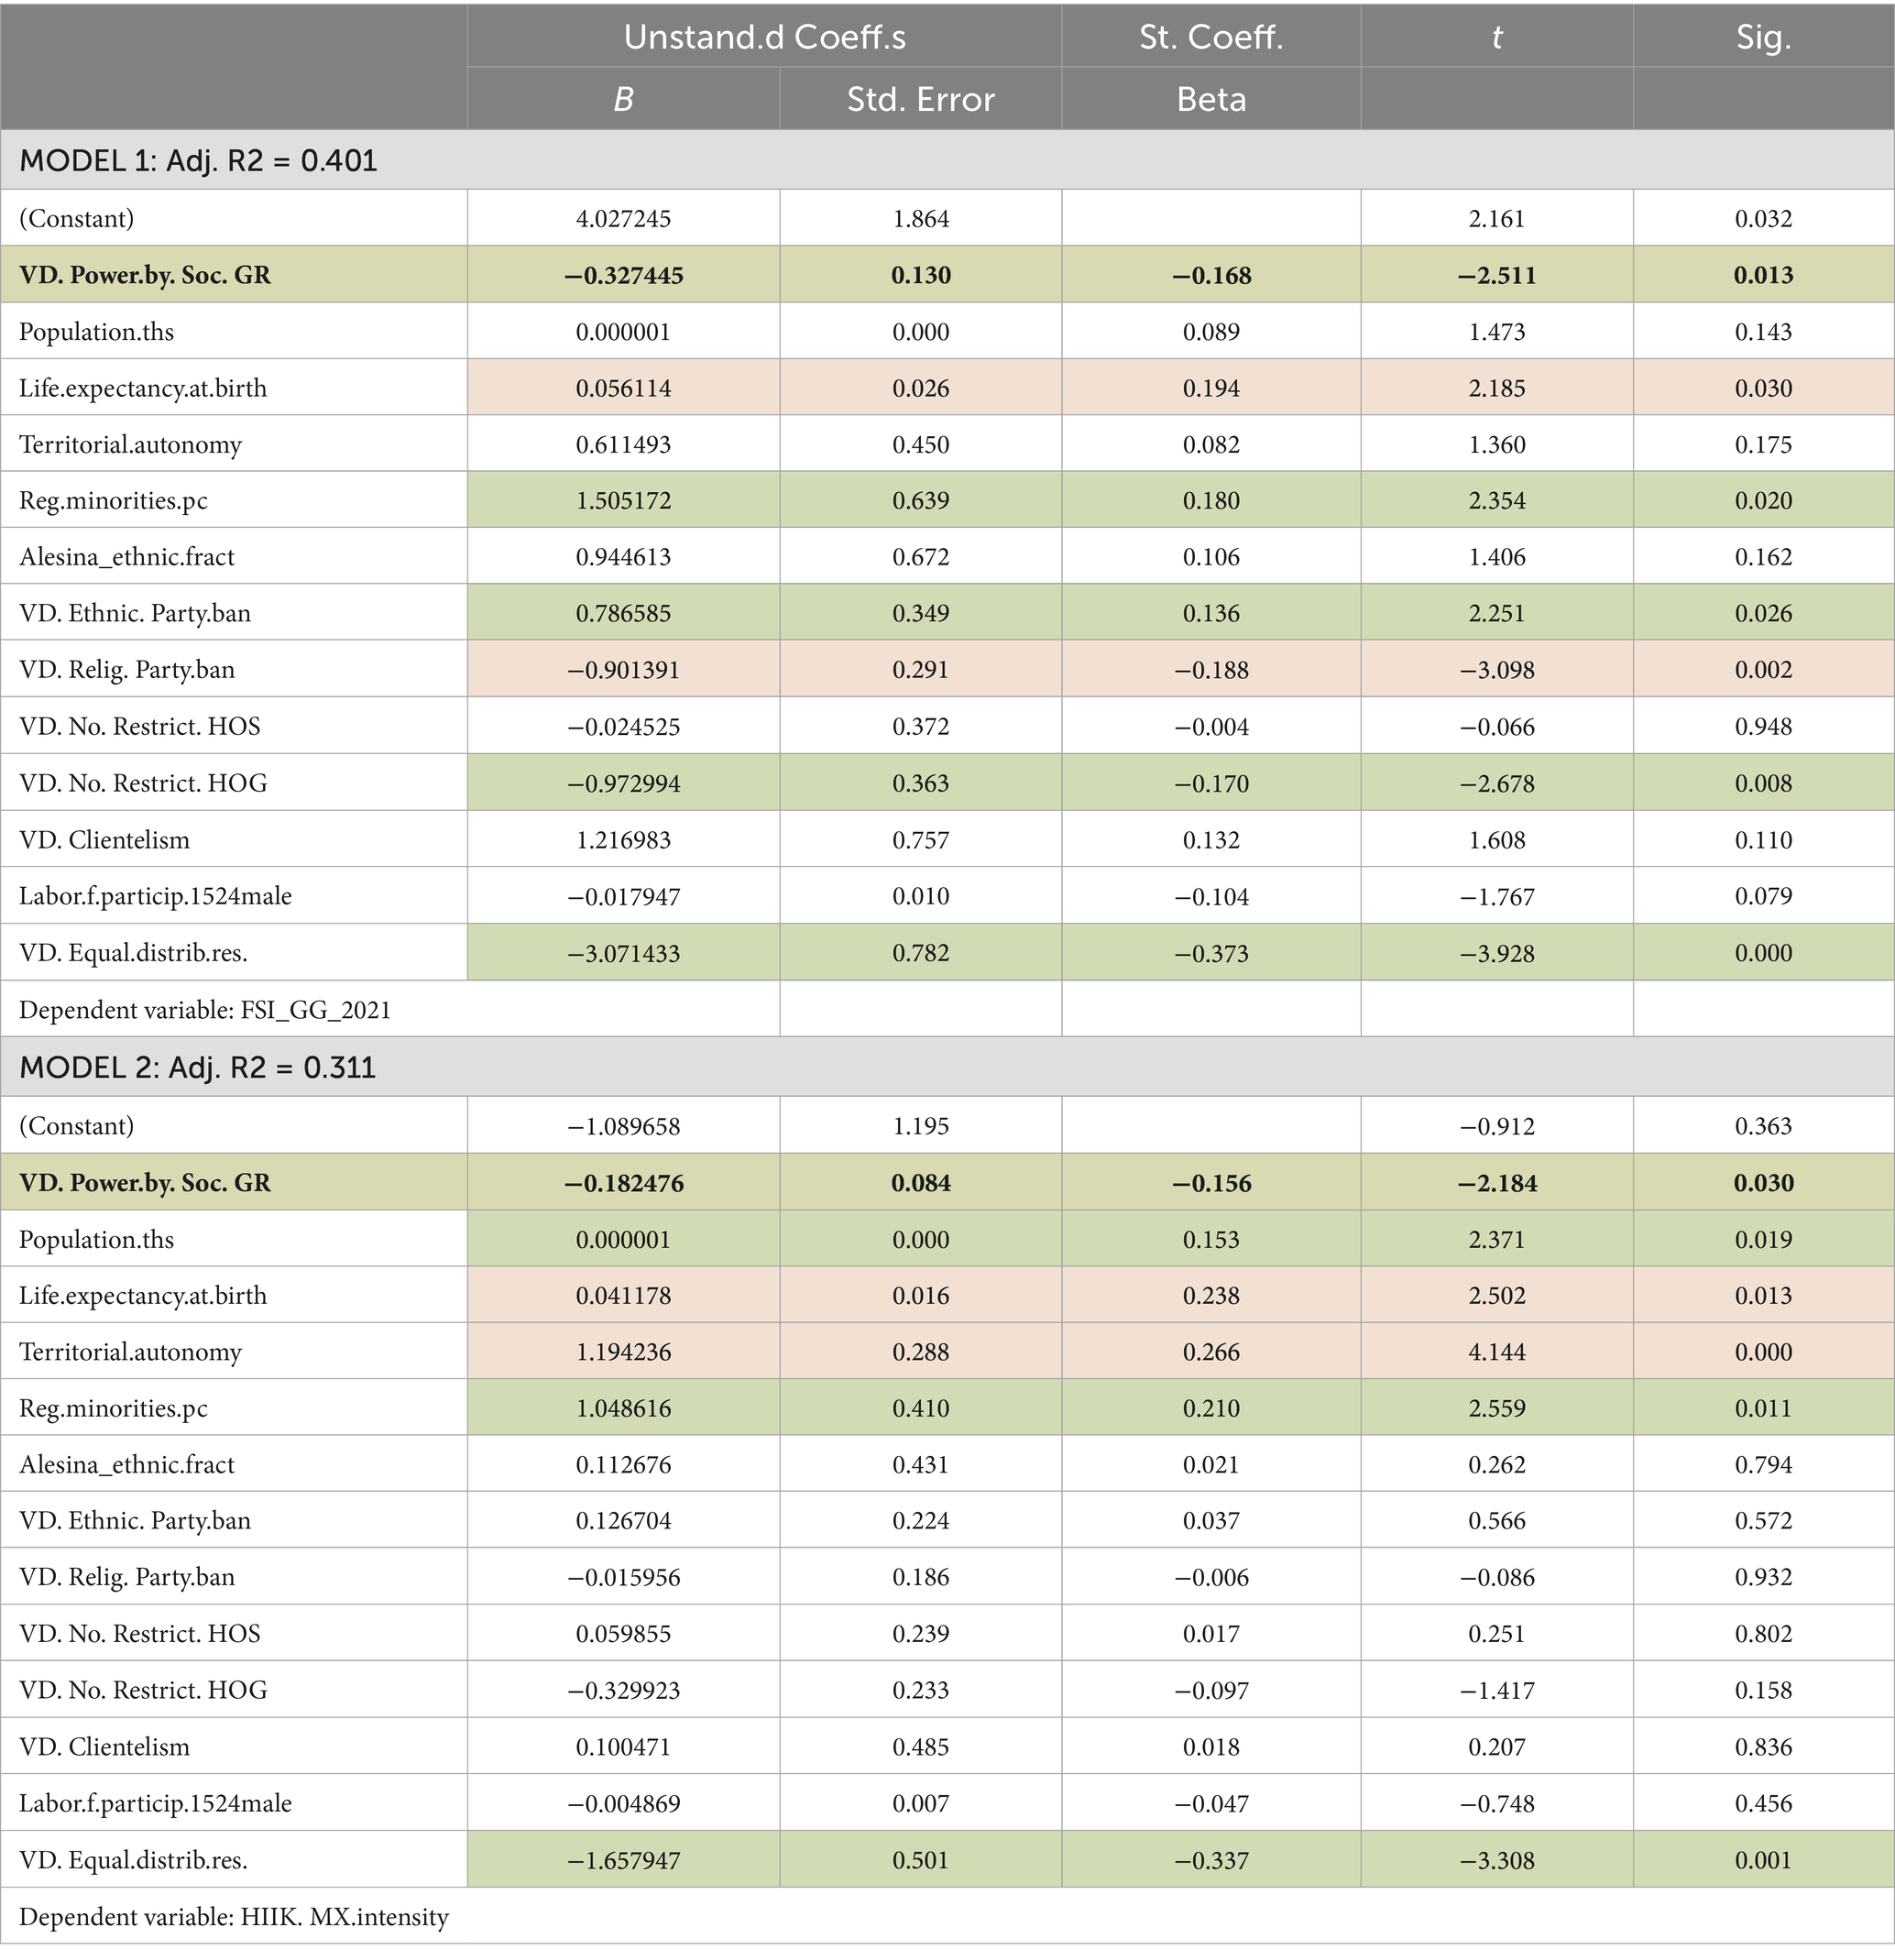
Table 2. OLS regression models with “Power distributed by social group” indicator.
The models do justice to grievance theories. More political equality (VD. Power.by. Soc. GR) decreases the likelihood of conflict, as does more economic equality (VD. Equal.distrib.res). Territorial autonomy behaves as capriciously as we observed in previous studies; sometimes, it is insignificant, and at other times, it appears to contribute to conflict. The complexity of pinpointing the causes of communal conflicts is mostly displayed by the fact that the development indicator Life.expectancy.at.birth shows up with the unexpected sign, indicating that communal conflict is more common in more developed countries. This may be an artifact resulting from the inter-connectedness of development with other explanatory variables, such as the proportion of regional minorities, ethnic fractionalization, quality of democracy, and egalitarianism, even if the collinearity statistics do not signal dangerous levels of predictor interdependence. Nevertheless, it may also happen that the occurrence of communal conflicts is not curbed by more development when the economic development does not address horizontal economic, political, and cultural inequalities. Ethnic fractionalization does not influence the conflict levels, but the proportion of regional minorities does increase them. However, we should not forget that the Reg.minorities.pc variable comes from the EPR dataset, which contains only politically active communal groups, while the Alesina fractionalization index does not make this restriction.
For our analyses, the main takeaway from Models 1 and 2 is the impact of the political empowerment indicator VD. Power.by. Soc. GR. In Models 3 and 4, this is replaced with our new measure of regional political empowerment, LN. Incongruence. IdxCentralization. Table 3 shows that the latter has the same type and almost the same strength of impact on communal conflict outcomes. Its standardized coefficients are only slightly below the betas of VD. Power.by. Soc. GR in Models 1 and 2.
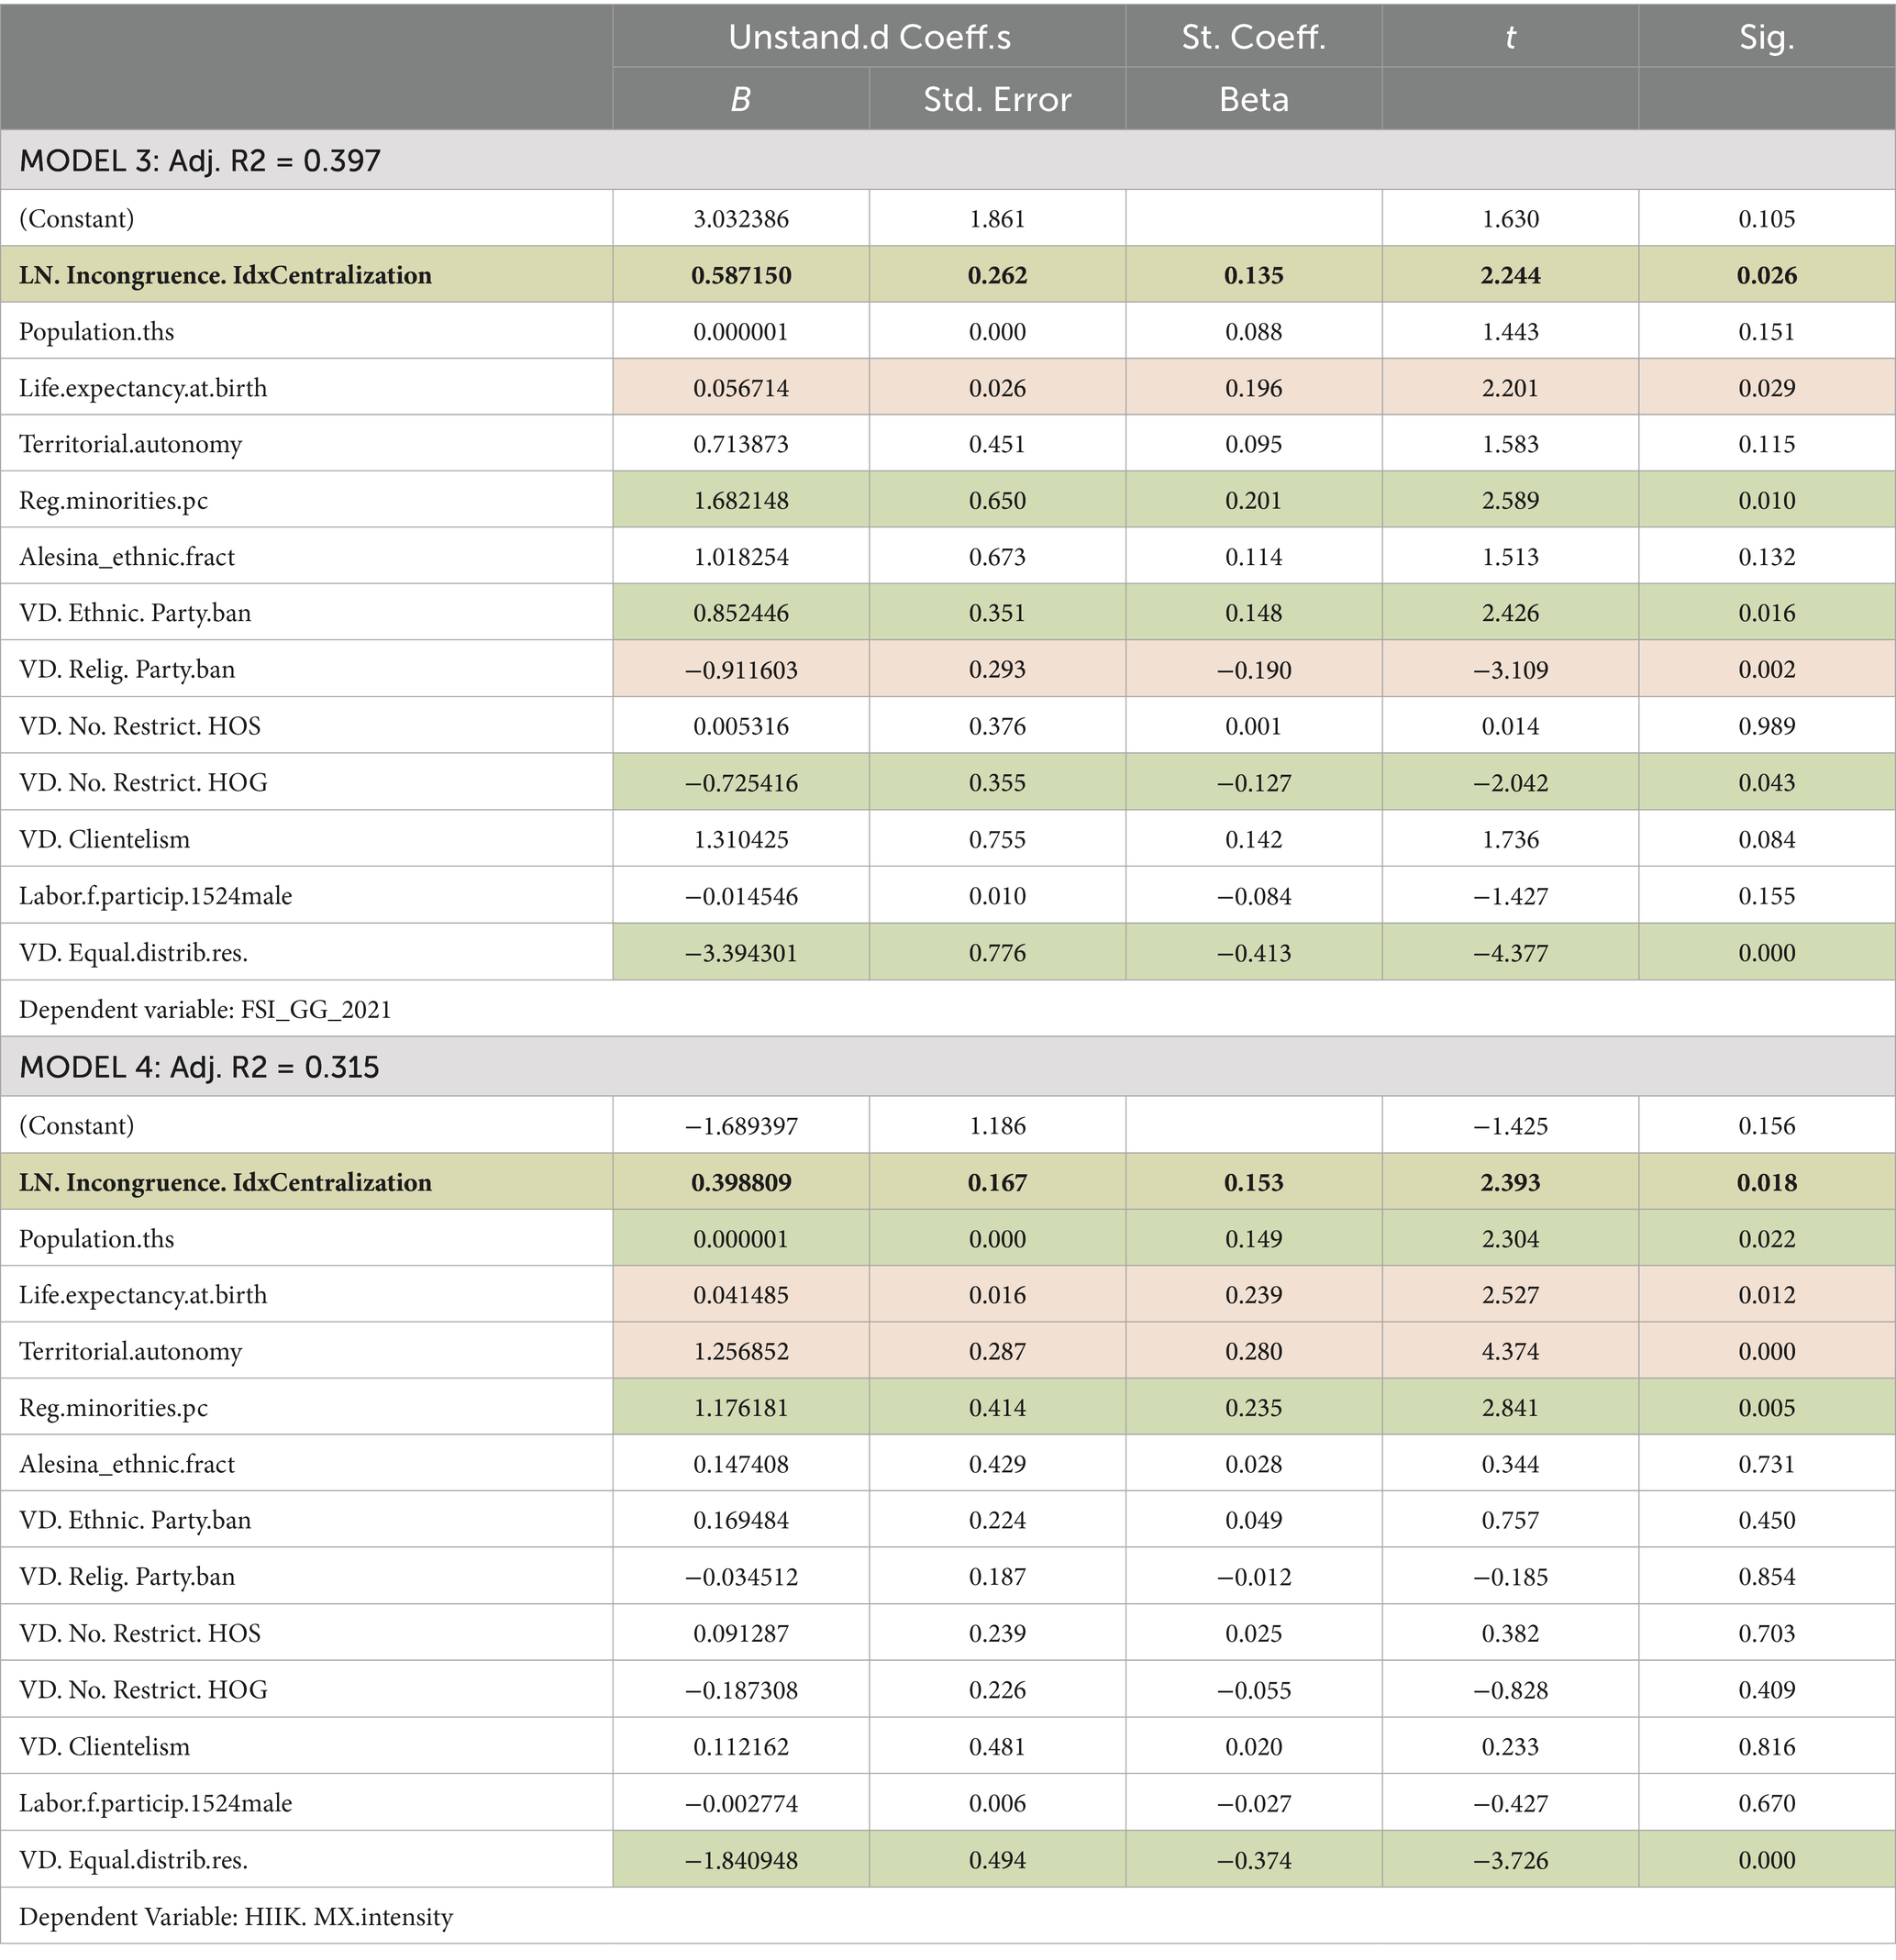
Table 3. OLS regression models with “LN. Incongruence. Idx*Centralization” indicator.
2.3.3 XGBoost models
We believe that the above OLS models illustrate quite well that policies promoting congruence and decentralization improve inter-group relations in a country, yet one may object to anchoring far-reaching conclusions in a hand-picked set of 13 explanatory variables. Thus, we have made an attempt to involve credibly unbiased artificial intelligence in assessing the predictive power of our IVs.
We have still applied some selection but imported 21 explanatory variables in an XGBoost algorithm carried out in R. We ran the algorithm twice, separately, with the two dependent variables previously used in the OLS models.
Figures 2, 3 show the outputs from the model using FSI_GG_2021. The R2 of the test data was 0.871, and Figure 2 shows the importance order of the first 20 predictors out of 21; that is, their strength in predicting the outcome, as seen by the AI. The “odd out,” not included in the first 20, was the territorial autonomy measure. Our LN. Incongruence. IdxCentralization comes in 11th place, weaker than VD. Power.by. Soc. GR, but stronger than Polit. Centralization. Thus, the congruence of administrative units with ethnic settlement patterns counts significantly. The “importance” order does not indicate the direction of the impact, as illustrated in Figure 3 by the color-coded dots. As for LN. Incongruence. IdxCentralization, the colors show a positive association between the predictor and the outcome variable, meaning that higher levels of Incongruence*Centralization lead to higher conflict levels. Several stronger predictors have the theoretically expected direction of impact; however, the fractionalization index (Alesina_ethnic) suggests that higher fractionalization leads to greater peacefulness and the nationalist curriculum’s direction of impact cannot be unambiguously established. We may assume a curvilinear relationship between this IV and the outcome.
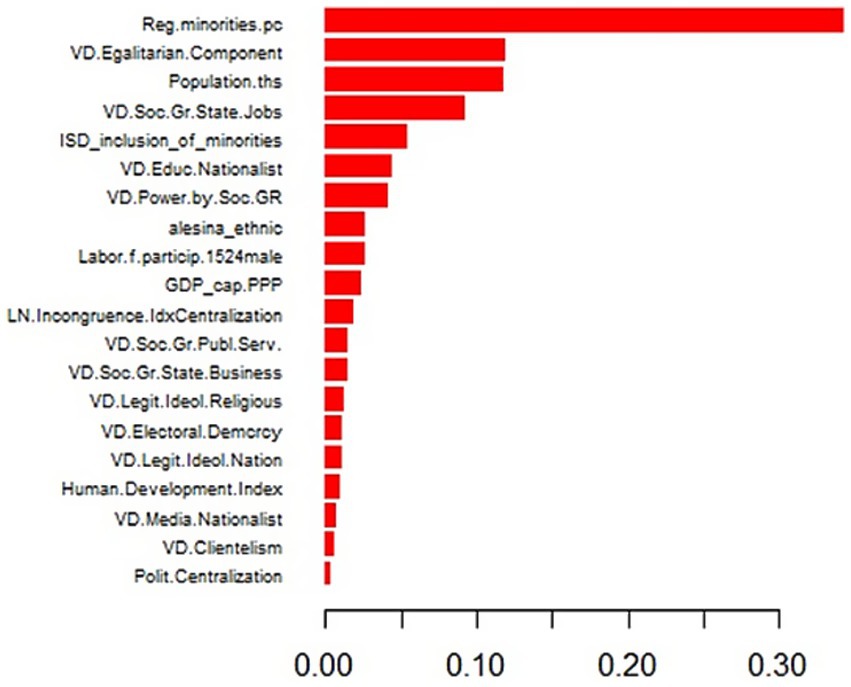
Figure 2. Importance order of 20 predictors of FSI_GG_2021, as chosen by AI (XGBoost).
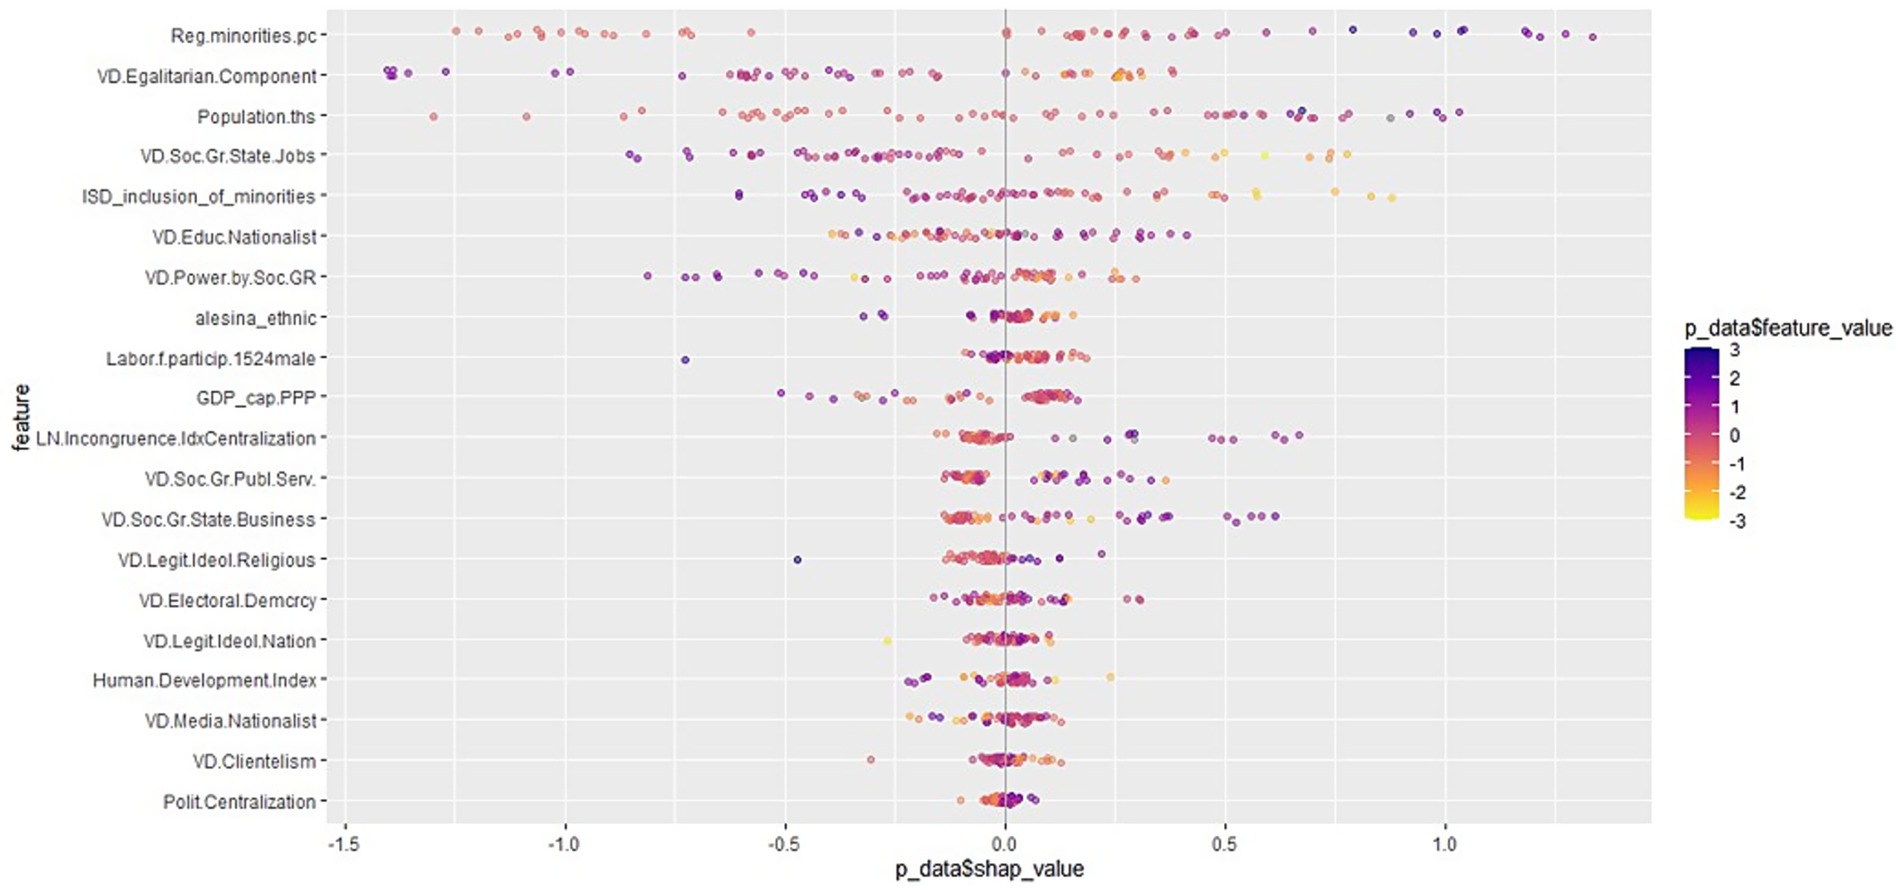
Figure 3. Details of the impact of 20 FSI_GG_2021 predictors (XGBoost).
Figures 4, 5 show outputs from the model with HIIK. MX.intensity as its dependent variable. This model was significantly weaker than the previous one. The test data R2 was assessed as 0.351. There are some dramatic differences in the rank order of the predictors. LN. Incongruence. IdxCentralization now ranks in the 15th position, territorial autonomy in the 10th position, and the “odd out” is now the measure of social groups’ equal access to state jobs (VD. Soc. Gr. State. Jobs). This model does justice to the “opportunity” approach to communal conflict, as well as the young men’s labor force participation, which turns up as the third predictor, with the theoretically expected sign. Only the population size and the comprehensive egalitarianism measure surpass its strength. Unfortunately, there are more predictors with ambiguous impact direction and LN. Incongruence. IdxCentralization is among them.
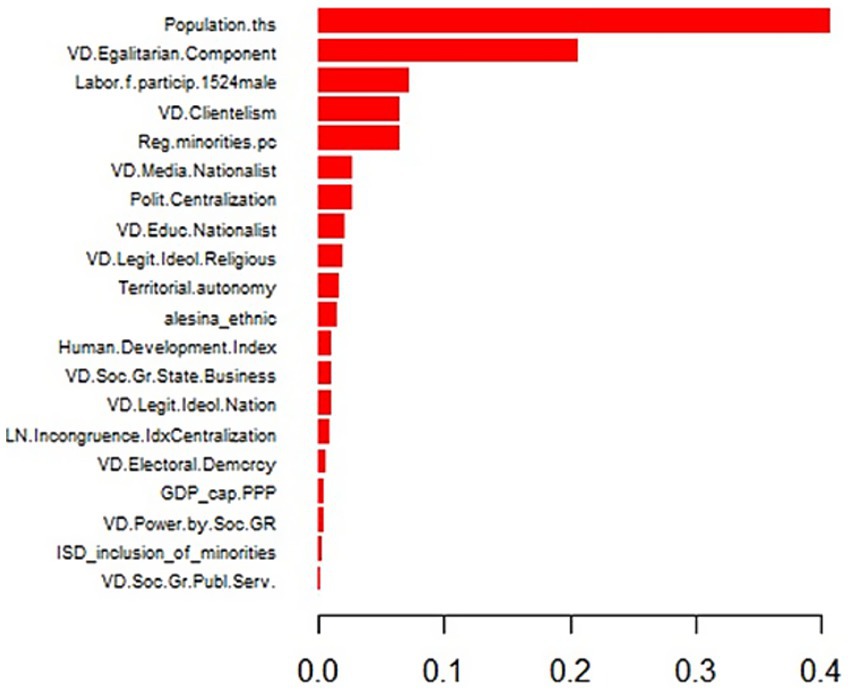
Figure 4. Importance order of 20 predictors of HIIK. MX. Intensity, as chosen by AI (XGBoost).
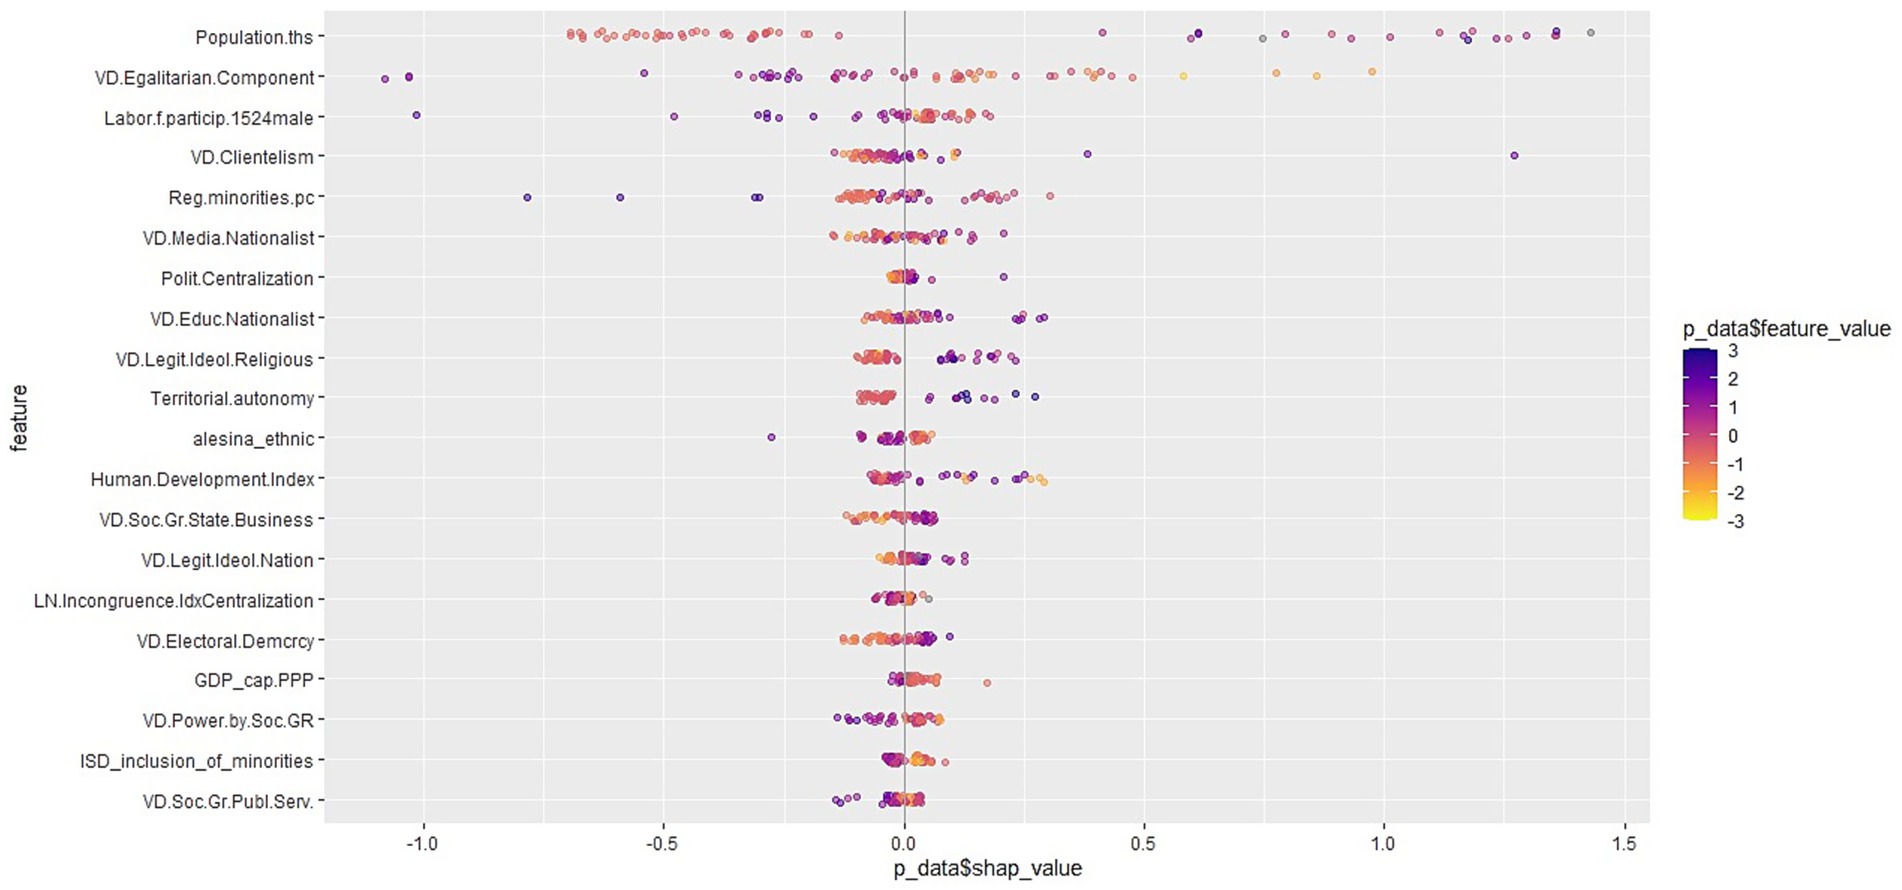
Figure 5. Details of the impact of 20 HIIK. MX. Intensity predictors (XGBoost).
3 Results
1. Using relatively simple and replicable methods, we developed an indicator of the congruence between first-level administrative units and communal settlement patterns worldwide (LN. Incongruence. Idx). The method relies on open-source data and software sources, which are continuously updated by dedicated teams: the Ethnic Power Relations (EPR) project, the GADM (gadm.org) project, and the QGIS software. That is, the Incongruence measure itself can be replicated for previous and future years as needed. The only “manually executed” step in applying the method was discarding some administrative units factored in by the QGIS “Intersect” spatial join procedure, namely those that fell in adjacent countries. These cases are easily identifiable in the dataset if we preserve all variables from both sides of the merge, including the country names from both components.
2. The method also produces a number of new measures describing various geographic aspects of communal coexistence, such as the average number of people in administrative units and the average number of communal groups, and allows for pursuing research questions different from our territorial empowerment issue. For instance, we compared the incongruence levels of regional majorities and minorities and found a striking advantage for majorities.
3. Our dataset confirmed previous findings about the pacifying effects of political equality (here mainly measured with VD. Power.by. Soc. GR, and with ISD_inclusion_of_minorities), but also about the antithetic or ambiguous impact of territorial autonomy (here mainly measured with Territorial.autonomy, and also with its components ERA_exists and EPR.regautpop).
4. The inclusion of a measure of regional minority proportion (Reg.minorities.pc) highlighted that the mere existence of regional minorities may be more at fault for the troubles associated with territorial autonomies than this institutional form in itself. Reg.minorities.pc emerged as a powerful predictor in all models, consistently indicating that a higher proportion of regional minorities leads to more conflict. The caveat associated with this finding is that the list of regional minorities is provided by the EPR project that does not factor in all communal groups worldwide. They only include those that are politically active, and some numeric thresholds also apply. We would say that this list is somewhat biased toward the groups that have already been involved in conflicts. Nevertheless, the main reason to expect that a higher proportion of regional minorities leads to more conflict is that regionally based populations are more frequent in less developed countries, where ethnic clientelism-based autocracies are also more frequent and social tensions are more likely to erupt in violent conflicts.
5. Our main hypothesis guiding the study was that allowing minorities to regionally self-govern may alleviate intergroup animosities and lead to more peaceful coexistence. Despite the negative track record of territorial autonomies, we believe in this because of the positive track record of all other forms of accommodating heterogeneity, such as political equality in co-determination and various functional (non-territorial) autonomies. This hypothesis received support from all four OLS models and the XGBoost model run on the Fragile State Index’s “Group Grievance” indicator. The XGBoost model run on the HIIK-based Intensity indicator yielded a more ambiguous result, ultimately, which appeared to be due to the relationship between LN. Incongruence. IdxCentralization and HIIK. MX. Intensity is curvilinear rather than linear.
6. Data indicate that a greater prevalence of nationalist discourse in education and media is associated with increased domestic conflict, lower levels of development, and less egalitarianism of any kind, including reduced accommodation and integration of minorities.
4 Discussion and conclusion
Attempts to probe the impact of diversity policies on inter-group relations face a double jeopardy. On the one hand, the construction of the measures themselves is a thorny and controversial task, and on the other, the majority of measures of minority conditions are intermeshed, resulting in predictive uncertainty and collinearity issues in regression models.
In the case of the Incongruence measure, the source data imposed some limits. EPR, the sole source for geo-coded ethnic settlement areas, factors in only the politically active groups, less than two-thirds of the groups that the AMAR project found socially relevant. We had to take the leap of faith and code all countries without EPR-mentioned regional groups as if they were truly lacking any regionally based group, which probably inflated somewhat the number of unproblematic “Incongruence = 0” countries. At the other end of the scale, some distortion occurred because of technicalities related to the QGIS software’s construction of the “intersect” spatial join. In virtue of the common border, the algorithm takes into account the administrative units adjacent to those that effectively overlap with the ethnic settlement areas. We are not aware of any coding solution that could easily remove these units from the pool, and a manual purge of them (beyond the units falling in a neighboring country) would render the method unappealing for further iterations. We hope that the logarithmic transformation smooths out some frequency spikes due to this common-border issue.
We can envision several future applications and improvements to creating an incongruence measure.
• First, there is a possibility to incorporate it into historical (time series) datasets. The core EPR spans 1946–2021, while the GADM project began in 2009. Thus, we already have 14 years’ worth of raw material for the indicator, and both projects are highly likely to be continued at least over the next decade.
• There is a possibility of going deeper and factoring in smaller administrative units, such as GADM’s ADM02 and even ADM03 levels.
• We may also hope that the number of politically active and relevant groups increases in the future, bringing the number of EPR groups closer to the number of AMAR groups and that we find a spatial join possibility that eliminates adjacent units.
Additionally, the method has several practical applications. Our focus in this study has been purely academic; that is, we want to add a new measure to the toolbox of domestic heterogeneity studies. Nevertheless, an incongruence measure may be a powerful argument for minority representatives negotiating new administrative divisions in a country, analogously to the map-based arguments used in the decennial redistricting in the US (Actually, in all majoritarian electoral systems, when the electoral districts need to be redrawn, the parties struggle to maximize the voting power of their own voter base).
Reflecting on the academic value of the new tool, we believe that the feasibility of an incongruence measure and its predictive value, as demonstrated in the analytical part, underscores the importance of rethinking approaches to minority self-governance. The grievance-based approaches to communal conflict tend to rely on the impact of political inequality in co-determination, and the only self-determination measure with prominence has been territorial autonomy. Unfortunately, this measure appears to be flawed due to its varying definitions, dependence on the existence of regional minorities, and heavy path dependence.
The main reason for our endeavor to introduce LN. IncongruenceIndCentralization was to decouple the notion of territorial self-government from its operationalization as territorial autonomy and give the former a chance to display its real nature.
We believe that all forms of minority self-government are likely to foster better inter-group relations, and non-territorial autonomies do not receive the academic interest they deserve. The European Non-Territorial Autonomy Network (ENTAN, https://entan.org/) did an excellent job during its active period (2019–2023) but fell short of achieving quantitative measures with worldwide coverage. We believe that similar wide coverage measures are needed for both academic and practical purposes.
In scholarly literature, a long-standing dispute has arisen over the comparative value of centripetal and accommodating policy bundles, and it is unlikely that small-N qualitative studies will ever provide definitive arguments. Large-N studies, and those with historical breadth, in particular, are better suited for this task.
In practice, heterogeneity management within each country involves making daily decisions about which policies to adopt, implement, or discontinue. We hope that these decisions will be informed by data and that researchers will provide policymakers with actionable insights. A list of all diversity management tools is a valuable starting point, and attaching expected impact values to them would be highly desirable.
Nevertheless, we still struggle to compile a comprehensive list of all policies that affect inter-group relations, and the assessment of their impact is also hindered by several real-life and methodological issues. The single biggest epistemic impediment is the inter-relatedness of all heterogeneity management policies, in addition to their inter-relatedness with other country features, such as development, democracy, and egalitarianism levels.
Moreover, all these are interrelated not only for researchers but also for each individual in every society, who constructs their identity and makes political choices in a multidimensional real world with a multitude of personal goals to pursue. The MAR project addressed this issue by characterizing the communal groups’ condition in three basic dimensions—political, economic, and cultural—while also acknowledging the importance of social equality. The next step would be to map the possibilities of tradeoffs among these domains and the conditions that make a group inclined to make tradeoffs. For example, when a group transitions from regional concentration to more urbanism, cultural autonomy, such as language use in administration, education, and media, may become more important to them than territorial autonomy. And in a way, political power is just instrumental in achieving economic and cultural wellbeing. Some groups willingly relinquish demands for political power because they are economically well-integrated and pursue leisure time and cultural autonomy. This is the case, for instance, of Aromanians in Greece: they do not ask to be recognized as an ethnic minority but only as a cultural community. The Chinese in Thailand, an economically advantaged minority, have been working on becoming assimilated into the Thai majority since they immigrated there at the end of the 19th and early 20th centuries and do not aim to wield political power as a group.
These considerations make the synthetic indicators of minority conditions (such as the ISD_inclusion_of_minorities) more appealing for research and are also effective at predicting imminent conflicts. However, in policy-making practice, we still need to evaluate the measures one by one, as clearly defined as possible. We hope that this study contributes to this task.
Data availability statement
The original contributions presented in the study are included in the article/Supplementary material. Further inquiries can be directed to the corresponding author.
Author contributions
AK: Conceptualization, Data curation, Methodology, Resources, Visualization, Writing – original draft, Writing – review & editing. KK: Conceptualization, Methodology, Writing – original draft, Writing – review & editing.
Funding
The author(s) declare that no financial support was received for the research and/or publication of this article.
Conflict of interest
The authors declare that the research was conducted in the absence of any commercial or financial relationships that could be construed as a potential conflict of interest.
Generative AI statement
The authors declare that no Gen AI was used in the creation of this manuscript.
Publisher’s note
All claims expressed in this article are solely those of the authors and do not necessarily represent those of their affiliated organizations, or those of the publisher, the editors and the reviewers. Any product that may be evaluated in this article, or claim that may be made by its manufacturer, is not guaranteed or endorsed by the publisher.
Supplementary material
The Supplementary material for this article can be found online at: https://www.frontiersin.org/articles/10.3389/fpos.2025.1553117/full#supplementary-material
Footnotes
1. ^This scholarly debate is generally referred to as the tension between centripetal (integrationist) and consociational (accommodating) constitutional designs, often labeled with the names of two classic protagonists of these standpoints, Donald Horowitz and Arend Lijphart.
2. ^One of the works that really showcases the wide gamut of policy tools that states may use to manage their diversity, and speaks to the impact of these policies, is Weller and Nobbs (2010). It encompasses all of the political co-determination, territorial self-determination, and non-territorial self-determination issues. It goes even further, to map the economic and social participation of minorities, as well as the internal democracy of minority associations.
3. ^“According to some scholars, offering ethnic groups regional autonomy triggers secessionist conflict… Other scholars [see decentralization] as effective modes of governance in ethnically divided societies” (Cederman et al., 2015, p. 354).
4. ^Based on the criterion of social relevance, the AMAR project (http://www.mar.umd.edu/amar_project.asp) compiled a list of 1,202 communal groups, which means that 458 socially relevant groups are not politically active. All AMAR groups have at least 100,000 members or constitute 1 % of their country’s population (see Birnir et al., 2018 for detailed description).
5. ^“Decentralization has been an important reform in many developing countries and a major focus of the considerable support provided by development partners [such as the World Bank] to public sector reform” (Eaton et al., 2011).
6. ^The next OECD/UCLG report, from 2022, states that during the pandemic, between 2019 and 2020, “subnational expenditure increased on average by 2.6% in real terms … for 61 countries” (OECD/UCLG, 2022; p. 12). Nevertheless, the pandemic made the accurate measurements of the trend more difficult.
7. ^It seems that the cases picked up by Contains and Within are small in number and too specific to make a difference. For instance, China has 36 regional groups in EPR, thus six of the smallest ones do not fully alter its overall congruence rating.
8. ^The V-Dem project covered most countries in the dataset, but not all. We imputed 10 values from the Ivanyna and Shah dataset, and 11 microstates (such as Kiribati, Nauru, and Tonga) were imputed based on encyclopedia information about the respective countries.
9. ^A caveat is in order here, though. A measure that focuses on elections may be expected to make a difference only in countries that have regular, clean and fair elections. Since these are rare in the developing world, the political Centralization indicator can be expected to have more impact in the developed country group than in the developing.
10. ^Interval variables lend themselves to OLS regressions, which makes the models’ strength and the coefficient values more intuitively comparable than the logistic or ordinal models.
11. ^The older name of the database, introduced by Pfetsch and Rohloff (2000), was KOSIMO.
12. ^For instance, a xenophobic anti-immigration mobilization is communal, but not a majority-minority conflict. The xenophobes are just a (normally small) part of the country’s communal majority, and the migrants are not citizens.
13. ^The V-Dem project aims at calculating an index of egalitarian democracy, and maps the level of egalitarianism in countries along vertical and horizontal cleavages (that is, along social classes and communal groups, which they call “social groups”), as well as by gender and urban–rural gaps. The V-Dem Codebook (v.14, p. 212) states that “A social group is differentiated within a country by caste, ethnicity, language, race, region, religion, or some combination thereof. (It does not include identities grounded in sexual orientation or socioeconomic status).”
14. ^We have previously been acquainted with the situation in Africa (see Moroff, 2010).
15. ^An index showing the language policies of states, that is, whether they allow for use of minority languages in administration, education, and mass-media, was advanced by Koos (2016), yet it has not been updated since.
16. ^Figure 1 is actually a larger table with some color coding. The statistically significant predictors are colored according to the theoretically expected direction of impact—the conforming ones with green, and those that show up with the unexpected sign, with a reddish color. The statistically insignificant coefficients were not included in the table. The same color conventions apply to Tables 2 and 3, as well.
References
Alesina, A., Devleeschauwer, A., Easterly, W., Kurlat, S., and Wacziarg, R. (2003). Fractionalization. J. Econ. Growth 8, 155–194. doi: 10.1023/A:1024471506938
Barter, S. J. Territorial autonomy across Asia: assessing challenges, addressing concerns. Asia Policy, (2024), 19, 177–204. Available online at: https://www.nbr.org/publication/territorial-autonomy-across-asia-assessing-challenges-addressing-concerns/.
Birnir, J. K., Laitin, D. D., Wilkenfeld, J., Waguespack, D. M., Hultquist, A. S., and Gurr, T. R. (2018). Introducing the AMAR (all minorities at risk) data. J. Confl. Resolut. 62, 203–226. doi: 10.1177/0022002717719974
Cederman, L.-E., Hug, S., Schädel, A., and Wucherpfennig, J. (2015). Territorial autonomy in the shadow of conflict: too little, too late? Am. Polit. Sci. Rev. 109, 354–370. doi: 10.1017/S0003055415000118
CEPII (2016). Institutional profiles database. Available online at: http://www.cepii.fr/institutions/EN/ipd.asp.
Collier, P., and Hoeffler, A. (2004). Greed and grievance in civil war. Oxf. Econ. Pap. 56, 563–595. doi: 10.1093/oep/gpf064
Coppedge, M., Gerring, J., Knutsen, C. H., Lindberg, S. I., Teorell, J., Altman, D., et al. (2024) V-dem codebook v14 varieties of democracy (V-Dem) project.
Cruz, C., Scartascini, C., and Keefer, P. (2017). Database of political institutions. Inter-American Development Bank. Numbers for Development. Available online at: https://mydata.iadb.org/Reform-Modernization-of-the-State/Database-of-Political-Institutions-2017/938i-s2bw.
Eaton, K., Kaiser, K., and Smoke, P. J. (2011). The political economy of decentralization reforms: implications for aid effectiveness. Directions in development; public sector governance. Washington, DC: World Bank. Available online at: https://openknowledge.worldbank.org/handle/10986/2336.
Ethnic Power Relations (EPR/Grow-up) Database. (n.d.). Eidgenössische Technische Hochschule (ETH) Zurich’s Grow-up portal. Available online at: https://icr.ethz.ch/data/ (Accessed December, 2024).
FSI. (2021). Fragile states index (FSI) database by the Fund for Peace and The New Humanitarian. Available online at: https://fragilestatesindex.org/.
Heidelberg Institute for International Conflict Research (2022) Conflict barometer. Available online at: https://hiik.de/conflict-barometer/bisherige-ausgaben/?lang=en.
International Institute of Social Studies of Erasmus University Rotterdam. Indices of Social Development Database. Available online at: https://www.indsocdev.org/
Ivanyna, M., and Shah, A. (2014). How close is your government to its people? Worldwide indicators on localization and decentralization. Econ. Open-Access Open-Assess. E-J. 8, 1–61. doi: 10.5018/economics-ejournal.ja.2014-3
Kaufmann, D., Kraay, A., and Mastruzzi, M. (2010). The worldwide governance indicators: methodology and analytical issues. World Bank policy research working papers no. 5430. Available online at: https://ssrn.com/abstract=1682130.
Koos, A. K. (2016). Constitutional definition of the demos and inter-ethnic relations. Policy Polit. 44, 639–676. doi: 10.1111/polp.12170
Lemarchand, R. (2007). Consociationalism and power sharing in Africa: Rwanda, Burundi, and the Democratic Republic of the Congo. Afr. Aff. 106, 1–20. doi: 10.1093/afraf/adl041
Moroff, A. (2010). Party bans in Africa – an empirical overview. Democratization 17, 618–641. doi: 10.1080/13510347.2010.491184
OECD/UCLG. (2019). Report of the World Observatory on Subnational Government Finance and Investment – Key Findings. Available online at: http://www.sng-wofi.org/publications/2019_SNG-WOFI_REPORT_Key_Findings.pdf, p. 10.
OECD/UCLG. (2022). 2022 synthesis report World Observatory on Subnational Government Finance and Investment. Available online at: https://www.oecd-ilibrary.org/urban-rural-and-regional-development/2022-synthesis-report-world-observatory-on-subnational-government-finance-and-investment_b80a8cdb-en.
Panov, P., and Semenov, A. (2018). The world of ethnic regional autonomies: introducing the new dataset. Nationalism Ethnic Polit. 24, 478–501. doi: 10.1080/13537113.2018.1522763
Pfetsch, F. R., and Rohloff, C. (2000). KOSIMO: a databank on political conflict. J. Peace Res. 37, 379–389. doi: 10.1177/0022343300037003006
Reynal-Querol, M. (2005). Does democracy preempt civil wars? Eur. J. Polit. Econ. 21, 445–465. doi: 10.1016/j.ejpoleco.2004.08.003
Schulte, F. (2018). The more, the better? Assessing the scope of regional autonomy as a key condition for ethnic conflict regulation. Int. J. Minor. Group Rights 25, 84–111. doi: 10.1163/15718115-02501001
Keywords: domestic conflict, communal groups, minority self-governance, congruence of administrative units and ethnic settlement areas, decentralization
Citation: Koos AK and Keulman K (2025) Beyond autonomous regions: measuring communal self-governance. Front. Polit. Sci. 7:1553117. doi: 10.3389/fpos.2025.1553117
Edited by:
Stylianos Ioannis Tzagkarakis, Hellenic Open University, GreeceReviewed by:
Ahmad Martadha Mohamed, Universiti Utara Malaysia, MalaysiaM. Faishal Aminuddin, Brawijaya University Hospital, Indonesia
Copyright © 2025 Koos and Keulman. This is an open-access article distributed under the terms of the Creative Commons Attribution License (CC BY). The use, distribution or reproduction in other forums is permitted, provided the original author(s) and the copyright owner(s) are credited and that the original publication in this journal is cited, in accordance with accepted academic practice. No use, distribution or reproduction is permitted which does not comply with these terms.
*Correspondence: Agnes Katalin Koos, YWduZXNAYWduZXNra29vcy5uZXQ=;YWtvb3NAdW5yLmVkdXQ=