Abstract
This study examines the evolution of electoral behavior in Rome during the Second Republic (1993–2024), analyzing the relationship between urban morphology, socio-graphic structures, and political allegiance. Electoral and census data, disaggregated and re-aggregated by toponymic zones instead of administrative units, are visualized through GIS-based cartographic projections. The use of toponymic zones, deeply rooted in Rome’s historical culture, geographical morphology, and social values, enables a finer-grained analysis of electoral alignments that captures lived spatial identities. The findings trace the persistence and transformation of spatial cleavages, highlighting the enduring significance of concentric and radial electoral divisions shaped by infrastructural lines such as the Grande Raccordo Anulare, the Fascia verde, the Aurelian Walls and ancient consular roads. Despite shifts in political supply and voter volatility, certain socio-territorial cleavages remain remarkably stable, reflecting deeper historical, cultural, and socio-economic structures. The study contributes to debates on the resilience of urban territorial belongings and the spatial mediation of political behavior, underlining the importance of historically sedimented spatial units in electoral analysis.
1 Introduction
The 2024 European elections marked the closure of a 31-year cycle that began with the electoral reforms of 1993, when Rome, together with Milan, Turin, and Naples, held its first direct mayoral elections. The same year, following referenda, new electoral laws were introduced for both chambers of Parliament, initiating a partial transition to a majoritarian system—reforms repeatedly modified over time and occasionally reviewed by the Constitutional Court. In 2001, constitutional reforms granted increased autonomy to regional governments, including the regulation of their own electoral systems. Progressively, Rome acquired the special status of Roma Capitale and metropolitan cities were established. Party organizations, political communication, and electoral behavior also underwent profound changes, with ideological loyalty giving way to volatile, media-shaped opinions and voting preferences.
Local electoral dynamics began to reflect a complex interplay between national-level coalitions and local innovations—civic lists, movement-based candidacies, and political entrepreneurship by local elites seeking influence either nationally or within the control of urban consensus. National politics and media discourses shaped short-term electoral reactions, especially around security, corruption, and administrative performance, while interacting with long-term demographic, social, and increasingly territorial structures. Urban development has introduced not only socio-economic stratification but also spatialized political identities, which cannot be reduced to mere geographic clusters.
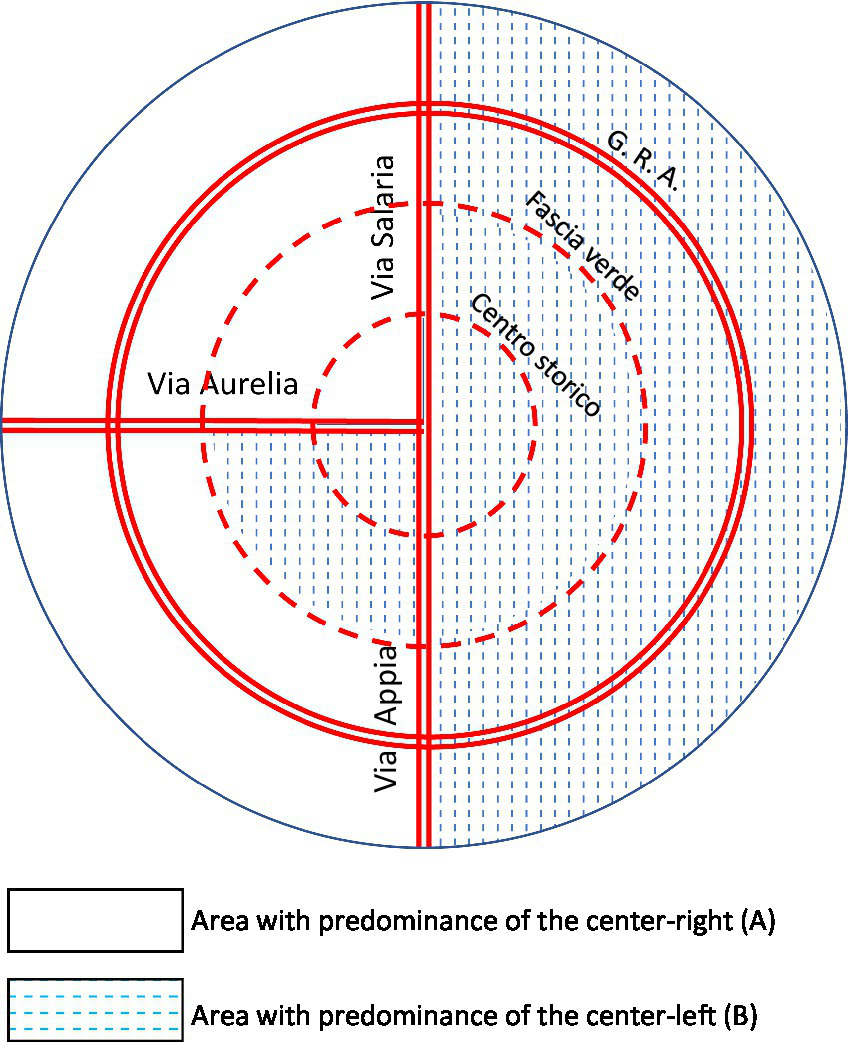
This article presents a longitudinal, spatial analysis of Rome’s electoral geography from 1993 to 2024, with a focus on intra-urban cleavages and their evolution. Building on extensive electoral and socio-graphic data and employing GIS-based cartographic projections, we examine how voting patterns correspond to the city’s morphological and socio-economic divisions. In doing so, we draw attention to the persistence of territorial lines of conflict, challenging interpretations that assume increasing urban electoral homogenization (Agnew, 1987; Johnston et al., 2001). Although this study does not draw directly on classical cleavage theory (Lipset and Rokkan, 1967) or the urban ecological model developed by the Chicago School (Park and Burgess, 1925), both frameworks are recalled to provide a spatial lens for interpreting electoral behavior. The former highlights persistent socio-territorial divides—particularly the center-periphery cleavage—while the latter provides a reference point for understanding urban development processes. In the case of Rome, this perspective is especially relevant in relation to the concentric structures that shape the city’s spatial organization, such as the Aurelian Walls, the Fascia verde, and the Grande Raccordo Anulare. Rather than treating Rome as a unified political entity, we highlight its internal heterogeneity shaped by institutional reforms, demographic stratification, and uneven urban development. Electoral behaviors are mediated by spatial structures (Figure 1): from concentric infrastructures like the Grande Raccordo Anulare and the Fascia verde to radial axes of urban expansion, which serve as vectors of both political identity and socio-spatial exclusion (Crisci, 2003).
Figure 1
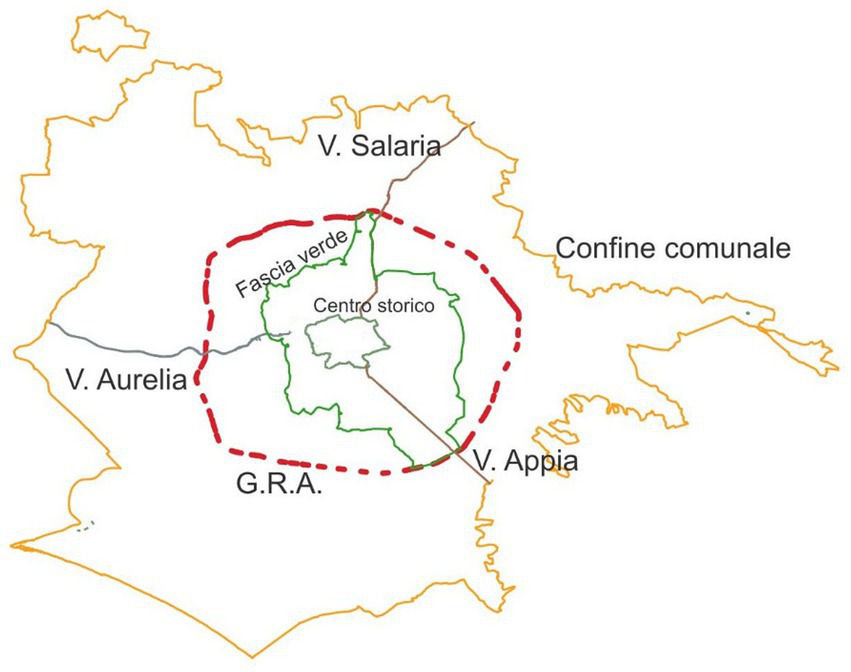
“Royal” map of cleavage lines.
Our analysis engages directly with the literature on urban fragmentation and the territorial structuring of political allegiance (Medeiros, 2016; Dühr et al., 2010), which challenges conventional administrative spatialities and emphasizes the socially embedded nature of space. By employing territorial lens that foregrounds lived space, infrastructural exclusion, and place-based political identity (Mariotti and Marradi, 2021) we show how the geography of the vote in Rome—fragmented along concentric and radiant axes—echoes broader patterns of spatial polarization in European and international metropolises, confirming the active role of territory in mediating political participation and allegiance. Comparative research has examined similar dynamics in cities such as Tel Aviv (Charney and Malkinson, 2015), Budapest (Kovalcsik et al., 2021), Prague and Warsaw (Kerekes, 2020), as well as Cluj-Napoca and Bucharest (Guțoiu, 2018). Among these studies, notably Kerekes (2020) successfully connected the urban ecological model and voting behavior, while Kovalcsik et al. (2021) offered a solution to unify geographically disparate spatial divisions.
We aim to contribute to three strands of literature. First, we offer a detailed empirical reconstruction of Roman electoral dynamics using toponymic zones,1 officially recognized spatial subdivisions that retain deep cultural and historical significance. Second, we test how socio-graphic variables—such as education, employment, and age—correlate with electoral outcomes. Third, we engage with international debates on the persistence of territorial cleavages in urban political behavior, suggesting that the Roman case reflects the durable stratification of urban political space, shaped by long-standing socio-territorial divisions.
This effort also aims to reconstruct a territorialized “electoral history” of Rome in the Second Republic by tracing lines of continuity and rupture across three decades of sub-municipal voting behavior. Inspired by the tradition of Italian electoral cartography and spatial sociology, we apply a perspective that sees space not merely as a container of political facts, but as a structuring force in itself. Electoral behavior, under this view, is partially derivative of urban socio-cultural processes, embedded in historically sedimented and symbolically meaningful places.
The Roman neighborhood—as noted in early urban studies—is a unit of everyday residential experience, shaped by planning, by informal practices of use and appropriation, and by long-standing affective bonds. It is in these units that “atmospheres” of political behavior are cultivated. While administrative divisions such as municipi or precincts are frequently redrawn or fail to map onto local identities, toponymic zones have remained stable and recognizable, and are thus analytically suited to studying the evolution of electoral behavior over time. By adopting toponymic zones as analytical units, this study addresses a gap in existing electoral geography literature, which rarely investigates sub-municipal territoriality in Rome’s political behavior over the long term. The article is structured as follows. First, we reconstruct the historical processes that have shaped Rome’s socio-political space, providing the necessary background to interpret current electoral patterns. We then outline the methodological framework, focusing on the use of toponymic zones for spatial electoral analysis. The results section presents the evolution of electoral behavior from 1993 to 2024, while the discussion interprets these findings in light of theories of spatial cleavages and urban political behavior. The article concludes by summarizing the main contributions and suggesting directions for future research.
2 Historical context
Electoral behavior in Rome must be interpreted through the lens of local political history, institutional development, and urban transformation. While municipal elections often reflect the broader national political climate and long-term socio-economic trends, each election also responds to the singular dynamics of a particular time and place. As Gesualdi (2006) noted, a local system is not merely a fragment of the national system, but a configuration endowed with its own identity, capable of influencing—albeit not exclusively—electoral outcomes.
Despite the centrality of cities in Italian electoral studies, sub-municipal territories have rarely been the focus of systematic analysis—few recent studies have indeed made efforts in this direction, even if over shorter time spans (Crulli and Pinto, 2025; Tomassi, 2024)—due in part to the technical challenges of disaggregation and to the symbolic centrality of the comune as the unit of democratic and community identity. Yet, in large cities like Rome, local histories continue to shape electoral behavior in powerful ways. For example, the role of the Catholic Church in Rome, a major political issue since the foundation of the Italian state, has long influenced both voter behavior and the candidacy strategies of religiously affiliated politicians. The legacy of fascism is equally salient: Rome served as the “theatrical stage and beating heart of the fascist regime,” a city where bureaucratization fostered the rise of new middle classes (Casmirri and Totaro, 2008). Lastly, the city’s chaotic and exclusionary urban sprawl—described as “a metropolis that excludes” and populated by disconnected, inhospitable neighborhoods—has created deep infrastructural and symbolic challenges for governance (Erbani, 2013).
Major cities are thus not only stages for electoral competition but also sites of conflict over territorial identity. The complexity of mapping constantly shifting urban realities highlights the difficulty of capturing stable political meanings in space. The representation of territory has long been central to electoral studies, offering a tool to trace how spatial configurations influence and reflect social dynamics. While traditional electoral geography focused on macro-aggregates such as regions, provinces, and electoral districts—as in Dogan’s (1967)2 classic quadripartition or Barbagli and Corbetta’s (1980)3 regional schemes—such frameworks prove inadequate for understanding the contemporary urban electorate. When territorial boundaries encapsulate shared political cultures, dense networks of local associations, and the dominance of a political force capable of aggregating and mediating interests at the local level, political science has traditionally relied on the category of “territorial political subcultures4” (Trigilia, 1981). However, this category is increasingly insufficient for analyzing the contemporary metropolitan context. Similarly, the concept of “territorial identification” (Cavazza and Corbetta, 2008) struggles to capture the fluid and relational dynamics that now characterize urban political space. Nevertheless, these earlier approaches offer important insights for the development of a new analytic path—one that sees territory as composed of historically sedimented, culturally encoded, and administratively defined units. These structures condition urban practices, social interactions, and ultimately voting behavior. Such a framework moves beyond residual notions of electoral geography to recognize how spatial morphology, infrastructure, and everyday social practices coalesce into politically significant localities.
Understanding urban political behavior therefore requires more than delineating neighborhoods or identifying functional areas. It also entails examining the historical and morphological features of urban space and the “urban practices”—whether collective and intentional or habitual and quotidian—that may seem inconsequential but profoundly shape local identity (Cellamare, 2011). Equally relevant is the influence of “common sense”: shared values, beliefs, and stereotypes transmitted through personal communication and often embedded in defined territorial settings (Diamanti, 2010). These contribute to the formation of neighborhood identities. As Cipollini and Truglia (2015) explain, “a neighborhood consolidates over time through the social activity of the groups who have inhabited it, acquiring a unique social atmosphere that allows its residents to recognize themselves in it.”
This analytical approach also acknowledges empirical limitations. Urban mobility and residential dispersion, especially in cities like Rome, challenge the notion of neighborhoods as stable electoral containers.5 Historic centers may be politically relevant yet demographically hollow, inhabited by tourists and commuters rather than voters. In this sense, the spatial mismatch between places of symbolic centrality and actual residential voting bases undermines the coherence of the democratic community (Golini, 2000).
3 Methodological framework
Our research employs a spatial-political approach to investigate the structuring role of urban space in electoral behavior. The methodological framework integrates electoral sociology, critical cartography, and urban political geography.
The rapid technological development of the 21st century and the intensification of digital tools, combined with the exponential production of data, are transforming the application of methods and techniques across all fields of knowledge. Political and social sciences are no exception: the automation of data analysis is opening new and previously unthinkable paths, though not without the risk of a “fetishism of technique” (Marradi, 2007).
Among the most refined tools in recent years are Geographic Information Systems (GIS), which allow for productive integrations between social big data and georeferenced information using cartographic techniques. These range from simple quantitative infographics to spatial autocorrelation models, used to assess whether a variable’s distribution in space is clustered, dispersed, or random (Truglia, 2009).
Currently, several spatial subdivisions coexist within the municipality of Rome. First among these are the municipi—15 very large administrative areas, each averaging about 175,000 residents. Except for municipi I and II, which include the historic center and nearby areas, and municipio V, the rest are roughly triangular, extending outward from the center to the city’s borders. Within them lie highly heterogeneous realities, devoid of clear territorial identity and often unresponsive to (or unaware of) boundary changes, which have occurred multiple times even during the timeframe analyzed. For many Romans, the municipio remains little more than a site for bureaucratic services. These are therefore units imposed from above by institutional logic, largely disconnected from the city’s socio-spatial structure—a criticism sharply articulated by Tinacci Mosello (2006), who describes them as “imposed without reflection on the socio-spatial order.”
Electoral precincts, though uniform in size, are abstract territorial segments designed for electoral administration. They are small enough to be flexibly aggregated, as are ISTAT census precincts, which primarily serve statistical data collection. However, these two units do not align spatially, and their graphical representation can be technically difficult and analytically complex.
Two alternative spatial frameworks more accurately reflect Rome’s “real” urban geography: the zone urbanistiche, established in 1977, and the toponymic zones.6 The latter—comprising 22 Rioni in the historic center, 35 Quartieri outside the Aurelian Walls (including three in Lido di Ostia), 6 Suburbi, and 56 Zone dell’Agro Romano—constitute the territorial base of our analysis, as they offer, in our view, a capacity to represent the city’s historical, social, cultural, and urban identities. Specifically, the neighborhoods represent relatively homogeneous residential areas in terms of socio-economic morphology and ecological living conditions (De Mucci, 1984). They also reflect long-standing cultural and social traits, with roots visible in voting trends as early as the elections of 1946 and 1948 (Talamo, 2000).
The toponymic zones have a historical and cultural identity that is also evidenced by their explicit designation on Carrara marble plaques affixed to city streets, which indicate not only the name of the street but also its belonging to a specific Quartiere Rione, Suburbio, or Zona. Further testament to this identity is the existence—albeit unofficial—of a heraldic system for the Rioni and Quartieri.
Unlike municipi, which are institutionally defined and frequently redrawn, toponymic zones provide a consistent and culturally resonant territorial framework. Their symbolic coherence has led to their use in defining electoral districts under Parliamentary electoral Law No. 276 and 277 of August 4, 1993 (“Mattarellum”), and again in Parliamentary electoral Law No. 165 of November 3, 2017 (“Rosatellum”). They also enable the aggregation of electoral precincts and ISTAT7 census tracts—two units whose incongruent geometries otherwise complicate spatial analysis—thus offering a stable base for comparison while preserving local specificity. In addition to their historical, cultural, and administrative coherence, the choice of toponymic zones also responds to broader scientific concerns. As Dühr et al. (2010) argue, formal administrative boundaries often obscure the lived spatial realities and socio-political structures that shape political behavior. Similarly, Medeiros (2016) emphasizes the importance of fostering territorial cohesion by recognizing and addressing the real spatial inequalities that underlie governance processes. Our methodological approach thus aligns with both the need to reflect historically sedimented socio-spatial identities and the imperative to move beyond arbitrary administrative frameworks when analyzing electoral behavior.
Electoral and sociographic data are originally collected at the level of electoral precincts and census tracts, two units whose geometries do not coincide. Recent research in Italian electoral geography has increasingly employed precinct-level geocoded data to support spatial analyses (Pinto, 2023). In our case, to harmonize these data sources, we aggregate them at the level of toponymic zones, which offer historical, social, and cultural coherence.
Geospatial operations were conducted using QGIS 3.x and Python. Electoral outcomes (turnout, party shares) and socio-graphic indicators (education, age, occupation, foreign residents) were visualized as choropleth maps. We computed Pearson correlation coefficients between electoral outcomes and demographic indicators at the toponymic zone level. These coefficients were interpreted alongside mapped spatial patterns to assess the structural determinants of electoral variance.
Our analysis adopts a longitudinal and spatial approach to electoral behavior, tracing the evolving political morphology of Rome from 1993 to 2024. By combining the cartographic mapping of electoral outcomes, the correlation of voting patterns with socio-graphic structures, and the spatial interpretation of political cleavages across the urban fabric, we aim to reconstruct how territorial divisions have structured political allegiance over time. In line with Johnston’s et al. (2001)8 theoretical framework, we treat space not as a passive container of political behavior, but as an active and relational variable that both reflects and shapes social and political processes. Electoral geographies in Rome are thus interpreted as the product of dynamic interactions between institutional change, urban morphology, and socio-political identities embedded in place. Several works have drawn attention to the socio-territorial distinctiveness of the eastern sectors (Cipollini and Truglia, 2015), the symbolic and material isolation of coastal zones like Ostia (Violante, 2013), and the evolving relationship between urban form and political allegiance (Tocci, 2015). Within this empirical tradition, analyses of electoral results over multiple cycles have also shown how distance from the city center continues to shape party support (Tomassi, 2018). Our choice to employ toponymic zones responds to the need for spatial units that reflect historically sedimented identities, socially recognized boundaries, and long-term patterns of residential and political continuity. This framework enables a diachronic and differentiated reading of electoral behavior in the capital across the Second Republic. Ultimately, our cartographic projections allow us to investigate the evolution of electoral geography and the impact of long-term socio-graphic structures on political behavior, while remaining attentive to the contingent nature of certain electoral cycles and the risk, as Lombardo (2009) warns, of mistaking cleavage for sedimentation, and vice versa.
4 Results
The electoral history of Rome Capitale during the Second Republic is characterized by alternating phases of stability and moments of significant rupture. One consistent pattern is turnout: Roman voters, in line with those in other major Italian cities, display lower participation rates compared to national averages, with peaks typically corresponding to first-order elections (Reif and Schmitt, 1980).
4.1 1993
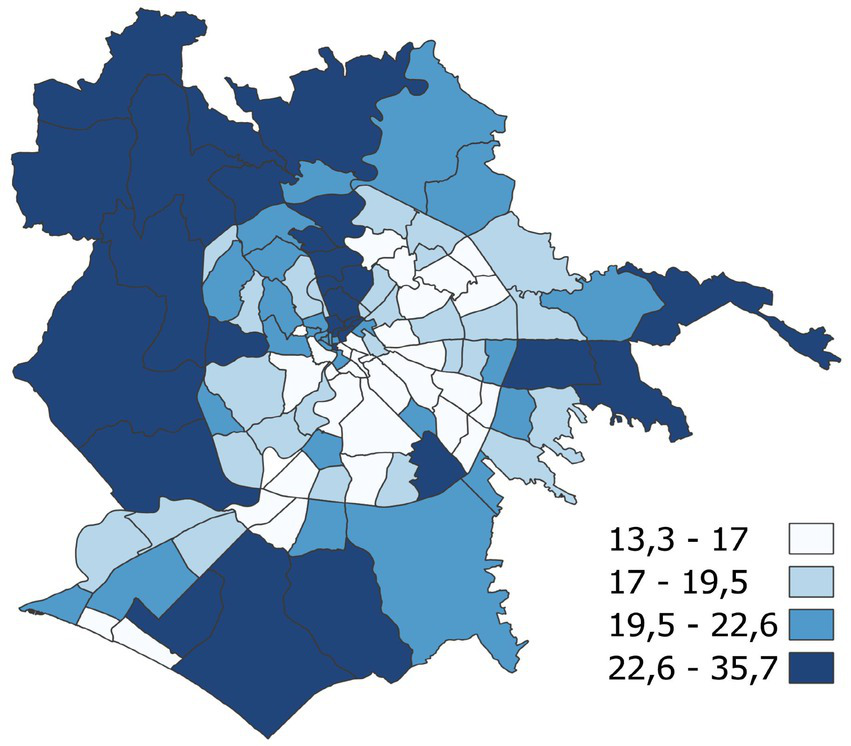
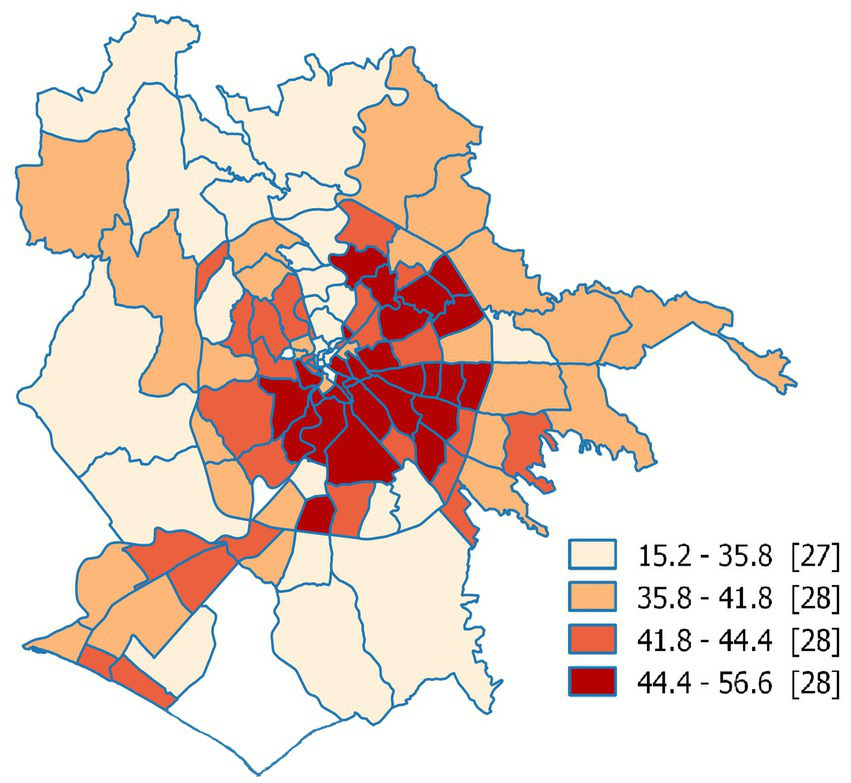
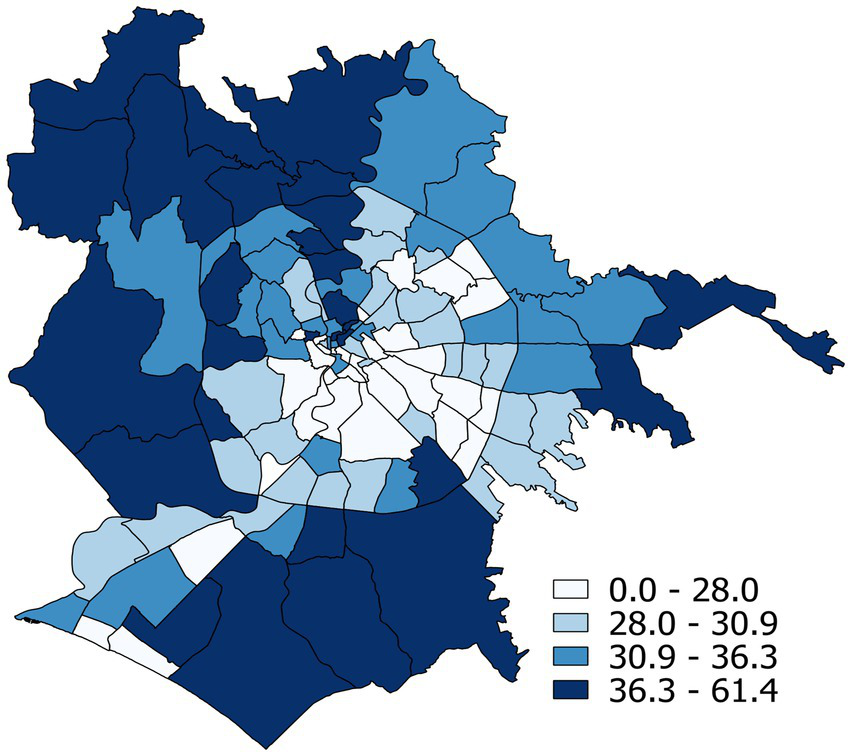
In June 1993, against the backdrop of the Tangentopoli investigations and the collapse of communist regimes across Eastern Europe, Italy held direct elections for the first time, for mayors and provincial presidents. This marked the beginning of a “new era” in Italian electoral politics. Electoral rules,9 political communication, party structures, and voting behavior were all subject to profound transformation. In Milan and Turin, the 1993 local elections crystallized the political coalitions that would come to dominate Italian politics over the following decades. Around mayoral candidates, three major camps formed: the left (including the PDS, Greens, Communist Refoundation, and La Rete10), the Lega Lombarda, and a centrist formation largely anchored by the Christian Democrats (DC). The right began to take shape only in the autumn cycle when the Italian Social Movement (MSI) nominated Gianfranco Fini as its mayoral candidate in Rome. Fini, a rapidly rising political figure, was openly endorsed by Silvio Berlusconi, marking the beginning of their alliance. Gianfranco Fini passed the first round of the Roman municipal election with 35.8% of the vote, supported by an MSI that secured 31.4%. Although he was defeated in the runoff by Francesco Rutelli, Fini’s performance—garnering over 800,000 votes (46.9%)—signaled the emergence of a competitive right-wing presence in Italian urban politics, one that would continue to shape the national political scene. The defeat of the Christian Democrat candidate Carmelo Caruso, who received just 12%, further anticipated the collapse of the DC and foreshadowed the structural realignments that would soon follow.
4.2 1994
In the general elections for the Chamber of Deputies held on 27 March 1994, voter turnout in the municipality of Rome reached 88.3%, although with substantial variation across constituencies11 (see Figure 2), ranging from 90.1% in Val Melaina (northern periphery) to 77.2% in the historic center. The elections confirmed a continued tendency toward bipolar competition: in the 1993 municipal elections, Rutelli and Fini had together secured 75.3% of valid votes in the first round, while in 1994 the two leading candidates in Rome’s single-member constituencies captured an average of 89.7%. The “Polo del Buon Governo,” assembled in a matter of weeks by Silvio Berlusconi (Mariotti, 2011), won 22 of Rome’s 24 single-member districts (Figure 3), averaging 47.6% of the vote per constituency and surpassing 50% in 10 of them. Its strongest support came from the city’s western periphery (Figure 4), with notable inroads from the northern districts into the central areas, with only a few exceptions.12 As will be explored further, this specific pattern of support in Rome’s northwestern quadrant becomes a crucial theme in this article. The left-wing coalition (“Progressisti”), with an average vote share of 40.8%, secured only two seats: in the Portuense and Prenestino-Labicano districts. The former, composed of over 90% Quartiere Portuense and a portion of Rione Testaccio, stretches from the center into the southwestern periphery. The latter, while not including any of the central Rioni, is situated just outside the historic core and includes the Quartieri Prenestino-Labicano and Tiburtino.
Figure 2
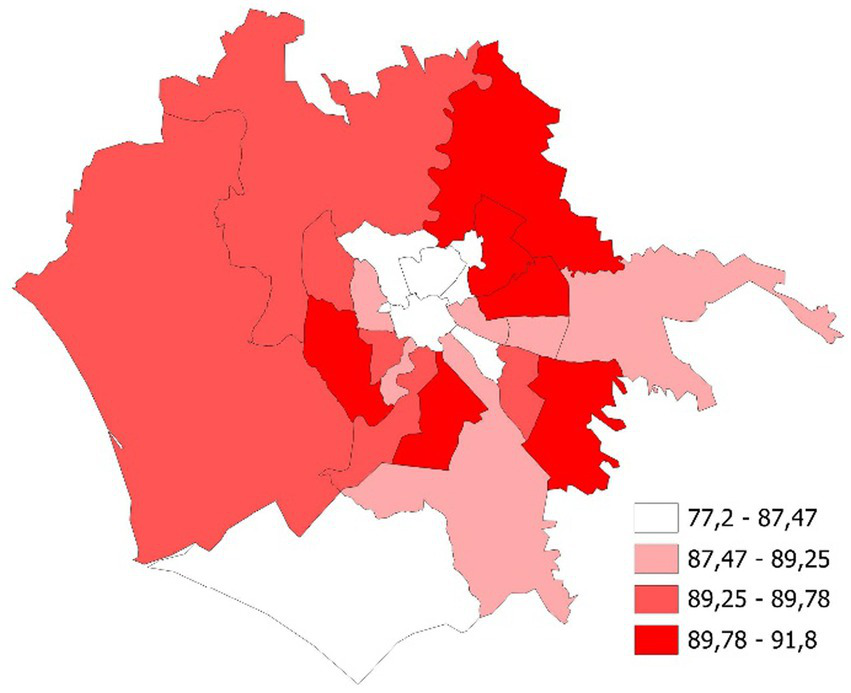
Voter turnout in the Italian Chamber of Deputies single-member districts (1994).
Figure 3
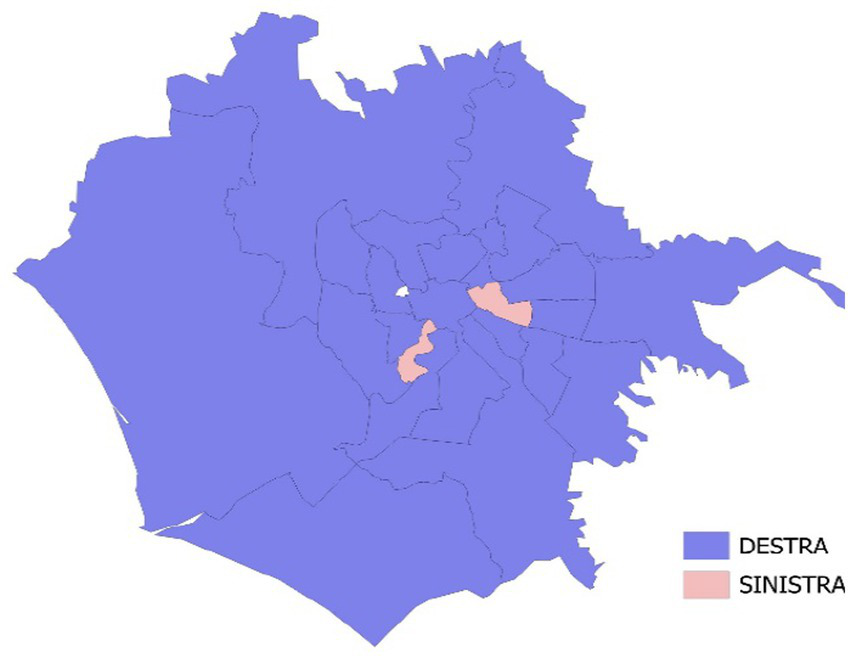
Winning coalitions in the Chamber of Deputies single-member districts, 1994.
Figure 4
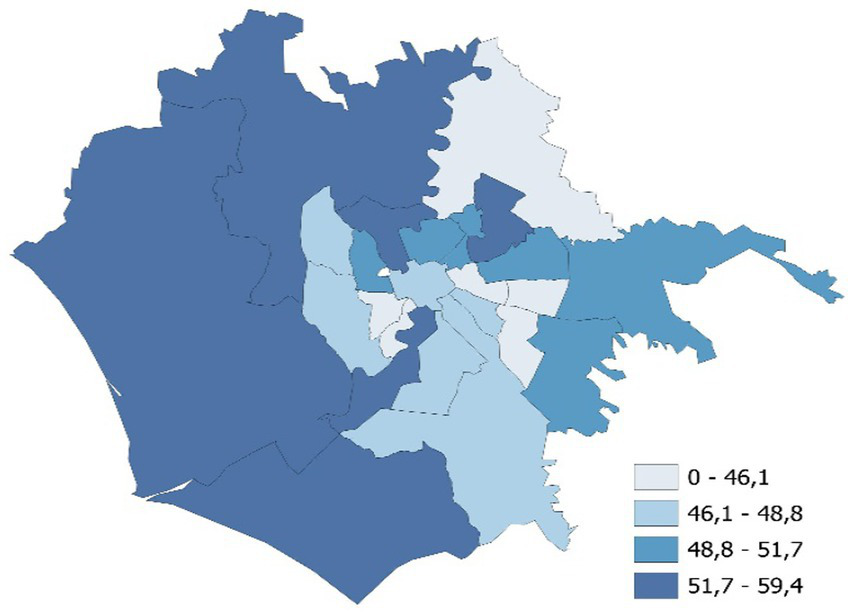
Percentage of votes for the Polo per il Buon Governo in the Chamber of Deputies single-member districts, 1994.
Although the Progressisti failed to win additional seats, they performed strongly in several central and peripheral constituencies spanning from the northeast to the southwest (Figure 5), surpassing 40% in many cases. Notable peaks were recorded in Collatino (49.7%, narrowly lost by just over 500 votes), Pietralata (46.0%), and Ostiense (45.0%).
Figure 5
Percentage of votes for the Progressives in the Chamber of Deputies single-member districts, 1994.
4.3 1997
In the 1997 municipal elections, the center-left candidate Francesco Rutelli, supported by a broad coalition including the Democratic Party of the Left (PDS), Communist Refoundation, the Greens, the Italian People’s Party, Italian Renewal, and the Pannella List, secured victory in the first round with 60.4% of the vote. Rutelli’s results (Figure 6) closely mirrored those of the coalition’s principal force, the PDS (Figure 7), with the highest shares recorded in the historic Rioni of Trastevere (69.0%) and Testaccio (72.3%), extending through the northeastern Quartieri of Tiburtino (68.0%), Pietralata (66.5%), and San Basilio (73.6%), and reaching peripheral Zones such as Lunghezza (64.7%), Tor Cervara (68.8%), and Capannelle (65.0). Rutelli also achieved notable success in traditionally right-leaning areas such as Marcigliana, Castel Porziano, and Ponte Galeria, demonstrating an ability to personalize electoral consensus beyond conventional partisan lines.
Figure 6
Percentage of votes for Rutelli in the municipal elections, first round, 1997.
Figure 7

Percentage of votes for the PDS in the municipal elections, 1997.
Conversely, center-right strength consolidated in the northwestern quadrant of the city. In the central Rioni of Colonna and Pigna, Pierluigi Borghini (Figure 8)—Rutelli’s main opponent, heading a coalition that included National Alliance (AN), Forza Italia–Christian Democratic Union (FI-CDU), the Christian Democratic Centre (CCD), and two additional lists—achieved 48.5 and 46.7% of the vote, respectively. His support extended into the adjacent Quartieri of Pinciano (48.2%) and Parioli (45.7%), reaching the peripheral Suburbio of Tor di Quinto (47.3%) and the outer Zones of La Storta (46.9%) and Castel di Guido (45.1%).
Figure 8
Percentage of votes for Borghini in the municipal elections, first round, 1997.
The vote distributions of National Alliance (Figure 9) and Forza Italia (Figure 10) display a complementary spatial configuration. While Forza Italia dominated much of the northwestern quadrant, National Alliance gathered substantial support in peripheral areas where Berlusconi’s party struggled to establish itself—particularly in the southern Zones of Casal Morena (+17.7 percentage points over Forza Italia), Castel di Decima (+20.3), and Giuliano Dalmata (+16.8), the three Quartieri of Lido di Ostia (+17.2 on average), and in the central Rione of Castro Pretorio (+23.2).
Figure 9
Percentage of votes for AN in the municipal elections, 1997.
Figure 10
Percentage of votes for FI in the municipal elections, 1997.
This territorial differentiation between the two right-wing forces13 would remain remarkably stable in the decades that followed.
4.4 2001
The 2001 elections14 for the Chamber of Deputies in Rome, in line with the national trend, exhibited a strongly bipolar structure. In the majority voting system, the center-left coalition (L’Ulivo) secured a slight advantage in the number of seats over the center-right (Casa delle Libertà). However, in the proportional vote, the combined share of the Democrats of the Left (DS) and The Daisy (DL) (Figure 11) was 38.3%, lower than the combined total for Forza Italia and National Alliance (Figure 12), which reached 44.3%. Reaggregating the results by electoral precinct into the two macro-areas15—the northwestern quadrant (Area A, Figure 13) and the remainder of the city (Area B, Figure 13)—reveals that DS and DL together obtained 35.9% in Area A and 40.2% in Area B, while Forza Italia and AN secured 47.1% in Area A and 42.0% in Area B. The difference between the two coalitions is attenuated by the relatively low territorial variability of the DL and AN votes, in contrast to the higher variance observed for DS and Forza Italia. Specifically, DS support ranged from a minimum of 8.1% in the Zona of Torricola to a maximum of 35.3% in the Rione of Testaccio, while Forza Italia’s share varied between 14.9% in Sant’Angelo and 37.3% in Santa Maria di Galeria.
Figure 11
Percentage of votes for DS and DL in the Italian Chamber of Deputies elections (2001).
Figure 12
Percentage of votes for AN and FI in the Italian Chamber of Deputies elections (2001).
Figure 13
Simplified map of the electoral geography of the municipality of Rome up to 2013.
The municipal elections held simultaneously with the parliamentary elections confirmed these patterns: Valter Veltroni defeated Antonio Tajani in the second round with 52.2 to 47.8%. Veltroni’s first-round vote distribution (Figure 14) closely mirrors that of the DS + DL lists for the Chamber (Figure 11), confirming the strong interdependence between voting behavior across arenas. Left-wing support remained concentrated in the historic center’s Rioni, particularly Sant’Angelo, Testaccio, and Trastevere, where Veltroni exceeded 60%, while Rutelli had achieved over 70% 4 years earlier.
Figure 14
Percentage of votes for Veltroni in the municipal elections, first round, 2001.
A closer examination of the Rioni reveals significant internal differentiation, challenging the reductive idea of a uniformly “leftist ZTL” (Limited Traffic Zone). Indeed, Rioni such as Pigna, Ludovisi, Trevi, and Colonna remained bastions of center-right support, posing substantial obstacles to both Rutelli and Veltroni.
The first notable difference between the two performances (Rutelli in 1997 and Veltroni in 2001) concerns Rutelli’s strong results in the peripheries: in 1997, six Agro Romano Zones (i.e., areas located at the extreme outskirts of the municipality) ranked among the top 20 toponymic zones for his support—Tor Cervara, Capannelle, Lunghezza, Acilia Nord, Marcigliana, and Fonte Ostiense—all situated within the three quadrants of Area B. Nevertheless, the center-right maintained predominance in the outer areas, with Borghini’s best results concentrated in four Zones among the top eight, ranging from 52.4% in Torricola to 46.9% in Castel Fusano. By 2001, however, among Veltroni’s top 20 Zones, only four were located in the Agro Romano (Tor Cervara, Capannelle, Fonte Ostiense, and Torre Maura), while in Tajani’s case (Figure 15), 11 of his top 17 results were registered in peripheral Zones.
Figure 15
Percentage of votes for Tajani in the municipal elections, first round, 2001.
Thus, after 8 years of the Second Republic, a centrifugal dynamic favoring the center-right and a centripetal consolidation of the center-left vote around the urban core had clearly begun to take shape.
4.5 2008
Seven years later, in 2008, national and municipal elections in Rome once again coincided.16 The national political climate strongly favored the center-right: the two fragile years of the Prodi government—formed after the center-left’s extremely narrow victory in the 2006 elections—constituted a context that made defeat almost inevitable. Nevertheless, the newly founded Democratic Party (PD), just a few months old, attempted to play its strongest cards: a shift toward a “majoritarian”17 approach and the candidacy of Rome’s mayor Veltroni (PD’s leader) against Berlusconi. Beyond the near-perfect overlap between the map of the vote for the center-right People of Freedom (PdL) (Figure 16) and the vote for Gianni Alemanno (Figure 17), and between the vote for the PD (Figure 18) and the vote for Francesco Rutelli (Figure 19)—showing a very strong correlation between national and municipal electoral behavior—the 2008 elections reveal continuities with the dynamics established in the early years of the Second Republic. The strengthening of the right in peripheral areas and the consolidation of the left within the Grande Raccordo Anulare (G.R.A.) continued. Compared to Veltroni’s 2001 performance, Rutelli managed to increase his support in only 12 toponymic zones (out of 112), of which four were Rioni (among the top six in terms of growth), six were Quartieri, and only two were Zones. Among the 25 zones where Rutelli lost the most ground, 20 were Zones, none were Quartieri, four were Rioni, and one was a Suburbio. Alemanno, compared to Tajani, gained percentage points in only six zones (three Rioni and three Zones), while he suffered losses in all the Quartieri.
Figure 16
Percentage of votes for the PDL in the Italian Chamber of Deputies elections (2008).
Figure 17
Percentage of votes for Alemanno in the Rome municipal elections, first round, 2008.
Figure 18
Percentage of votes for the PD in the Italian Chamber of Deputies elections (2008).
Figure 19
Percentage of votes for Rutelli in the Rome municipal elections, first round, 2008.
This suggests that the “centralization” of left-wing voting patterns during this phase was not uniformly distributed across all Rioni but was instead concentrated in the first-ring Quartieri, whereas the right maintained strongholds in several Rioni, particularly in the apex of the northwestern quadrant of the city.
4.6 2013
In 2013, elections were again held concurrently: national elections on February 24 and municipal elections on May 26.
It was the year of the Five Star Movement (M5S) breakthrough: at the national level, M5S secured 26.5% of the vote for the Chamber of Deputies (becoming the largest single party) and 108 seats; in Rome’s municipality, the M5S performed even better, reaching 27.3%, becoming the second-largest party after the PD and surpassing the entire center-right coalition. The geography of the Five Star Movement’s vote (Figure 20) leaves little room for doubt: it was heavily concentrated in the ultra-peripheral areas of the city, exceeding 30% of the vote in 44 toponymic zones, including six Quartieri, two Suburbi, and no fewer than 36 Agro Romano Zones (surpassing 40% in Magliana Vecchia and Acqua Vergine).
Figure 20
Percentage of votes for the M5S in the Italian Chamber of Deputies elections (2013).
The Democratic Party (PD) (Figure 21) obtained 28.7% of the vote for the Chamber of Deputies across the municipality, with further accentuation of the divide between areas inside and outside the G.R.A.: no fewer than 39 Zones appear among the bottom 53 positions in terms of PD support, with only the stronghold of the Tor Cervara Zone resisting, at 35.5%. The PdL (which received 18.7% across the municipality) also confirmed a strong internal variance and the traditional concentration of its support in the northwestern quadrant (Figure 22), despite a significant loss of voters to the M5S.
Figure 21
Percentage of votes for the PD in the Italian Chamber of Deputies elections (2013).
Figure 22
Percentage of votes for the PDL in the Italian Chamber of Deputies elections (2013).
Three months later, the municipal elections reinforced the morphology of the national elections. The maps of the vote for Marino (Figure 23) and for Alemanno (27.7 and 33.3%, Figure 24) largely overlapped with those of the principal political forces to which they were linked.
Figure 23
Percentage of votes for Marino in the Rome municipal elections, first round, 2013.
Figure 24
Percentage of votes for Alemanno in the Rome municipal elections, first round, 2013.
The geographic distribution of the vote for the M5S candidate De Vito (Figure 25) already foreshadowed the electoral pattern that would characterize the party in the coming years: a vote clearly concentrated in the city’s outermost rings.
Figure 25
Percentage of votes for De Vito in the Rome municipal elections, first round, 2013.
4.7 2014
The 2014 European elections marked another turning point. The geography of the vote changed significantly with the debut of Matteo Renzi’s Democratic Party leader (PD) in the electoral arena, achieving a record-high 43.1% of the vote. The territorial distribution of support was profoundly reshaped.
The “Renzi effect” was felt across the entire city: compared to the 2013 national elections, more than 400,000 fewer voters turned out, yet the PD increased its absolute vote total by approximately 50,000 and its share by 14.4 percentage points. However, this growth was far from uniform across the city (Figure 26).
Figure 26
Percentage of votes for the PD in the European Parliament elections (2014).
In the historic center, the increase was remarkable: among the 25 toponymic zones where PD support grew the most, 15 were Rioni, including areas traditionally hostile to the left, such as Campo Marzio (+25.6 percentage points), Ludovisi (+24.4), Trevi (+20.9), Pigna (+20.9), and Colonna (+20.6). In the first peripheral ring around the center, historic strongholds of the right also fell: significant gains for the PD were recorded in Pinciano (+25.3), Tor di Quinto (+21.7), Parioli (+20.4), and Europa (+23.9). In contrast, growth was much weaker in the extreme periphery: among the 50 toponymic zones with the smallest increases, 30 were Agro Romano Zones, along with several Quartieri traditionally associated with the left, such as Ponte Mammolo, Prenestino-Labicano, Prenestino-Centocelle, Don Bosco, Pietralata, Tiburtino, and Ostiense (see Figure 27).
Figure 27
Percentage of votes for the M5S in the European Parliament elections (2014).
The Five Star Movement (M5S) experienced a sharp decline compared to its 2013 performance for the Chamber of Deputies (losing approximately 140,000 votes and 2.3 percentage points) when it had been the leading party in 52 toponymic zones versus 50 for the PD. In 2014, the M5S managed to remain the leading force in only eight Zones, all located in the extreme periphery of the Agro Romano (Figure 26). Outside of these areas, the PD consistently ranked as the leading party, dominating all the Quartieri within the G.R.A.
Particularly interesting is the analysis of the center-right vote. Forza Italia (Figure 28) remained strong in its traditional areas of support, with a distribution very similar to that of 1997 and to the patterns associated with the mayors it supported in various elections. Similarly, the vote for FdI-AN (Figure 29) preserved the spatial configuration it had exhibited since the 1990s, suggesting that the dramatic loss of hundreds of thousands of votes over two decades occurred largely independently of territorial redistribution. Unlike the transformations occurring on the center-left, the territorial segmentation of the center-right electorate remained almost unchanged.
Figure 28
Percentage of votes for Forza Italia in the European Parliament elections (2014).
Figure 29
Percentage of votes for FDI-AN in the European Parliament elections (2014).
Low turnout in the Rioni of the historic center and the Agro Zones compared to the Quartieri has long been a characteristic of Roman voting behavior—a pattern always confirmed until the 2014 European elections.
4.8 2016
The 2016 municipal elections will undoubtedly be remembered as a historic milestone for the Five Star Movement (M5S)—a political force born only a few years earlier—which succeeded in winning both Rome and Turin. They also marked a culmination of the ongoing transformation in the structure of electoral behavior in the capital.
Virginia Raggi’s candidacy (M5S) emerged from the “Comunarie,” the online selection process conducted by the M5S on February 23, involving over 200 candidates but with very low participation (only 3,862 voters, only M5S members).
The 2016 results in Rome clearly reflected the deepening crisis of bipolarism and the resurgence of anti-politics sentiment. Yet, the collapse in support for both center-left and center-right candidates was also attributable to popular disillusionment with past administrations.
Voter turnout (Figure 30) was higher in the Zones (57.7%) than in the Quartieri (57.2%), and this centrifugal dynamic played a major role in determining the outcome. The 11 zones with the highest turnout were all located in the city’s extreme periphery, each exceeding 62% participation, whereas among the 10 zones with the lowest turnout, eight were Rioni in the historic center, all registering below 48%.
Figure 30
Voter turnout in the first round of the Rome municipal elections (2016).
In the first round, Virginia Raggi surpassed 40% of the vote in 27 Zones of the Agro Romano (Figure 31) and in only four Quartieri—three in the Lido di Ostia area and one, San Basilio, within the G.R.A. Her vote share ranged from a high of 47.5% in Acilia Nord to a low of 17.1% in Pinciano, a gap of over 30 percentage points. She defeated Giachetti in all Zones of the Agro and about half of the Quartieri, but only in one of the 22 historic Rioni (Celio, by a narrow 3.9-point margin).
Figure 31
Percentage of votes for Raggi in the Rome municipal elections, first round, 2016.
Giachetti’s first-round performance (Figure 32) confirmed the morphological shift in the center-left’s electoral base already suggested by the 2014 European elections and the 2013 municipal results: despite securing almost 200,000 fewer votes and 18 percentage points less than Marino, Giachetti improved in historically center-right territories, such as the Rioni Ludovisi (+2.5 percentage points compared to Marino), Colonna (+3.9), Pigna (+4.3), and the Quartieri Pinciano (+2.6) and Tor di Quinto (+0.6), all within the northwestern quadrant inside the G.R.A.
Figure 32
Percentage of votes for Giachetti in the Rome municipal elections, first round, 2016.
The new territories of center-left support increasingly overlapped with traditional center-right areas—but only in the historic center and the inner periphery—creating a circular cleavage that left the more peripheral Quartieri and Agro Romano Zones firmly outside the center-left’s reach.
One of the most interesting aspects of this election was the impact of the center-right’s divided candidacies. This division not only prevented Giorgia Meloni from reaching the runoff but also revived the traditional spatial segmentation between Forza Italia and Alleanza Nazionale, albeit with far smaller numbers.
Forza Italia, allied with the civic list “Marchini Sindaco,” continued to draw its strongest support from the northwest quadrant, from the city center to the far periphery. Giorgia Meloni achieved a very strong result (20.6%), finishing just 4.3 points behind Giachetti. Her electoral geography (Figure 33) closely mirrored the historical pattern of Alleanza Nazionale’s support from the 1990s onward, with greater emphasis on peripheral neighborhoods beyond the G.R.A. and in northern peripheral Quartieri.
Figure 33
Percentage of votes for Meloni in the Rome municipal elections, first round, 2016.
With highly variable results across territories, Meloni reached a peak of 35.0% in the Coastal Zone of Castel Porziano—a historic stronghold of the right, though sparsely populated—and approached 30% in numerous Agro Romano Zones. Her support closely overlapped with Alemanno’s 2013 electoral map, except in the northwest quadrant near the historic center, where voters had long been closer to Forza Italia.
In the runoff, Virginia Raggi’s principal source of support remained the extreme peripheries, completing a near-perfect ring of support around the G.R.A., with second-round percentages rarely falling below 70%, and exceeding 80% in 10 Agro Romano Zones—an exceptionally rare outcome in the city’s electoral history.
The average second-round vote for Raggi was 63.9% inside the G.R.A. and 76.8% outside it, compared to a citywide average of 67.2%.
Despite the modest overall turnout increase in the runoff, Giachetti managed to prevail in eight Rioni of the historic center and in three traditionally center-right Quartieri: Parioli, Pinciano, and Della Vittoria.
It is therefore evident that a not insignificant segment of the traditional right-wing electorate shifted to the center-left candidate in the second round—although the sharp decline in turnout between the two rounds was particularly pronounced in the northwest quadrant, which was left “orphaned” without a center-right candidate.
4.9 2024
We conclude the cartographic analysis with the recent 2024 European elections. The consolidation of the geographic reconfiguration process is fully confirmed.
Forza Italia vote (Figure 34) remains predominantly concentrated in the northwestern quadrant of the city, with a strong penetration extending across the Quartieri of Tor di Quinto, Parioli, Pinciano, and Salario, reaching into the Rioni of Campo Marzio, Colonna, Trevi, Pigna, and Sant’Angelo. The resulting electoral map is almost identical to that of Forza Italia in 1997.
Figure 34
Percentage of votes for Forza Italia in the European Parliament elections (2024).
By contrast, the comparison between the 1997 map of Alleanza Nazionale and the 2024 map of Fratelli d’Italia (Figure 35) shows a markedly different trajectory: electoral support has expanded widely toward the city’s outer peripheries. Within the G.R.A., the number of zones falling into the first quartile of support has become minimal, countable on one hand.
Figure 35
Percentage of votes for FDI in the European Parliament elections (2024).
The PD map (Figure 36) similarly reveals the center-left’s persistent weakness in the northwestern quadrant, including the Rioni of the historic center, while electoral support has expanded well beyond the “ZTL” (limited traffic zone), consolidating historic strongholds in the Quartieri of the southwest and northeast, as well as the Tor Cervara area.
Figure 36
Percentage of votes for the PD in the European Parliament elections (2024).
The “history” of the Five Star Movement (M5S), little more than a decade old, displays remarkable spatial consistency: strong electoral settlements in the eastern and western peripheries, almost entirely concentrated in the city’s outermost rings. Even in 2024 (Figure 37), among the Quartieri of the northwestern quadrant, only six are present, all located in peripheral areas, two of which are Lido di Ostia Levante and Lido di Ostia Ponente.
Figure 37
Percentage of votes for the M5S in the European Parliament elections (2024).
5 Discussion
5.1 Social variables
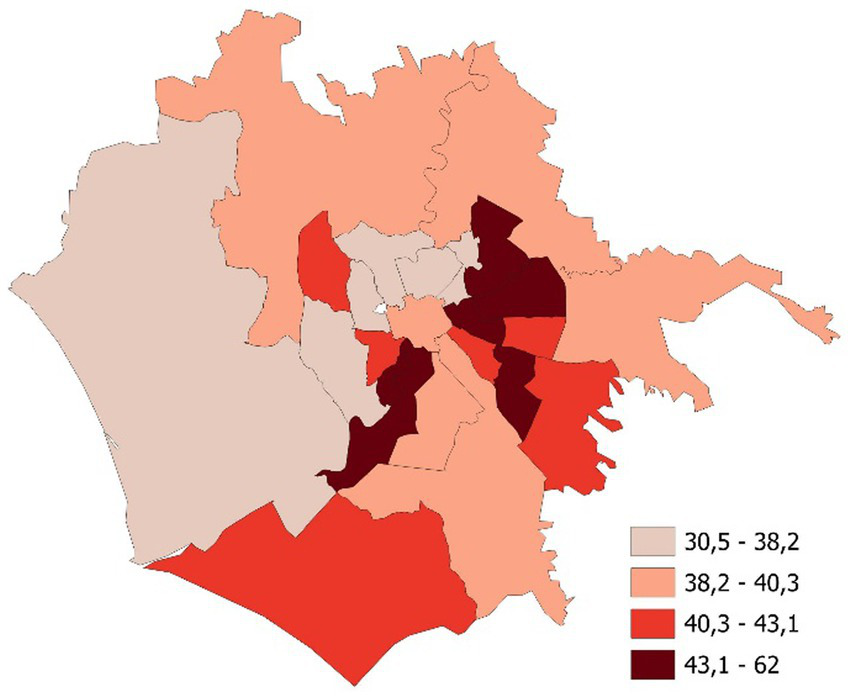
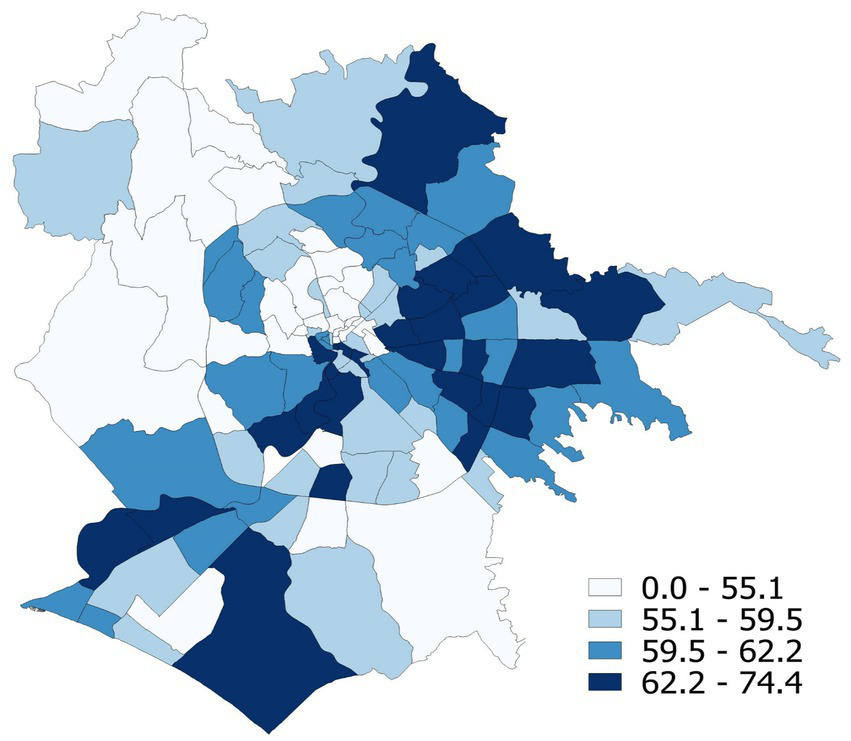
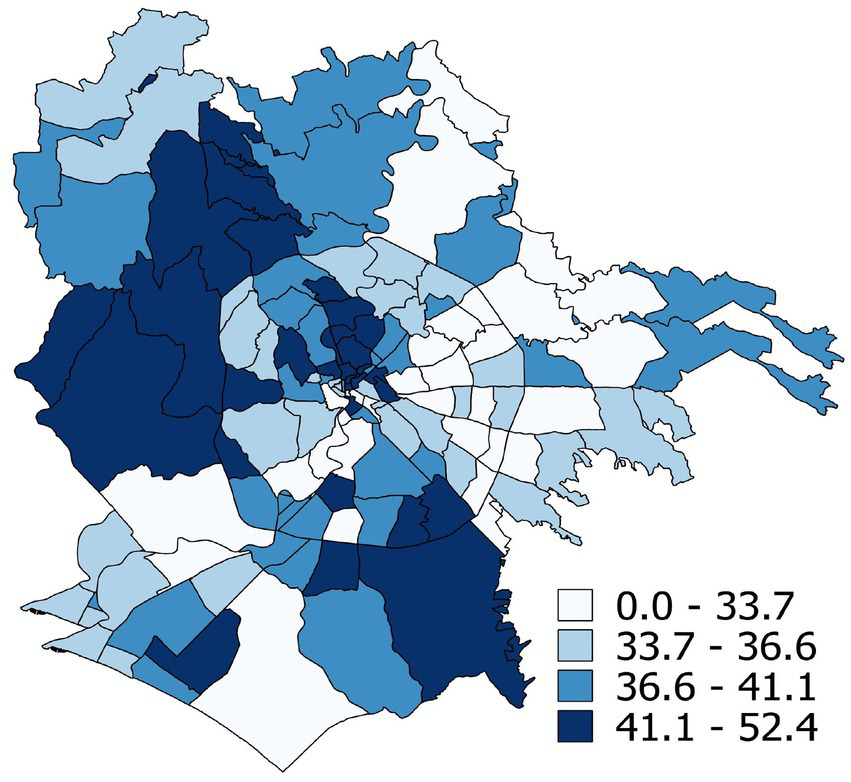
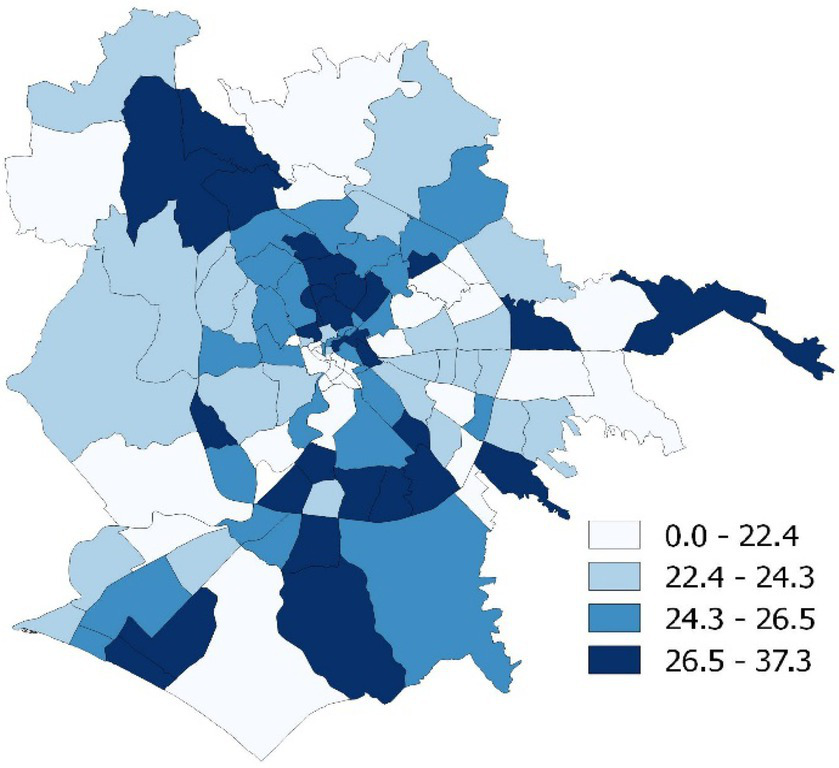
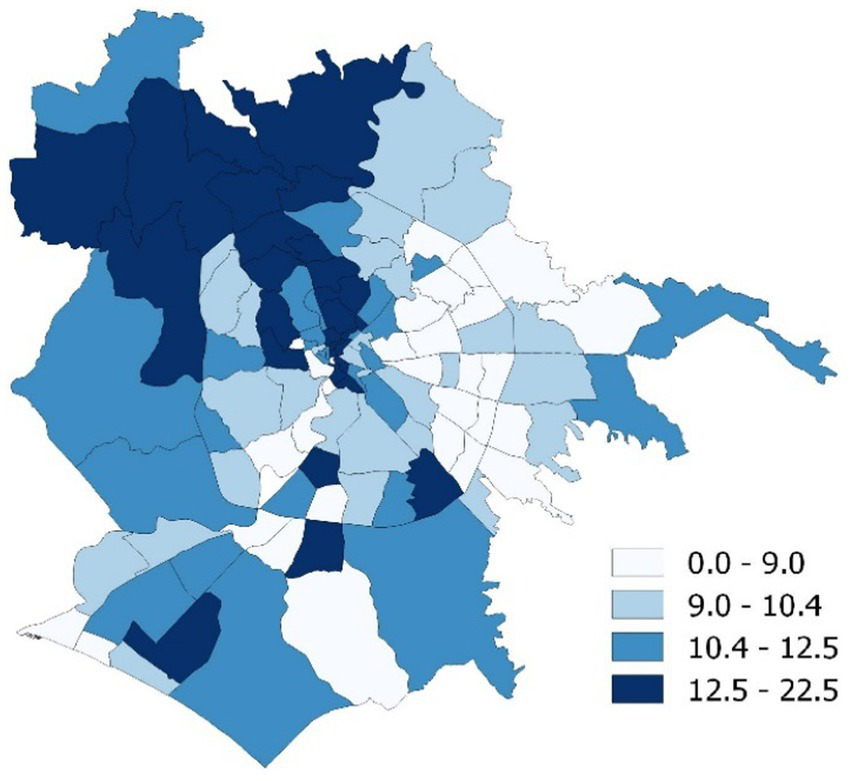
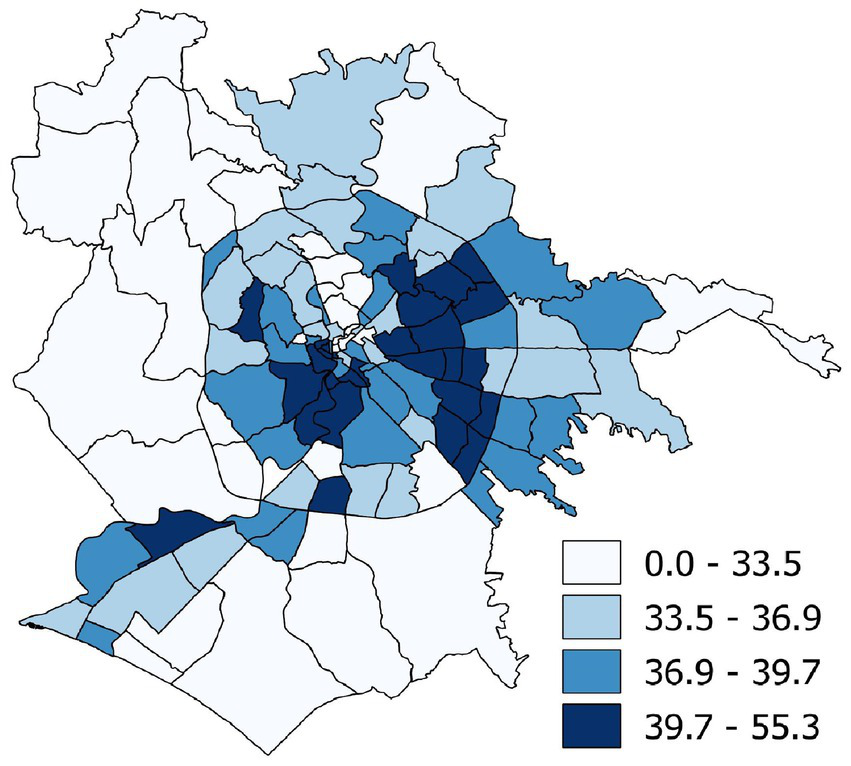
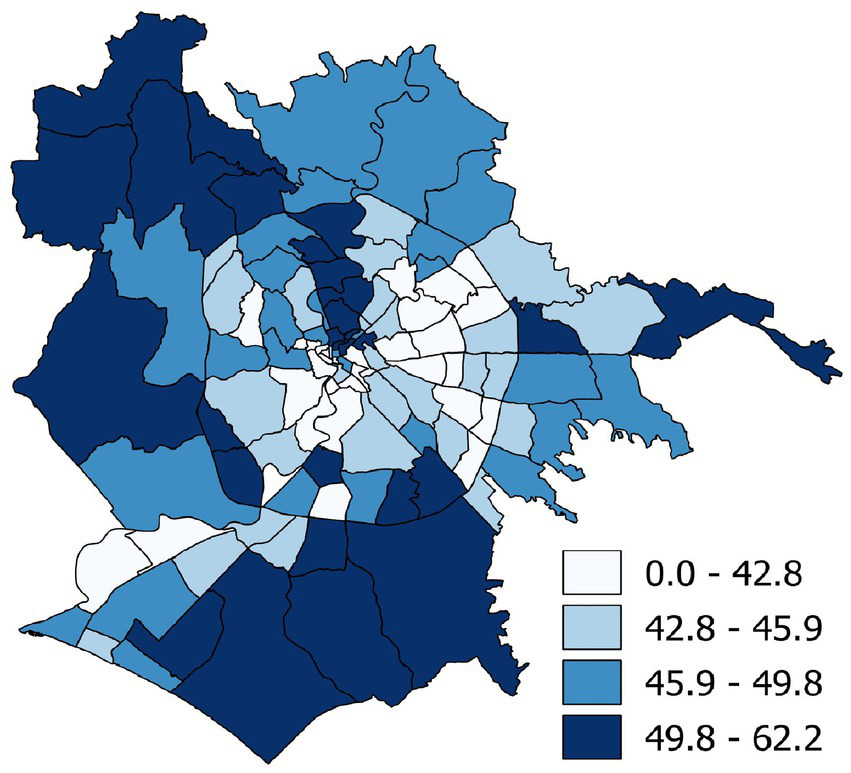
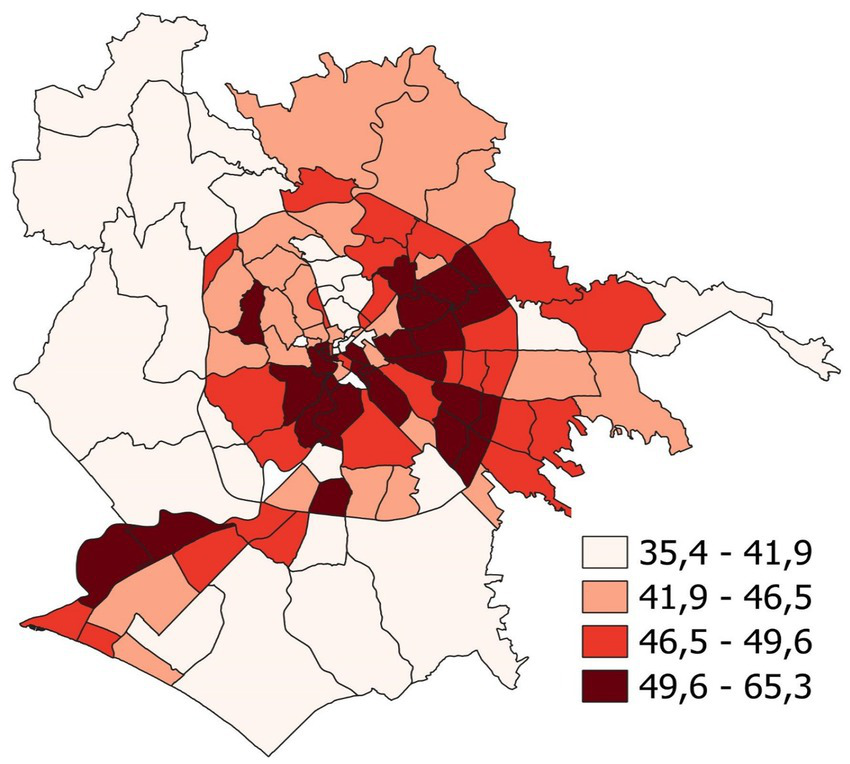
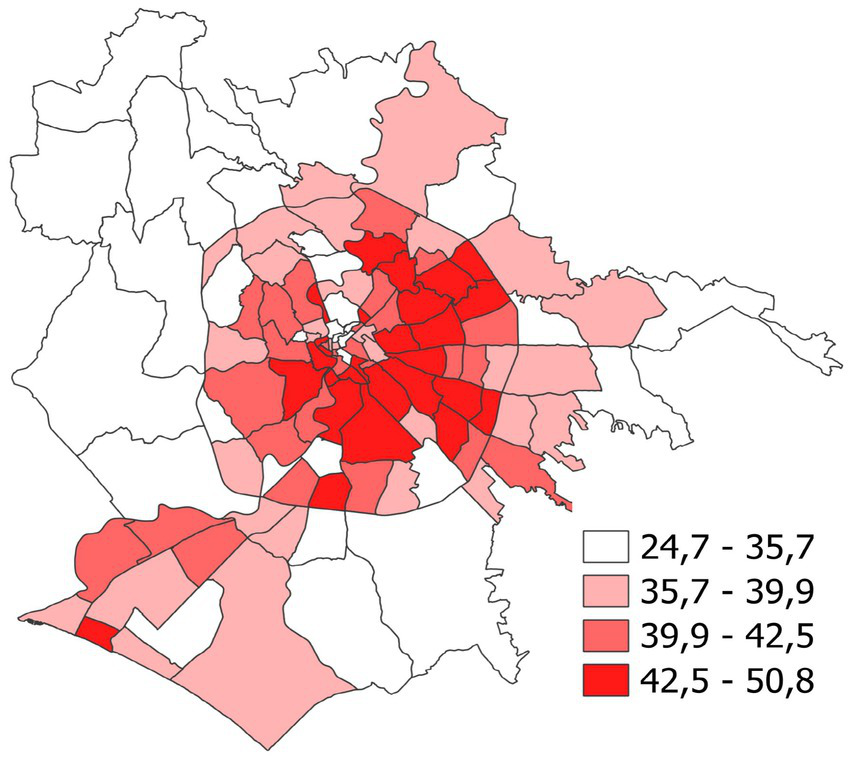
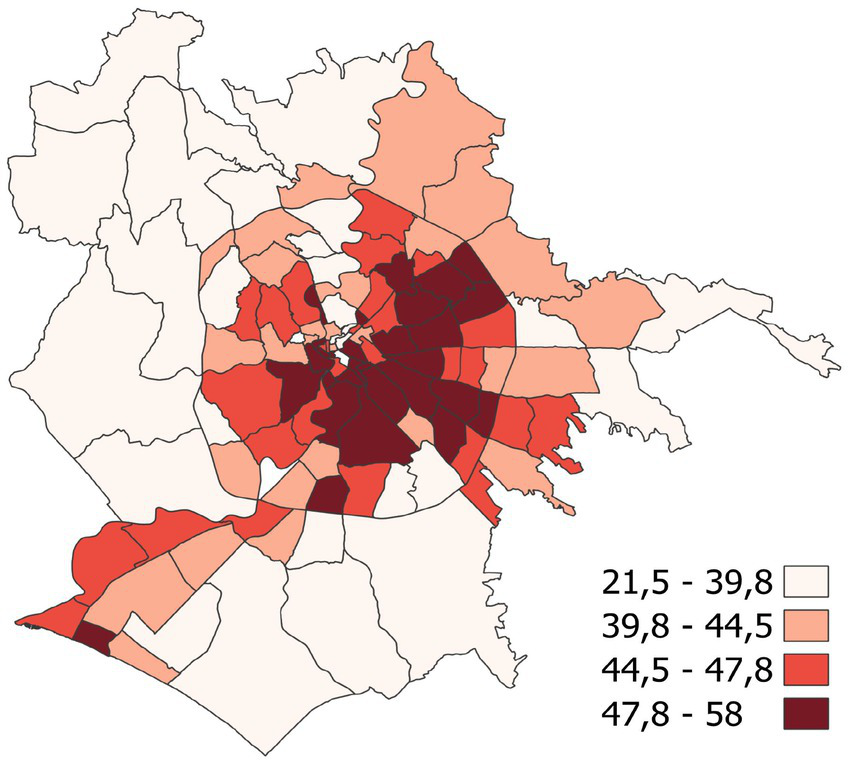
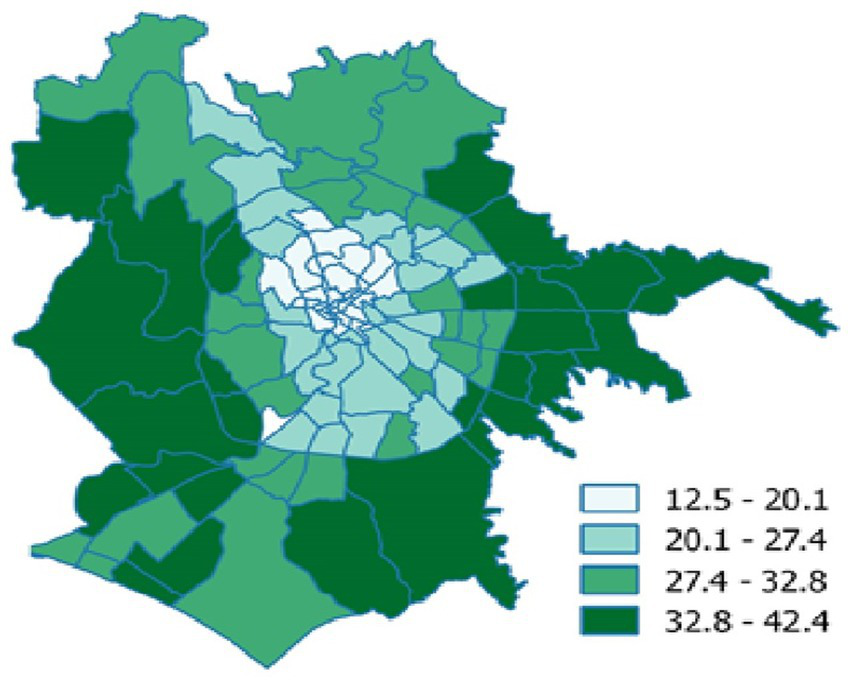
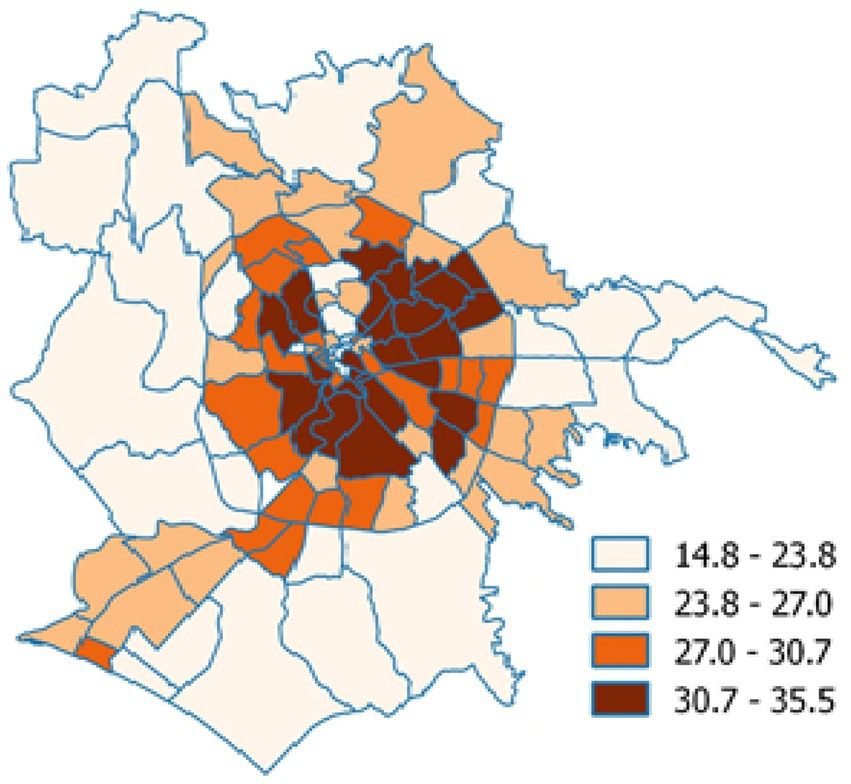
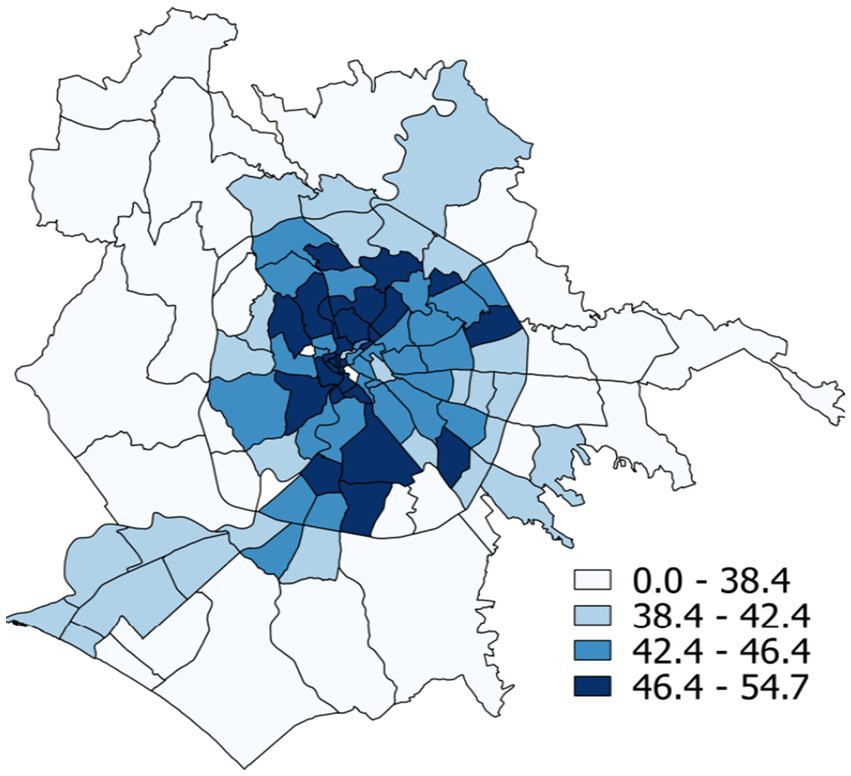
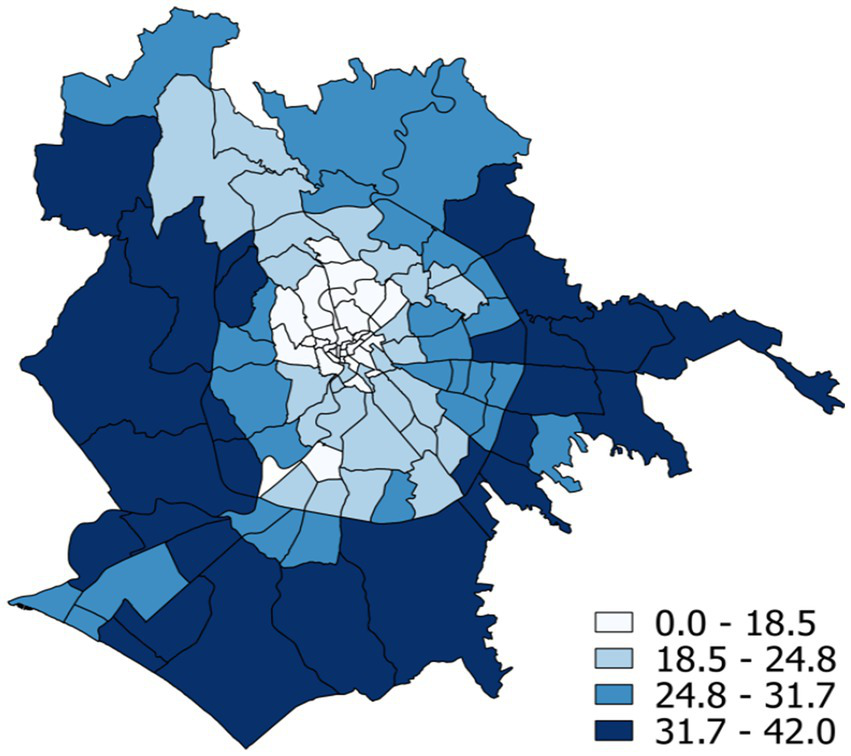
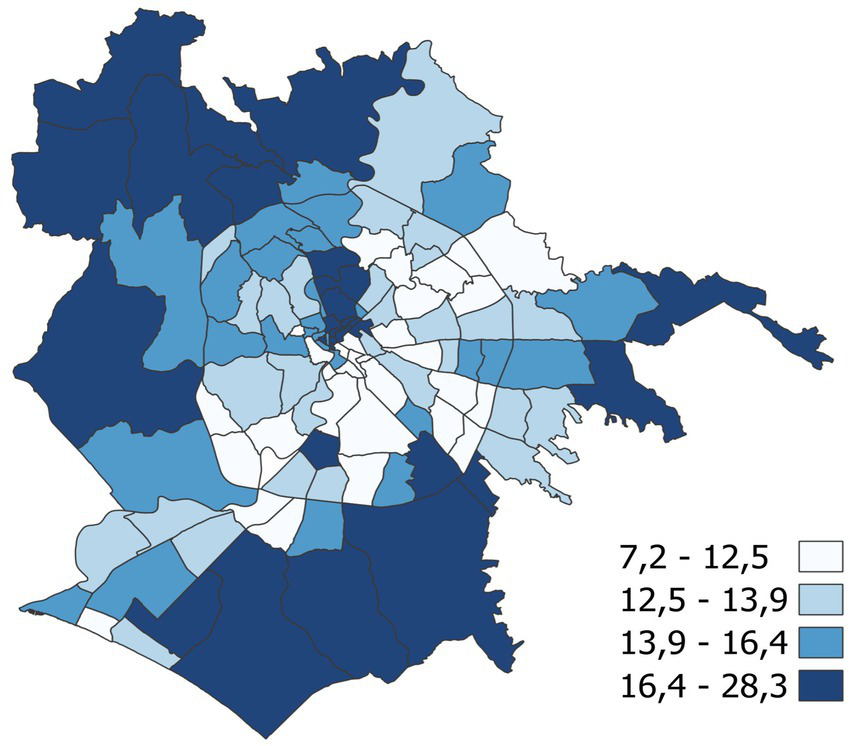
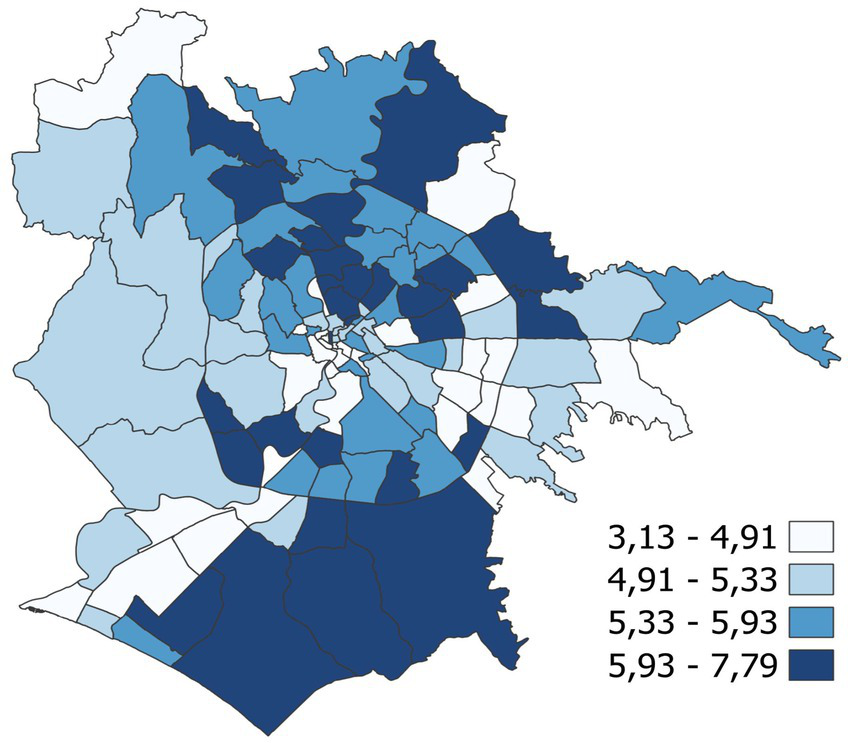
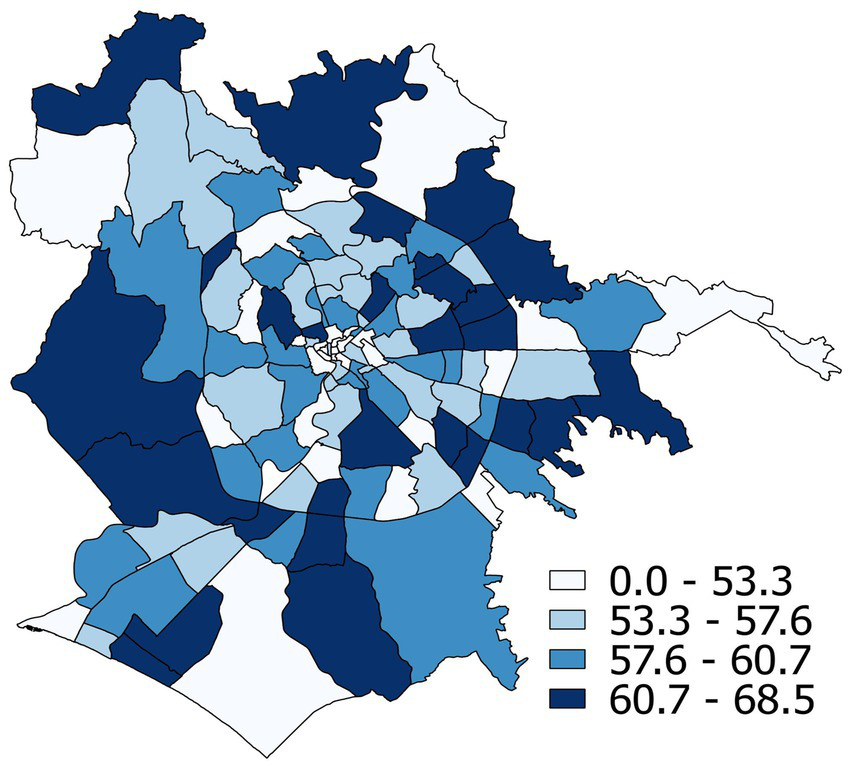
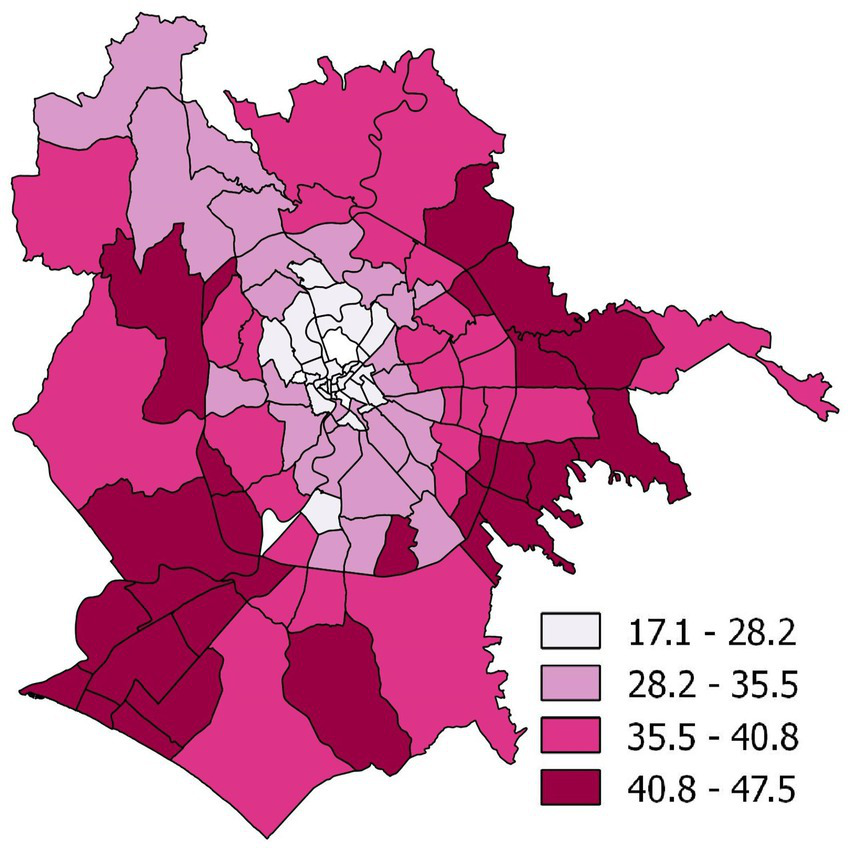
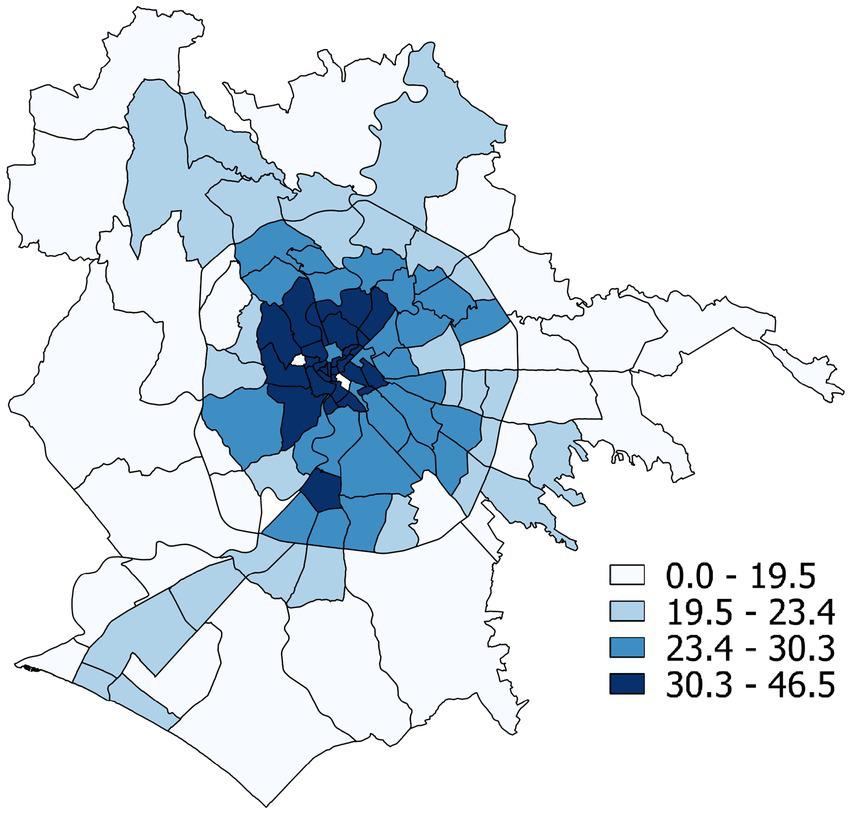
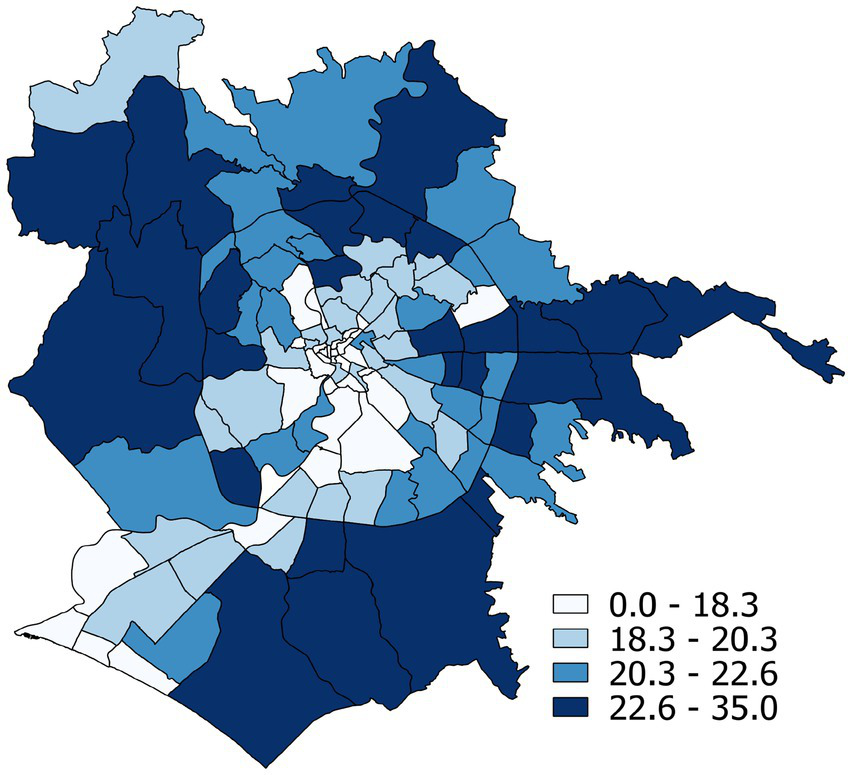
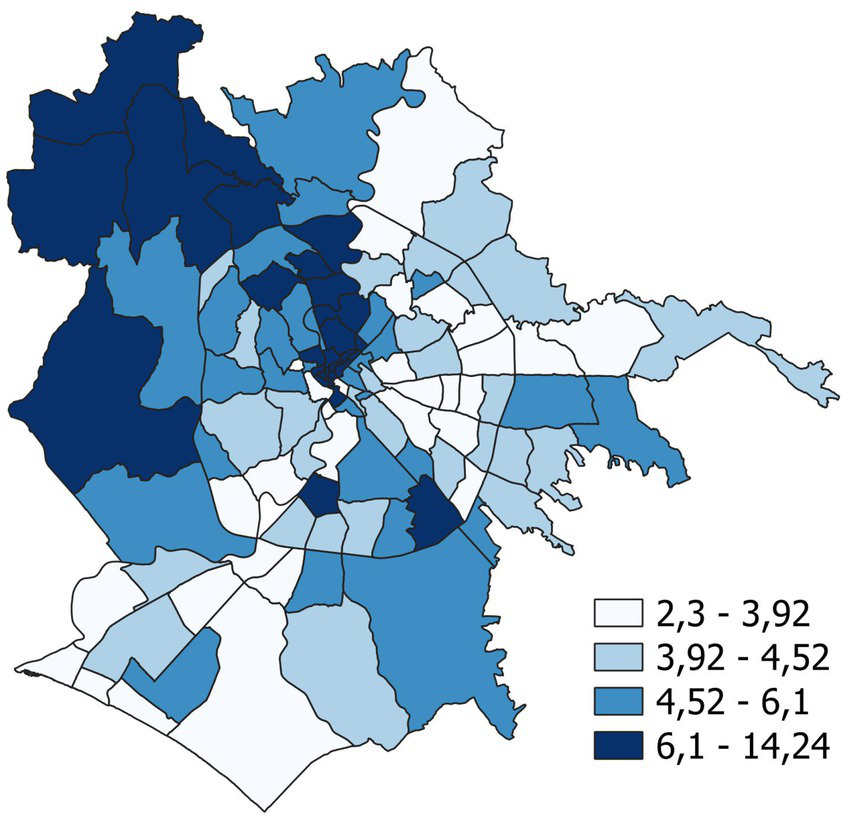
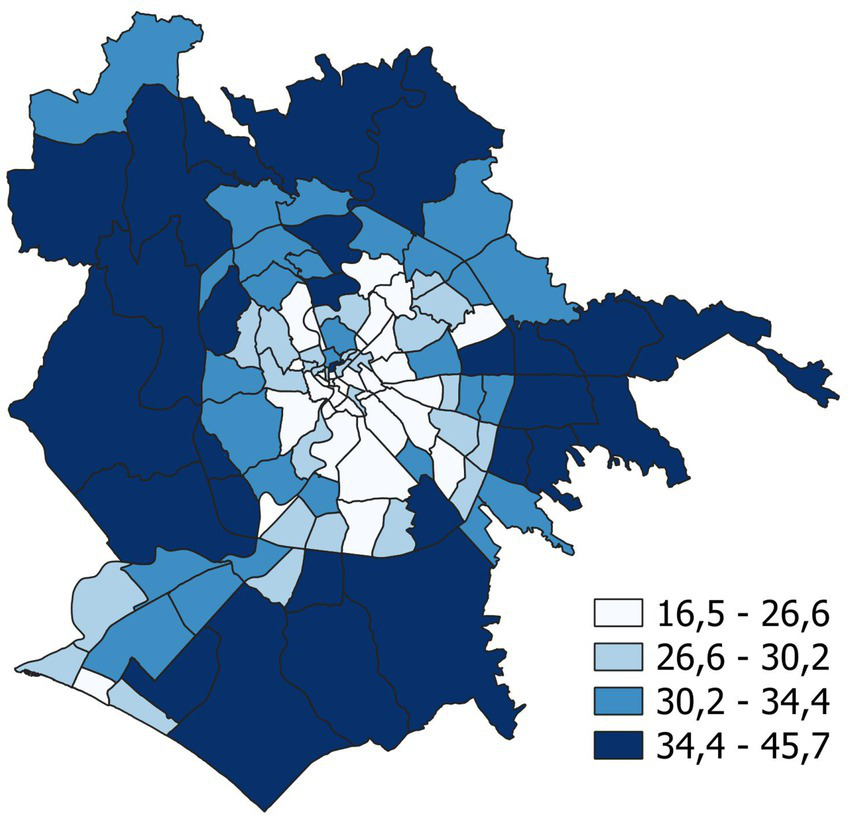
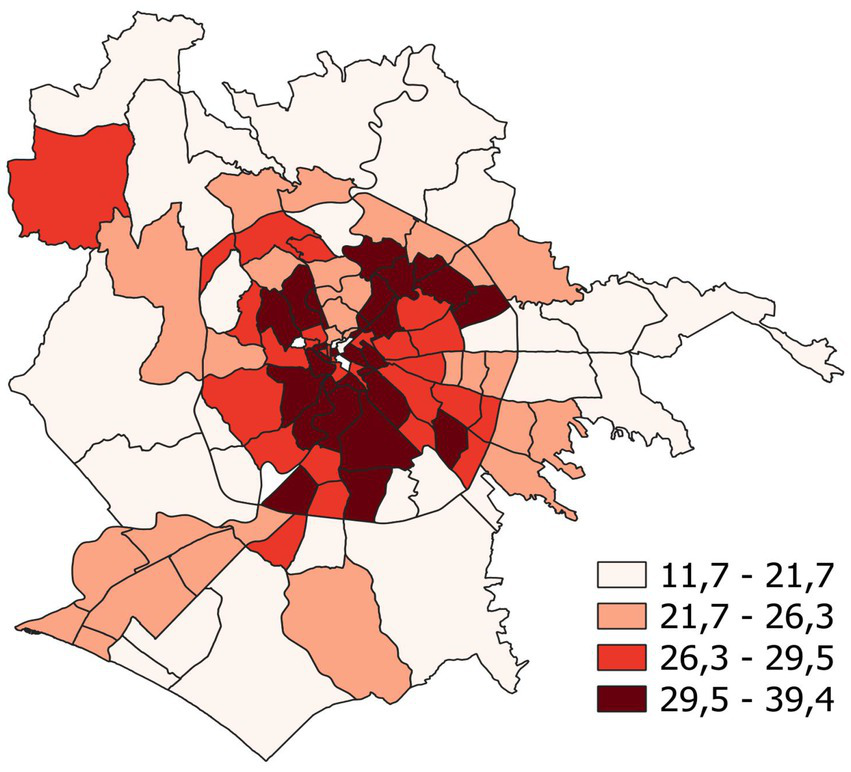
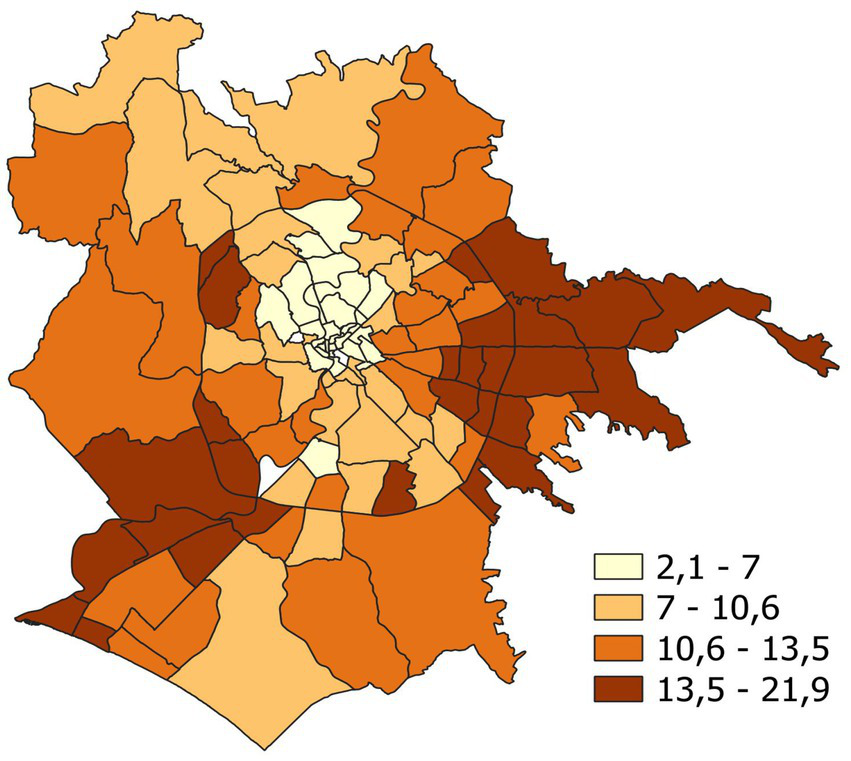
In order to complement the spatial analysis of electoral outcomes, we examine how selected socio-graphic indicators—age structure, education, employment, and the presence of foreign residents—correlate with voting patterns across Rome’s toponymic zone. Through a final series of maps (Figures 38– 41), we can observe the distribution of certain socio-graphic variables across the different toponymic zone, reaggregated from the 2011 ISTAT18 census data, originally available at the census section level.
Figure 38
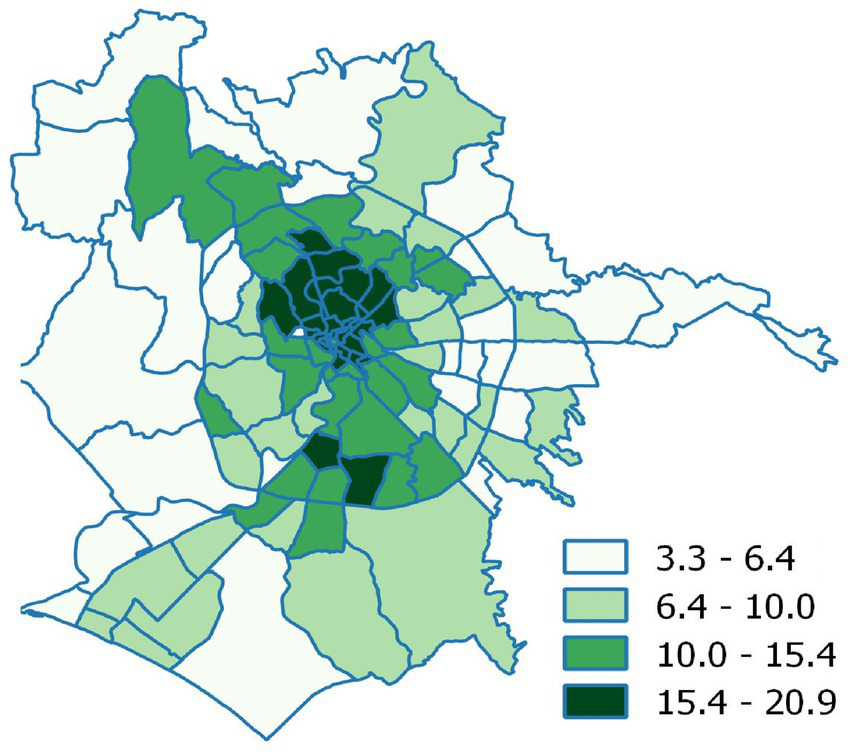
Percentage of university graduates according to ISTAT data (2011).
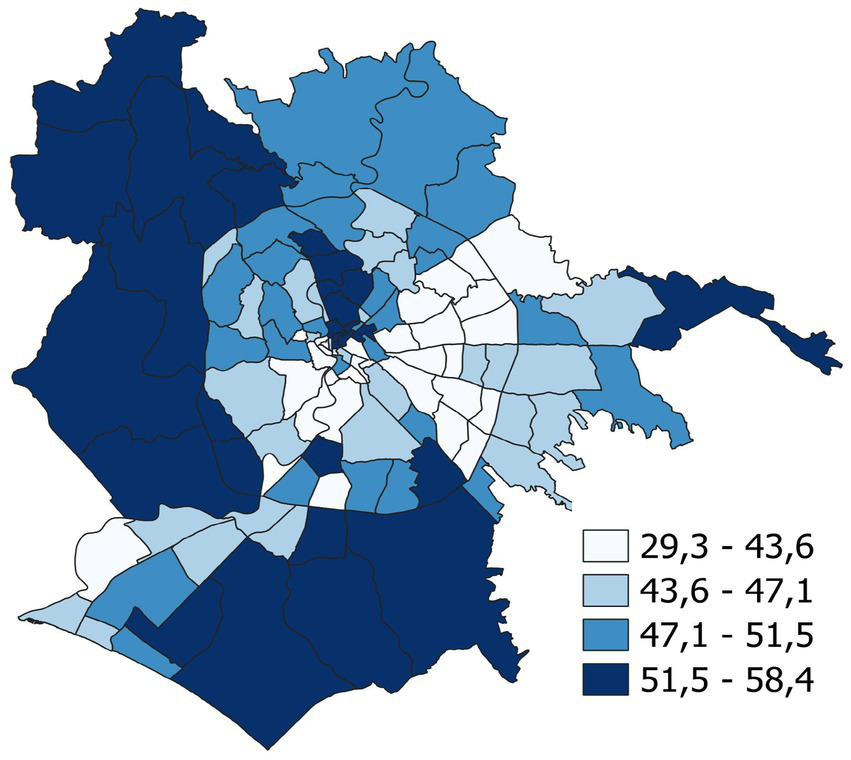
Figure 39
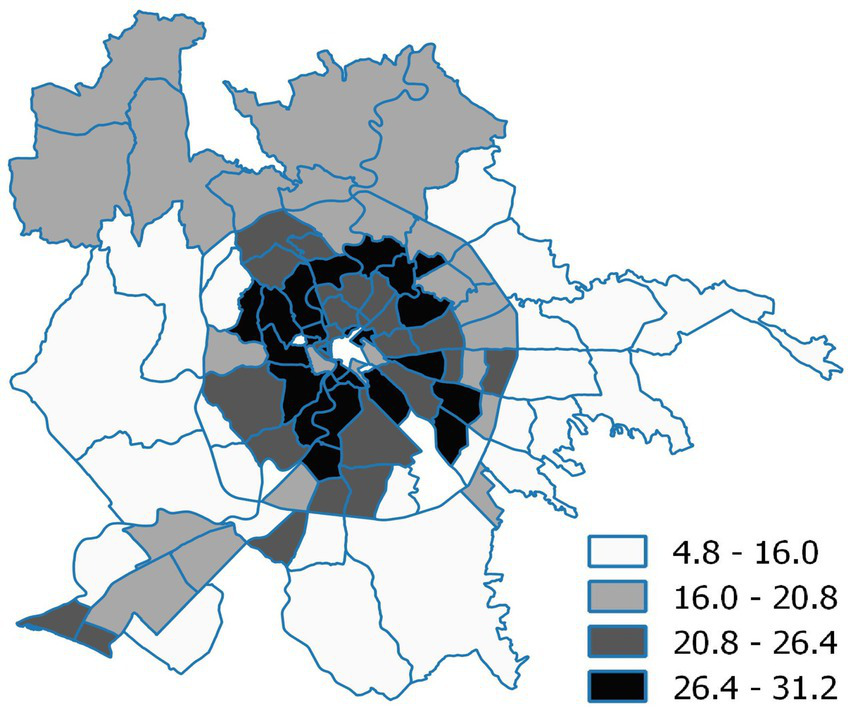
Percentage of elderly population according to ISTAT data (2011).
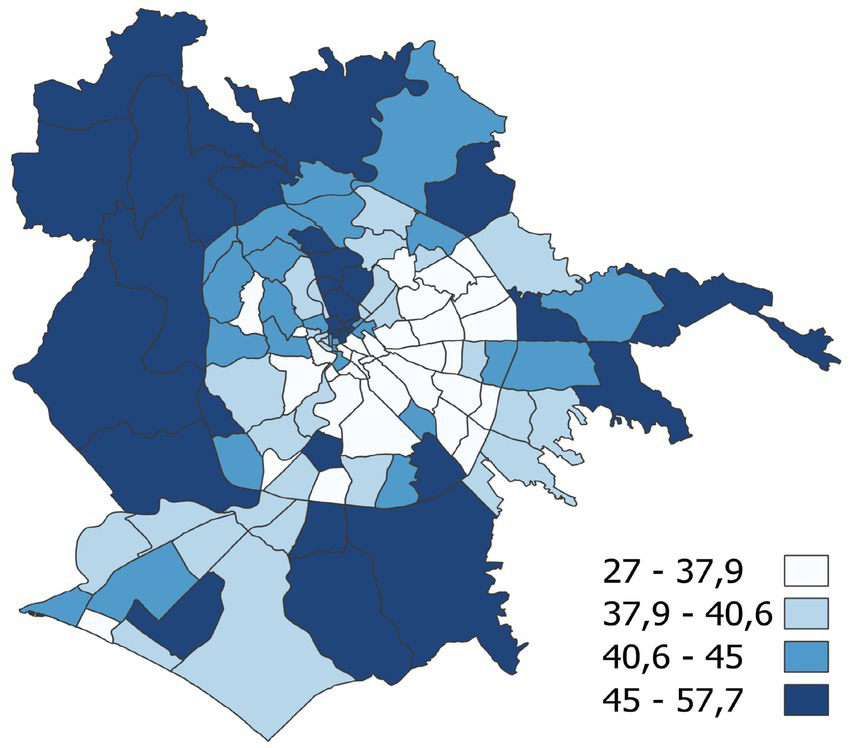
Figure 40
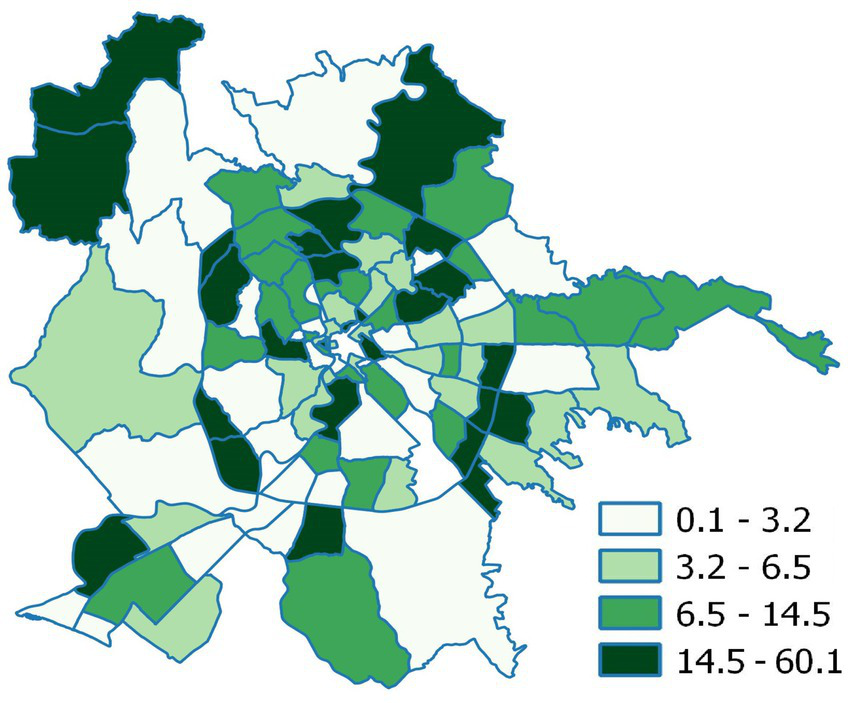
Percentage of foreign population according to ISTAT data (2011).
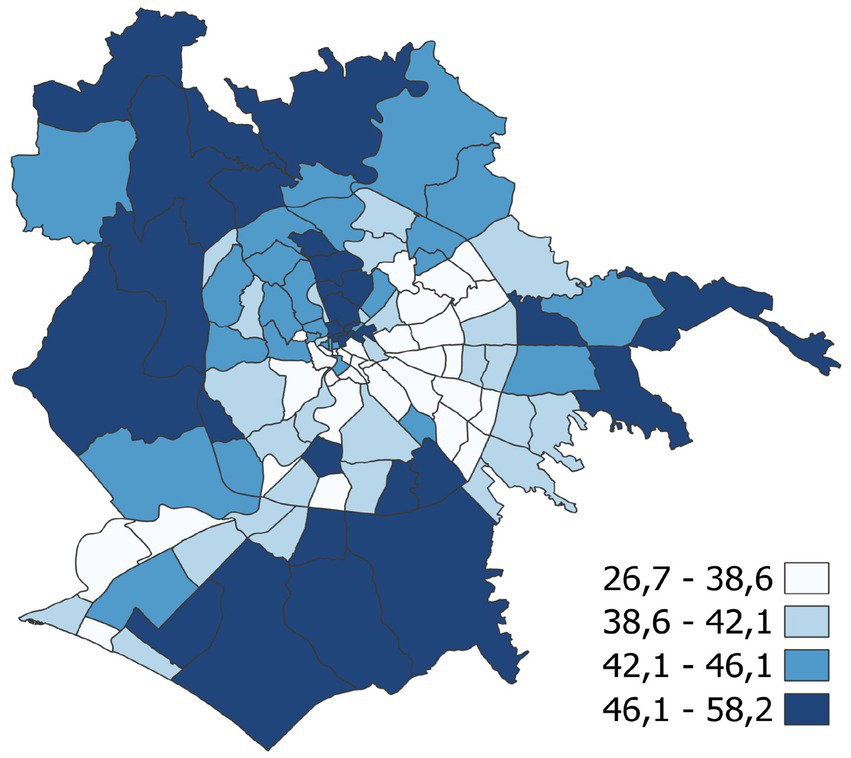
Figure 41
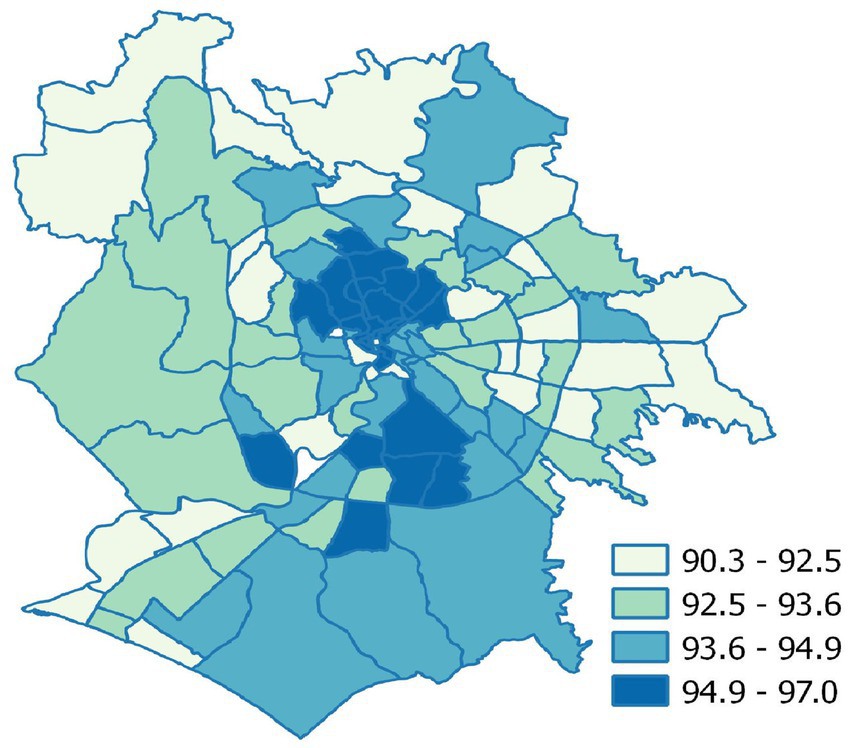
Percentage of employed population according to ISTAT data (2011).
Specifically, the strong concentration of elderly residents within the two central rings of the city emerges clearly. Young people, unable to afford housing in historic neighborhoods or in the first residential belt, are increasingly compelled to settle in modest accommodations in newly developed peripheral areas.
No particular concentration of foreign residents is observed, although higher values appear in the northeastern quadrant, precisely where the center-left has experienced its steepest electoral losses in recent years.
The variable “Education,” synthesized through the share of university graduates, reaches its highest values in the central areas of the city, particularly in the northern part, where the presence of several universities—unlike others located in peripheral areas—attracts students both academically and residentially.
Employment is also unequally distributed across different zones, with the outer periphery most affected by lower employment rates, except for the southern quadrant—particularly the area beginning with the Quartiere Europa, known for its concentration of service-sector enterprises, extending to the industrial zone of Pomezia.
Table 1 shows the strength of the relationships between the electoral results of the four main mayoral candidates in the 2016 municipal elections—plus those of Marino and Alemanno in 2013—and several socio-graphic variables. Coefficients are calculated on data reaggregated at the toponymic zone level.
Table 1
| Candidates | Employed | Income workers | Elderly | University graduates | Foreigners | Degraded areas |
|---|---|---|---|---|---|---|
| Raggi 2016 | −0.59*** | 0.51 | −0.61*** | −0.86*** | −0.03 | −0.10 |
| Giachetti 2016 | 0.54*** | −0.51 | 0.62*** | 0.84*** | −0.05 | 0.15 |
| Meloni 2016 | −0.35*** | 0.37 | −0.44*** | −0.57*** | 0.10 | −0.15 |
| Marchini 2016 | 0.51*** | −0.33 | 0.26*** | 0.63*** | 0.12 | −0.06 |
| Marino 2013 | −0.17 | −0.05 | 0.39*** | −0.02 | −0.14 | 0.09 |
| Alemanno 2013 | 0.06 | 0.12 | −0.27*** | −0.04 | 0.12 | −0.07 |
Linear correlation coefficients between the results of the Rome municipal elections (2013–2016) and social variables.
*** p-value <0.05. Source of sociographic variables: ISTAT 2011 Census.
Starting with the first column (relationship with the “employed population” variable, measured as the ratio between employed individuals and the labor force, following ISTAT parameters), a positive correlation (0.54) emerges with Giachetti’s vote share, and a negative correlation (−0.59) with Raggi’s. This suggests that employed individuals tended to vote for Giachetti, whereas the unemployed (still belonging to the labor force and thus classified as job-seeking) leaned toward Raggi.
This finding reinforces the recent trend of the center-left losing support among unemployed citizens—a phenomenon even more evident when compared to the much weaker correlation between Marino’s 2013 vote share and employment. The second column (the proportion of wage-earning employees within the labor force) shows an almost opposite pattern: Raggi’s vote share correlates positively (0.51) with the share of wage earners, while Giachetti’s shows a negative correlation. This could indicate a progressive erosion of center-left support among wage-earning workers, who until recently formed one of its electoral strongholds. Nevertheless, this interpretation should be treated with caution: the data on employees are derived from the Census of Industry and Services, which records businesses and their associated workforce; these employees might not reside in the same toponymic zones where they work, thus distorting the relationship between employment and residential voting data. Even non-significant p-values suggest that such relationships could be explored using different analytical methods.
Similar patterns emerge with the “elderly” variable (share of residents over 70 years of age): a positive correlation (0.62) with Giachetti and a negative one (−0.61) with Raggi, confirming the increasing reliance of the center-left on older voters (this correlation was only 0.39 for Marino in 2013), and conversely, the M5S’s and Giorgia Meloni’s stronger appeal among younger voters (with a −0.44 correlation for Meloni).
The highest absolute coefficients—both positive and negative—are found with the “university graduates” variable, which proxies educational attainment: the higher the educational level, the greater the vote for Giachetti, with a mirror negative association for Raggi.
Notably, the voting patterns of Marchini and Meloni, although less pronounced, mirror these trends, further supporting one of this article’s core arguments about the emergence of a territorial cleavage within the center-right, in line with the classical understanding of cleavages as persistent social and spatial divisions (Lipset and Rokkan, 1967).
Using the most relevant variables, we performed several clustering attempts, some of which yielded meaningful results. For example, applying the k-means algorithm to the variables MARINO13 (votes for the center-left candidate Ignazio Marino in 2013), Employed, Graduates, and Elderly (see Table 1), we identified a Cluster 0 characterized by the lowest values across nearly all variables. The limited support for Marino is concentrated in areas with fewer graduates, a younger population, and relatively low levels of employment. The spatial distribution of the clustering on the city map (Figure 42) reveals a clearly defined pattern of peripheral areas, with an intermediate situation in the northwestern quadrant within the G.R.A. (Grande Raccordo Anulare), which shows higher levels of education and employment compared to the other two clusters. Conversely, support for Alemanno is strongly concentrated in the northwestern quadrant and the far outskirts of the city.
Figure 42
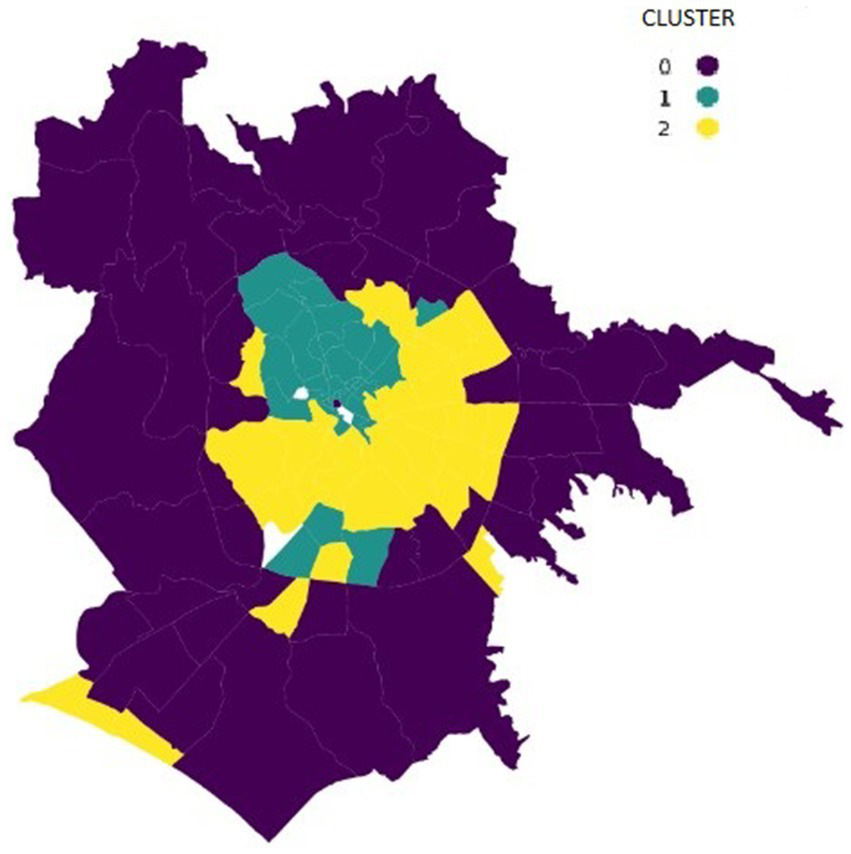
Sociographic composition of K-means clusters based on support for Marino (2013) related to Table 4.
Repeating the same procedure with the variable GUALTIERI 21 (votes for the center-left candidate in 2021), we observe a different configuration (Figure 43): while Cluster 0 still shows the lowest level of support—associated with low education levels, a younger population, and confinement to the outermost peripheries—the highest support is found in Cluster 1. This cluster is characterized by a high proportion of graduates and elderly residents, along with a high employment rate, and it extends beyond the central areas into the northwestern quadrant, reaching the outer periphery. It is as if the major electoral losses experienced by the center-left over those 3 years had less of an impact in the traditional strongholds of the center-right.
Figure 43
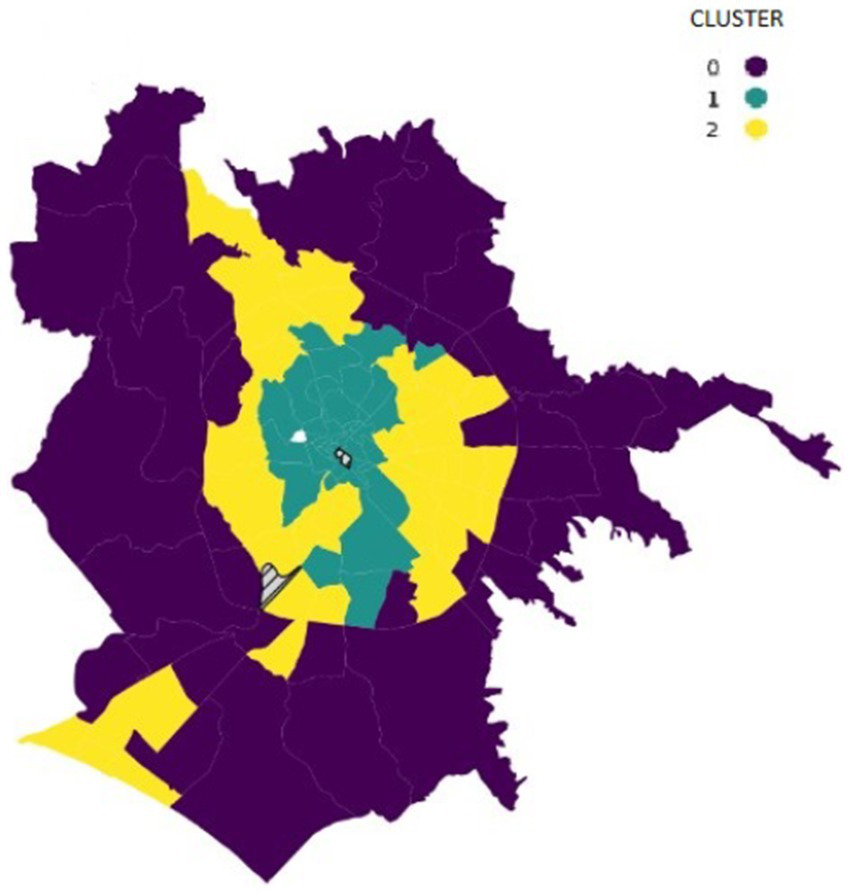
Sociographic composition of K-means clusters based on support for Gualtieri (2021) related to Table 5.
Additional evidence confirms the peripheral rooting of Five Star Movement support, which is associated with low levels of education and employment, but with a younger electorate.
5.2 Territorial divides: lines of cleavage
In this section, we reconstruct the main territorial lines of cleavage that organize and stratify Rome’s electoral geography. Drawing on the analysis of physical infrastructures such as the Tiber River, the Aurelian Walls, the ancient consular roads, the Fascia verde and the Grande Raccordo Anulare (Figure 1), we trace how distinct socio-political spaces have historically emerged and persisted across the urban fabric. This cartographic reading identifies two large areas—one predominantly center-left, the other predominantly center-right—whose formation mirrors broader processes of spatial polarization and political differentiation.
Starting from the historic center, we observe that a first line of division among the Rioni is marked by the Tiber River, which separates the Rioni of Trastevere, Borgo, and Prati (the so-called “beyond-the-Tiber” Rioni) from the other nineteen. The boundary of the historic center runs northward in a clockwise direction along Via del Muro Torto, Corso d’Italia, and Via del Policlinico, almost parallel to the Aurelian Walls: a perimeter thus composed of ancient walls and heavily trafficked roads, creating a clear urban rupture with the rest of the city. This line continues along Via Salaria and Tevere river to the northern limits of the municipality.
Another major boundary curve runs from west to South, linking Via Aurelia to Via Appia. Within this arc are the Quartieri Gianicolense, Portuense, Ostiense, and Ardeatino, along with the Suburbi Gianicolense and Portuense. Outside it lie the Quartieri Europa and Giuliano Dalmata and the Zone of Pisana, Magliana Vecchia, Tor di Valle, Cecchignola, and Torricola.
The last major circular division is drawn by the Grande Raccordo Anulare (G.R.A.), which throughout its perimeter demarcates the “frontier” between Quartieri and Suburbi on the inside and the Zone of the Agro Romano on the outside; all Quartieri and Suburbi lie within the G.R.A., whereas almost all Zone are outside.
Thus far, we have considered boundary lines that roughly form concentric rings around the city’s surface. Alongside these, we introduce pathways that can mostly be identified with the ancient consular roads, which since Roman times have represented the main routes of penetration toward the city’s center and around which urbanization processes have always developed. Even today, they structure the commuting flows toward the heart of the city and constitute “the axes richest in urban attraction elements for the population” (Crisci, 2003).
For our analysis, we highlight the following:
-
Via Salaria, running northward, separates to the west the Quartieri Pinciano, Parioli, and Tor di Quinto (with the Tiber River acting as a reinforcing parallel boundary) and the Zone of Grottarossa, Labaro, and Prima Porta, from the Quartieri Salario and Trieste and the Zone Val Melaina, Castel Giubileo, and Marcigliana to the east. This vertical axis also penetrates the historic center, dividing the Rioni Ludovisi and Trevi to the West from Sallustiano, Castro Pretorio, and Monti to the East.
-
Via Aurelia, running westward, and the Viale delle Mura Aureliane, which delimit the Rione Trastevere. At South of this boundary lies the Rione Trastevere, the Quartiere Gianicolense, and the Suburbio Gianicolense; to the North, the Rione Borgo, the Quartiere Aurelio, and the Suburbio Aurelio.
-
Via Appia, in the stretch from the Caffarella Park toward the outskirts, separates the Quartiere Appio Pignatelli and the Zona Torricola to the Wast from the Quartieri Tuscolano and Appio Claudio and the Zona Capannelle to the West.
At this point, it is useful to introduce a schematic illustration (Figure 13) that identifies two broad areas, indicated with the letters A (dashed in the figure) and B (lines in the figure). The boundary between these two areas has represented for decades a sharp division between zones predominantly supporting the center-right (Area A) and those favoring the center-left (Area B). Area A covers the majority of the Zone of the Agro Romano, some southern Quartieri inside the G.R.A., and penetrates the city’s core from the northwestern quadrant, passing through the Quartieri Parioli and Pinciano and reaching into the Rioni Ludovisi, Trevi, and Colonna, traditional strongholds of conservative voting behavior. Area B encompasses much of the historic center and the “first-ring” Quartieri, particularly on the eastern side of the city up to the G.R.A. and, occasionally, beyond it. It was characterized by strong support for the centre-left—at least until 2013. Figure 44 presents a simplified representation of Rome’s electoral geography after 2013. Three main patterns can be observed: the progressive decline of centre-left support in the eastern outskirts of the city; the widespread presence of “populist” voting across all peripheral areas; and the continued strength of the centre-right vote in the north-western quadrant, where a distinction can be made between its “social-right” and “moderate-right” components. The evolution of the territorial distribution of the vote can also be inferred from the combined reading of Tables 2–4 which compare the main mayoral candidates in the first rounds of the 1997 and 2021 elections—the first and last elections for which disaggregated data are available. The focus on mayoral candidates is due to their coalition-based nature and the uniform presence of candidates across the entire municipal territory. Values are organized by Area, according to the 1993–2013 zoning scheme (Figure 13), and by type of toponymic zone.
Figure 44
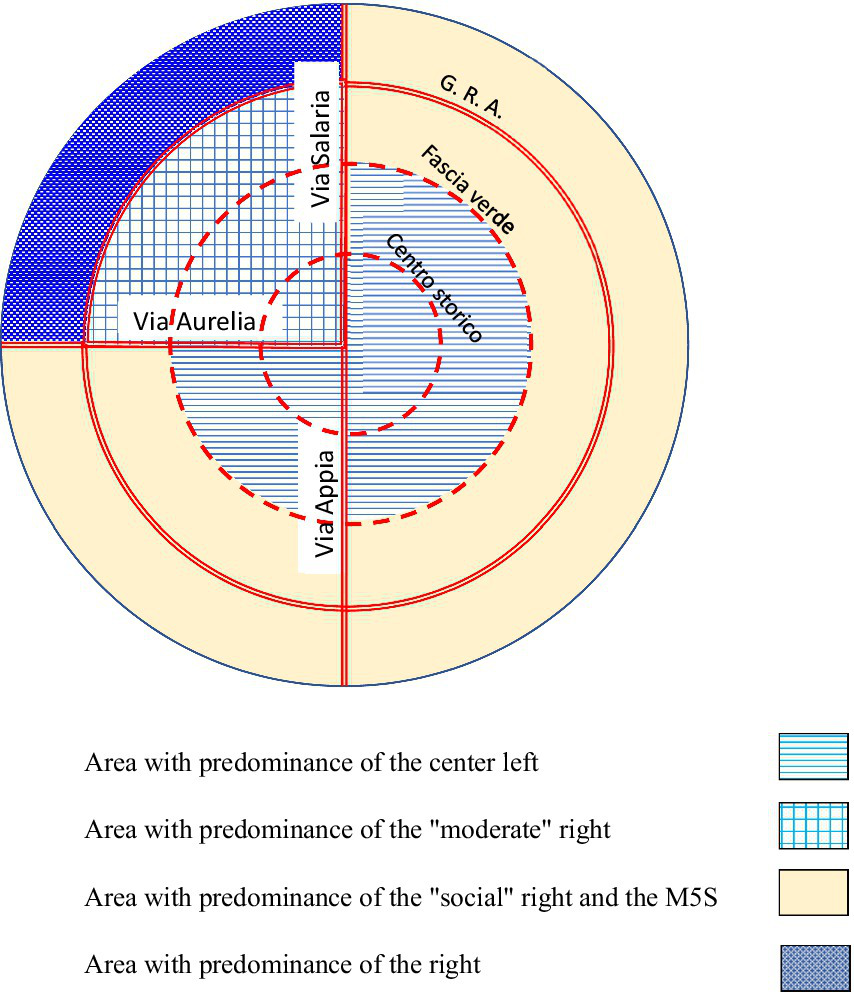
Simplified map of the electoral geography of the municipality of Rome since 2013.
Table 2
| Area | Type | 1997 | 2021 | ||||
|---|---|---|---|---|---|---|---|
| Borghini | Rutelli | Michetti | Gualtieri | Raggi | Calenda | ||
| A | R | 42.5 | 53.1 | 27.0 | 29.2 | 10.0 | 30.2 |
| Q | 39.7 | 56.5 | 28.8 | 25.9 | 14.6 | 27.1 | |
| S | 40.0 | 56.0 | 34.3 | 22.7 | 17.6 | 22.3 | |
| Z | 39.5 | 56.5 | 36.9 | 21.7 | 22.2 | 15.6 | |
| Mean | 39.8 | 56.2 | 32.4 | 24.1 | 17.6 | 22.3 | |
| B | R | 32.1 | 64.1 | 21.0 | 35.4 | 11.8 | 28.4 |
| Q | 34.3 | 62.4 | 27.0 | 30.3 | 18.1 | 20.4 | |
| S | 33.9 | 62.7 | 31.5 | 27.6 | 20.2 | 16.8 | |
| Z | 34.0 | 62.3 | 34.9 | 22.8 | 24.9 | 12.9 | |
| Mean | 34.1 | 62.4 | 28.9 | 28.6 | 19.6 | 18.7 | |
| Total | 36.0 | 60.4 | 30.1 | 27.0 | 18.9 | 20.0 | |
Comparison of Mayoral vote shares by toponymic zone and areas of consensus (1997–2021).
The “Area” variable refers to the 1993–2013 zoning model. Zone type: R = Rioni (historic districts), Q = Quartieri (official neighborhoods), S = Suburbs, Z = Peripheral zones. Candidates: Borghini and Michetti (center-right), Rutelli and Gualtieri (center-left), Raggi (M5S), Calenda (liberal/centrist).
Table 3
| Type | 1997 | 2021 | ||||
|---|---|---|---|---|---|---|
| Borghini | Rutelli | Michetti | Gualtieri | Raggi | Calenda | |
| R | 37.5 | 58.4 | 23.9 | 32.4 | 10.9 | 29.3 |
| Q | 35.6 | 60.9 | 27.5 | 29.2 | 17.2 | 22.1 |
| S | 36.8 | 59.5 | 33.0 | 25.1 | 18.9 | 19.6 |
| Z | 36.2 | 60.0 | 35.2 | 22.6 | 23.4 | 14.7 |
| Total | 35.9 | 60.4 | 30.2 | 27.0 | 19.0 | 19.9 |
Comparison of Mayoral vote shares by toponymic zone.
Table 4
| Cluster | Marino 13 | Graduates (%) | Elderly (%) | Employed (%) |
|---|---|---|---|---|
| 0 | 36.36 | 7.44 | 15.05 | 92.95 |
| 1 | 39.59 | 18.22 | 25.37 | 95.37 |
| 2 | 45.83 | 9.23 | 24.4 | 92.83 |
Sociographic composition of K-means clusters based on support for Marino (2013).
Table 5
| Cluster | Gualtieri (%) | Graduates (%) | Elderly (%) | Employed (%) |
|---|---|---|---|---|
| 0 | 17.79 | 6.68 | 14.72 | 92.86 |
| 1 | 33.44 | 17.53 | 25.13 | 94.95 |
| 2 | 23.83 | 8.99 | 23.26 | 92.98 |
Sociographic composition of K-means clusters based on support for Gualtieri (2021).
The first notable element is the low variance across zone types in the 1997 elections (Table 2), with values close to the overall average. In contrast, the 2021 elections show much sharper territorial differences—up to nearly 14 percentage points for Michetti in Area B, 12.6 for Gualtieri in the same area, and nearly 15 points for Calenda in Area A. In Table 3, the grouping by zone type does not take Area into account.
Over the 24-year period, the center-right candidate has retained support in the Suburbs and Zones, while experiencing a sharp decline in the Rioni and Quartieri. The opposite trend is seen for the center-left candidate, although with different proportions, partly due to Rutelli’s exceptional performance. Calenda’s electoral geography closely mirrors that of Gualtieri, whereas Raggi’s pattern closely resembles that of Michetti. It is clear that the erosion of center-left support is concentrated in the outermost periphery, while it remains relatively strong not only in the historic center (Rioni) but also within the Fascia verde, which encompasses most of the Quartieri.
What stands out is the greater contribution of the Rioni to Gualtieri’s vote compared to Rutelli’s, along with the concentration of above-average support in several Quartieri for both candidates.19
For the center-right candidates, the opposite occurs. Michetti received almost 9 percentage points less in the Quartieri than Borghini, and nearly 10 points more in the Zones. In the Zones, Raggi records her highest percentage, while Calenda achieves his best result in the Rioni. This reflects the growing strength of the center-right—driven by Fratelli d’Italia– in the outermost peripheries, in direct competition with the Five Star Movement, which surpasses the center-right in terms of territorial concentration of its electorate, yet remains weaker in the historic center and in the Quartieri, where its support is at its lowest.
6 Conclusion
This paper investigates how electoral behavior in Rome evolved during the Second Republic (1993–2024), and to what extent socio-graphic, historical, and urban characteristics account for persistent and emerging patterns of political allegiance. Through a longitudinal spatial analysis, employing electoral and socio-graphic data aggregated at the level of toponymic zones, we reconstruct the role of urban morphology and social stratification in shaping Rome’s political geography.
The choice to use toponymic zones—historically sedimented, and culturally encoded—represents an overcoming of the limitations of conventional administrative aggregates. The cartographic projections produced for each electoral cycle between 1993 and 2024 confirm the enduring spatial structuring of electoral behavior in Rome. Voting patterns consistently map onto two principal territorial logics: a “concentric cleavage,” separating the historic center and first urban ring (the Fascia verde) from the peripheral areas beyond the Grande Raccordo Anulare, and a “radiant cleavage,” following the ancient consular roads radiating from the core. While political supply changed significantly during this period, introducing new actors and altering competitive dynamics—particularly through the growing role of polarizing leadership communication (Mariotti and Stanziano, 2024)—some socio-spatial foundations of political allegiance in several areas remain remarkably stable.
Although selective centrifugal dynamics of the right-wing toward the inner peripheries and centripetal dynamics of center-left and populist forces consolidating in the outer zones diversified the internal articulation of the electoral geography, these shifts did not erase the underlying spatial frameworks. Maps of turnout and socio-graphic indicators reinforce these findings, showing that electoral divisions mirror enduring differences in education, employment, and age between the center and the peripheries, revealing both the capacity for adaptation and the resilience of Rome’s historically embedded territorial cleavages.
Our findings confirm Agnew’s (1987) and Johnston et al.’s (2001) arguments, showing that space is not a neutral setting but an active structuring force in political behavior. They also support Medeiros (2016) emphasis on the enduring relevance of territorial cohesion and align with Dühr’s et al. (2010) critique of the limitations of formal administrative boundaries in capturing lived socio-political spaces. Finally, drawing on Gasparini’s (2010) concept of territorial belonging—which highlights the symbolic and emotional attachments to place over time—as well as on insights from Italian urban sociology and electoral geography, our analysis of Rome confirms the enduring strength of spatial belonging and the structuring influence of historically embedded urban configurations. These findings also resonate with broader comparative perspectives on inequality and the political ecology of metropolitan space (Sellers et al., 2013). While some of these patterns are partially reflected in Tomassi’s (2018) identification of a center-periphery electoral gradient, our results extend that reading by identifying three longer-term dynamics. First, we observe a re-centralization of the left, whose support progressively contracts into the inner Rioni and selected Quartieri starting already after 2008. Second, we trace the spatial instability of the M5S, which, despite its initial success, fails to establish a coherent territorial base over time—one that extends beyond a representation rooted in the outermost periphery. Third, especially concerning the vote of the Right, our findings reveal the presence of radial cleavages—particularly along consular roads and infrastructural axes—that complicate the concentric model and expose deeper socio-symbolic asymmetries shaping political behavior across the city.
Future research should investigate whether emerging patterns of residential mobility, socio-economic resegregation, and demographic change will reinforce or destabilize these spatial structures. In particular, integrating fine-grained longitudinal data on individual mobility, residential trajectories, and urban redevelopment processes could yield deeper insights into the mechanisms sustaining or transforming territorial cleavages in urban political behavior.
Statements
Data availability statement
The raw data supporting the conclusions of this article will be made available by the authors, without undue reservation.
Author contributions
ND′A: Writing – original draft, Writing – review & editing. CM: Writing – original draft, Writing – review & editing.
Funding
The author(s) declare that no financial support was received for the research and/or publication of this article.
Conflict of interest
The authors declare that the research was conducted in the absence of any commercial or financial relationships that could be construed as a potential conflict of interest.
Generative AI statement
The authors declare that no Gen AI was used in the creation of this manuscript.
Publisher’s note
All claims expressed in this article are solely those of the authors and do not necessarily represent those of their affiliated organizations, or those of the publisher, the editors and the reviewers. Any product that may be evaluated in this article, or claim that may be made by its manufacturer, is not guaranteed or endorsed by the publisher.
Footnotes
1.^ For a clearer understanding of the discussion, we suggest referring to a map of the toponymic zones; a useful version is provided by the Municipality of Rome at the following page: https://www.comune.roma.it/web-resources/cms/documents/Territorio_RomaCapitale.pdf.
2.^ North-West, North-East, Red Zone, South and Islands.
3.^ Industrial, White, Red, Southern.
4.^ The future of territorial political subcultures remains uncertain, despite interventions by authoritative voices that have not, however, reached shared conclusions. On one hand, some scholars declare the end of this analytical category, arguing that its foundational structures have collapsed: high levels of electoral participation, the party as the pivot of the system, connections with the associative world, “its values and myths, its rituals and banners” and, not least, ideology itself (Caciagli, 2011). On the other hand, others conceive of “territorial political subculture as a complex system” which opens the door to “categories of adaptation and transformation.” This view is supported by the persistence of electoral support for the dominant party (inherited by the PD in the “red” zone and by the Lega, which has supplanted the Christian Democrats in the “white” zone), by the crucial role now played by local governments as “engines of political representation,” by the rise of “territorial identity as a value in itself” as well as by the enduring presence of values such as equality, solidarity, and social justice, and by a democratic culture deeply “rooted in the collective consciousness” (Floridia, 2010).
5.^ A new administrative subdivision of Rome is currently under discussion, reflecting widespread recognition that the existing territorial framework no longer aligns with the city’s demographic and functional realities (https://www.comune.roma.it/web/it/notizia.page?contentId=NWS1033895).
6.^ The subdivision of Rome into toponymic zones reflects the city’s historical and urban development over time. The Rioni, covering the historic center, were progressively codified between the sixteenth and nineteenth centuries, culminating after the annexation of Rome to the Kingdom of Italy in 1870. The Quartieri emerged between 1911 and 1930, accompanying the first major urban expansions beyond the Aurelian Walls. The Suburbi were established during the 1930s, under fascist urban reforms aimed at organizing the semi-rural peripheries. Finally, the Zones of the Agro Romano were formally instituted in 1961 with the administrative need to regulate the extensive rural areas annexed to the municipal territory. This stratified and historically sedimented spatial framework provides a stable basis for diachronic analysis of electoral behavior, as each toponymic zone has maintained clear territorial continuity across decades. Some reflections have been offered in Cedroni et al. (2011). For a historical-urbanistic overview of the territory of Rome, see Rosati (2003) and Rosati (2003). We will use a capital letter for Rioni, Quartieri, Suburbi, and Zone dell’Agro when specifically referring to the corresponding toponymic zones; and a lowercase letter when referring to general territorial areas.
7.^ The toponymic zones include a specific number of electoral precincts as well as ISTAT census tracts; each precinct or tract belongs to one and only one toponymic zone, which enables direct comparisons between electoral data and demographic, social, and economic data at this level. The attribution of electoral section-level results to toponymic zones was based on official tables published by the Municipality of Rome, which associate them with both a toponymic and an urbanistic zone (https://www.comune.roma.it/web-resources/cms/documents/RIPARTIZIONE_DEL_TERRITORIO_COMUNALE_IN_SEZIONI_ELETTORALI.pdf).
8.^ Johnston et al. (2001) demonstrate that the operation of the UK electoral system systematically introduces biases at the levels of proportionality, distribution, and boundary-drawing, and that these biases interact with persistent territorial patterns of political support to shape electoral outcomes.
9.^ Law No. 81 of 25 March 1993 regulates the direct election of mayors, presidents of provinces, municipal councils, and provincial councils.
10.^ In Turin, the left was so strong that it presented two prominent candidates, both of whom advanced to the runoff: Castellani, who was elected mayor, supported by the PDS, the Greens, and a civic list; and Novelli, supported by the Communist Refoundation Party, La Rete, the Pensioners’ Party, and a civic list.
11.^ The unavailability of precinct-level data prior to 1997 prevents us from aggregating electoral results by toponymic zones for that period. Therefore, we rely on the Chamber of Deputies electoral districts designed in 1993 (Legislative Decree No. 536 of 20 December 1993, following the reform of the electoral law under Law No. 277 of 4 August 1993, which incorporated the results of the abrogative referendum held on 18-19 April 1993). Although fewer in number than the toponymic zones (24 districts compared to 144 zones), these districts still offer some "geographical" insight. Furthermore, they aggregate entire toponymic zones and, due to careful design, maintain a certain level of internal homogeneity across neighborhoods.
12.^ For example, in the Ostiense district there was a strong showing by the Polo del Buon Governo, partly due to the presence of only two candidates, making it reasonable to assume a convergence of popular and centrist votes toward the center-right candidate.
13.^ At the municipal level, National Alliance reached 24.1% of the vote, while Forza Italia (running on a joint list with the CDU) stopped at 10.1%.
14.^ On this occasion, the new subdivision of the electorate into electoral precincts, established by Law No. 449 of December 27, 1997, was applied, resulting in a 30% reduction in the number of sections. However, this change does not affect our analysis, as each new electoral section falls entirely within a single toponymic zone.
15.^ A more detailed account of the structure of the two areas will be provided in section 5.2.
16.^ Actually, elections were also held in 2006 for both the national Parliament and the municipal government, but on different dates. In 2008, new municipal elections were called in Rome due to the resignation of Mayor Walter Veltroni, who stepped down to run as the head of the PD-IdV coalition in the national elections.
17.^ The term refers to a “standalone” electoral strategy, made necessary after the failure of the broad 13-list coalition formed in 2006.
18.^ The choice of 2011 is justified by its greater “proximity” to the associated electoral data, namely those from 2013 and 2016, which, according to our hypothesis, mark the period in which voting behavior underwent the most significant transformation.
19.^ We caution that these percentages are not affected by the substantial decline in voter turnout observed over the period, nor by the resulting drop in absolute vote numbers. However, because the zones differ significantly in size and population, the weight of each zone strongly influences the proportion. Therefore, vertical comparisons between zones are not meaningful; only horizontal comparisons—between two or more candidates within the same zone—should be considered valid.
References
1
Agnew J. A. (1987). Place and politics: the geographical mediation of state and society. 1stEdn. London: Routledge.
2
Barbagli M. Corbetta P. (1980). L’elettorato, l’organizzazione del PCI e i movimenti. Il Mulino3, 467–490. doi: 10.1402/14383
3
Caciagli M. (2011). Subculture politiche territoriali o geografia elettorale?SocietàMutamentoPolitica2, 95–104. doi: 10.13128/SMP-10320
4
Casmirri S. Totaro P. (2008). Atlante elettorale dell’Italia repubblicana. Lazio. Assemblea costituente, Camera dei deputati 1946–1963. Catania: Editpress.
5
Cavazza N. Corbetta P. (2008). Quando la difesa del territorio diventa voto. Il Mulino3, 441–448.
6
Cedroni L. D’Amelio N. De Rosa R. (2011). I referendum del 12-13 giugno 2011 a Roma: la campagna e la partecipazione. Quad. Oss. Elettorale66, 61–90.
7
Cellamare C. (2011). Fare città. Pratiche urbane e storie di luoghi. Milano: Elèuthera.
8
Charney I. Malkinson D. (2015). Between electoral and urban geography: voting patterns and socio-spatial dynamics in Tel Aviv. Appl. Geogr.58, 1–6. doi: 10.1016/j.apgeog.2015.01.002
9
Cipollini R. Truglia F. G. (2015). La metropoli ineguale. Analisi sociologica del quadrante Est di Roma. Roma: Aracne.
10
Crisci M. (2003). “Sistemi giornalieri urbani di Roma: un’ipotesi di definizione” in I territori di Roma. Storie, popolazioni, geografie. eds. MorelliR.SonninoE.TravagliniC. M. (Roma: Università di Roma La Sapienza), 533.
11
Crulli M. Pinto G. (2025). The urban roots of populism: mapping and explaining populist strongholds within major Italian cities (2013–2022). Eur. Urban Reg. Stud.32, 15–34. doi: 10.1177/09697764231210800
12
De Mucci R. (1984). La partecipazione elettorale nei quartieri urbani. Il caso di Roma. Quad. Oss. Elettorale13, 9–35.
13
Diamanti I. (2010). “Le subculture territoriali sono finite. Quindi (re)esistono” in La politica e le radici. eds. BaccettiC.BolgheriniS.D'AmicoA.RiccamboniG. (Novara: DeAgostini), 45–60.
14
Dogan M. (1967). “Political cleavage and social stratification in France and Italy” in Party systems and voter alignments: cross-national perspectives. eds. LipsetS. M.RokkanS. (Toronto: The Free Press), 45–96.
15
Dühr S. Colomb C. Nadin V. (2010). European spatial planning and territorial cooperation. 1st Edn. London: Routledge.
16
Erbani F. (2013). Roma. Il tramonto della città pubblica. Roma-Bari: Laterza.
17
Floridia A. (2010). “Le subculture politiche territoriali in Italia: epilogo o mutamento?” in La politica e le radici. eds. BaccettiC.BolgheriniS.D’AmicoA.RiccamboniG. (Novara: DeAgostini), 61–79.
18
Gasparini A. (2010). Community and territorial belonging. Comp. Sociol.9, 433–456. doi: 10.1163/156913210X12555713197097
19
Gesualdi A. (2006). Un’altra Italia, ovvero come risolvere la «questione centrale», Mazzanti Libri.
20
Golini A. (2000). “La popolazione” in Roma del Duemila. ed. De RosaL. (Roma-Bari: Laterza), 135.
21
Guțoiu G. (2018). Electoral geography and the post-socialist city: is the pre-World War II urban tissue still important? Evidence from Bucharest in the Romanian parliamentary elections of 2016. Sociol. Românească16, 49–66.
22
Johnston R. J. Pattie C. J. Dorling D. Rossiter D. J. (2001). From votes to seats: the operation of the UK electoral system since 1945. Manchester: Manchester University Press.
23
Kerekes D. (2020). The city as an onion? Case studies of electoral geography in Prague and Warsaw. Sociol. Slovak Sociol. Rev.52, 245–272. doi: 10.31577/SOCIOLOGIA.2020.52.3.11
24
Kovalcsik T. Szabó B. Vida G. Boros L. (2021). Area-based and dasymetric point allocation interpolation method for spatial modelling micro-scale voter turnout in Budapest. Geogr. Tech.16, 67–77. doi: 10.21163/GT_2021.161.06
25
Lipset S. M. Rokkan S. (1967) in Cleavage structures, party systems, and voter alignments. eds. LipsetS. M.RokkanS. (New York: Free Press).
26
Lombardo C. (2009). “Dalla politica al territorio. Aspetti della competizione elettorale nella Seconda Repubblica” in Perché la sinistra ha perso le elezioni? eds. MorcelliniM.ProsperoM. (Roma: Ediesse), 83–110.
27
Mariotti C. (2011). Berlusconism: some empirical research. Bull. Ital. Polit.3, 35–57.
28
Mariotti C. Marradi A. (2021). Identity and politics in Italy and Argentina. Cambio. Riv. Trasf. Soc.11, 107–120. doi: 10.36253/cambio-11242
29
Mariotti C. Stanziano A. (2024). The political communication of polarizing leaders. Evidence from Italy. Contemp. Ital. Polit., 1–20. doi: 10.1080/23248823.2024.2362487
30
Marradi A. (2007). Metodologia delle scienze sociali. Bologna: Il Mulino.
31
Medeiros E. (2016). Territorial cohesion: an EU concept. Eur. J. Spat. Dev.14:30. doi: 10.5281/zenodo.5141339
32
Park R. E. Burgess E. W. (1925). The city: suggestions for the investigation of human behavior in the urban environment. Chicago: University of Chicago Press.
33
Pinto G. (2023). Sezioni Elettorali Italiane (SEI): a new database of Italian electoral results geocoded at precinct level. Polit. Res. Exch.5:2185158. doi: 10.1080/2474736X.2023.2185158
34
Reif K. Schmitt H. (1980). Nine second-order national elections—a conceptual framework for the analysis of European election results. Eur J Polit Res8, 3–44. doi: 10.1111/j.1475-6765.1980.tb00737.x
35
Rosati P. (2003). Roma moderna. Storia urbanistica dal XIX al XXI secolo. Roma: Carocci.
36
Rosati R. (2003). “Popolazione e territorio a Roma nell'ultimo trentennio del Novecento” in I territori di Roma. Storie, popolazioni, geografie. eds. MorelliR.SonninoE.TravagliniC. M. (Roma: Università di Roma La Sapienza), 465–472.
37
Sellers J. M. Kübler D. Walter-Rogg M. Walks R. A. (Eds.) (2013). The political ecology of the metropolis: metropolitan sources of electoral behaviour in eleven countries. Colchester: ECPR Press.
38
Talamo G. (2000). “Profilo politico” in Roma del Duemila. ed. De RosaL. (Roma-Bari: Laterza), 13–15.
39
Tinacci Mosello M. (2006). Identità territoriale, partecipazione e rappresentanza politica. Quad. Oss. Elettorale55, 255–265. doi: 10.36253/qoe-12717
40
Tocci W. (2015). Roma: non si piange su una città coloniale. Note sulla politica romana. Firenze: goWare.
41
Tomassi F. (2018). Il voto nei quartieri di Roma dal 2000 al 2018. Quad. Oss. Elettorale80, 83–110. doi: 10.36253/qoe-8531
42
Tomassi F. (2024). The revenge of districts that don’t matter: inequality and elections in Rome from 2000 to 2023. Contemp. Ital. Polit., 1–20. doi: 10.1080/23248823.2024.2372958
43
Trigilia C. (1981). Le subculture politiche territoriali. Milano: Quaderni della Fondazione Feltrinelli.
44
Truglia F. G. (2009). La città in-visibile. Analisi statistica spaziale degli stranieri nel comune di Roma. Sociol. Ric. Soc.88, 59–78.
45
Violante A. (2013). Piove sul bagnato. La povertà urbana in una periferia metropolitana ai tempi della crisi. Rass. Ital. Sociol.54, 279–308.
Summary
Keywords
Rome, electoral geography, territorial cleavages, urban politics, political behavior, spatial voting patterns, socio-graphic factors, electoral maps
Citation
D’Amelio N and Mariotti C (2025) Sedimentations and emerging cleavages. A social spatial analysis of Rome’s voting patterns during the Second Republic. Front. Polit. Sci. 7:1631946. doi: 10.3389/fpos.2025.1631946
Received
20 May 2025
Accepted
21 July 2025
Published
04 September 2025
Volume
7 - 2025
Edited by
Dario Quattromani, Università Link Campus, Italy
Reviewed by
Gabriele Pinto, Sapienza University of Rome, Italy; Tamás Kovalcsik, HUN-REN Centre for Social Sciences, Hungary
Updates
Copyright
© 2025 D’Amelio and Mariotti.
This is an open-access article distributed under the terms of the Creative Commons Attribution License (CC BY). The use, distribution or reproduction in other forums is permitted, provided the original author(s) and the copyright owner(s) are credited and that the original publication in this journal is cited, in accordance with accepted academic practice. No use, distribution or reproduction is permitted which does not comply with these terms.
*Correspondence: Claudia Mariotti, claudia.mariotti@uniroma3.it
Disclaimer
All claims expressed in this article are solely those of the authors and do not necessarily represent those of their affiliated organizations, or those of the publisher, the editors and the reviewers. Any product that may be evaluated in this article or claim that may be made by its manufacturer is not guaranteed or endorsed by the publisher.