 Costas Panagopoulos
 Ching-Hsing Wang
- 1Department of Political Science, Northeastern University Library, Northeastern University, Boston, MA, United States
- 2Department of Political Science, National Cheng Kung University, Tainan, Taiwan
Introduction: Although both rational choice theory and emotion provide some explanatory power for individual voting behavior, few studies to date have simultaneously examined the effects of rationality (cognition) and emotion (affect) on vote choice. This study aims to fill that void and to explore the relative effects of rationality and emotion on individual political preferences.
Methods: Using data from the 2000–2016 American National Election Studies, we conducted statistical analyses to estimate the effects of the party differential and the emotion differential on individual voting decisions.
Results: Findings indicate that voters take competing parties’ policy positions as well as their emotional responses to competing candidates into consideration to make their voting decisions. That is, individual voting decisions are guided by both affect and rationality. Furthermore, affective orientations appear to exert a larger impact on vote choice compared to rational considerations.
Discussion: The results call greater attention to the affective underpinnings of voting decisions and suggest that models that exclude or otherwise minimize the influence of emotional considerations on vote choice are incomplete or underspecified.
Introduction
Voting is the most common and prominent form of political participation in a democracy (Aldrich, 1993, p. 246). Moreover, voting is important not only for the health of the political system but also for the citizens who participate in the political process. Voting enables the public to choose their political leaders and to punish those who violate the public’s will; elected officials rely on public support to remain in office. In short, voting makes political accountability possible. Given the importance of voting in a democracy, political behavior scholars have focused extensively on identifying the determinants of vote choice for decades. In their seminal book, Campbell et al. (1960) conclude that most voters cast their ballots primarily on the basis of partisan identification, commonly inherited from parents. More specifically, individual voting decision can be understood using a metaphor of passing through a funnel. Party identification is located at the opening of the funnel and creates a partisan lens through which voters assess policy issues and evaluate candidates.
This model has guided the study of voting behavior for decades, but rational choice theory has also played an important role in the analysis of vote choice ever since Downs (1957) seminal work. The premise of rational choice theory is that voters select a political party or a candidate that maximizes their utility, and scholars have applied this framework extensively to the study of individual voting behavior (Aldrich, 1993; Feddersen, 2004; Ledyard, 1984; Weakliem and Heath, 1994; Whiteley, 1995). For the most part, rational choice perspectives largely overlooked the role of affect, or emotions, in vote choice, but recent scholarship has placed a renewed emphasis on emotions (Brader et al., 2011; Abelson et al., 1982; Marcus et al., 2000). It is now well recognized that there is a strong connection between affective orientations and individual political participation and choice (Redlawsk, 2006). For instance, emotion is found to play an important role in voter mobilization (Valentino et al., 2011) and can be a strong predictor of individual political preference (Abelson et al., 1982; Ladd and Lenz, 2008; Marcus and MacKuen, 1993; Marcus et al., 2000). Although both rational choice theory and emotion provide some explanatory power for individual voting behavior, few studies to date simultaneously examine the effects of rationality (cognition) and emotion (affect) on vote choice. As a consequence, researchers’ understanding of the relative effects of rationality and emotion on voting is limited (for an exception, see Cassino and Lodge, 2007).
In this study, we aim to fill that void and to examine the relative effects of rationality and emotion on individual political preferences. Our analysis proceeds as follows. The next section reviews the theories and extant scholarship linking rationality and emotion to vote choice. We also develop a set of hypotheses for empirical testing. We then describe our empirical strategy and present the results of our analyses. The final section summarizes the key findings and discusses implications for the study of voting behavior.
Rationality, emotion, and vote choice
Advocates of rational choice theory assume that individuals are rational, self-interested utility-maximizers whose preferences result from expected utility calculations. Individuals compare the costs and benefits of different actions, favoring outcomes that provide higher utility. Rational choice theory has frequently been employed to explain voting behavior (Aldrich, 1993; Ferejohn and Fiorina, 1974; Feddersen, 2004). One influential model within rational choice theory is the spatial model of voting (Downs, 1957), where voters select candidates whose positions are closest to their own ideological preferences.
Originating from Hotelling’s (1929) foundational work and formalized by Black (1948) and Downs (1957), the median voter theorem of the spatial model makes two key assumptions: voters can place election alternatives on a one-dimensional political spectrum, and they possess single-peaked preferences, choosing alternatives nearest their ideal points. Thus, the theorem predicts voters prefer candidates whose policy positions closely match their own and incentivizes voters to express their true preferences.
Downs (1957) further conceptualizes voting as a comparison of expected utilities between competing parties. Specifically, voters evaluate the expected utility of each party, voting for the one providing greater anticipated benefits. This comparison, known as the “party differential,” suggests voters select party A if the differential is positive, party B if negative, and abstain if neutral, thus avoiding voting costs. Although scholars have expanded the spatial voting model to multiple dimensions using Euclidean utility functions (Enelow and Hinich, 1984; Hinich and Pollard, 1981), this study focuses specifically on two-candidate competitions.
Despite the explanatory power of rational choice theory, political psychology emphasizes the significant role emotions play in shaping political decisions (Abelson et al., 1982; Groenendyk, 2011; Brader, 2006; Marcus et al., 2000). Scholars debate whether emotions are best conceptualized as discrete entities or along a continuous positive-to-negative dimension (Neuman et al., 2007). Marcus et al.’ (2000) theory of affective intelligence (AI) proposes that emotions guide citizens’ attention to political events via two emotional systems: a dispositional system associated with enthusiasm, which reinforces habitual behaviors, and a surveillance system associated with anxiety, prompting individuals to pay closer attention and seek additional information. Research grounded in AI theory consistently demonstrates that anxiety often has a stronger impact than enthusiasm on voter behavior, prompting anxious individuals to gather new information and reconsider their habitual choices (Marcus et al., 2000, 2011). Enthusiasm reinforces candidate preferences and motivates campaign participation, whereas anxiety encourages individuals to engage in deeper cognitive processing, moving away from routine voting patterns (Marcus and MacKuen, 1993; Marcus, 1988; Garry, 2014).
Recent scholarship underscores the growing significance of affective polarization in U. S. politics, highlighting intense negative emotions partisans hold toward opposing parties and their supporters (Iyengar et al., 2019; Mason, 2018; Druckman and Levendusky, 2019). This polarization amplifies emotional reactions to political campaigns, increasing voter engagement primarily through negative emotions. Negative campaigning leverages affective polarization by intentionally eliciting anxiety, anger, and fear to mobilize voters, prompting them to reconsider their choices and pay greater attention to campaign information (Ansolabehere and Iyengar, 1995; Lau and Pomper, 2004; Brader, 2006; Valentino et al., 2011). For example, Galasso et al. (2023, p. 5) observe that during the 2016 U. S. Presidential campaign, negative ads comprised over 55% of televised advertisements, indicating increased reliance on emotional appeals. Additionally, personality traits have emerged as influential factors in affective polarization. Luttig (2018) demonstrates that individuals with prejudiced personalities, marked by a high need for closure, exhibit stronger partisan identities and greater affective polarization. Tilley and Hobolt (2025) similarly find narcissism, characterized by entitled self-importance, significantly correlated with affective polarization.
While prior research typically emphasizes discrete emotions, recent scholarship suggests emotional responses toward political candidates can effectively be summarized through general positive or negative affect (Watson and Tellegen, 1985; Neuman et al., 2007). This study employs Wang’s (2013) concept of the “emotion differential,” measuring voters’ net positive emotional responses toward competing candidates. According to Wang, voters prefer the candidate evoking stronger favorable emotions.
Although rational choice and emotional theories each independently offer significant explanatory insights, few studies simultaneously evaluate their relative influence on voting decisions (Kim et al., 2010; Redlawsk and Lau, 2013). Current debates on “affective primacy” suggest emotional reactions often precede and influence rational evaluations, substantially shaping political preferences and behaviors (Cassino and Lodge, 2007; Lodge and Taber, 2013). By jointly examining rational and emotional factors, including affective polarization and negative campaigning, this study aims to clarify their respective impacts, providing systematic evidence of how emotional versus rational considerations shape voter behavior.
Theoretical model and hypotheses
In light of the theoretical discussion above, we argue that vote choice is a function of both affect and rationality. In other words, rational evaluation of competing parties’ or candidates’ policies and emotional reactions to competing parties or candidates play a critical role in influencing individual voting decisions. To simplify our theoretical framework and empirical analysis, we focus on electoral competition in a two-party (or two-candidate) system. Therefore, vote choice is a dichotomous decision, and accordingly, the applied statistical concept is discrete choice. Since a voter counts on rationality and emotion to determine her vote choice, the baseline model of vote choice can be presented as the following Equation 1:
Where u(v) is the utility of vote choice, R is the voter’s rational preference for one choice over the other, and E is the voter’s emotional preference for one vote choice over the other. Furthermore, R can be understood in terms of the “party differential” in the terminology of Downs (1957). In other words, each voter would compare her expected utility of having party A in government with the expected utility of having party B in government, and this utility differential will determine each voter’s choice in the voting booth. To estimate the R term, we use the idea of the party differential (i.e., Pd) developed by Downs (1957). On the other hand, to gauge the E term, we use the concept of the emotion differential (i.e., Ed) developed by Wang (2013). Specifically, the emotion differential denotes the difference in a voter’s positive emotions toward competing candidates. Therefore, the utility function for this study can be rewritten as follows:
Then we assume that the true value of the party differential is a linear function of its observed value, . That is, let and specifically, , where is voter i’s ideal point over policy, is party A’s policy positon, and is party B’s policy positon. Furthermore, can be any real number. Specifically, if , it means that party A’s policy position is closer to voter i compared to that of party B and thus voter i will vote for party A. Logically, if , voter i will vote for party B. By the same token, we also assume that the true value of the emotion differential is a linear function of its observed value, . That is, and specifically, , where is voter i’s positive emotion toward the candidate of party A and is voter i’s positive emotion toward the candidate of party B. Likewise, can be any real number. If , it represents that voter i has more favorable emotion toward the candidate of party A than the candidate of party B, and thus she will vote for the candidate of party A. By contrast, if , voter i will vote for the candidate of party B. Theoretically, if and , voter i will choose to abstain in order to save the costs of voting because both parties make no difference to her and she emotionally does not lean to either candidate. Consequently, we rewrite the utility function (i.e., Equation 2) as the following Equation 3:
Where is equal to the sum of and .
Voters rely on the utility function mentioned above [i.e., u(v) = R + E] to determine their vote choices. Specifically, if u(v) = R + E > 0, a voter will vote for the candidate of party A; by contrast, if u(v) = R + E < 0, a voter will vote for the candidate of party B. We assume that R and E are, respectively, conditioned on the observed values of the party differential (i.e., ) and the emotion differential (i.e., ) and set if voter i chooses to cast a ballot for the candidate of party A and 0 for the candidate of party B. Since we assume that the party differential and the emotion differential are normally distributed, we take the standard normal cumulative distribution function, Φ, to denote the probability of vote choice.1 Therefore, the probability that an individual i votes for the candidate of party A can be presented as:
Equation 4 is simply a conventional probit regression setup. Accordingly, we estimate vote choice models that take both the party and emotion differentials into account. Since vote choice is assumed as a dichotomous decision, we use binary probit models to estimate the effects of the party differential and the emotion differential on vote choice as the following Equation 5:
Where is the constant, and and are the coefficients of interest for this study.2 Our empirical tests focus on the five, most recent presidential elections in the United States (2000, 2004, 2008, 2012, and 2016). Since George W. Bush and Barack Obama, respectively, won two presidential elections during the period between 2000 and 2012, and Donald Trump won the 2016 presidential election, we specifically test the following two hypotheses:
H1 (party differential hypothesis): The party differential is positively associated with the probability of voting for Bush in the 2000 and 2004 presidential elections, Obama in the 2008 and 2012 presidential elections, and Trump in the 2016 presidential election.
H2 (emotion differential hypothesis): The emotion differential is positively associated with the probability of voting for Bush in the 2000 and 2004 presidential elections, Obama in the 2008 and 2012 presidential elections, and Trump in the 2016 presidential election.
H3 (affective primacy hypothesis): As we note above, we expect that vote choice will be a function of both rational as well as emotional considerations. The relative effects of these factors remain an open question however. While rational choice theories would generally expect virtually no impact for emotional dispositions (Downs, 1957), theories of affective primacy would post a stronger role for emotions, relative to rational, cognitive considerations, in vote choice (Cassino and Lodge, 2007; Lodge and Taber, 2013). A central goal of the current study is to adjudicate between these claims by evaluating the affective primacy hypothesis empirically to determine whether one class of considerations exerts a greater influence compared to the other.
Data, measurement, and model specification
To test the hypotheses developed above, we use the data from American National Election Studies (ANES).3 We restrict our analyses to the five United States presidential elections held between 2000 and 2016.4 These election cycles comprise three open-seat contests and two incumbent re-election bids, providing an opportunity to investigate whether the effects of party differential and emotion differential on individual vote choices differ when an incumbent president is seeking re-election.5
The dependent variable is individual, major-party vote choice in the 2000, 2004, 2008, 2012, and 2016 presidential elections. Given that George W. Bush won the 2000 and 2004 presidential elections, Barack Obama won the 2008 and 2012 races, and Donald Trump won the 2016 presidential election, we code respondents who voted for Bush as 1 and 0 for those who voted for the Democratic candidates (i.e., Al Gore and John Kerry) in 2000 and 2004, whereas respondents are coded as 1 if they voted for Trump and as 0 for voting for Hillary Clinton in 2016; by contrast, we code the respondents who voted for Obama as 1 and 0 for those who voted for the Republican candidates (i.e., John McCain and Mitt Romney) in 2008 and 2012.6
With regard to our key independent variables, the party differential is used to reflect the rational dimension of vote choice, whereas the emotion differential is used as a proxy for the affective dimensions of vote choice. To measure the party differential, we follow Downs’s advice that ideology provides a shortcut for understanding the party’s position on policy issues. In other words, voters are able to use the ideological positions of parties to approximate their policy positions and calculate the expected utility when different parties are in office. Therefore, to gauge the party differential, we first calculate the absolute difference in ideological positions between the respondent and the Republican Party and between the respondent and the Democratic Party on a seven-point scale, respectively. Then we calculate the difference of both values. Furthermore, we use two different types of calculations to ensure a positive relationship between the party differential and vote choice in these five presidential elections. Specifically, our calculation of the party differentials are, respectively, presented as follows:7
For 2000, 2004 and 2016: Party differential
For 2008 and 2012: Party differential
Where is voter i’s ideological position; is voter i’s perception about the ideological position of the Republican Party; and is voter i’s perception about the ideological position of the Democratic Party. If the party differential is >0, an individual is more likely to vote for Bush in 2000 and 2004, Obama in 2008 and 2012, or Trump in 2016. By contrast, if the party differential is <0, an individual is more likely to vote for their opponents. The value of the party differential ranges from −6 to 6.
We acknowledge that alternative conceptualizations of party differential are conceivable and potentially superior. Respondents’ ideal positions on specific policy items relative to perceptions about the candidates’ positions on these issues may capture party differential more effectively, for instance. Regrettably, such measures are not available in the ANES, but we contend that our operationalization provides a reliable approximation. We note, for example, that ideological self-placements are generally correlated with issue positions as well as partisan identification, and that this relationship appears to be strengthening over time (Jacobson and Carson, 2015). We interpret these findings to suggest that our measure of party differential relying on ideological placements is valid and appropriate.
For the emotion differential, we adopt the measure developed by Wang (2013); the only difference is that we do not take the absolute difference of the respondent’s positive feelings toward two presidential candidates. Specifically, we recode respondents’ answers about four (two positive, and two negative) discrete emotions (i.e., angry, hopeful, afraid, and proud) toward a specific presidential candidate to range, respectively, from 0 to 4; higher values signify more positive feelings. It is noted that the ANES 2016 adds one more item related to negative emotion asking whether the respondents feel disgusted about the presidential candidates of Republican and Democratic parties. Thus, we use five discrete emotions for ANES 2016. Then we aggregate respondents’ emotions toward each presidential candidate to create a composite measure of emotional disposition to each candidate ranging from 0 to 16 for ANES 2000 through 2012 and from 0 to 20 for ANES 2016, respectively.8 Finally, we calculate the difference between both values. Likewise, we use two different types of calculations to ensure a positive relationship between the emotion differential and vote choice in these five presidential elections. Specifically, our measures of the emotion differential are, respectively, represented as follows:
For 2000, 2004 and 2016: Emotion differential =
For 2008 and 2012: Emotion differential =
Where is the respondent’s positive affect toward the Republican presidential candidate and is the respondent’s positive emotion toward the Democratic presidential candidate. We argue that, if the emotion differential is >0, an individual is more likely to cast a ballot for Bush in 2000 and 2004, Obama in 2008 and 2012, or Trump in 2016. Conversely, if the emotion differential is <0, an individual is more likely to vote for their opponents. The value of the emotion differential ranges from −16 to 16 for ANES 2000 through ANES 2012 and from −20 to 20 for ANES 2016.9
We estimate models that also control for a range of other factors which the literature has determined are related to vote choice including: presidential approval (Campbell et al., 2010), feeling thermometers, evaluations of the national economy (Kramer, 1971; Lewis-Beck, 1990; Duch and Stevenson, 2008), party identification (Bartels, 2000; Campbell et al., 1960; Green et al., 2002), and demographic factors (i.e., education, income, race, gender, and age) (Campbell et al., 1960; Lewis-Beck et al., 2008) as available in the ANES. Presidential approval ranges from 0 to 3, with higher values denoting a greater approval. Feeling thermometer scales range from a minimum rating of 0 (strongly negative) to a maximum of 100 (strongly positive feeling). For parsimony and to avoid multicollinearity, we control for individuals’ ratings of Bush in 2000 and 2004, Obama in 2008 and 2012, and Trump in 2016 because people who express positive feelings toward Bush, Obama, or Trump tend to have negative feelings toward their opponents.10 We expect thermometer ratings to exert positive effects on vote choice, respectively.11 Respondents’ assessments of U. S. economic conditions range from 0 to 4 (higher values indicate more positive evaluations). The ANES probes respondents’ party identifications using a seven-point scale; we recode the scale to range from strong Democrat to strong Republican in 2000, 2004 and 2016, and from strong Republican to strong Democrat in 2008 and 2012 in order to ensure a positive relationship between partisanship and vote choice. We measure education dichotomously (bachelor’s degree or above equals 1, 0 otherwise); income levels and age continuously (higher values indicate higher incomes or age respectively) and race (the reference group is whites) and gender using dummy variables for relevant groups. Table 1 presents descriptive statistics for the variables used in this study.
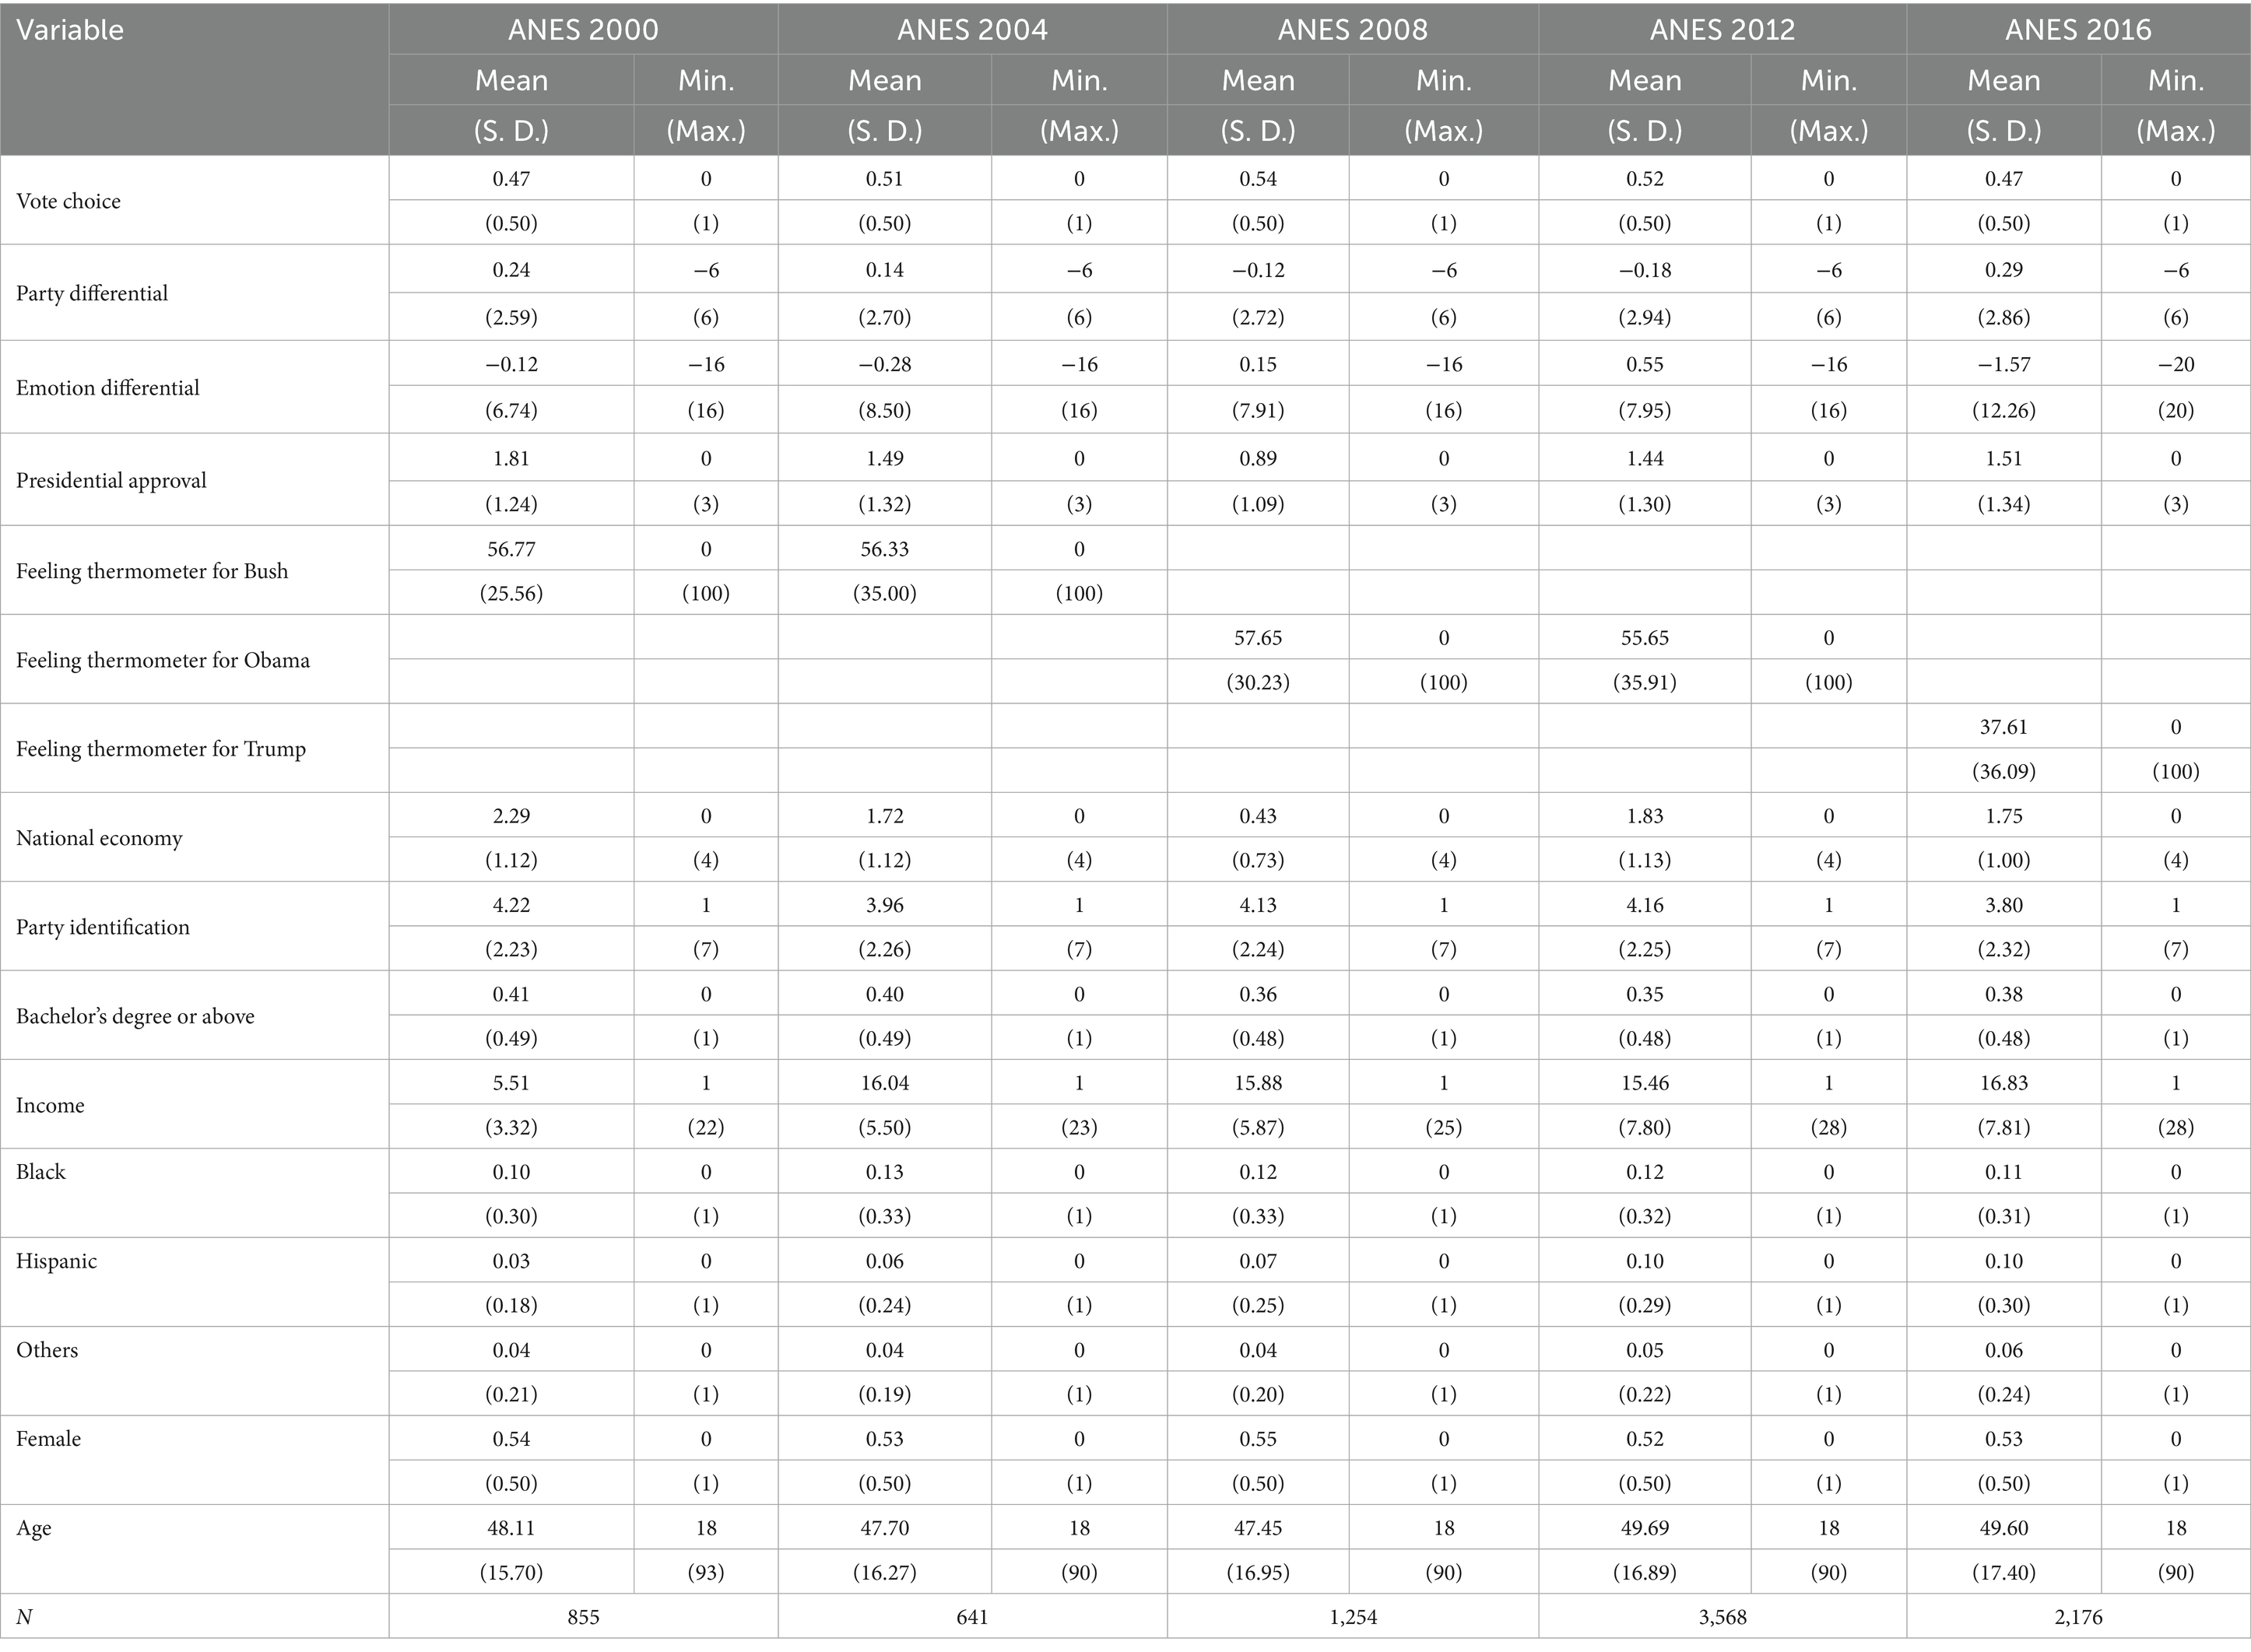
Table 1. Descriptive statistics of variables.
To estimate the effects of the party differential and the emotion differential on individual voting decisions, we conduct binary probit analysis using the following equation:12
Results
We investigate effects of both party and emotion differentials on vote choice using two analytic approaches: First we estimate a pooled model that includes year fixed effects to assess the overall relationships between the party and emotion differentials and vote choice; we also estimate individual models for each presidential election to examine whether the effects of each differential on vote choice vary by cycle. As seen in the first column of Table 2, the results from the pooled model show that both the party differential and the emotion differential exert significant positive effects on vote choice, as expected.13 That is, the citizens who perceive the Democratic Party’s ideological position as closer to theirs compared to the Republican Party and emotionally prefer the Democratic candidate over the Republican candidate are more likely to vote for the Democratic candidate. Specifically, on average, a one standard deviation increase in the party differential leads to a 3.1% increase in the probability of voting for the Democratic candidate, whereas a one standard deviation increase in the emotion differential contributes to a 9.2% increase in the probability of voting for the Democratic candidate (see Table 3). The substantive effect of the emotional differential is almost three times that of the party differential. Moreover, the difference in the average marginal effect between the impact of the party differential and the emotion differential is statistically significant at the p < 0.001 level, implying that emotion exerts greater influence on vote choice compared to rationality.
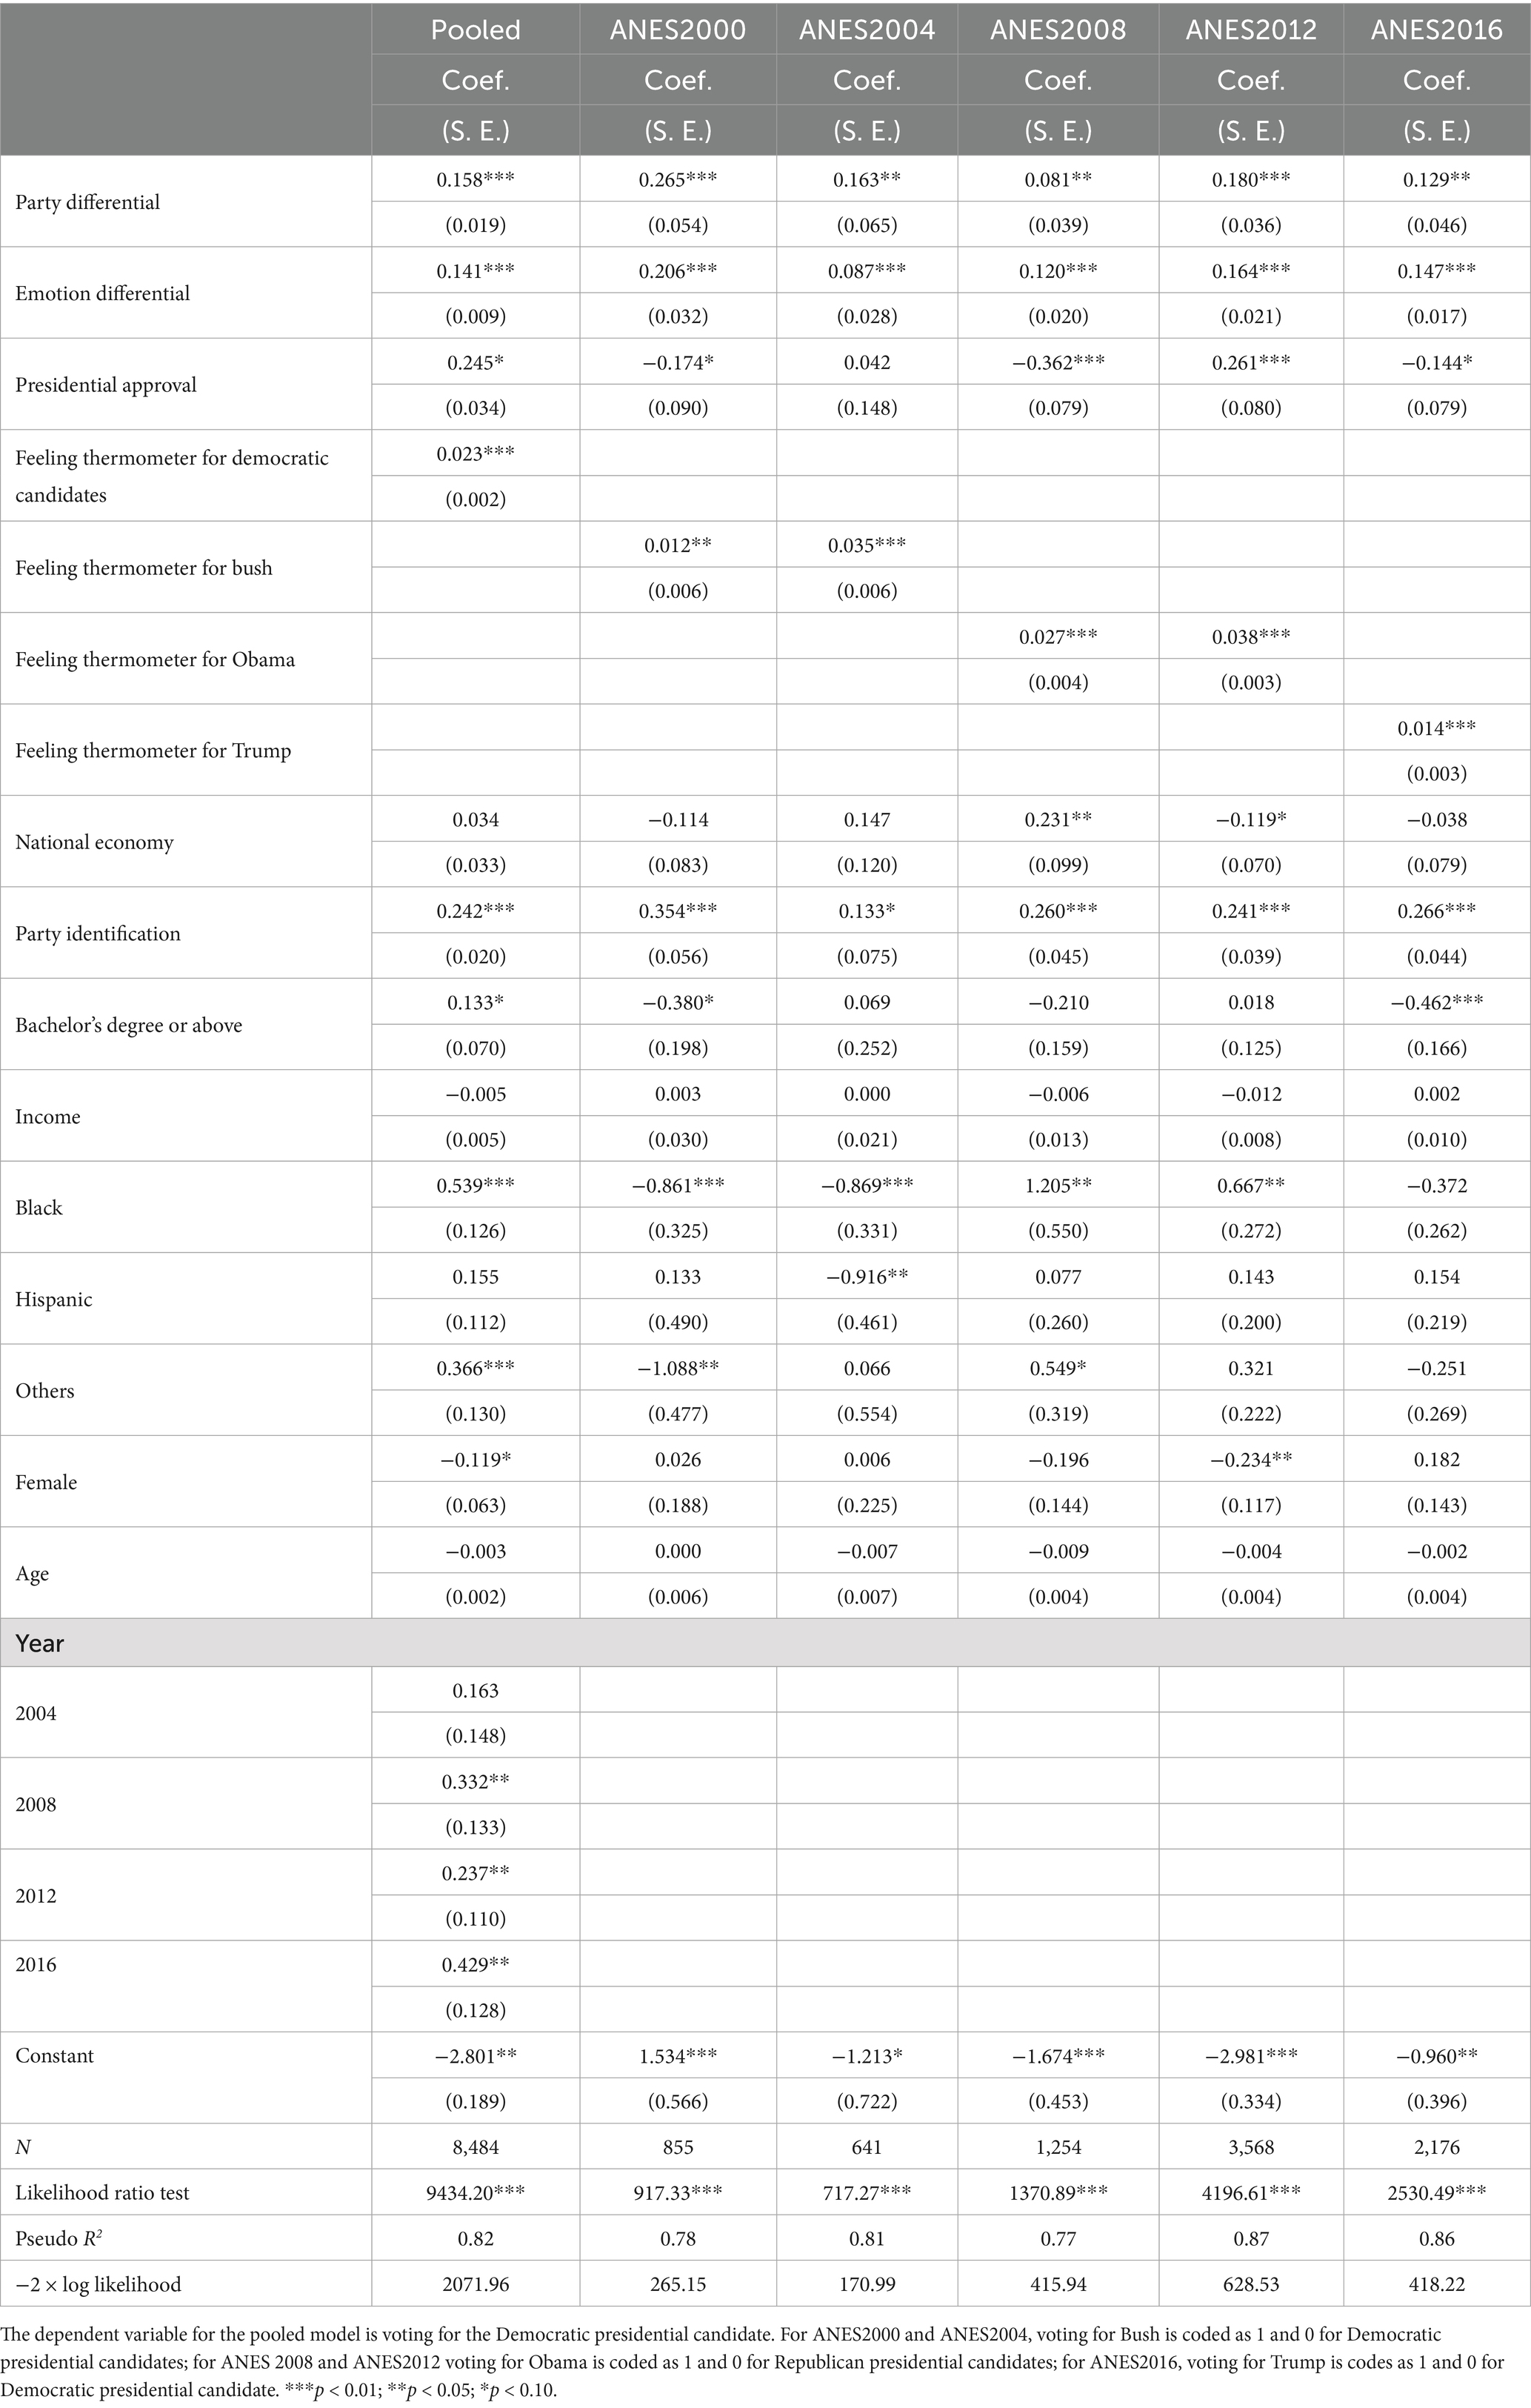
Table 2. Binary probit analysis of vote choice.

Table 3. Average marginal effects of explanatory variables on vote choice.
Next, we look more closely into the relationships between the party and emotion differentials and vote choice. As shown in Table 2, the party differential consistently exerts significant, positive effects on vote choice in each cycle we examine. In other words, people who perceive the ideological position of the Republican Party to be closer to them than that of the Democratic Party are more likely to vote for Bush in the 2000 and 2004 presidential elections and Trump in the 2016 presidential election. By contrast, those who perceive the ideological position of the Democratic Party to be closer to them than that of the Republican Party are more likely to cast ballots for Obama in the 2008 and 2012 presidential elections. The results also show that the emotion differential consistently exerts significant, positive effects on vote choice in these elections. That is, people who have a more favorable emotional disposition for Bush over Gore or Kerry are more likely to vote for Bush in the 2000 and 2004 presidential elections, whereas those who hold a more favorable emotion for Trump over Clinton are inclined to vote for Trump in the 2016 presidential election. By contrast, those who emotionally prefer Obama to McCain or Romney tend to cast ballots for Obama in the 2008 and 2012 presidential elections.
We further calculate predicted probabilities of vote choice by standardizing both party differential and emotion differential, allowing for a direct comparison of their substantive effects. Figure 1 shows that the effect of the party differential on vote choice may have decreased over time. There is greater variation in the influence of the party differential on vote choice in the 2000 presidential election; this diminishes over time, however.14 The first row of Table 3 suggests that the average marginal effect of the party differential on vote choice has decreased over the past five presidential elections. Specifically, on average, a one standard deviation increase in the party differential is associated with a 6.1% increase in voting in the 2000 presidential election, but a one standard deviation increase in the party differential only leads to a 2.1% increase in voting in the 2016 presidential election, holding all other explanatory variables constant.
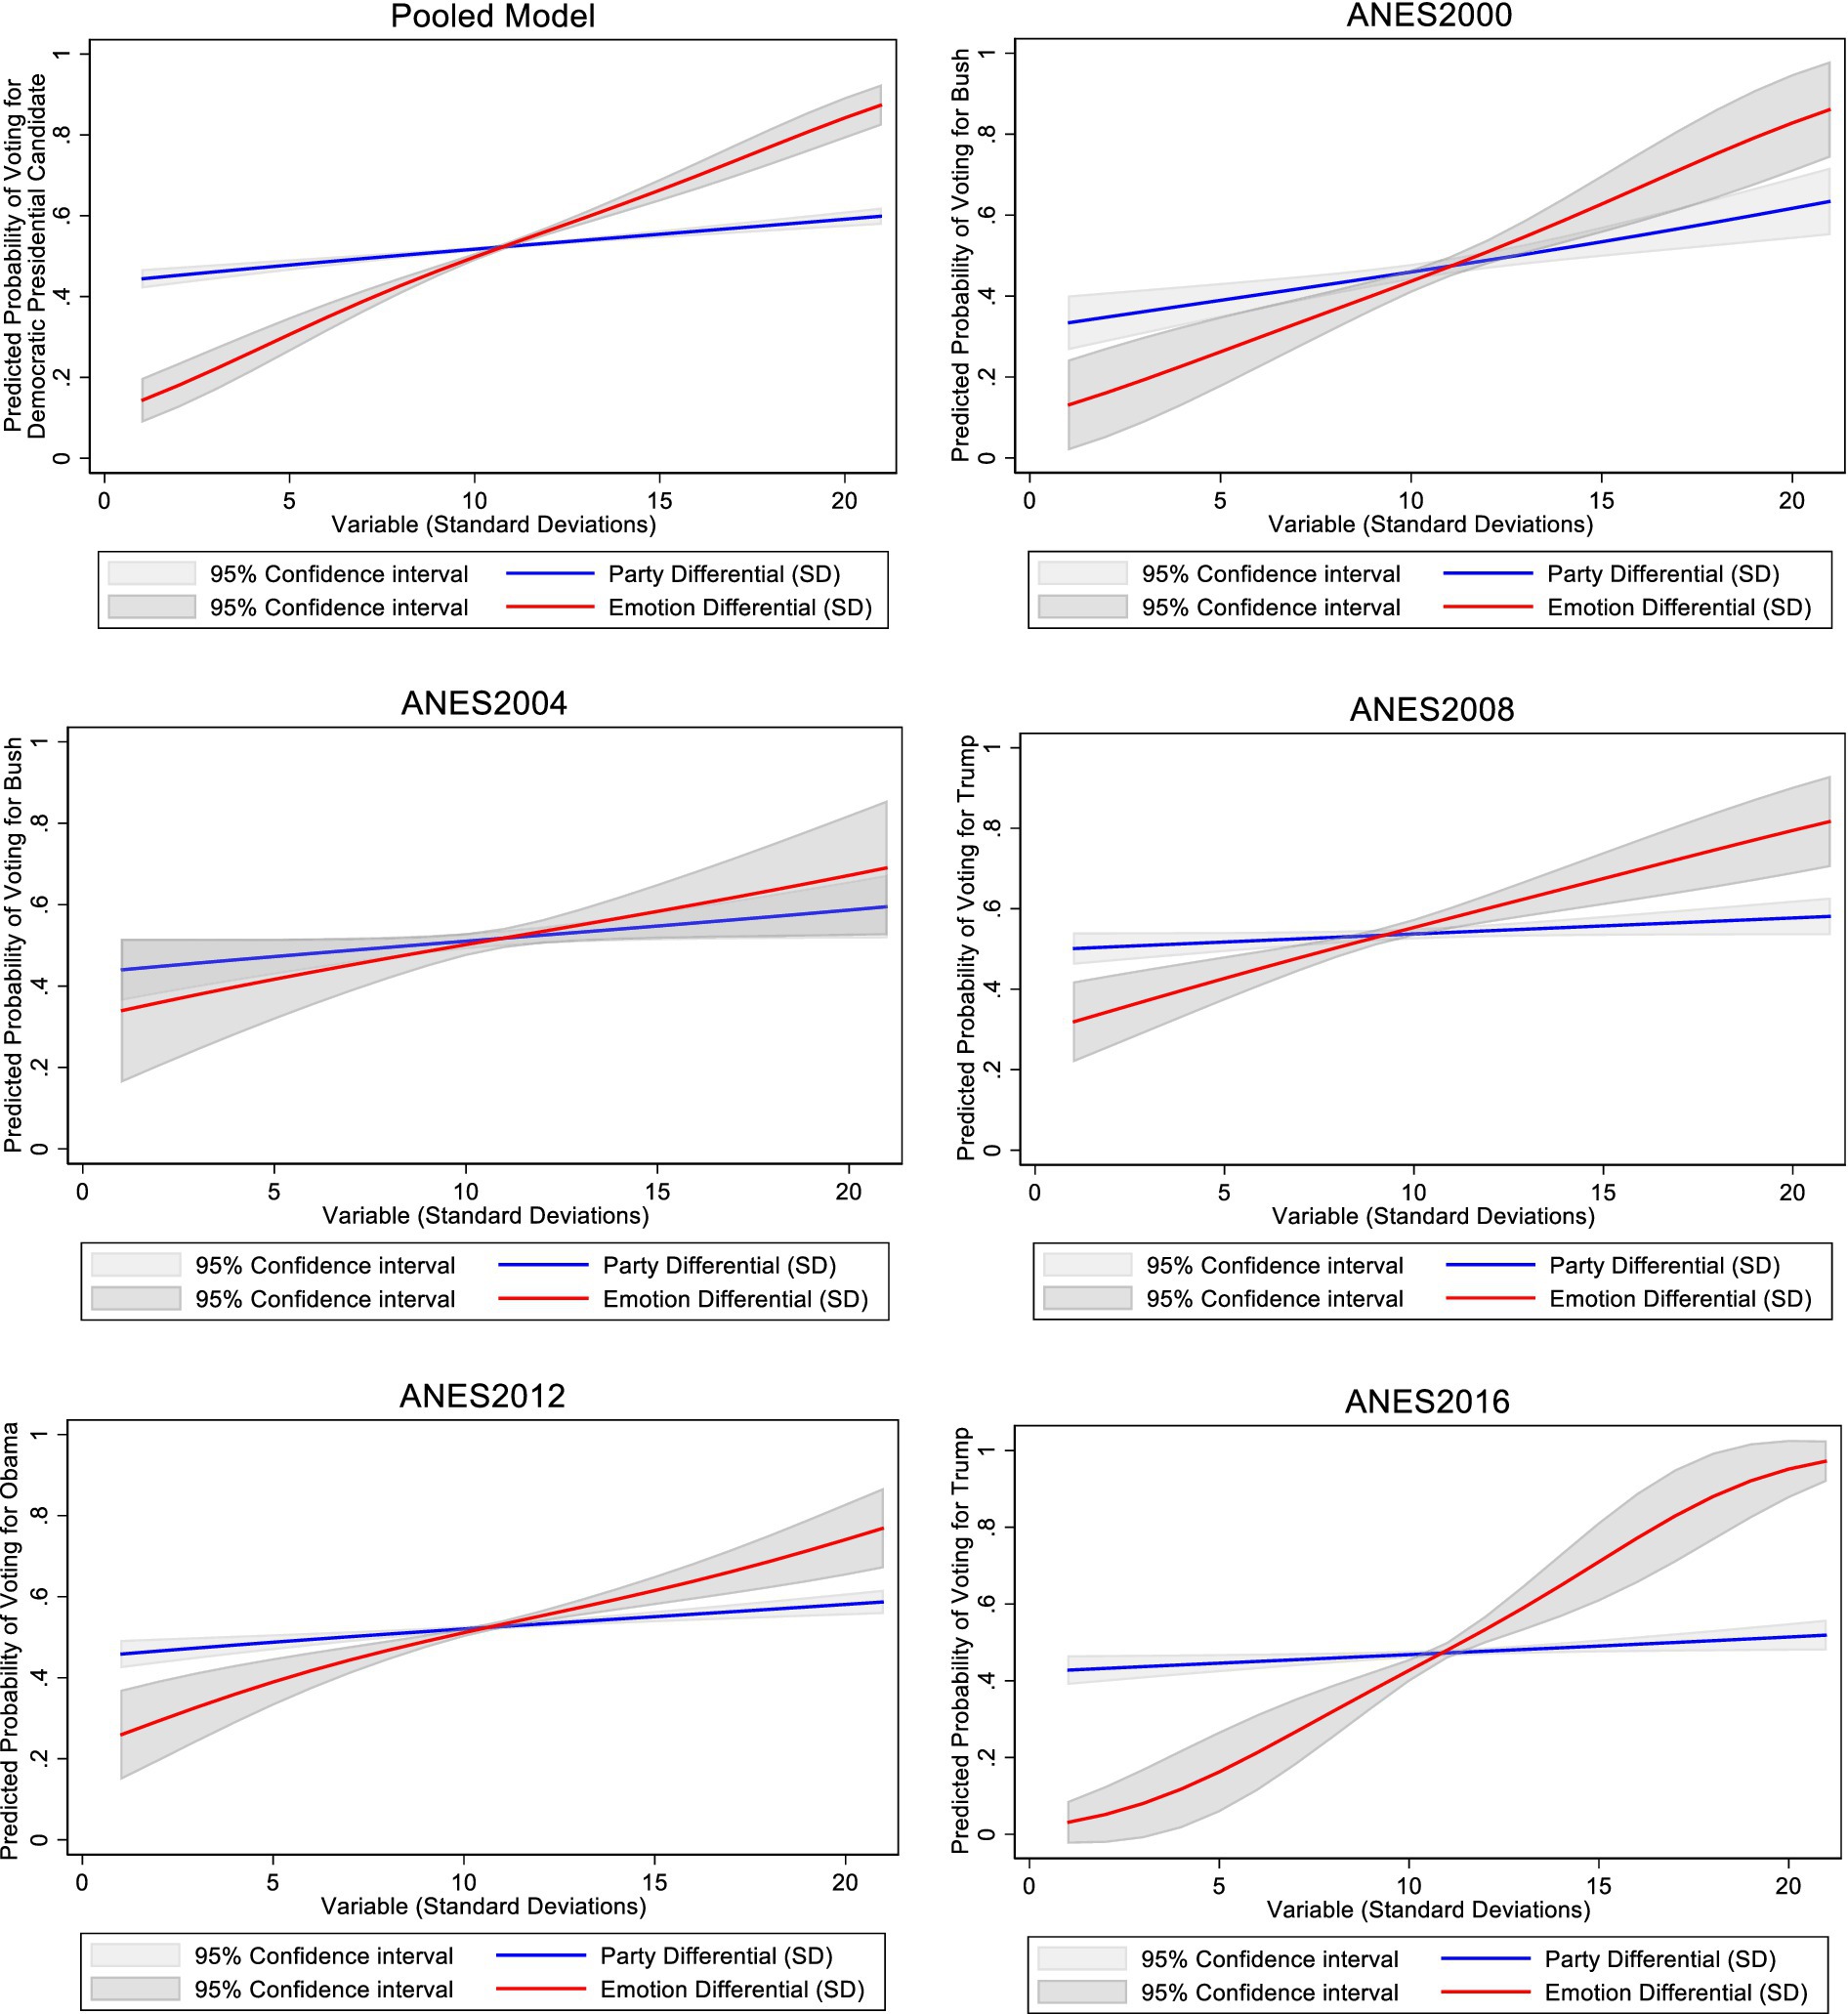
Figure 1. Predicted probability of vote choice as party and emotion differentials varies by year.
With regard to the emotion differential, Figure 1 shows that the differences in vote choice between people with the lowest level of the emotion differential and those with the highest level are, respectively, 73.1% in the 2000 presidential election, 35.1% in the 2004 presidential election, 49.9% in the 2008 presidential election, 51.1% in the 2012 presidential election, and 94.2% in the 2016 presidential election, holding all other explanatory variables constant. Moreover, Table 3 indicates that as the emotional differential grew by one standard deviation, the probability of voting for the incumbent candidate increased by 5.8% in the 2004 presidential election and 6.8% in the 2012 presidential election, on average. By contrast, the emotional differential exerts a larger impact when there is an open-seat presidential election. Specifically, an increase of one standard deviation in the emotional differential increased the probability of voting for the incumbent only by 13.5% in 2000, 8.6% in 2008, and 12.1% in 2016. Thus, it seems that voters tend to be more emotionally driven when confronted with open-seat elections.
Comparing the effects of the party to the emotion differentials directly, the results imply the emotion differential exerts stronger effects on vote choice compared to the party differential. Figure 1 clearly illustrates that emotion differential exerts a larger impact on vote choice compared to party differential, as indicated by its steeper slope. This steeper slope suggests that changes in emotion differential correspond to more substantial shifts in the predicted probability of voting for a candidate, underscoring the stronger substantive influence of emotional considerations relative to party differential. Furthermore, the evidence presented in Table 3 demonstrates that the average marginal effect of the emotion differential exceeds that of the party differential in every election cycle. In particular, the substantive effect of the emotional differential is generally more than twice that of the party differential, except in the 2004 presidential election. In these cycles, the differences in the average marginal effect between the impact of the party differential and the emotion differential are statistically significant at the p < 0.01 level or better. Consistent with our expectations, these findings imply that voting is both a rational and an emotional decision, but our results suggest that emotion plays a more important role in vote choice than rationality. Accordingly, we find strong support for the affective primacy hypothesis, or the contention that affective considerations exert stronger influence than rational considerations in the application we examined, consistent with extant work by Cassino and Lodge (2007).15
We also explore whether taking voters’ emotional dispositions into account in our empirical models improves model fit. We estimate a series of additional models to conduct analyses along these lines. For each election cycle we examine, as well as for our pooled analysis, we estimate models that include (1) only the party differential with controls; (2) only the emotion differential with controls; and (3) both the party and emotion differentials with controls as presented in Table 2. To examine goodness of fit, we compare the widely used AIC and BIC model selection criteria to compare the various models. Lower values of AIC and BIC indicate a better fit. In the interest of brevity, we focus on the pooled models. The values of AIC and BIC are 2439.66 and 2559.44, respectively, for the party differential-only model, 2180.07 and 2299.86 for the emotion differential-only model, and 2107.96 and 2234.79 for the model that includes both the party and the emotion differentials. The results reveal that including both the party and emotion differentials results in the lowest AIC and BIC values, implying a better fit. This is consistent with the central theoretical claim we advance in this study—that voting decisions are both rational and emotional. We also note that the pattern holds in each of the individual cycles we examine, with the exception of the value of the BIC in 2004. Interestingly, in every case, the emotion differential-only models outperform the party-differential-only models in terms of fit, but, as we discuss above, we do not believe models that exclude one class of considerations, or the other, are optimal. We interpret these results to support our claim that integrating affective (emotional) as well as cognitive (rational) factors in models seeking to explain vote choice will yield superior fit and model specification. Analyses that exclude affective considerations, as many rational choice models do, risk underspecification.
In one final set of analyses, we consider the possibility that cognitive and affective considerations interact to influence voting decisions, as an extension of arguments put forth by Marcus et al. (2000) suggest (see also Cassino and Lodge, 2007). To investigate this hypothesis, we estimate a series of parallel models that incorporate an interaction term for the party and emotion differentials. The preponderance of the evidence indicates that a significant interaction does not materialize, except in the 2016 election. Subsequent studies could potentially investigate whether there exist certain contexts in which a significant interaction emerges, but we interpret the findings to suggest that affect does not generally appear to moderate rationality (or vice-versa) when it comes to voting decisions in elections. Accordingly, we conclude that the party differential and the emotion differential exert independent, direct effects on voting behavior that do not depend on each other.16
Conclusion
Consistent with prior research, we confirm that voters take competing parties’ ideological or policy positions into consideration to make their voting decisions. However, individuals’ emotional responses to competing candidates also play an important role in voter decision-making. Our findings clearly demonstrate that when a voter emotionally prefers the Republican presidential candidate to the Democratic presidential candidate, she would be more likely to vote for the former and vice versa. As a result, we conclude that individual voting decision is a function of both rationality and affect.
Our analyses also reveal that the effects of each, broad class of considerations, rational and affective, are not equal. Specifically, affective considerations exert a relatively stronger impact on vote choice compared to rational considerations. We interpret this finding to suggest that voters are more responsive to how candidates make them feel rather than to rational considerations related to policy or ideological congruence with parties, especially in open-seat elections. Given the degree to which rational choice models dominate scholarly explanations of vote choice, our results imply greater attention to the emotional underpinnings of voting decisions is warranted. Models that exclude or otherwise minimize the influence of emotional considerations on vote choice are, in our view, incomplete or underspecified.
The findings we report in the current study are consistent with the emerging consensus that affective orientations influence voting in elections (Marcus et al., 2000; Brader et al., 2011), perhaps more so than rational considerations. In the main, we concur with Marcus et al. (2000, p. 140) who view emotional processes as “essentially complementary” to rational choice with respect to political judgment. As Redlawsk (2002, p. 1041) puts it, affect counts. Our results remain robust across a series of specifications and the inclusion of various controls in the models we estimate. Nevertheless, we acknowledge several limitations. First, our study focuses on the direct and relative effects of rational and affective considerations on vote choice. Scholars have asserted that emotions can, and often do, also exert indirect effects (Lodge and Taber, 2013; Marcus et al., 2000; Redlawsk, 2002). Although we find little evidence that affective orientations condition the effects of rational considerations, we do not contest these claims in theory. On the contrary, we accept that emotions, and perhaps especially discrete emotions like anxiety or enthusiasm, likely influence political judgments and decision-making indirectly by galvanizing citizens’ attention, information seeking and information processing (Marcus et al., 2000; Redlawsk, 2002). Generally speaking, we do not believe these arguments are in tension with the claims or evidence we present in the current study, but we also believe greater attention to the nuances and additional scholarly inquiry along can be productive. Our main goal in the current study, however, was to assess the direct effects of emotion on voting, and to compare these to rational calculations, and we developed our models accordingly. We also recognize that subsequent research can deploy alternative operationalizations or refined measures of the differentials we used in the current study. We suspect there is much still to learn about the role of feelings and emotions in political choice.
Data availability statement
Publicly available datasets were analyzed in this study. This data can be found at: American National Election Studies www.anes.org.
Ethics statement
The studies involving humans were approved by University of Michigan IRB American National Elections Studies. The studies were conducted in accordance with the local legislation and institutional requirements. The participants provided their written informed consent to participate in this study.
Author contributions
CP: Conceptualization, Formal analysis, Investigation, Methodology, Project administration, Resources, Supervision, Validation, Visualization, Writing – original draft, Writing – review & editing. C-HW: Conceptualization, Data curation, Formal analysis, Investigation, Methodology, Project administration, Resources, Supervision, Validation, Visualization, Writing – original draft, Writing – review & editing.
Funding
The author(s) declare that financial support was received for the research and/or publication of this article. This study was financially supported by the National Science and Technology Council (NSTC 112-2628-H-006-005-SS2), National Cheng Kung University within the framework of the Higher Education Sprout Project funded by the Ministry of Education (MOE), and Yushan Young Fellow Program by the MOE in Taiwan (MOE-113-YSFSL-0005-001-P2).
Conflict of interest
The authors declare that the research was conducted in the absence of any commercial or financial relationships that could be construed as a potential conflict of interest.
Generative AI statement
The authors declare that no Gen AI was used in the creation of this manuscript.
Any alternative text (alt text) provided alongside figures in this article has been generated by Frontiers with the support of artificial intelligence and reasonable efforts have been made to ensure accuracy, including review by the authors wherever possible. If you identify any issues, please contact us.
Publisher’s note
All claims expressed in this article are solely those of the authors and do not necessarily represent those of their affiliated organizations, or those of the publisher, the editors and the reviewers. Any product that may be evaluated in this article, or claim that may be made by its manufacturer, is not guaranteed or endorsed by the publisher.
Supplementary material
The Supplementary material for this article can be found online at: https://www.frontiersin.org/articles/10.3389/fpos.2025.1640408/full#supplementary-material
Footnotes
1. ^Alternatively, we would estimate logit models. The main difference between probit and logit models lies in the assumption about the distribution of the errors. Given the similarities between the two types of models, either model will produce identical substantive conclusions in most applications. In fact, if one multiplies probit estimates by a factor of 1.814, one gets an approximate value of the corresponding logit estimate (Liao, 1994, p. 24–25).
2. ^We recognize that the effects of the party differential and the emotion differential on vote choice can vary by election, so we do not assign weights to each a priori. Furthermore, the coefficients for each differential can reflect the extent to which each factor influences vote choice directly in each election.
3. ^The data used in this study are ANES Time Series Study in 2000, 2004, 2008, 2012, and 2016. For more information about ANES Time Series Study, please refer to the website of ANES, available at: http://www.electionstudies.org/.
4. ^ANES has asked the respondents to express their feelings (i.e., angry, hopeful, afraid, and proud) about Republican and Democratic presidential candidates, and the responses to these questions are all dichotomous before the ANES 1996 Time Series Study. Nevertheless, since the ANES 1996 Time Series Study, the respondent not only answers whether she feels angry, hopeful, afraid, and proud toward presidential candidates, but also expresses how often she has this kind of feeling. Thus, because of the difference in the measurement scale, we exclude the presidential elections before 1996 from analysis. Moreover, we do not include the 1996 presidential election because Clinton ran for reelection in 1996. For the purpose of our study, it is required to include the 1992 presidential election if we want to include the 1996 presidential election. Besides, the ANES 2016 adds one more item asking the respondents to indicate the extent to which they feel disgusted about Republican and Democratic presidential candidates. We use five discrete emotions for the analysis of ANES 2016. As a consequence, we simply focus on the presidential elections between 2000 and 2016.
5. ^We do not include data from ANES 2020 and ANES 2024 in our analyses because these datasets lack comparable survey items required to construct the emotion differential measure used consistently throughout this study.
6. ^Although there were other candidates in these five presidential elections, they simply received <6% of the popular vote in each election. Therefore, we restrict our analyses to major-party voters.
7. ^Some readers may be concerned that many respondents fail to place themselves on the ideology scale, but we find that the nonresponse rate in ideological self-placement is relatively low: 13.9% in ANES 2000, 3.8% in ANES 2004, 4.5% in ANES 2008, 10.4% in ANES 2012, 1.5% in ANES 2016. The nonresponse rates in ideological self-placement are not significantly different from those in other survey questions. Thus, we contend that the measurement of the party differential does not lead to a biased subsample of respondents. As we note above, an alternative approach would be to measure individuals’ positions on multiple policy issues and to compare these with respondent’s perceptions of positions of Democratic and Republican parties on each policy issue, but the ANES does not provide so detailed measurement of policy positions. Thus, we rely on ideology to approximate policy positions.
8. ^Although correlations among different kinds of emotions may be strong, Abelson et al. (1982) demonstrate that good feelings and bad feelings are nearly independent of each other. In addition, we perform Cronbach’s alpha tests to examine whether it is appropriate to combine different discrete emotions toward a specific presidential candidate into a single emotional variable. The results show that the values of Cronbach’s alpha for emotions toward the Democratic and Republican presidential candidates are 0.72 and 0.73 in ANES 2000, 0.73 and 0.87 in ANES 2004, 0.79 and 0.71 in ANES 2008, 0.88 and 0.80 in ANES 2012, and 0.94 and 0.94 in ANES 2016, respectively, indicating high levels of internal consistency. Accordingly, we interpret these results to imply it is appropriate to merge all emotional variables into the emotion differential scale we create.
9. ^We examine the correlation between party differential and emotion differential and find that they are positively correlated with each other. The correlation coefficients (respectively 0.651 in 2000, 0.724 in 2004, 0.635 in 2008, 0.766 in 2012, and 0.787 in 2016) can potentially raise concerns about multicollinearity, but a series of multicollinearity tests we conducted using variation inflation factors (VIF) determined these concerns are unfounded. Specifically, the VIF values for the party differential and the emotion differential are, respectively, 2.27 and 3.15 in 2000, 2.55 and 5.59 in 2004, 2.06 and 4.10 in 2008, 3.19 and 5.70 in 2012, and 2.99 and 7.19 in 2016. All the VIF values are lower than 10, indicating signs of serious multicollinearity requiring correction are not present. Additionally, if either the party differential or the emotion differential is omitted from the model, the results are substantively similar to what we report except that the coefficient for each respective differential increases modestly.
10. ^Our data show that the correlation between feeling thermometer ratings of Bush and Gore is −0.543 in 2000; the correlation between feeling thermometer ratings of Bush and Kerry is −0.708 in 2004; the correlation between feeling thermometer ratings of Obama and McCain is −0.619 in 2008; the correlation between feeling thermometer ratings of Obama and Romney is −0.744 in 2012; and the correlation between feeling thermometer ratings of Trump and Clinton is −0.771 in 2016. The results suggest that when voters feel favorable toward the Republican presidential candidate, they will tend to feel unfavorable toward the Democratic presidential candidate and vice versa. Thus, controlling for the feeling thermometer rating of the elected presidential candidate should be sufficient to capture an individual’s overall feelings toward two competing presidential candidates. We note that the results we report remain robust, and substantively similar, even when we control for the feeling thermometer ratings of the Democratic and Republican presidential candidates or the difference between the two presidential candidates’ feeling thermometer ratings. Details available upon request.
11. ^Some may argue that there is overlap between our measure of the emotion differential and the feeling thermometer, but we view these as conceptually distinct indicators. The feeling thermometer is a rating procedure to measure a general impression of respondents’ feelings about an issue, a group, or a political figure. People might rely on a variety of factors to summarize their feelings about a specific target. In other words, the feeling thermometer captures not only emotional but also other dimensions. Furthermore, prior research has revealed some problems associated with the feeling thermometer measure. For instance, the meanings of the many scale points are not clear and uniformly interpreted by respondents (see Pasek and Krosnick, 2010). By contrast, the emotion differential measure we adopt is constructed based on specific emotional responses that clearly capture individual emotions toward a specific target. We note that our empirical analyses isolate the independent effects of emotion differential even after we control for the more general, feeling thermometer measures.
12. ^It is conceivable that correlations between the party differential, the emotion differential, and the feeling thermometer measures may result in multicollinearity, potentially posing problems for our analyses. We take these concerns seriously. Indeed, we find these measures to be correlated in each election cycle, but we find that the VIF values for all variables in the models are smaller than 10, assuaging concerns about multicollinearity. In particular, the mean VIF values for the pooled model, ANES 2000, ANES 2004, ANES 2008, ANES 2012, and ANES 2016 are 1.96, 1.68, 2.49, 1.86, 2.66, and 2.34, respectively. Thus, we conclude that multicollinearity does not compromise the reliability of the analyses we present.
13. ^We recode vote choice as 1 for voting for Democratic presidential candidates and 0 for voting for Republican presidential candidates.
14. ^All other explanatory variables in the model are set as constant.
15. ^Following a reviewer’s suggestion, we further examine whether the effects of party and emotion differentials on vote choice vary across election years. As reported in Appendix 2, all interaction terms between party differential and election year reach statistical significance, indicating notable variation over time. Specifically, the party differential exerts a stronger influence on vote choice during the 2000 presidential election compared to other election years (see Appendix 3). Conversely, emotion differential interacts significantly with election year only in the 2004 and 2016 elections. Given this limited occurrence, we advise caution in interpreting the variation in the effect of emotion differential across election cycles and thus refrain from emphasizing this temporal variability. Nevertheless, we recognize this is potentially ripe for further inquiry.
16. ^Some may argue that emotional evaluations of presidential candidates are influenced by partisanship, suggesting these measures reflect underlying partisan biases rather than purely affective responses. To address this concern, we explicitly examine the relationship between the emotion differential measure and party identification. Our analysis confirms that party identification indeed significantly affects the emotion differential. Republican affiliation is positively associated with higher scores on emotion differential. We further test whether emotion differential and party identification jointly influence vote choice through an interaction effect. Our findings indicate no statistically significant interaction across most elections, with the sole exception of the 2012 election. Given the lack of consistent evidence for such an interaction effect, we caution against overstating its substantive importance. Additionally, to ensure robustness, we include party identification as a control variable in our primary analyses, and the key relationships involving emotion differential remain substantively unchanged.
References
Abelson, R. P., Kinder, D. R., Peters, M. D., and Fiske, S. T. (1982). Affective and semantic components in political person perception. J. Pers. Soc. Psychol. 42, 619–630. doi: 10.1037/0022-3514.42.4.619
Aldrich, J. H. (1993). Rational choice and turnout. Am. J. Polit. Sci. 37, 246–278. doi: 10.2307/2111531
Ansolabehere, S., and Iyengar, S. (1995). Going negative: How political advertisements shrink and polarize the electorate. New York, NY: Free Press.
Bartels, L. M. (2000). Partisanship and voting behavior, 1952-1996. Am. J. Polit. Sci. 44, 35–50. doi: 10.2307/2669291
Black, D. (1948). On the rationale of group decision-making. J. Polit. Econ. 56, 23–34. doi: 10.1086/256633
Brader, T. (2006). Campaigning for hearts and minds: How emotional appeals in political ads work. Chicago, IL: University of Chicago Press.
Brader, T., Marcus, G. E., and Mille, K. L. (2011). “Emotion and public opinion” in Oxford handbook of American public opinion and the media. eds. G. C. Edwards, L. R. Jacobs, and R. Y. Shapiro (Oxford: Oxford University Press), 384–401.
Campbell, A., Converse, P. E., Miller, W. E., and Stokes, D. E. (1960). The American voter. New York, NY: John Wiley and Sons.
Campbell, J. E., Dettrey, B. J., and Yin, H. (2010). The theory of conditional retrospective voting: does the presidential record matter less in open-seat elections? J. Polit. 72, 1083–1095. doi: 10.1017/S002238161000054X
Cassino, D., and Lodge, M. (2007). “The primacy of affect in political evaluations” in The affect effect: Dynamics of emotion in political thinking and behavior. eds. W. Russell Neuman, G. E. Marcus, M. MacKuen, and A. N. Crigler (Chicago, IL: University of Chicago Press), 101–123.
Druckman, J. N., and Levendusky, M. S. (2019). What do we measure when we measure affective polarization? Public Opin. Q. 83, 114–122. doi: 10.1093/poq/nfz003
Duch, R. M., and Stevenson, R. T. (2008). The economic vote: How political and economic institutions condition election results. New York, NY: Cambridge University Press.
Enelow, J. M., and Hinich, M. J. (1984). The spatial theory of voting: An introduction. New York, NY: Cambridge University Press.
Feddersen, T. J. (2004). Rational choice theory and the paradox of not voting. J. Econ. Perspect. 18, 99–112. doi: 10.1257/089533004773563458
Ferejohn, J. A., and Fiorina, M. P. (1974). The paradox of not voting: a decision theoretic analysis. Am. Polit. Sci. Rev. 68, 525–536. doi: 10.2307/1959502
Galasso, V., Nannicini, T., and Nunnari, S. (2023). Positive spillovers from negative campaigning. Am. J. Polit. Sci. 67, 5–21. doi: 10.1111/ajps.12610
Garry, J. (2014). Emotions and voting in EU referendums. Eur. Union Politics 15, 235–254. doi: 10.1177/1465116513514780
Green, D., Palmquist, B., and Schickler, E. (2002). Partisan hearts and minds: Political parties and the social identities of voters. New Haven, CT: Yale University Press.
Groenendyk, E. (2011). Current emotion research in political science: how emotions help democracy overcome its collection action problem. Emot. Rev. 3, 455–463. doi: 10.1177/1754073911410746
Hinich, M. J., and Pollard, W. (1981). A new approach to the spatial theory of electoral competition. Am. J. Polit. Sci. 25, 323–341. doi: 10.2307/2110856
Iyengar, S., Lelkes, Y., Levendusky, M., Malhotra, N., and Westwood, S. J. (2019). The origins and consequences of affective polarization in the United States. Annu. Rev. Polit. Sci. 22, 129–146. doi: 10.1146/annurev-polisci-051117-073034
Jacobson, G. C., and Carson, J. (2015). The politics of congressional elections. 9th Edn. Lanham, MD: Rowman & Littlefield.
Kim, S.-y., Taber, C. S., and Lodge, M. (2010). A computational model of the citizen as motivated reasoner: modeling the dynamics of the 2000 presidential election. Polit. Behav. 32, 1–28. doi: 10.1007/s11109-009-9099-8
Kramer, G. H. (1971). Short-term fluctuations in U.S. voting behavior, 1896-1964. Am. Polit. Sci. Rev. 65, 131–143. doi: 10.2307/1955049
Ladd, J. M. D., and Lenz, G. S. (2008). Reassessing the role of anxiety in vote choice. Polit. Psychol. 29, 275–296. doi: 10.1111/j.1467-9221.2008.00626.x
Lau, R. R., and Pomper, G. M. (2004). Negative campaigning: An analysis of U.S. senate elections. Lanham, MD: Rowman & Littlefield.
Ledyard, J. O. (1984). The pure theory of large two-candidate elections. Public Choice 44, 7–41. doi: 10.1007/BF00124816
Lewis-Beck, M. (1990). Economics and elections: The Major Western democracies. Ann Arbor, MI: University of Michigan Press.
Lewis-Beck, M. S., Jacoby, W. G., Norpoth, H., and Weisberg, H. F. (2008). The American voter revisited. Ann Arbor, MI: University of Michigan Press.
Liao, T. F. (1994). Interpreting probability models: Logit, Probit, and other generalized linear models. Thousand Oaks, CA: Sage Publications.
Lodge, M., and Taber, C. S. (2013). The rationalizing voter. New York, NY: Cambridge University Press.
Luttig, M. D. (2018). The “prejudiced personality” and the origins of partisan strength, affective polarization, and partisan sorting. Adv. Polit. Psychol. 39, 239–256. doi: 10.1111/pops.12484
Marcus, G. E. (1988). The structure of emotional response: 1984 presidential candidates. Am. Polit. Sci. Rev. 82, 737–761. doi: 10.2307/1962488
Marcus, G. E., and Mackuen, M. B. (1993). Anxiety, enthusiasm, and the vote: the emotional underpinnings of learning and involvement during presidential campaigns. Am. Polit. Sci. Rev. 87, 672–685. doi: 10.2307/2938743
Marcus, G. E., MacKuen, M., and Russell Neuman, W. (2011). Parsimony and complexity: developing and testing theories of affective intelligence. Polit. Psychol. 32, 323–336. doi: 10.1111/j.1467-9221.2010.00806.x
Marcus, G. E., Russell Neuman, W., and Mackuen, M. (2000). Affective intelligence and political judgment. Chicago, IL: University of Chicago Press.
Mason, L. (2018). Uncivil agreement: How politics became our identity. Chicago, IL: University of Chicago Press.
Neuman, W. R., Marcus, G. E., Crigler, A. N., and MacKuen, M. (2007). “Theorizing affect’s effects” in The affect effect: Dynamics of emotion in political thinking and behavior. eds. W. Russell Neuman, G. E. Marcus, M. MacKuen, and A. N. Crigler (Chicago, IL: University of Chicago Press), 1–20.
Pasek, J., and Krosnick, J. A. (2010). Optimizing Survey Questionnaire Design in Political Science: Insights from Psychology. In: Jan E Leighley (ed). The Oxford Handbook of American Elections and Political Behavior. Oxford: Oxford University Press, 27–50.
Redlawsk, D. P. (2002). Hot cognition or cool consideration? Testing the effects of motivated reasoning on political decision making. J. Polit. 64, 1021–1044. doi: 10.1111/1468-2508.00161
Redlawsk, D. P. (2006). Feeling politics: Emotion in political information processing. New York, NY: Palgrave Macmillan.
Redlawsk, D. P., and Lau, R. R. (2013). “Behavoiral Decisoin making” in The Oxford handbook of political psychology. eds. L. Huddy, D. O. Sears, and J. S. Levy. second ed (New York, NY: Oxford University Press), 130–164.
Tilley, J., and Hobolt, S. (2025). Narcissism and affective polarization. Polit. Behav. 47, 599–618. doi: 10.1007/s11109-024-09963-5
Valentino, N. A., Brader, T., Groenendyk, E. W., Gregorowicz, K., and Hutchings, V. L. (2011). Election night’s alright for fighting: the role of emotions in political participation. J. Polit. 73, 156–170. doi: 10.1017/S0022381610000939
Wang, C.-H. (2013). Why do people vote? Rationality or emotion. Int. Polit. Sci. Rev. 34, 483–501. doi: 10.1177/0192512113490365
Watson, D., and Tellegen, A. (1985). Toward a consensual structure of mood. Psychol. Bull. 98, 219–235. doi: 10.1037/0033-2909.98.2.219
Weakliem, D. L., and Heath, A. F. (1994). Rational choice and class voting. Ration. Soc. 6, 243–270. doi: 10.1177/1043463194006002005
Keywords: vote choice, voting behavior, rationality, affect, emotion
Citation: Panagopoulos C and Wang C-H (2025) Rationality, affect, and vote choice. Front. Polit. Sci. 7:1640408. doi: 10.3389/fpos.2025.1640408
Edited by:
Kostas Gemenis, Cyprus University of Technology, CyprusReviewed by:
Aaron Weinschenk, University of Wisconsin–Green Bay, United StatesMarc Debus, University of Mannheim, Germany
Copyright © 2025 Panagopoulos and Wang. This is an open-access article distributed under the terms of the Creative Commons Attribution License (CC BY). The use, distribution or reproduction in other forums is permitted, provided the original author(s) and the copyright owner(s) are credited and that the original publication in this journal is cited, in accordance with accepted academic practice. No use, distribution or reproduction is permitted which does not comply with these terms.
*Correspondence: Ching-Hsing Wang, Y2hpbmdoc2luZ0Bncy5uY2t1LmVkdS50dw==