 Ixandra Achitouv
 David Chavalarias
- 1ISC-PIF - Institut des Systèmes Complexes-Paris Ile-de-France, CNRS, Paris, France
- 2CAMS - Centre d'Analyse et de Mathématique Sociales, Paris, France
Introduction: During the 2022 French presidential election, we collected daily Twitter messages on key topics posted by political candidates and their close networks. Our objective was to investigate how political communities influence one another and how central topics shape the dynamics of online political debate.
Methods: Using a data-driven approach, we analyzed interactions among political parties and applied Convergent Cross Mapping (CCM), a causal inference technique, to move beyond traditional correlation analyses. This allowed us to uncover directional influences among political communities and distinguish genuine causal effects from spurious correlations.
Results: We found that some parties are more likely to initiate changes in activity while others tend to respond, highlighting asymmetric relationships and hidden dynamics within the social media political network. Specific issues, such as health and foreign policy, emerged as catalysts for cross-party influence, particularly during critical phases of the election campaign.
Discussion: Our findings demonstrate that CCM provides a powerful tool for capturing causal dynamics in political discourse. The results offer a novel framework for understanding how influence propagates within online political networks and have practical implications for campaign strategists and media analysts seeking to monitor and respond to shifts in political influence over time.
1 Introduction
The rapid growth of social media platforms has transformed political campaigns, offering candidates tools to communicate, mobilize, and influence voters in real time. Consequently, understanding the dynamics of political interactions on platforms like Twitter-X has become a critical area of study. Prior research has explored social media networks in political contexts, with studies such as Conover et al. (2011); Barberá (2015) analyzing Twitter networks during elections to reveal patterns of polarization, ideological segregation, and influential actors. In Larsson (2017), they analyzed the social media networks of political candidates during the Norwegian elections, revealing complex patterns of homophily and interaction among candidates on Twitter. Similarly, Bossetta (2018) investigated how digital architectures across platforms like Facebook and Twitter influence political campaigning strategies, underscoring the intricate relationship between platform affordances and political communication. Furthermore, studies such as those by Wang et al. (2020) have combined retweet networks with agent-based modeling to explore public discourse and polarization in political contexts, demonstrating how emergent phenomena arise from interactions within social networks.
Recent research has also highlighted the role of algorithmic amplification and automated accounts in shaping political discourse on social media. For instance, Huszár et al. (2022) studied how Twitter's ranking system may amplify political content, while Chen et al. (2021) and Yan et al. (2023) investigated the impact of social bots on political bias and perceptual distortions. Other works, such as Ghosh et al. (2023), developed predictive models of electoral campaigns by combining Twitter data with polling, and Ye et al. (2025) audited political exposure bias during the 2024 US presidential election, focusing on algorithmic amplification mechanisms. While these studies provide valuable insights into platform-level dynamics, algorithmic bias, and electoral forecasting, our approach differs in scope.
In this study, we analyse the social media activity of political candidates and their networks during the French 2022 presidential election, focusing on 11 selected topics, seeking to uncover how influence propagates within the political sphere itself.
Activity is defined as the daily number of tweets each political community has posted. As a result, we have 11 topics times 7 political communities, resulting in 88 time series over a period of 419 days. The interplay between these political communities and topics exhibits properties of a complex system, characterized by interdependent dynamics, emergent patterns of activity, and non-linear temporal evolution. In this article, we characterize the dynamics of the political interactions, using network based approaches, spectral analysis and causal relationships test, offering new insights into the dynamics of political discourse and interaction.
Network-based approaches have been used to uncover hidden relationships, as seen in Bialek et al. (2001); Himelboim et al. (2012), who used centrality metrics to identify key influencers. Furthermore, collective behaviors in time-varying correlation matrix have been studied through spectral analysis, where the largest eigenvalue of correlation matrices signals synchronization or coordination (McGraw and Menzinger, 2007; Weng et al., 2013). Causal inference techniques, have further been employed to explore directional influences between entities, as demonstrated by Su and Xiao (2024).
This paper extends these work investigating the interactions between political communities during the 2022 French presidential election using Twitter data. The article is structured as follows: Sections 2 and 3 present the dataset collection; Section 4 analyzes collective behavior through variations in party activity; Section 5 explores how network-based centrality measures reveal key community x topic nodes within the political landscape; Section 6 examines inter-party influence, focusing on how one community's activity may affect another's tweeting patterns. Finally, Section 7 concludes the study. The data and codes used for this analysis are available on https://github.com/IxandraAchitouv/Dynamical_influence.git.
2 Data collection
The Politoscope is an observatory of the French political twittersphere that has been active between 2016 and 2023 recording political exchanges at the scale of the country (Gaumont et al., 2018).
For doing so, it used the Twitte follow API to get the Twitter activity of about 3700 key political figures and used the Twitter track API to get the tweets mentioning some specific keywords. These keywords have been determined by a text-mining analysis using two types of sources: policy measures reported in campaign programs, written in developed language, and candidate tweets, written in frequently spoken language. Gaumont et al. (2018) have demonstrated that this approach collects between 30 % and 80 % of the tweets related to candidates or selected terms.
The Politoscope computes the core political communities on a daily basis based on the retweet graph of the 15 previous days. A core community captures not only institutional actors (e.g., politicians, party accounts), but also highly active users embedded within political discussions. The method is based on filtering the retweet graph to retain users who have mutually interacted through retweets at least w times over a 14-day window. Specifically, an edge is formed between two users if there are at least three retweets in either direction between them during that period. Moreover, to be included in the core, a user must be connected to at least three other users via such links—i.e., with at least three distinct neighbors for whom the mutual retweet count exceeds the threshold. This dual constraint ensures that the core consists of users who are both active and well embedded within the political conversation, excluding peripheral accounts or one-off interactions. The resulting subgraph represents a densely connected and politically engaged subset of the broader network, suitable for analyzing community structure, discourse dynamics, and influence. Then, communities are then labeled by the political leaders they include and this label is propagated to all the tweets of the accounts of the leaders's community. The precision in attribution of ideological alignment with this method has been shown to be greater than 90 % (Gaumont et al., 2018).
This paper leverages the data collected by the Politoscope during the period 2021-09-01 to 2022-12-31 and the associated community attributions: 288M tweets involving 8.4M retweeting accounts and 11M accounts producing original content. Among these 288M tweets, 24.89% are original tweets, 57.63% are retweets, the rest being comments on tweets or retweets with comments. We also relied on the analysis of Gaumont et al. (2018) to define the main broad topics of the political debate during the covered period. With the help of a semantic map generated from the 2017 presidential programs and the Twitter corpora, eleven topics have been identified as particularly important and representative of the French political debate. These topics are described groups of terms obtained with text-mining methods and qualitative analysis of the political tweets. For this paper, we have updated the original topics of Gaumont et al. (2018) through marginal additions of terms that have been central in the political debate over the targeted period, reflecting endogenous events that emerged during 2021-2022.
The list of terms associated to each query can be found in the Appendix. The objective was to obtain a query that makes it possible to extract from the Politoscope database a set of coherent tweets related to each topics. Topics have been labeled by one of their most generic term for reference in the visualization: agriculture, democracy, economics, ecology, foreign politics, immigration, employment, homeland security, research and education, health, energy policy. In Figure 1 we display a sample of the core political communities who produced the tweets related to our analysis.
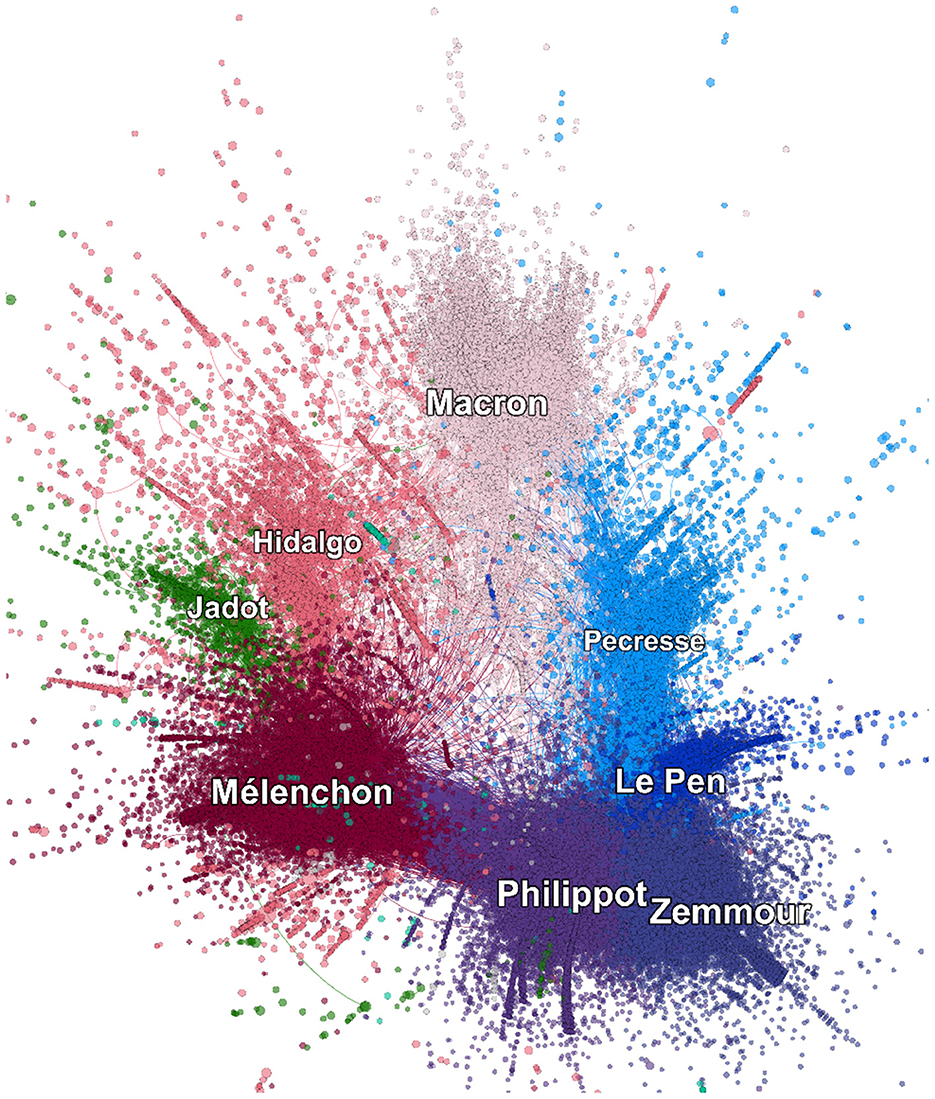
Figure 1. Political twittersphere over the period from 2021-09-01 to 2022-12-31. Following Gaumont et al. (2018). Each node is a Twitter account, each color correspond to a political digital community. Political communities have been reconstructed from the retweets graph were links represent the retweet activity over the full period. Louvain clustering (Blondel et al., 2008) has been used to detect the communities and the graph has been spatialized with the Force Atlas algorithm (Jacomy et al., 2014). Only links with weight highers than 20 retweets have been kept for the community detection and only links corresponding to 100 retweets or more are shown. Moreover, only the communities associated to political leaders studied in this paper are displayed on this image, which represent 39.4k accounts (80 % of the full map).
3 Preliminary analysis
Using the key topics and the selected height key political figures with their core communities, we end up with 88 times series of 419 days long. Figure 2 displays these time series (number of daily tweets per community per topic). The y-axis is in log-scale, revealing a large disparity among the activity between the different political parties. The vertical solid black line corresponds to the presidential election. Annotations show the maximum/lowest top 5 of these activities. Among the most active parties on Twitter we find Philippot and Zemmour on the topics health, foreign policy and immigration while the less active communities are Hidalgo and Jadot on topics domestic security, employment, and immigration. The black curve corresponds to the median of all time series. As expected, the median number of tweets increases until the election and then decreases.
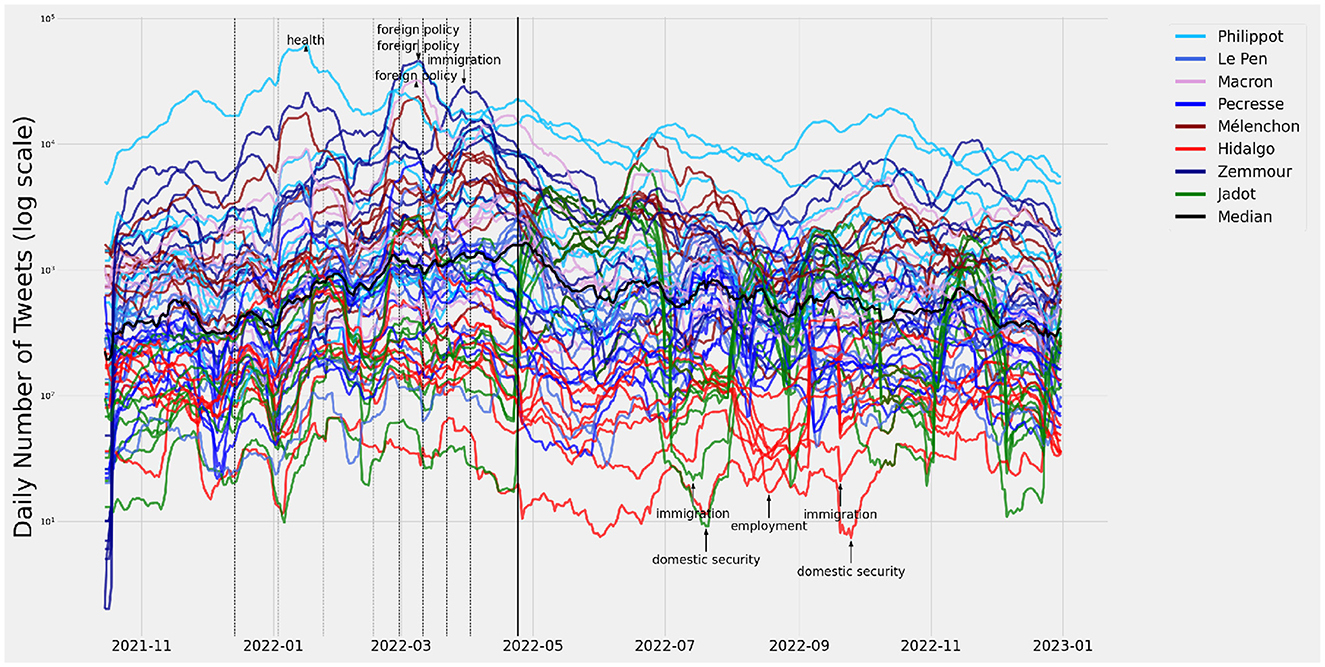
Figure 2. Time series of the daily number of tweets.
Figure 3 corresponds to the logarithm difference (log-returns) of the number of tweets on two consecutive days which is referred as the change of activities. Each of these times series are stochastic with a mean of zero but we shift these time series along the y-axis for better visibility. Qualitatively, we see that the change in activity per party seems to be more correlated than between parties.
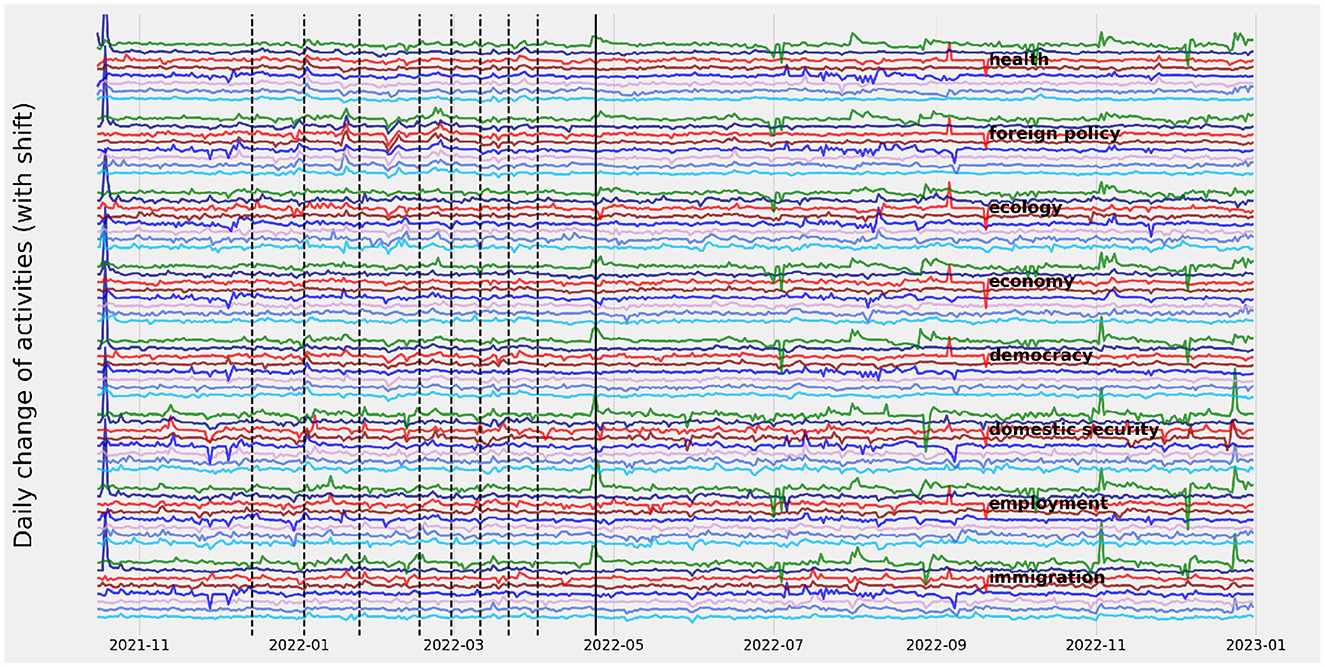
Figure 3. Time series of log-return of number of tweets (change of activities). Each time series is shifted to avoid overlapping and regrouped by topics for clarity (they all have a mean of zero).
The vertical dashed lines in these two panels correspond to changes in the collective dynamics as defined in Section 4. Is it noteworthy that most changes in the collective dynamics occur before the election.
4 Detecting collective behavior and central nodes
In many complex systems, such as financial markets, where log-returns of stock prices are analyzed, or neuronal networks, where neural firing rates or membrane potentials are measured, the activity of individual entities exhibits time-dependent fluctuations that can be modeled as stochastic time series. These typically fluctuate around a zero mean, with no obvious deterministic trend. Despite this apparent randomness, correlated patterns and collective behavior can emerge, revealing underlying structure and coordination.
Such collective behavior can be identified by analyzing the eigenvalue spectrum of the correlation matrix derived from the system's time series. Collective dynamics often manifest itself as large eigenvalues, corresponding to strongly correlated modes that reflect coordinated behavior, synchronization, or critical transitions. These modes have been observed across domains, including systemic market movements in finance (Plerou et al., 2002) and synchronized neural activity in brain networks (Almog et al., 2019). Monitoring temporal changes in the largest eigenvalues provides a quantitative approach for detecting shifts in system behavior, such as the onset of emergent phenomena or global coordination.
The emergence of large eigenvalues still holds as an indicator of collective dynamics, even if the entire eigenvalue distribution does not follow the Marchenko-Pastur law, as shown in studies that explore deviations from random matrix theory in systems with long-range correlations or complex internal structures (Sornette and von der Becke, 2011).
To detect global coordination in the change of activities of our political communities, we compute the correlation matrix over a sliding time window of Δt = 14 days across the entire time period T = 419. The correlation matrix for each pair of time series ξi(Δt) and ξj(Δt) is calculated as:
where 〈ξi(Δt)〉 represents the mean of ξi(Δt) over the 14-day window, and is the mean of the squared values of ξi(Δt). The correlation matrix computed for each Δt is then analyzed by performing an eigenvalue decomposition, where the largest eigenvalue is computed. To detect significant collective dynamics, we require that the largest eigenvalue computed on the sliding window increases by an order of magnitude compared to the largest eigenvalue computed over the entire time period T:
In Figure 2, we saw that the logarithmic return of the daily number of tweets were stationary time series with spikes, similar to behaviors observed in complex systems where abrupt events disrupt otherwise stable patterns (Mandelbrot and Hudson, 2004). Similar properties have been observed in political social media activity, where sudden bursts of communication often correspond to significant political events or controversies (Wang et al., 2020). The vertical dashed lines correspond to Equation 2 being satisfied. Interestingly, we see that large increases of collective behavior happen during the presidential campaign. Spectral analysis therefore enables us to quantitatively characterize the period during which political communities are in competition, which a simple qualitative analysis of the logarithmic return of the daily number of tweets could not reveal.
To study the origins of these synchronized changes within political parties, we used network analysis. We start by averaging our time series ξ(political community x topic) over the political parties and then we compute the correlation matrix among these 11 (topics) time series. In order to map the correlation matrix computed at each time step to an adjacency matrix we use the threshold method (e.g. Newman, 2010; Watts and Strogatz, 1998; Achitouv, 2025). The threshold method involves setting a threshold ρc such that only the pairs of nodes with correlation coefficients greater than ρc are considered connected. Mathematically, we define the adjacency matrix A as:
where Corrij is the correlation between time series ξi and ξj, and ρc is the threshold value. This adjacency matrix can then be used to construct a graph where nodes represent political parties associated with topics (or just topics), and edges represent the strength of the correlations. In what follows, we use as a threshold the 90th quantile of the distribution of absolute values in the correlation matrix.1
We then compute centrality measures on each graph. The weighted degree of a node is the sum of the weights of its connections to other nodes:
where Aij is the adjacency matrix of the network, and Cdegree(i) is the degree centrality of node i. This measure gives an indication of how strongly the dynamics of the node is correlated with the global dynamics.
We also measure the betweenness centrality in what follows. This quantity quantifies the extent to which a node is bridging different communities in the network. It is defined as:
where σst is the number of shortest paths between nodes s and t, and σst(i) is the number of those paths that pass through node i. Nodes with high betweenness centrality play a crucial role in connecting different parts of the network, acting as brokers or gatekeepers of information. In our case, those nodes can be interpreted as the speeches of certain candidates that cross various aspects of French political life.
These two metrics help us understand how political parties and topics are interrelated and make it possible to highlight key players and topics in the discourse during different phases of the election.
In Figure 4 top, we display the the ratio computed on our time period using the activities variation for ξi(Δt) in Equation 1. On the bottom panel we show the topic that had the highest centrality (Equation 4), along with events reported in media (see Table 1).
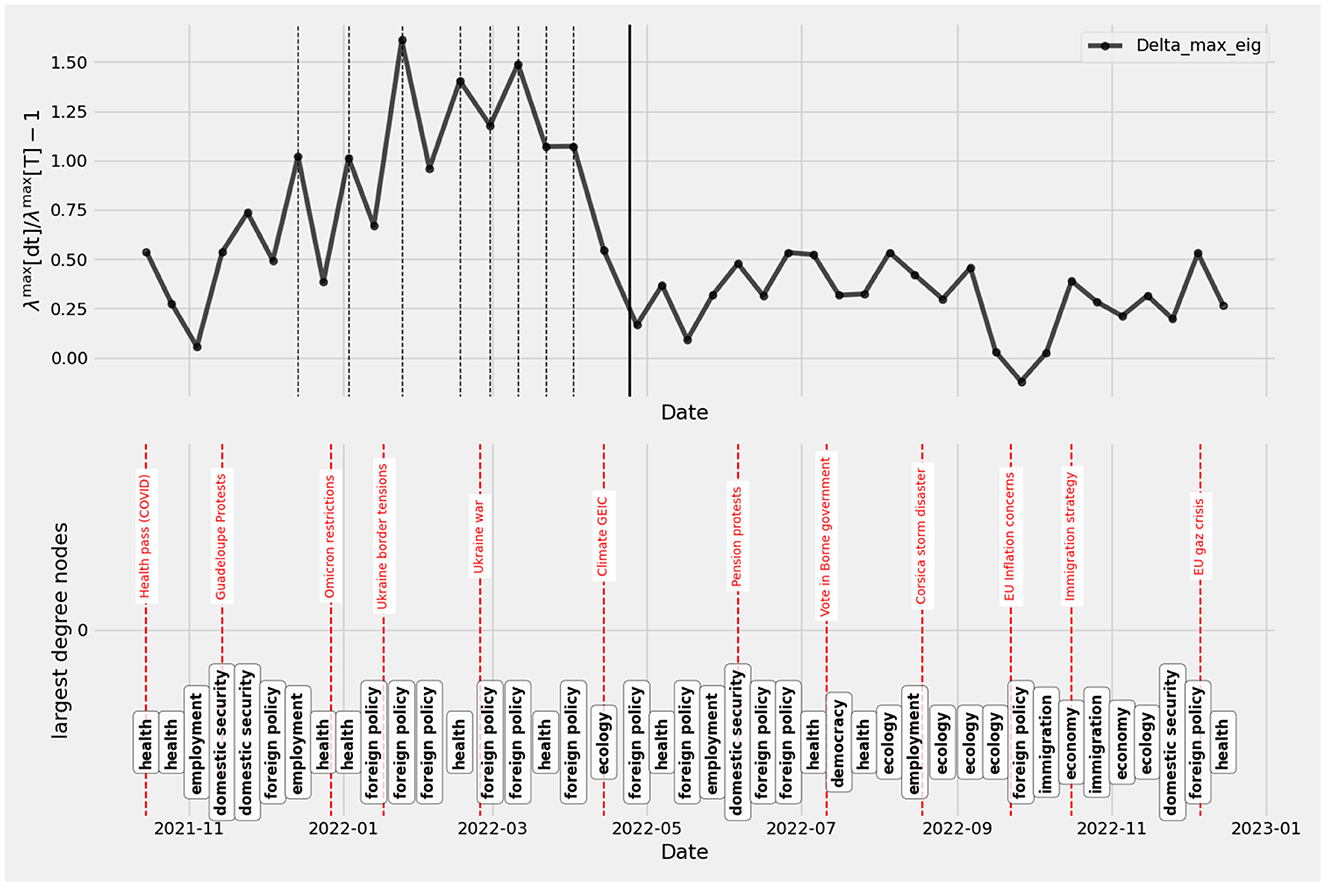
Figure 4. Top: Evolution of the largest eigenvalues relative to those computed over the entire period. Bottom: Topics corresponding to the highest degree, annotated with key political events.
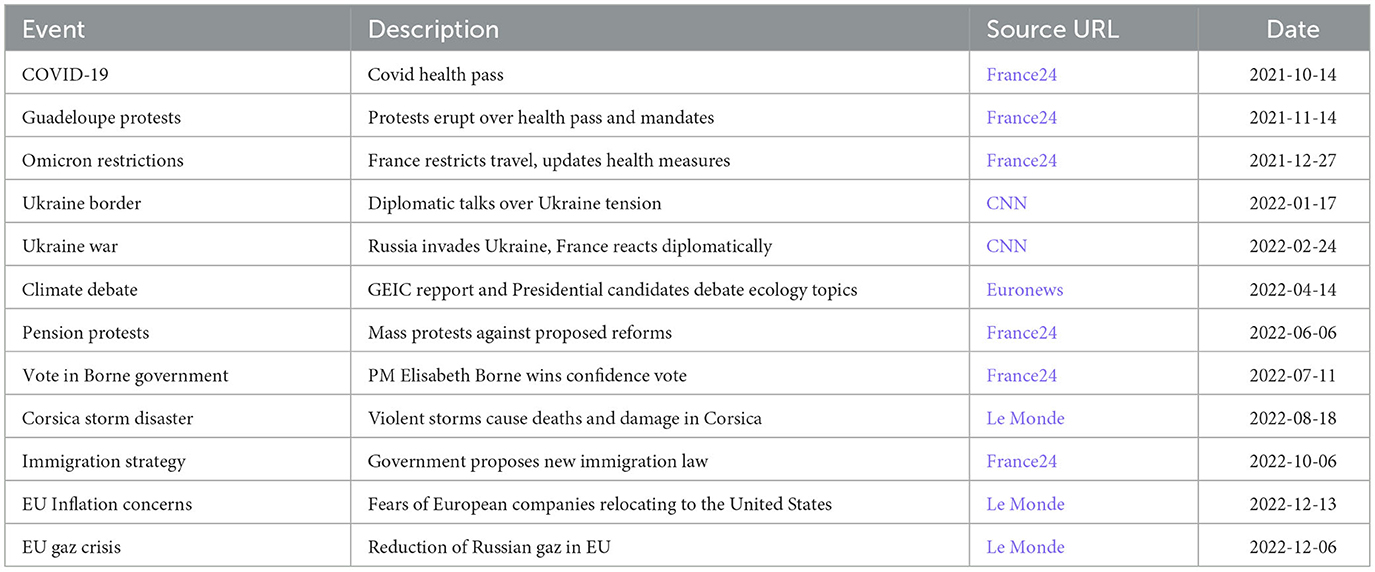
Table 1. Events with media coverage related to our topics.
Interestingly, the end of the election period not only corresponds to a global change in collective dynamics, but also to a change in the prevalence of the most central topics in the political landscape as measured by the correlation matrix through time (see Table 2). In particular, ecology and environmental issues, which was the second major concern of the French (84%) after purchasing power (91%) is almost absent in the top pre-electoral topics while it was well represented after the election.
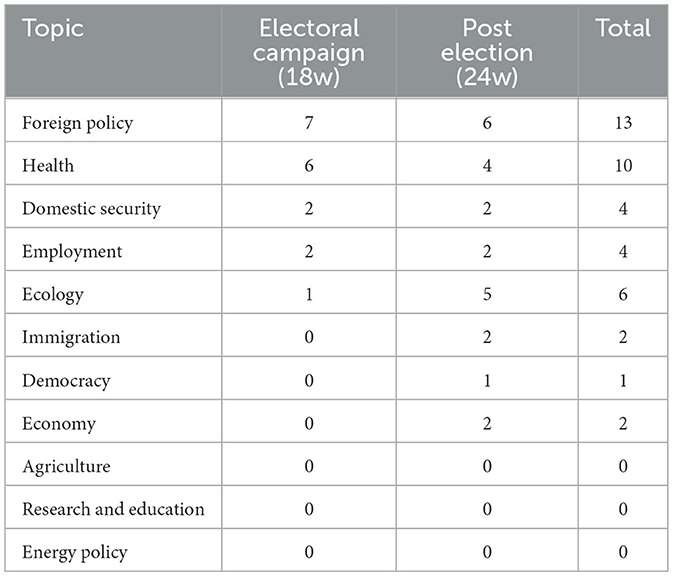
Table 2. Number of occurrences of topics as the highest degree topic in the correlation matrix before and after the election.
During the presidential campaign, some topics are over-represented compared to their post-election frequency: health (related to health measures implemented following the arrival of the COVID-19 Omicron variant) and the rising tensions at the Ukraine border, followed by the outbreak of the Ukraine war (topics: health and foreign policy) while some others simply never appear: agriculture, research and education and energy policy.
This observation suggests that political communities put in place strong agenda-setting strategies, highlighting issues likely to give them an advantage in the vote.
The fact that health and foreign policy dominated the pre-electoral period aligns with exogenous shocks of the time: the COVID-19 Omicron wave and its management, which shaped the electoral context (Fourel et al., 2022), and the outbreak of the Ukraine war, which directly influenced the campaign narrative (Ivaldi, 2023). Conversely, the post-electoral rise of ecology and environmental issues, while absent during the campaign, reflects the re-emergence of long-term concerns once immediate crises receded (Hewlett and Kuhn, 2022). Thus, the shifts we observe in the correlation structure and topic centrality are not merely endogenous to the online political discourse, but are also directly connected to broader political and social events shaping the French political landscape in 2022. Importantly, this contextualization is detected through the automated analysis of central topics we develop, underscoring the value of combining network-based measures with knowledge of external shocks in the electoral timeline.
5 Evolution of the political landscape
A comparison of the pre- and post-2022 French presidential election graphs (constructed from the correlations of daily variations) reveals significant shifts in the political landscape, as evidenced by changes in centrality measures.
In Figures 5, 6, the resulting graphs are shown, where colors represent political communities. Nodes depicted as squares have betweenness centrality in the top 25th percentile of the distribution, those shown as diamonds have degree centrality in the top 25th percentile, and nodes shown as stars are in the top 25th percentile for both betweenness and degree centrality distributions. The size of these nodes is proportional to their centrality measure. The spatial visualization corresponds to Force Atlas 2 (Jacomy et al., 2014), which is a force-directed layout algorithm that simulates a physical system where nodes repel each other like charged particles and edges act as springs, attracting connected nodes together. This process results in a network layout where structural proximities are reflected as visual proximities. Interestingly, we observe some clustering by communities. In the pre-election period, we see that the political parties of Hidalgo and Jadot appear on the left, and Zemmour forms an almost distinct cluster on the right. Macron in the democracy topic is the central node both in terms of centrality and betweenness. We also see two clusters on foreign policy and on health where diverse parties (left and right) are connected.
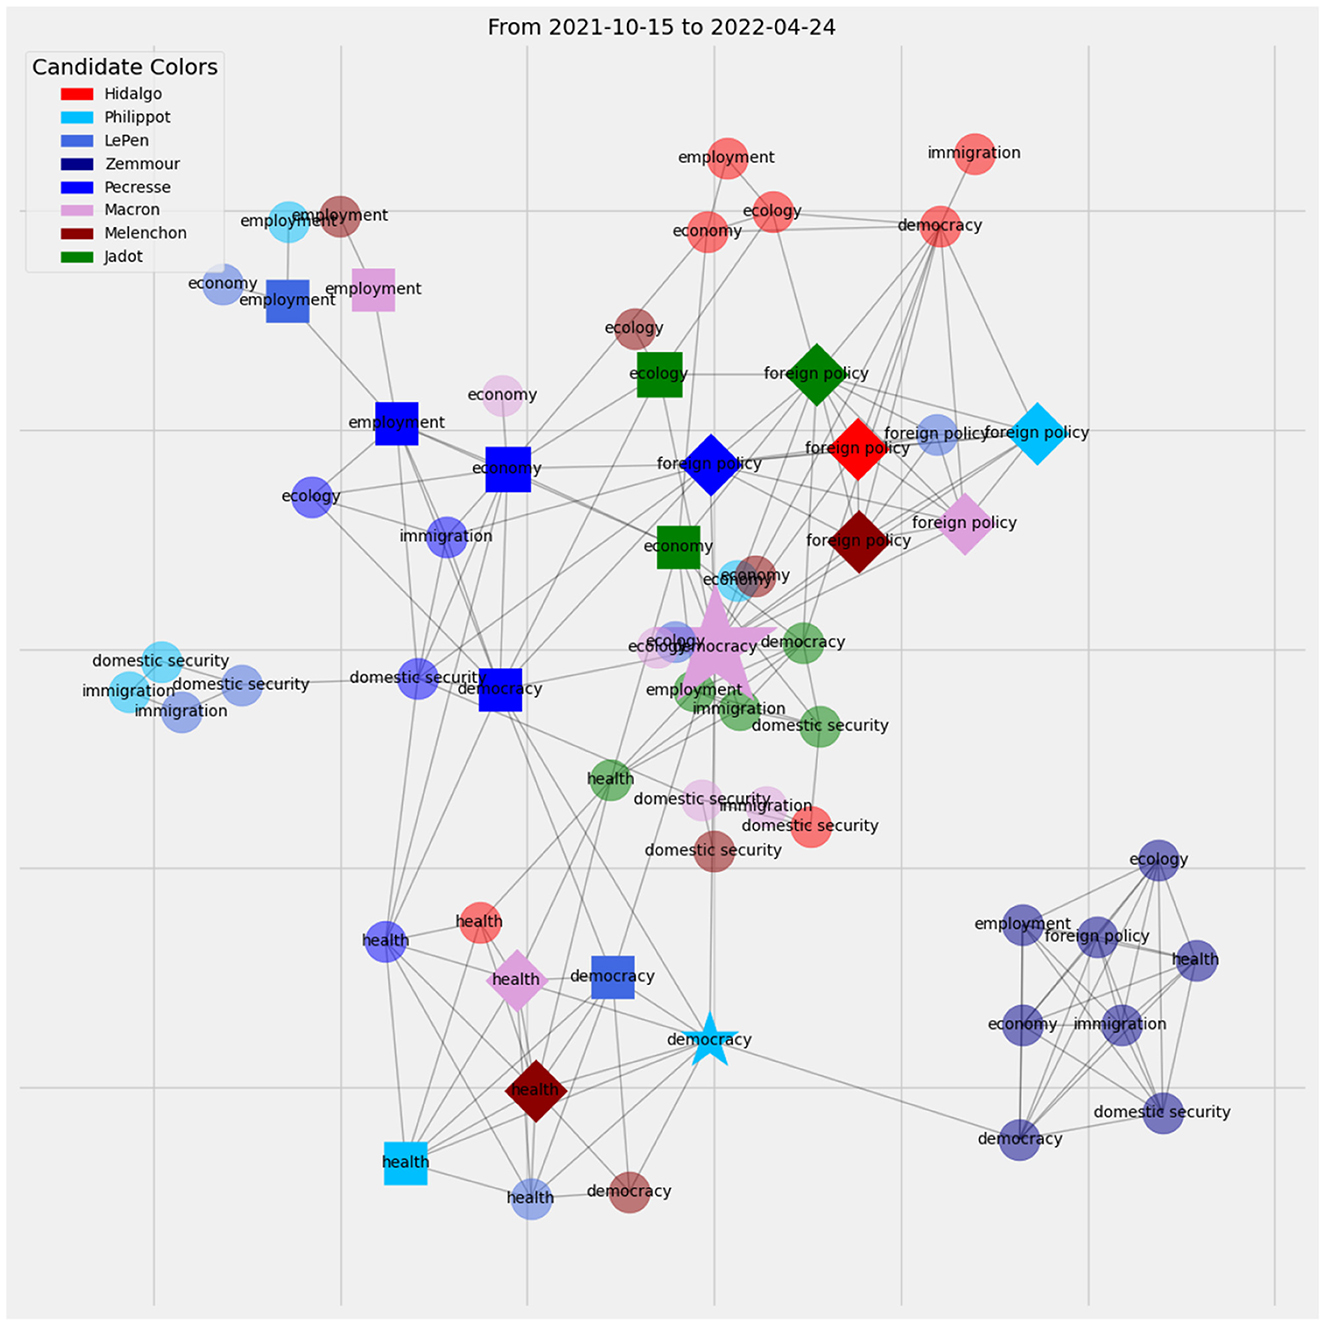
Figure 5. Correlation network structure pre-election.
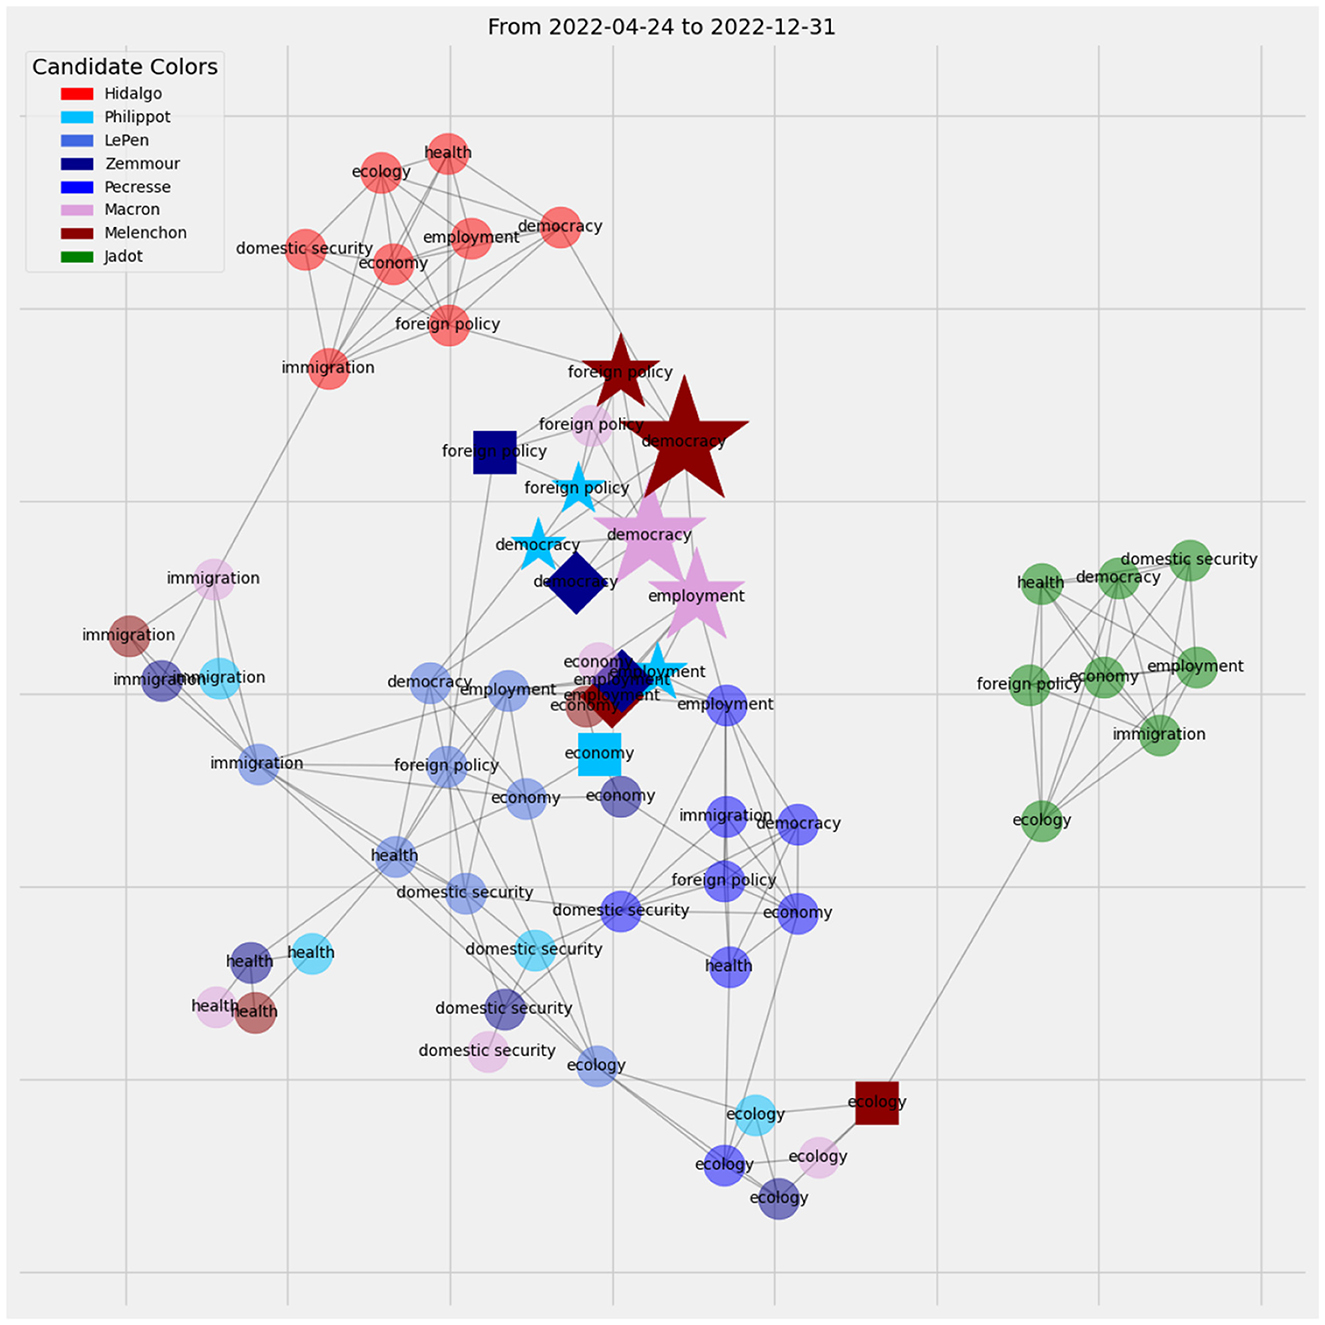
Figure 6. Correlation network structure post-election.
After Macron's election, the political landscape changed. We see that now the Hidalgo community is a cluster connected to Mélenchon's node on democracy and foreign policy, while Jadot is also a separate cluster but connected to Mélenchon's community on the topic of ecology. In the post-election period, Mélenchon led efforts to unite the left for the legislative elections by forming the Nouvelle Union Populaire Écologique et Sociale (NUPES), an alliance of left-wing parties. This alliance aimed to make Mélenchon Prime Minister by winning a parliamentary majority. While it became the largest left-wing bloc in the National Assembly, it did not secure a majority. However, it explains how in this post-election period his communities became top nodes in both degree and betweenness centrality, alongside Macron, as he became the figurehead of the united left-wing political movement, making him a direct competitor to Macron with contrasting ideological views.
One should distinguish, however, between the interpretation of clustering or centrality of nodes among changes in activities and the influence of one community on another. In fact, these graphs are not directional, and one may wonder if a central node here is central due to its influence or because its political party is influenced by others. To test the influence of a node (political community × topic), we turn to causal inference.
6 Causal inference as a measure of influence
Convergent Cross Mapping (CCM) is a powerful technique for detecting causality in complex, nonlinear systems. It was introduced by Sugihara et al. (2012) as a method for inferring causal relationships by examining how well the historical states of one time series can be used to predict the states of another. The CCM method goes beyond simple Granger causality inference (Granger, 1969) as it is suited for nonlinear systems dominated by stochasticity, as is the case for the variation of activities.
Indeed, Granger causality tests for linear predictability between time series, but in our context of bursty and highly stochastic activity it would mainly reflect directions consistent with correlated fluctuations rather than uncovering genuine nonlinear causal influence. On the other hand, Transfer Entropy (Schreiber, 2000), is a powerful approach to detect non-linear causal dependencies but it requires a much larger number of observations to estimate conditional probabilities accurately. Given our time series length (< 500 points), CCM is better suited for uncovering non-linear causal influence under noisy and data-limited conditions.
The CCM method involves reconstructing the state space of each time series using delay embedding, as established by Takens' Theorem (Takens, 1981). By constructing shadow manifolds for each series, CCM assesses whether information about one variable is recoverable from the reconstructed manifold of the other. If the cross-mapping skill (measured via prediction accuracy) increases as more data points are used, it suggests a causal relationship from one variable to the other.
Mathematically, the state-space reconstruction for a given time series X = {x(t)} is achieved through delay embedding, which creates a vector representation of the system's state at time t, given by:
where τ is the embedding delay and E is the embedding dimension. Similarly, for another time series Y = {y(t)}, the reconstructed manifold is:
To assess whether X causally influences Y, Convergent Cross Mapping (CCM) evaluates whether the states of Y can be reconstructed using the manifold MX, which is built from the time-delay embedding of X. The reconstructed estimate Ŷ(t) is obtained using the nearest neighbors of MX(t) in the embedded space.
Let be the time indices of the E+1 nearest neighbors of the point MX(t), found using Euclidean distances in the embedded space MX. The distances to these neighbors are denoted as
and the weights are defined by:
Using these weights, the cross-mapped estimate of Y(t), denoted Ŷ(t), is given by a weighted average of the corresponding values of Y:
The accuracy of the reconstruction is evaluated by computing the Pearson correlation coefficient (ρ) between the actual values Y(t) and the estimates Ŷ(t):
An increasing ρ with more library points indicates that information about Y is encoded in MX, suggesting that X causally influences Y. CCM measure has been applied to various fields, including to infer the non-linear influences among species in ecological systems (Ye et al., 2015; Deyle et al., 2016). In the context of analyzing political influence through Twitter data, CCM can be applied to our stationary time series (the variation in activities of the different political communities × topics).
Indeed, by determining whether the activity of one community causally influences another, we can move beyond correlation-based graphs to uncover directional relationships and assess how political influence propagates through the network. This approach can offer a clearer view of how various actors interact and influence each other's discourse.
In what follows, we use CCM with embedding dimension E = 2 and k = 3 nearest neighbors. For validation of this choice, including robustness checks and methodological justification, we refer the reader to Appendix 8.1 and 8.2.
6.1 Causal network
Figure 7 shows the network representation of causal influence. The edges indicate causal connections and their weights are proportional to the Pearson correlation coefficient from Equation 6. We set the edge transparency based on the relationship: it is nearly invisible for influences within the same community, lightly transparent for cross-party influences with a Pearson coefficient below 0.5, and fully opaque when above that threshold. Node shapes and colors follow the same conventions as in the previous graphs.
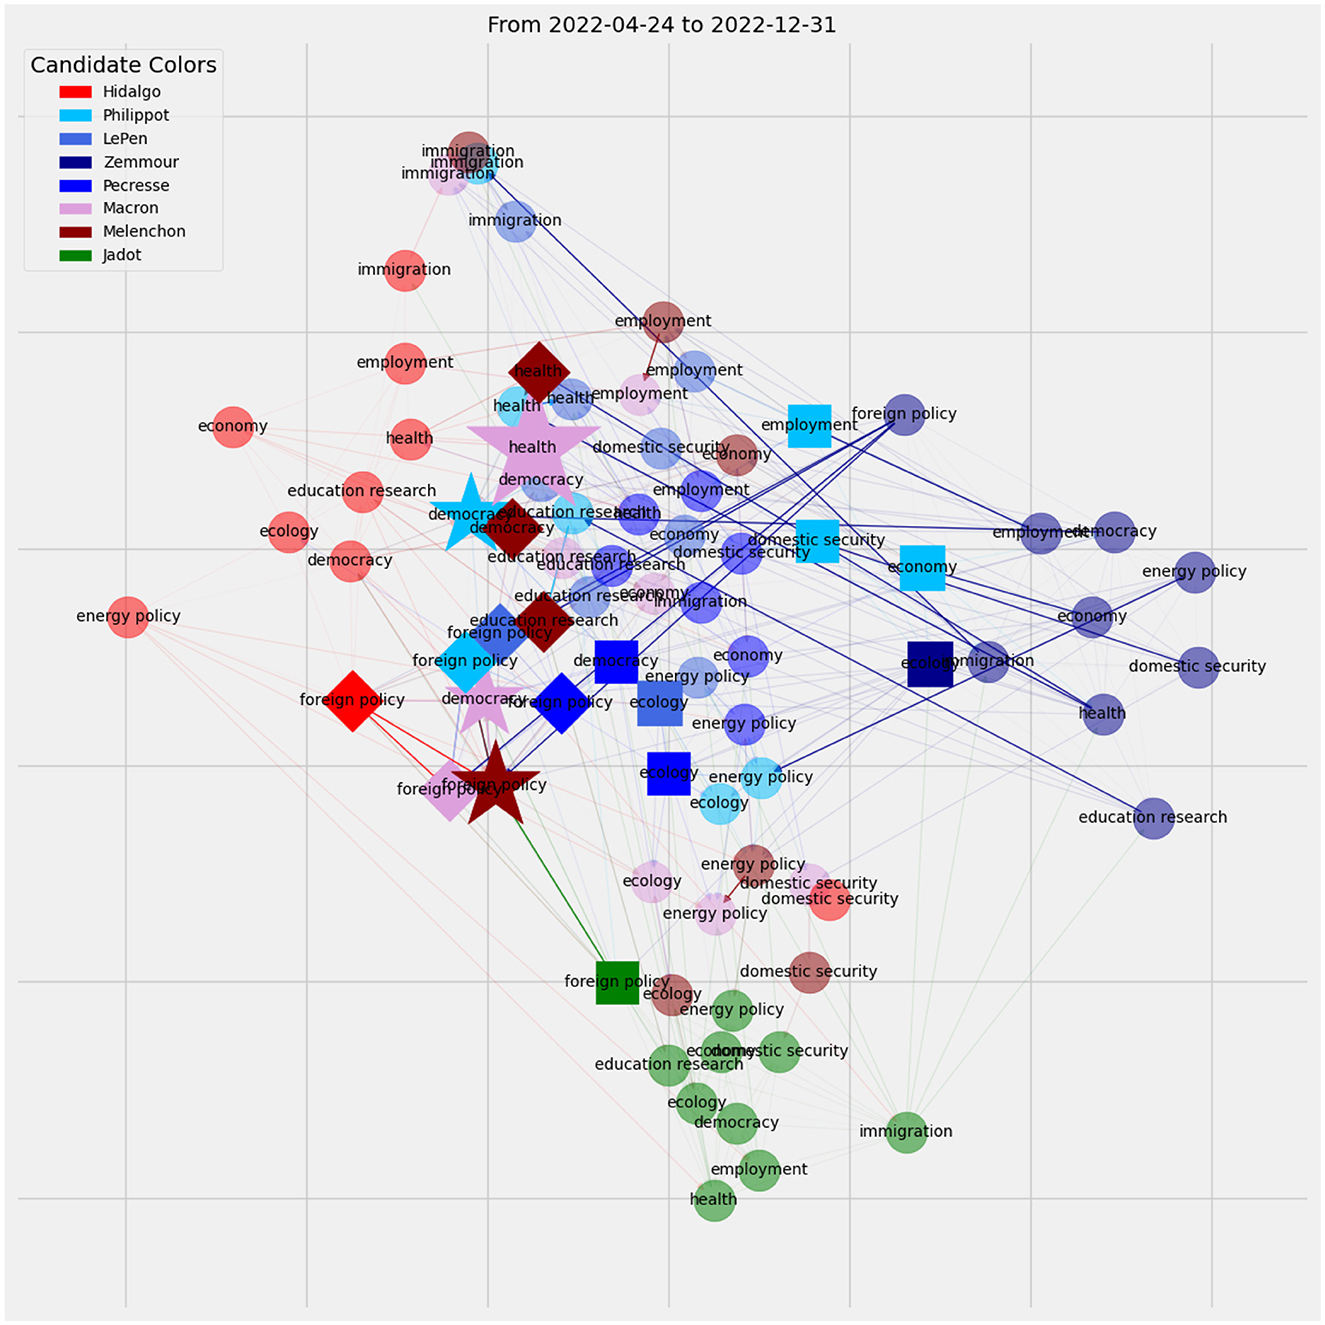
Figure 7. Causal network of the political communities x topics.
Interestingly, we first observe clustering among the political communities of Hidalgo, Jadot, and Zemmour, while other communities appear more central. We also observe an interesting spatial distribution of the political communities according to their “left” or “right” political views: for instance, Philippot appears mostly between Zemmour and Le Pen/Pécresse. Beyond that, nodes representing Macron, Mélenchon, and finally Hidalgo.
Among the strongest influences, we see that Jadot and Hidalgo influence Mélenchon on the topic of foreign policy. Hidalgo also influences Macron, but neither of them influences the right or extreme right political parties, nor are they influenced by them. While Zemmour's cluster is not central in the graph, he has some strong influence on diverse parties, an effect that was not visible in the correlation-based graph.
We also observe that the most central node with the strongest influence corresponds to Macron on the health topic. This is consistent with the findings of Section 4, where health-related nodes were among the most central during periods of collective change. From a sociological perspective, Macron was president during the arrival of the Omicron variant, and his government was responsible for elaborating the associated health measures. It is therefore not surprising that his node emerges as the most central on this topic.
With less significant influence (semi transparent edges), we note that foreign policy brought together political parties across the ideological spectrum, with candidates influencing one another beyond their left/right inclinations. From a sociological point of view, a robust democratic debate often thrives on the interaction of diverse viewpoints, as deliberative democracy theory suggests (Habermas, 1984; Dryzek, 2000). Consequently, it is pertinent to examine which topics acted as catalysts, prompting candidates to respond to one another and engage in a dynamic exchange. Investigating these dynamics may therefore shed light on the broader mechanisms that shape political dialogue and influence electoral outcomes.
6.2 Political communities influence
To quantify the overall influence of each political community, we aggregate the influence of each community averaged over all topics and display the results as a matrix, with the source of influence in the rows and the target in the columns, as shown in Figure 8. Here, we only average meaningful causal inferences where the Pearson coefficient is ρ>0.5, masking other values to zero. Interestingly, we find again that the Hidalgo and Jadot communities neither influence right or extreme right parties nor are influenced by any community. Macron and Mélenchon parties influence one another, and Macron, Mélenchon, and Philippot are more influenced than other parties. Interestingly, the Zemmour party influences the most communities but is not influenced by anyone. The number associated with each entry of the matrix corresponds to the lag (t-lag) at which the strongest influence occurs, which here corresponds to t-3 or t-2 days while we test for lags up to t-7.
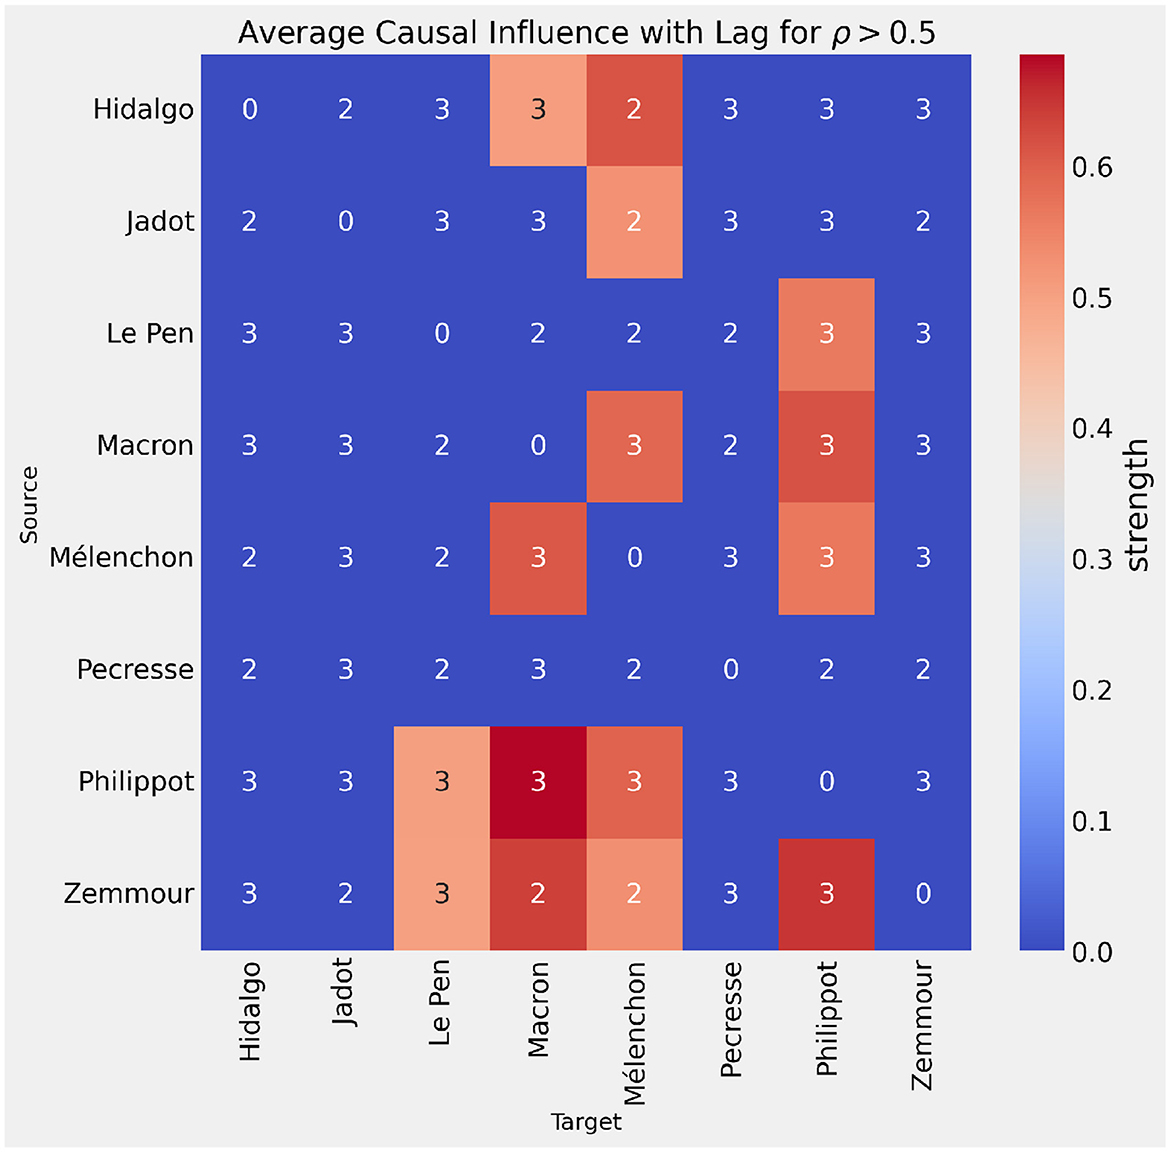
Figure 8. Matrix representation of the influence among political communities: rows correspond to sources, and columns correspond to targets. The threshold for influence is set to ρ>0.5.
We can also average the influence (rows) over all political parties to determine which community influences the most or is most likely to be influenced (average per column). To test this, we consider a lower threshold for the Pearson coefficient, setting ρ>0.25, which corresponds to the 90th quantile of the overall influence matrix distribution (topics × political parties) and for which most entries are zero. We show this result in Figure 9 as relative influence compared to the median (left panel with green bars) and as the relative proportion of being influenced (swayed) compared to the median (orange bars) in the right panel. We see that Hidalgo, for instance, has the lowest influence, while Zemmour has the strongest. Macron, Mélenchon, and Philippot have positive influence compared to the median. On the other hand, the political communities that respond (are influenced) the most are Mélenchon's, Philippot's, and Macron's, which is also reflected in the spatial distribution of the influence graph. Zemmour is a particular case: it is not influenced by other political communities but has a strong influence on them.
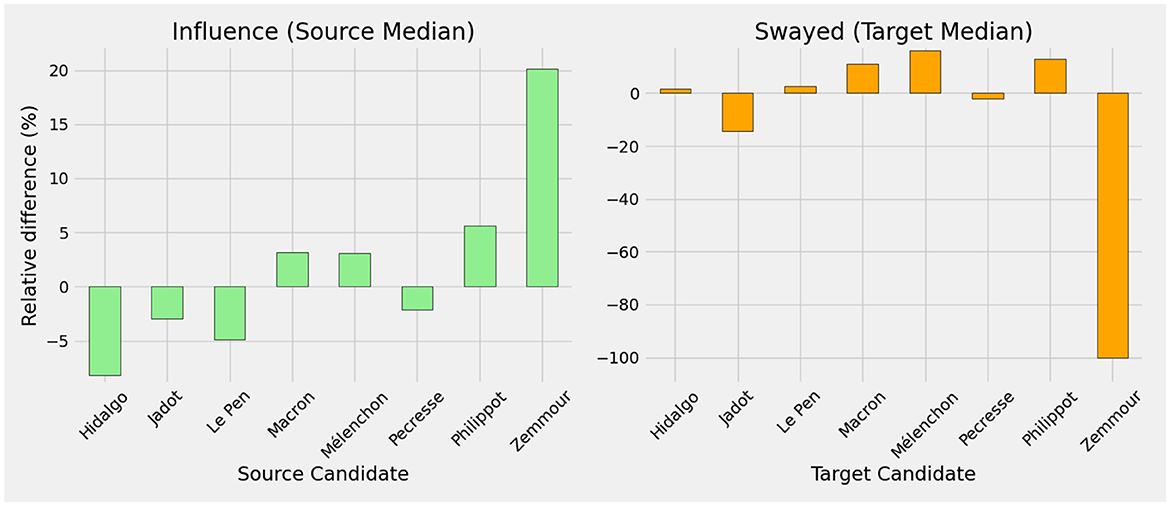
Figure 9. Relative influence of each party on all others is measured by the median (green bars). The orange bars represent how much each party is influenced by the others, relative to the median.
6.3 Topics of influence
Finally, if we do not aggregate our measure of influence over all topics, we can also test which topic has the most influence per communities. For this we lower the threshold of influence ρ>0.4 in order to obtain a result for each political communities. As we can observe in Figure 10, a threshold of ρ>0.5 would result in no influence for the community of Pecresse. In this figure we see the top 3 topics per political communities that influence. Unsurprisingly the topics that are the most influent are health (following the COVID pandemic and the preventive measures taken by the government), and foreign policy. The latter can be understood in light of the Russian invasion of Ukraine, which began on February 24, 2022. The war heightened concerns over Europe's defense, security, and autonomy, prompting French political parties to shift their rhetoric on European sovereignty.
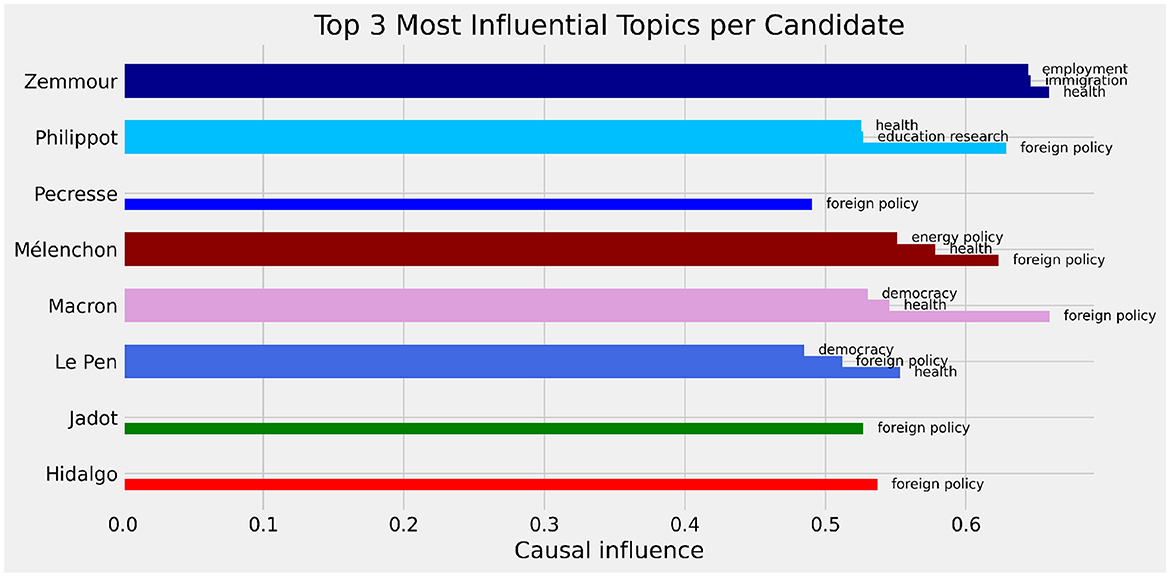
Figure 10. Top influential topics (max 3) per political community with threshold ρ = 0.4.
In addition, some political parties have no more than one topic influencing others with a threshold of ρ>0.4 (Pécresse, Jadot, and Hidalgo). Among Zemmour's influential topics, immigration is part of the top three. During his campaign, Zemmour also advocated for stricter immigration policies, often emphasizing national identity and perceived threats of multiculturalism (Newsweek, 2022). His rhetoric has positioned him as a key figure in the immigration debate, further amplifying his party's influence. Interestingly, the most influential topics within the Le Pen and Macron communities are the same. To recall, Macron and Le Pen were competitors for the second round of the presidential election. However, we see that Macron's influence is stronger than Le Pen's, which is also supported by the correlation graph-based measures of centrality.
7 Conclusion
In this article, we highlight the dynamic nature of political discourse on Twitter during the 2022 French presidential election. Our analysis begins by examining collective modes in the time series of political community activities, where the eigenvalue spectrum of filtered correlation matrices reveals periods of synchronized fluctuations. These large eigenvalues correspond to emergent collective behavior, especially noticeable before critical events like the election, indicating heightened coordination across political parties on key issues.
Building on this, we constructed correlation-based graphs from the activity changes, identifying central nodes (political parties and topics) that play pivotal roles in shaping the political landscape. These centralities reveal which actors and themes dominate the network of interactions, shedding light on the structural backbone of political discourse. However, while correlation captures mutual relationships, it does not resolve which node initiate the dynamical variation of activity that can cause a re-shape of the network.
To address this limitation, our subsequent causal inference analysis reveals asymmetric patterns of influence among political communities. For example, parties such as Hidalgo and Jadot predominantly influence Mélanchon without being influenced in return, while Macron and Mélenchon exhibit a mutual, competitive shaping of discourse. Meanwhile, some parties like Zemmour act as influential initiators with broad impact across the spectrum, yet remain relatively uninfluenced by others, highlighting diverse strategic roles in political communication.
Sociologically, these findings reinforce the idea that political influence extends beyond electoral success to encompass narrative dominance and responsiveness to key external events, such as the COVID-19 pandemic and the Ukraine crisis. The varying degrees of receptiveness to influence suggest that some political actors remain insulated within their ideological spheres, while others are more permeable to cross-party dynamics. By mapping these interactions, our study offers empirical insight into how political actors engage with one another on social media, highlighting differences in responsiveness, influence, and topic centrality across the ideological spectrum. These findings suggest that influence within the political landscape extends beyond formal electoral outcomes and manifests through differential attention to key issues and asymmetries in discourse dynamics. This observation aligns with theoretical perspectives on political communication and media influence, such as Bourdieu (1984) with the concept of the political field as structured by symbolic power relations, and complements deliberative democracy theory, which emphasizes the importance of discourse and inter-party engagement in shaping democratic outcomes (Habermas, 1984; Dryzek, 2000).
Overall, the combination of collective mode detection, correlation-based centrality measures, and causal inference offers a powerful, data-driven framework to disentangle the complex, directional flows of political influence in digital environments. Future work could extend this approach by incorporating richer content analysis of the tweets themselves, examining how specific frames or rhetoric contribute to influence dynamics. Additionally, applying this methodology longitudinally across multiple election cycles could illuminate the evolution of political strategies and the resilience of influence networks. From a practical standpoint, these insights may assist campaign strategists and media analysts in monitoring shifts in political discourse and anticipating emerging coalitions or conflicts in real time.
Data availability statement
The data and codes used for this analysis are available on: https://github.com/IxandraAchitouv/Dynamical_influence.
Author contributions
IA: Investigation, Conceptualization, Writing – review & editing, Writing – original draft, Methodology. DC: Resources, Data curation, Writing – review & editing.
Funding
The author(s) declare that financial support was received for the research and/or publication of this article. This work was supported by the Complex Systems Institute of Paris Île-de-France (ISC-PIF) and the EU NODES project (LC-01967516). Ixandra Achitouv also acknowledges the CFM Foundation for Research.
Conflict of interest
The authors declare that the research was conducted in the absence of any commercial or financial relationships that could be construed as a potential conflict of interest.
Generative AI statement
The author(s) declare that no Gen AI was used in the creation of this manuscript.
Any alternative text (alt text) provided alongside figures in this article has been generated by Frontiers with the support of artificial intelligence and reasonable efforts have been made to ensure accuracy, including review by the authors wherever possible. If you identify any issues, please contact us.
Publisher's note
All claims expressed in this article are solely those of the authors and do not necessarily represent those of their affiliated organizations, or those of the publisher, the editors and the reviewers. Any product that may be evaluated in this article, or claim that may be made by its manufacturer, is not guaranteed or endorsed by the publisher.
Supplementary material
The Supplementary Material for this article can be found online at: https://www.frontiersin.org/articles/10.3389/fpos.2025.1653101/full#supplementary-material
Footnotes
1. ^As it is discussed in Achitouv (2025), there is no obvious criteria for the choice of the threshold, however one could take the minimum threshold that produces a degree distribution of the nodes similar to a power law for which the centrality measure tend to converge as noises are filtered out.
References
Achitouv, I. (2025). Dynamical analysis of financial stocks network: Improving forecasting using network properties. PLoS ONE 20:e0319985. doi: 10.1371/journal.pone.0319985
Almog, A., Buijink, M. R., Roethler, O., Michel, S., Meijer, J. H., Rohling, J. H. T., et al. (2019). Uncovering functional signature in neural systems via random matrix theory. PLoS Comput. Biol. 15:e1006934. doi: 10.1371/journal.pcbi.1006934
Barberá, P. (2015). Birds of the same feather tweet together: Bayesian ideal point estimation using twitter data. Polit. Analy. 23, 76–91. doi: 10.1093/pan/mpu011
Bialek, W., Nemenman, I., and Tishby, N. (2001). Complexity and information, and learning. Neural Comput. 13, 2409–2463. doi: 10.1162/089976601753195969
Blondel, V. D., Guillaume, J.-L., Lambiotte, R., and Lefebvre, E. (2008). Fast unfolding of communities in large networks. J. Statist. Mech. 2008:P10008. doi: 10.1088/1742-5468/2008/10/P10008
Bossetta, M. (2018). The digital architectures of social media: comparing political campaigning on facebook, twitter, instagram, and snapchat in the 2016 U.S. election. Journal. Mass Commun. Quart. 95, 471–496. doi: 10.1177/1077699018763307
Bourdieu, P. (1984). Distinction: A Social Critique of the Judgement of Taste. Cambridge: Harvard University Press.
Chen, W., Pacheco, D., Yang, K.-C., and Menczer, F. (2021). Neutral bots probe political bias on social media. Nat. Commun. 12:5580. doi: 10.1038/s41467-021-25738-6
Conover, M. D., Ratkiewicz, J., Francisco, M., Gonçalves, B., Menczer, F., and Flammini, A. (2011). Political polarization on twitter. Proc. Int. AAAI Conf. Web Soc. Media 5, 89–96. doi: 10.1609/icwsm.v5i1.14126
Deyle, E. R., May, R. M., Munch, S. B., and Sugihara, G. (2016). Tracking and forecasting ecosystem interactions in real time. Proc. R. Soc. B Biol. Sci. 283:20152258. doi: 10.1098/rspb.2015.2258
Dryzek, J. S. (2000). Deliberative Democracy and Beyond: Liberals, Critics, Contestations. Oxford: Oxford University Press.
Fourel, Z., Adamczyk, R., Morinière, S., and Simmons, C. (2022). “A france divided by the pandemic: the disinformation ecosystem leading up to the 2022 elections,” in Technical report, Institute for Strategic Dialogue (ISD). Available online at: https://www.isdglobal.org/isd-publications/a-france-divided-by-the-pandemic-the-disinformation-ecosystem-leading-up-to-the-2022-elections/
Gaumont, N., Panahi, M., and Chavalarias, D. (2018). Reconstruction of the socio-semantic dynamics of political activist twitter networks–method and application to the 2017 french presidential election. PLoS ONE 13:e0201879. doi: 10.1371/journal.pone.0201879
Ghosh, D., Boettcher, W. A., Johnston, R., and Lahiri, S. (2023). THANOS: a predictive model of electoral campaigns using twitter data and opinion polls. Data Sci. Sci. 4:2484180. doi: 10.1080/26941899.2025.2484180
Granger, C. W. J. (1969). Investigating causal relations by econometric models and cross-spectral methods. Econometrica 37, 424–438. doi: 10.2307/1912791
Habermas, J. (1984). “The theory of communicative action,” in Vol. 1: Reason and the Rationalization of Society (Boston: Beacon Press).
Hewlett, N., and Kuhn, R. (2022). Reflections on the 2022 elections in france. Modern & Contemp. France 30, 393–409. doi: 10.1080/09639489.2022.2134325
Himelboim, I., Lariscy, R. W., Tinkham, S. F., and Sweetser, K. D. (2012). Social media and online political communication: the role of interpersonal informational trust and openness. J. Broadcast. Elect. Media 56, 92–115. doi: 10.1080/08838151.2011.648682
Huszár, F., Ktena, S. I., O'Brien, C., Belli, L., Schlaikjer, A., and Hardt, M. (2022). Algorithmic amplification of politics on twitter. Proc. Natl. Acad. Sci. USA. 119:e2025334119. doi: 10.1073/pnas.2025334119
Ivaldi, G. (2023). “The impact of the Russia–Ukraine war on radical right-wing populism in France,” in The Impacts of the Russian Invasion of Ukraine on Right-Wing Populism in Europe, eds. G. Ivaldi, and E. Zankina (Brussels: European Center for Populism Studies (ECPS)), 141–154.
Jacomy, M., Venturini, T., Heymann, S., and Bastian, M. (2014). ForceAtlas2, a continuous graph layout algorithm for handy network visualization designed for the gephi software. PLoS ONE 9:e98679. doi: 10.1371/journal.pone.0098679
Larsson, A. O. (2017). Going viral? Comparing parties on social media during the 2014 swedish election. Convergence 23, 117-131. doi: 10.1177/1354856515577891
Mandelbrot, B. B., and Hudson, R. L. (2004). The (Mis)Behavior of Markets: A Fractal View of Financial Turbulence. New York: Basic Books.
McGraw, P. N., and Menzinger, M. (2007). Analysis of nonlinear synchronization dynamics of oscillator networks by Laplacian spectral methods. Phys. Rev. E. 75:027104. doi: 10.1103/PhysRevE.75.027104
Newsweek (2022). Available online at: https://www.newsweek.com/eric-zemmour-far-right-pundit-often-compared-donald-trump-running-french-presidency-1654522
Plerou, V., Gopikrishnan, P., Rosenow, B., Amaral, L. A. N., and Stanley, H. E. (2002). A random matrix approach to cross-correlations in financial data. Phys. Rev. E. 65:066126. doi: 10.1103/PhysRevE.65.066126
Schreiber, T. (2000). Measuring information transfer. Phys. Rev. Lett. 85, 461–464. doi: 10.1103/PhysRevLett.85.461
Sornette, D., and von der Becke, S. (2011). “Crashes and high frequency trading,” in Swiss Finance Institute Research Paper No. 11–63. Available online at: https://papers.ssrn.com/sol3/papers.cfm?abstract_id=1976249
Su, Y., and Xiao, X. (2024). Intermedia attribute agenda setting between the U.S. mainstream newspapers and twitter: a two-study analysis of the paradigm and driving forces of the agenda flow. J. Mass Commun. Quart. 101, 451–476. doi: 10.1177/10776990231221150
Sugihara, G., May, R., Ye, H., Hsieh, C.-,h., Deyle, E., Fogarty, M., et al. (2012). Detecting causality in complex ecosystems. Science 338, 496–500. doi: 10.1126/science.1227079
Takens, F. (1981). “Detecting strange attractors in turbulence,” in Dynamical Systems and Turbulence, Warwick 1980, volume 898 of Lecture Notes in Mathematics, eds. D. A. Rand, and L.-S. Young (Cham: Springer), 366–381.
Wang, X., Sirianni, A. D., Tang, S., Zheng, Z., and Fu, F. (2020). Public discourse and social network echo chambers driven by socio-cognitive biases. Phys. Rev. X. 10:041042. doi: 10.1103/PhysRevX.10.041042
Watts, D. J., and Strogatz, S. H. (1998). Collective dynamics of ‘small-world' networks. Nature 393, 440–442. doi: 10.1038/30918
Weng, L., Menczer, F., and Ahn, Y.-Y. (2013). Virality prediction and community structure in social networks. Sci. Rep. 3:2522. doi: 10.1038/srep02522
Yan, H. Y., Yang, K.-C., Shanahan, J., and Menczer, F. (2023). Exposure to social bots amplifies perceptual biases and regulation propensity. Sci. Rep. 13:20707. doi: 10.1038/s41598-023-46630-x
Ye, H., Beamish, R. J., Glaser, S. M., Grant, S. C. H., Hsieh, C.-,h., Richards, L. J., et al. (2015). Equation-free mechanistic ecosystem forecasting using empirical dynamic modeling. Proc. Nat. Acad. Sci. 112, E1569–E1576. doi: 10.1073/pnas.1417063112
Keywords: complex networks, causal analysis, computational social sciences, political influence, social network, 6-measuring social network influence
Citation: Achitouv I and Chavalarias D (2025) Unveiling political influence through social media: network and causal dynamics in the 2022 French presidential election. Front. Polit. Sci. 7:1653101. doi: 10.3389/fpos.2025.1653101
Received: 24 June 2025; Accepted: 25 September 2025;
Published: 13 October 2025.
Edited by:
Régis Dandoy, Universidad San Francisco de Quito, EcuadorReviewed by:
Eduardo Barbabela, University of Lisbon, PortugalDhrubajyoti Ghosh, Duke University Hospital, United States
Copyright © 2025 Achitouv and Chavalarias. This is an open-access article distributed under the terms of the Creative Commons Attribution License (CC BY). The use, distribution or reproduction in other forums is permitted, provided the original author(s) and the copyright owner(s) are credited and that the original publication in this journal is cited, in accordance with accepted academic practice. No use, distribution or reproduction is permitted which does not comply with these terms.
*Correspondence: Ixandra Achitouv, SXhhbmRyYS5hY2hpdG91dkBjbnJzLmZy
†Present address: Ixandra Achitouv, LIP6 - Laboratoire d'Informatique - CNRS - Sorbonne Université, Paris, France
‡ORCID: Ixandra Achitouv orcid.org/0000-0001-9731-9381
David Chavalarias orcid.org/0000-0001-9485-1399