 Guillermo Armando Ronda-Pupo
- Departamento de Administración y Economía, Facultad de Ciencias Jurídicas y Empresariales, Universidad de La Frontera, Temuco, Chile
Scientometric indicators are useful to evaluate the relevance of scientific research, to prepare rankings, and to evaluate and inform research policies. That is why the choice of appropriate indicators is a matter of primary concern. This article aims to introduce a framework to decide the appropriate type of indicator for assessing the citation-based performance of complex innovation systems. The framework is two-fold: First, it brings the methodology to decide when the use of standard average based indicators is granted, and when scale-invariant indicators are mandatory. Second, it provides the procedures to build scale-invariant indicators to assess the relative impact of complex innovation systems. The framework is validated empirically through the evaluation of the relative impact of the Chilean science system in 2017. The result suggests that the Chilean science system has characteristics of a complex innovation system such as the distribution of citations fits to a power law with an exponential cutoff
Introduction
A major feature of frequency distributions of complex innovation systems productivity is their extreme skewness (Glänzel and Nacke, 1988; Braun et al., 1990). Generally, the research system's output such as the number of articles it publishes, the number of patents it registers, or the number of citations it receives, follow approximately a power-law with scaling exponent
The abovementioned handicap comes from the fact that distributions that approximately follow a power-law with exponent in the range
For any given system, a scale-invariant probability distribution is frequently associated with the system is ruled by self-organization and preferential attachment mechanisms or stated otherwise, that a cumulative advantage process is involved in its behavior (Katz, 2016b; Katz, 2016a). The exponent, also referred to as the scaling factor, of the output of a research system indicates an emergent property of the system, and it can be useful to prepare scale-invariant indicators to characterize it. The determination of the scaling exponent of such distributions is useful that it provides helpful information for decision-making processes with research evaluation purposes. Concretely, it determines when the mean and the standard variation characterize the population correctly, and when it cannot (Katz, 2016b). For example, when the distribution is a power-law with exponents
A second challenge to overcome when building or selecting indicators to assess the research performance of a research system, is the size dependency of citation-based measures (van Raan, 2008; van Raan, 2013; de Bellis, 2009). Regarding this, Martin (2011) posed the provoking question: “How can one come up with an appropriate ‘scale’ to assess and measure the impacts of very different magnitudes?” By way of illustration, how can the scientific community of China be compared with, for example, a country from Latin America? The use of population-based averages, such as citations per article, can produce misleading conclusions because of size-dependent bias. The scaling bias associated with these measures can be eliminated by using a normalization constant assessed through a scaling correlation between citations and articles to more accurately inform policy makers (Katz and Ronda-Pupo, 2019).
Scale-independent indicators are recursive. Any smaller system (field/subfield) contained within the more extensive complex system (domain) will have scale-invariant emergent properties, too (Katz, 2016b). The scale-invariant indicators are useful to compare without bias the research performance of scientific communities of vastly different dimensions, thereby allowing the performance of a small science system to be compared to the performance of a big-sized country or even to the world science system.
Scale invariance is mathematically defined as follows: if
This study aims to present a framework to assess the citation-based impact of research systems that are characterized by right-skewed distributions that could be described by power-law. The framework uses a two-fold methodology by using the properties of the distributions and the correlation parameters of size and impact of a given research system to decide on what type of indicator, namely scale-independent or average-based, is the appropriate one to be used. The results of such a methodology will lead to results that are unbiased in their formulation, presentation, and research policy information. Furthermore, the values obtained could be useful to compare the performance of the research system under analysis to local, national, regional, or world performances and also to prepare citation-based rankings. All these observations bring us to the following research questions:
How to build unbiased bibliometric indicators to accurately assess the citation-based performance of complex innovation systems?
Is it possible to compare accurately the research performance among complex innovation systems of vastly different sizes?
Background
Research evaluation is essentially important to research decision-making processes in research units at all levels, ranging from small research groups to universities and countries (Andras, 2011). The development of a comprehensive and valid research evaluation measure is a crucial precondition for assessing the performance of individual faculty members in academic institutions for promotion and reward purposes (Kirkpatrick and Locke, 1992). Research evaluation encompasses two main distinct groups of stakeholders: first, the government, as the primary research funder, and second, universities, which do the actual research (Johnston and Reeves, 2017).
The assessment of scientific performance within a research system has traditionally been applied through measurements of the number of documents published in peer review journals, for example, those included in the WoS or/and Scopus, by an author affiliated to an institution, a country, a field or a domain and subsequently, the number of citations these articles receive (Pan and Fortunato, 2014). Garfield (2014) persuasively stated, “Citations have become the currency of scholarship.” This idea is substantiated by international research evaluation associations quantifying research quality by using citation-based indicators.
Despite the general acceptance of the use of citation-based indicators for research evaluation purposes, the construction of unbiased measures to accurately assess the performance of a research system is an ongoing challenge. The skewness of citation distributions and the size dependence of citations are among the most challenging issues to accurately build and use unbiased bibliometric indicators to evaluate the performance of a research system (Seglen, 1992; van Raan, 2014b). Attempts to overcome these issues have led to even more complicated and burdensome mechanisms for assessing research performance (Martin, 2011). As Lepori et al. (2011) points out: “Predicting the future performance of research systems has become a difficult assignment which cannot be attended by only financial indicators.”
The scientometric models that are aimed at assessing the impact that articles have on the research community traditionally are built on the number of citations those articles attract. Furthermore, models and indicators reflecting scientific influence on science itself can be classified into two groups namely, 1) traditional models and indicators based on primary publication and citation counts or averages and rankings based on these indicators–an in-depth discussion on these indicators can be found in Waltman (2017) and for its limitations see van Raan (2014a), or 2) models and indicators built on the assumption of the skewed nature of citations counts–for a theoretical and methodological discussions see (Katz, 2005). A unified model that considers both approaches is lacking in the literature. Specifically, it is crucial to have a framework that accurately indicates when to use one or the other of the two approaches mentioned to guarantee that the results are unbiased. A correct choice will ensure that resulting evaluations and policy formulations are not biased.
The framework proposed in this contribution is illustrated by an evaluation of the relative impact of a small science system’s scientific production, namely, Chile in 2017.
Materials and Methods
The methodology used is two-fold; first, to decide what type of indicators should be used, and second, to assess the relative impact of a domain/field/subfield.
Figure 1 shows the flowchart of the framework. The procedure consists of three main steps with associated tasks depending on specific situations. Each of the steps is explained below.
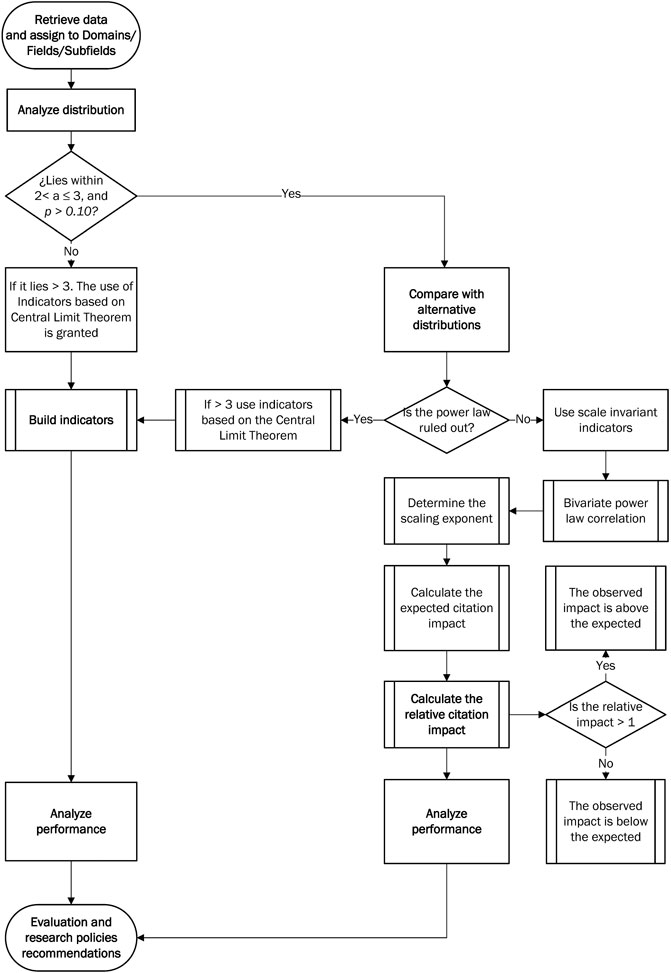
FIGURE 1. Flowchart of the framework to assess the citation performance of complex innovation systems.
First Step: Retrieving and Preparing the Data for Quantitative Analysis
The Data Retrieval Strategy
The aim of this step is to retrieve and organize the data for quantitative analysis. The data for the study consist of articles and reviews published by researchers from Chile in the fields of the domains such as Applied Sciences, Economics and Social Sciences, Health Sciences, and Natural Sciences included in the Clarivate Analytics Web of Science™ Core Collection.
Assigning Articles to a Unique Field
This step aims to assign each article to a unique domain/field/subfield. The classification of scientific information into an appropriate subject fields is one of the essential preconditions of valid scientometric studies (Haddow, 2015). van Leeuwen and Calero Medina (2012) suggest that the cataloging of publications in the citation indexes with a more in-depth taxonomy scheme would help the assessment of research performance. Herranz and Ruiz-Castillo (2012) stated that about 42% of the documents published in Clarivate Analytics are assigned to between two and up to a maximum of six subfields. This setting generates a drawback in research evaluation using the number of citations. The Science Metrix journal classification ontology overcomes this limitation (Archambault et al., 2015). The Science Metrix journal classification ontology is available under a common creative license. Furthermore, many proficient bibliometricians participated in its formulation. The specific journals are consigned to a unique, mutually exclusive domain/field/subfield using a hybrid procedure conjoining algorithmic techniques and expert judgment (Ronda-Pupo and Katz, 2017). Table 1 presents the research fields studied.
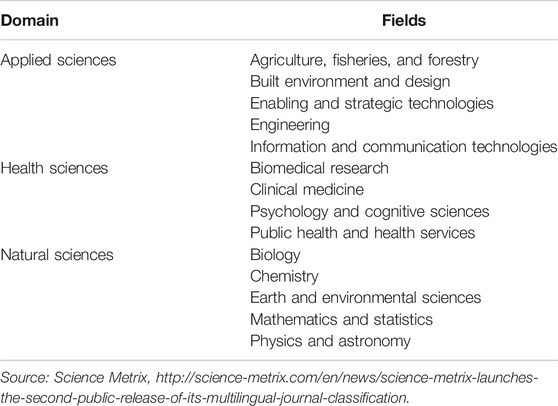
TABLE 1. Domains and fields according to Science Metrix journal classification.
Second Step: Analyzing the Citation Distribution
This step aims to analyze the distribution of citation counts of the publications of the complex innovation system under analysis. Since innovation systems are dynamic and evolve with time, the evolution of a distribution may have to be taken into consideration when determining which functional form is the best fit (Katz 2016). Many computer programs have been created to analyze heavy tail distributions, that is, LOTKA (Rousseau and Rousseau, 2003) and PoweRlaw (Gillespie, 2015; Clauset et al., 2009).
The framework uses Clauset et al. (2009) routine to test the hypothesis of the power-law distribution. The algorithm encompasses three tasks. 1) The assessment of the point where the tail starts
Third Step: Preparing the Scale-Invariant Indicators
This step aims to evaluate the relative impact of the domains under analysis. It involves the following tasks: finding the scaling factor of the relationship between size and impact as well as calculating the expected and the relative impact (Ronda-Pupo, 2019). The estimate of the relative impact involves the following tasks: 1) calculating the scaling factor of the relationship between size, and impact, 2) estimating the expected impact, and 3) computing the relative impact.
Below, we describe each step.
The Scaling Correlation Between Size and Impact
This step aims to establish the standardization constant. It also looks to find out the exponent of the scaling association between the impact and size. Scaling correlations can occur when entities in a scale-invariant distribution are aggregated into natural groups; for example, when peer-reviewed articles are aggregated into fields (Katz, 2016). Then, a scaling correlation between the impact of a field measured using citations and field size measured using numbers of published articles exists.
The exponent is an extent of the “Matthew Effect,” or the cumulative advantage of citation impact on the size of the system (Katz, 2016b; Ronda-Pupo, 2017).
Variables
Size
According to Merriam-Webster (2018) dictionary, size is defined as “physical magnitude, extent, or bulk: relative or proportionate dimensions.” The size
Si is the production of the field
Impact
Traditionally, the citation impact is expressed as the fraction between the citations and articles (Seglen, 1992).
The Model
The statistical assumptions to run this analysis are as follows: 1) the source population is normally distributed, 2) a constant variance of the dependent variable in the source population, and 3) the independence of residuals. We use Eq. 3 to establish the regression parameters:
Here,
The parameters
The Predictive Ability of the Model
To evaluate the predictive ability of the model, we used the predicted residual error sum of squares (PRESS). This statistics is a quantity of how well the power-law model forecasts new data. The smaller the PRESS statistics, the better the predictive power of the model. The PRESS statistics is calculated by summing the squares of the prediction errors.
Building the Scale-Invariant Indicator
The Expected Impact
This step aims to define the expected impact of the systems under analysis, according to its size. The assumption is that the number of citations a research system receives is dependent on its size. The bigger the system is, the more citations it receives. To overcome possible bias in the results, we may answer the question: How many citations are expected the system should receive according to its size? As an example, to answer this question, we substitute
The expected impact (
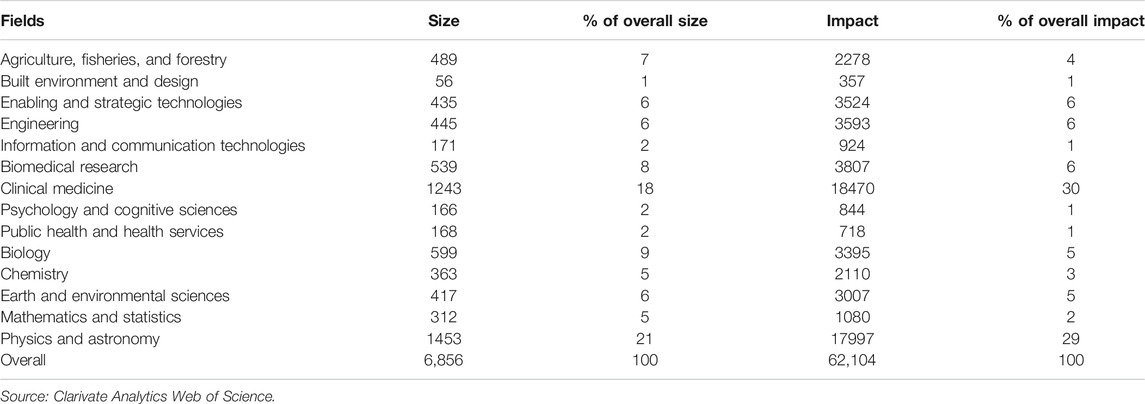
TABLE 2. The Chilean science system size and impact, at the field level, in 2017.
The Observed Impact
The observed impact is just the number of citations the articles of the field received in the slice of time analyzed. In the case of Chilean research on Physics and Astronomy the observed impact is 17,997 (see Table 2).
The Relative Impact
This step aims to define the relative impact (
Following the example of the field Physics and Astronomy, the relative impact is
Using the Scale-Invariant Indicator to Evaluate the Citation Performance
The objective of this phase is to evaluate what the impact of the domain is according to its size. The interpretation of the results is as follows:
If the relative impact RI is equal to one, there is not a cumulative advantage of the system on its size:
If the value of the relative impact is higher than one, the observed impact is over what is expected. The domain is displaying a cumulative advantage as its size increases:
Conversely, if the relative impact is less than the unity, the observed impact is under what it is estimated to be according to its size. The system is not returning much impact as expected, giving to its size. The system is displaying a cumulative disadvantage or negative Matthew Effect as its size increases (Katz and Cothey, 2006).
If one uses this indicator to prepare ranks and/or to compare research assessment among systems of dissimilar sizes, the one with the greater relative impact,
The value
Results
The Citation-Based Performance of the Chilean Science System in 2017
First Step: The Data
The data for the experiment consists of 6,856 articles and reviews published by Chilean researchers in the Clarivate Analytics Web of Science database in 2017 that received 62,104 citations, considering a fixed three-year citation window. We include only the documents published in the fields of the domains such as Applied Sciences, Health Sciences, and Natural Sciences, using the Science Metrix journal classification schema.
Table 2 presents the size and the impact of each field. Four fields (39%) accounted for 54% of the overall productivity, and 69% of the overall impact of the Chilean science system.
Second Step: The Analysis of the Distribution
The exponent of the distribution of the citations is
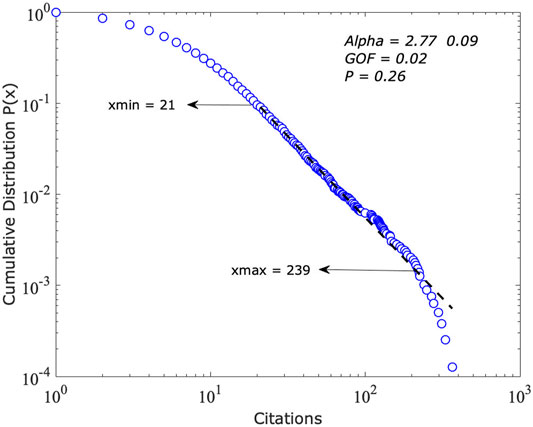
FIGURE 2. The cumulative distribution function of citations of the power-law model; x = citations.

TABLE 3. Results of fitting the power law to the citation distribution.
Table 4 presents the outcomes of comparing the power-law to competing distributions. The power-law distribution is ruled out by the power-law with cutoff

TABLE 4. Results of the comparison of the power law with alternative distributions.
Third Step: Preparing the Scale-Invariant Indicators
The Correlation Between Impact and Size
The population normality around the regression line

FIGURE 3. Power-law correlation of impact on size.
The Relative Impact
Table 5 shows that the relative impact of the fields Built Environment and Design, Biomedical Enabling and Strategic Technologies, Engineering, Information and Communication Technologies, Clinical Medicine, Earth and Environmental Sciences, and Physics and Astronomy is above the expected according to their sizes
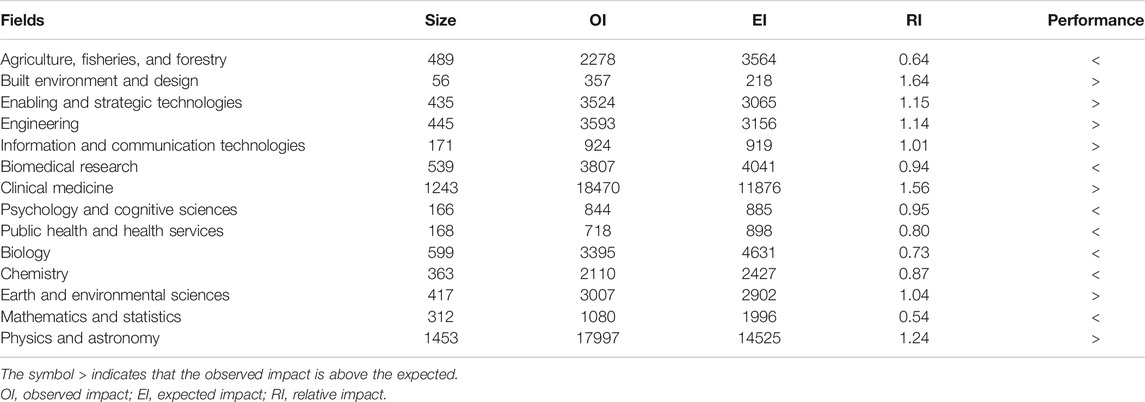
TABLE 5. The observed, expected, and relative impact of the Chilean science system.
Built Environment and Design show the highest relative impact. The impact of this field shows a high citation-based performance according to its size. This field is ranked first with an observed impact about 22 times less than the field ranked second, Clinical Medicine. This field would be placed in the seventh place using standard average impact measures. The results suggest that the use of size independent measures is a correct choice to evaluate the citation-based performance of scientific fields, and to compare or prepare rankings of research systems of pronounced differences in size.
Discussion and Final Remarks
Chile is placed fourth in Latin America according to its scientific production in the Web of Science. Katz (2016b) claimed: “The global research system has the general characteristics of a complex system,” and then pose the hypothesis if it can be revealed that a property is scale-invariant at higher levels of aggregation; then it can be assumed with increased conviction that it is expected to be scale-invariant at low levels too. The results support the Katz (2016b) suggestion. The Chilean science system as a scaled level of the world science system is a complex innovation system too. It is characterized by scale-invariant properties such as the following.
The Distribution of Citations Follows a Power Law With Exponential Cutoff
A power-law with an exponential cutoff
As a practical implication, the result brings the empirical evidence to the Chilean policy makers to correctly decide the appropriate quantitative indicators to evaluate the Chilean innovation system’s citation impact.
The Scaling Correlation Between Size and Impact
The relationship between impact and size show a scaling relationship according to a power-law with an exponent
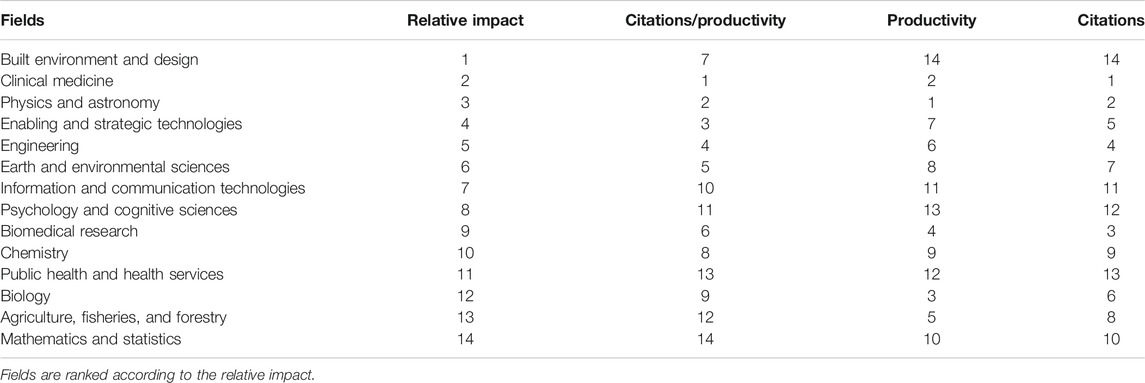
TABLE 6. Ranking using diverse scientometric indicators.
The resulting scaling exponent
Scale-Independent Measures and Policy Evaluation
The scale-independent measure prepared is useful to evaluate the research fields’ relative impact. Table 6 shows rankings prepared using different scientometric indicators. Built Environment and Design, is placed last in the ranking according to its productivity, last according to the number of citations, seven according to its average citations is placed first if the ranking is prepared using the scale-invariant indicator, namely the relative impact. This result reaffirms the effectiveness of the scale-free indicators to prepare rankings, and to compare the performance among fields of vastly different sizes. It is possible to compare the impact of a research field, namely Built Environment and Design to another that is 22 times bigger in size, and achieve a better performance. This result shows the efficacy of the scale-invariant functions used to create the scale-free model used. These measures ensure that policy makers get a reliable evidence-based view of the innovation systems that are the focus of their policies. This result answers the second research question of the study.
The Chilean science system is a young small research system whose citation network shows scale-invariant properties. The result suggests the Chilean policy-making agencies as Agencia Nacional de Investigación y Desarrollo (ANID) and funding institutions as Fondo Nacional de Desarrollo Científico y Tecnológico (FONDECYT) should pay special attention to the scale-invariant properties of the Chilean innovation system with research assessment purposes. The use of standard average evaluation indicators like citations per article would bring biased results. The formulation or information of public research policies based on those results will be misleading. Furthermore, the results suggest that the Chilean research evaluation policy should use scale-invariant indicators and enhance a mix of quantitative and qualitative indicators to bring a more insightful evidence-based research quality evaluation and avoid the overuse of journals’ impacts on the research assessment processes.
Future research is advised to perform thorough comparisons on the effect that field-normalized and scale-adjusted measures have on the rankings of performance measures from distributions with scaling exponents
Data Availability Statement
The datasets presented in this article are not readily available because the author confirms that, for approved reasons, some access restrictions apply to the data underlying the findings. The data have been obtained from Clarivate Analytics' Web of Science through the Chilean National Foundation for Science and Technology (FONDECYT) agreement with Clarivate Analytics who do not allow making the data freely available. Requests to access the datasets should be directed to Clarivate Analytics Web of Science.
Author Contributions
GARP conceived and designed the experiments, performed the experiments, analyzed the data, contributed reagents/materials/analysis tools, and wrote the article.
Funding
FONDECYT Chile financed this research. Grant/Award: 1180200.
Conflict of Interest
The author declares that the research was conducted in the absence of any commercial or financial relationships that could be construed as a potential conflict of interest.
Acknowledgments
The author thanks Editor Vivian Cothey and the two reviewers for encouraging comments to a previous version of the manuscript. Also, the author is grateful to J. Sylvan Katz for motivating discussions on power-law analysis, and Ronald Rousseau and Lutz Bornmann for stimulating suggestions.
References
Andras, P. (2011). Research: metrics, quality, and management implications. Res. Eval. 20 (2), 90–106. doi:10.3152/095820211x12941371876265
Archambault, É., Beauchesne, O. H., and Caruso, J. (2015). Towards a multilingual, comprehensive and open scientific journal ontology. Available at: http://www.science-metrix.com/pdf/Towards_a_Multilingual_Comprehensive_and_Open.pdf (Accessed March 30, 2016).
Bornmann, L. (2013). How to analyze percentile citation impact data meaningfully in bibliometrics: the statistical analysis of distributions, percentile rank classes, and top-cited papers. J. Am. Soc. Inf. Sci. Tec 64 (3), 587–595. doi:10.1002/asi.22792
Bornmann, L., and Leydesdorff, L. (2017). Skewness of citation impact data and covariates of citation distributions: a large-scale empirical analysis based on web of science data. J. Informetr. 11 (1), 164–175. doi:10.1016/j.joi.2016.12.001
Braun, T., Glänzel, W., and Schubert, A. (1990). Publication productivity: from frequency distributions to scientometric indicators. J. Inf. Sci. 16, 37–44. doi:10.1177/016555159001600107
Brookes, B. C. (2016). “Sources of information on specific subjects” by S.C. Bradford. J. Inf. Sci. 10 (4), 173–175. doi:10.1177/016555158501000406
Castellani, B., and Rajaram, R. (2016). Past the power law: complex systems and the limiting law of restricted diversity. Complexity 21 (S2), 99–112. doi:10.1002/cplx.21786
Clauset, A., Shalizi, C. R., and Newman, M. E. J. (2009). Power-law distributions in empirical data. SIAM Rev. 51 (4), 661–703. doi:10.1137/070710111
Coile, R. C. (1977). Lotka's frequency distribution of scientific productivity. J. Am. Soc. Inf. Sci. 28 (6), 366–370. doi:10.1002/asi.4630280610
de Bellis, N. (2009). Bibometrics and citation analysis: fron the science citation index to cibermetrics. Toronto: The Scarecrow Press, Inc.
de Solla Price, D. J. (1965). Networks of scientific papers. Science 149 (3683), 510–515. doi:10.1126/science.149.3683.510
Dorogovtsev, S. N., and Mendes, J. F. F. (2000). Scaling behaviour of developing and decaying networks. Europhys. Lett. 52 (1), 33–39. doi:10.1209/epl/i2000-00400-0
Egghe, L. (2005). Powerlaws in the information production process: Lotkaian informetrics. Uk: Elsevier Academic Press.
Egghe, L., and Rousseau, R. (1986). A characterization of distributions which satisfy Price's Law and consequences for the Laws of Zipf and Mandelbrot. J. Inf. Sci. 12 (4), 193–197. doi:10.1177/016555158601200406
Frame, J. D., and Carpenter, M. P. (1979). Int. Res. Collaboration. Soc. Stud. Sci. 2, 481–497. doi:10.1177/030631277900900405
Garfield, E. (2014). 50 years of citation indexing: a visit with Dr. Eugene Garfield. Manhattan, NY: Thomsom ReutersAvailable at: https://www.youtube.com/watch?v=2kZ0_5HTYDQ (Accessed August 27, 2020).
Gillespie, C. S. (2015). Fitting heavy tailed distributions: the poweRlaw package. J. Stat. Softw. 64 (2), 1–16. doi:10.18637/jss.v064.i02
Glänzel, W., and Nacke, O. (1988). “Distributions in bibliometrics: significance and analysis,” in Proceedings of the “Deustscher Documentartag”, Aachen. Chennai: FRG, 88.
Haddow, G. (2015). Research classification and the social sciences and humanities in Australia: (Mis)Matching organizational unit contribution and the impact of collaboration. Res. Eval. 24, 325–339. doi:10.1093/reseval/rvv006
Herranz, N., and Ruiz-Castillo, J. (2012). Sub-field normalization in the multiplicative case: high- and low-impact citation indicators. Res. Eval. 21 (2), 113–125. doi:10.1093/reseval/rvs006
Johnston, J., and Reeves, A. (2017). Assessing research performance in UK universities using the case of the economics and econometrics unit of assessment in the 1992–2014 research evaluation exercises. Res. Eval. 26, rvw021. doi:10.1093/reseval/rvw021
Katz, J. S., and Cothey, V. (2006). Web indicators for complex innovation systems. Res. Eval. 15 (2), 85–95. doi:10.3152/147154406781775922
Katz, J. S. (1999). The self-similar science system. Res. Pol. 28 (5), 501–517. doi:10.1016/S0048-7333(99)00010-4
Katz, J. S. (2000). Scale-independent indicators and research evaluation. Sci. Public Pol. 27 (1), 23–36. doi:10.3152/147154300781782156
Katz, J. S. (2005). Scale-independent bibliometric indicators. Meas. Interdiscip. Res. Perspective 3 (1), 24–28. doi:10.1207/s15366359mea0301_3
Katz, J. S. (2016a). “Policies considerations for evidence-based measures of complex innovation systems,” in SPRU 50th Aniversary Conference, September 5-9, 2016. Sussex, United Kingdom: University of Sussex.
Katz, J. S. (2016b). What is a complex innovation system? PLos One 11 (6), e0156150e0156150. doi:10.1371/journal.pone.0156150
Katz, J. S., and Ronda-Pupo, G. A. (2019). Cooperation, scale-invariance and complex innovation systems: a generalization. Scientometrics 121, 1045–1065. doi:10.1007/s11192-019-03215-8
Kirkpatrick, S. A., and Locke, E. A. (1992). The development of measures of faculty scholarship. Group Organ. Manage. 17 (1), 5–23. doi:10.1177/1059601192171002
Leguendre, P., and Leguendre, L. (2012). “Numerical ecology,” in Developments in environmental modelong. 3 ed. (Great Britain: Elsevier B. V), Vol. 24.
Lepori, B., Reale, E., and Tijssen, R. (2011). Designing indicators for policy decisions: challenges, tensions and good practices: introduction to a special issue. Res. Eval. 20 (1), 3–5. doi:10.3152/095820211x12941371876229
Lotka, A. J. (1926). The frequency distribution of scientific productivity. J. Wash. Acad. Sci. 16 (12), 317–323. Available at: http://www.jstor.org/stable/i24527553.
Martin, B. R. (2011). The Research Excellence Framework and the 'impact agenda': are we creating a Frankenstein monster? Res. Eval. 20 (3), 247–254. doi:10.3152/095820211x13118583635693
Merriam-Webster (2018). Merriam Webster dictionary. Available at: https://www.merriam-webster.com/dictionary (Accessed August 26, 2020).
Milojevic, S. (2010). Power law distributions in information science: making the case for logarithmic binning. J. Am. Soc. Info. Sci. Tech. 61 (12), 2417–2425. doi:10.1002/asi.21426
Naranan, S. (1970). Bradford's law of bibliography of science: an interpretation. Nature 227 (5258), 631–632. doi:10.1038/227631a0
Naranan, S. (1971). Power law relations in science bibliography-a self‐consistent interpretation. J. Documentation 27 (2), 83–97. doi:10.1108/eb026510
Naranan, S. (1989). “Power law” version of Bradford's law: statistical tests and methods of estimation. Scientometrics 17 (3-4):211–226. doi:10.1007/Bf02026411
Newman, M. (2005). Power laws, Pareto distributions and Zipf's law. Contemp. Phys. 46 (5), 323–351. doi:10.1080/00107510500052444
Newman, M. E. J. (2011). SIGMETRICS posting. Available at: http://mail.asis.org/mailman/private/sigmetrics/2011-September/005797.html (Accessed August 10, 2020).
OluicVukovic, V. (1997). Bradford’s distribution: from the classical bibliometric ‘‘Law’’ to the more general stochastic models. J. Am. Soc. Info. Sci. Tech. 48 (9), 833–842. doi:10.1002/(SICI)1097-4571(199709)48:9<833::AID-ASI7>3.0.CO;2-S
Pan, R. K., and Fortunato, S. (2014). Author Impact Factor: tracking the dynamics of individual scientific impact. Sci. Rep. 4, 4880. doi:10.1038/srep04880
Pao, M. L. (1986). An empirical examination of Lotka's law. J. Am. Soc. Inf. Sci. 37 (1), 26–33. doi:10.1002/asi.463037010510.1002/(sici)1097-4571(198601)37:1<26::aid-asi4>3.0.co;2-z
Rajaram, R., and Castellani, B. (2016). An entropy based measure for comparing distributions of complexity. Phys. A: Stat. Mech. its Appl. 453, 35–43. doi:10.1016/j.physa.2016.02.007
Ronda-Pupo, G. A., and Katz, J. S. (2017). The scaling relationship between citation-based performance and coauthorship patterns in natural sciences. J. Assoc. Inf. Sci. Technol. 68 (5), 1257–1265. doi:10.1002/asi.23759
Ronda-Pupo, G. A. (2017). The citation-based impact of complex innovation systems scales with the size of the system. Scientometrics 112 (1), 141–151. doi:10.1007/s11192-017-2401-3
Ronda-Pupo, G. A. (2019). The performance of Latin American research on economics & business. Scientometrics 122, 573–590. doi:10.1007/s11192-019-03300-y
Rousseau, B., and Rousseau, R. (2003). LOTKA: a program to fit a power law distribution to observed frequency data. Int. J. Scientometrics, Informetrics Bibliometrics 4 (1), 1–6.
Seglen, P. O. (1992). The skewness of science. J. Am. Soc. Inf. Sci. 43 (9), 628–638. doi:10.1002/(sici)1097-4571(199210)43:9<628::aid-asi5>3.0.co;2-0
Seglen, P. O. (1997). Why the impact factor of journals should not be used for evaluating research. Br. Med. J. 314, 498–502. doi:10.1136/bmj.314.7079.497
Smith, R. J. (2009). Use and misuse of the reduced major axis for line-fitting. Am. J. Phys. Anthropol. 140 (3), 476–486. doi:10.1002/ajpa.21090
van Leeuwen, T. N., and Calero Medina, C. (2012). Redefining the field of economics: improving field normalization for the application of bibliometric techniques in the field of economics. Res. Eval. 21 (1), 61–70. doi:10.1093/reseval/rvr006
van Raan, A. F. J. (2006). Statistical properties of bibliometric indicators: research group indicator distributions and correlations. J. Am. Soc. Inf. Sci. 57 (3), 408–430. doi:10.1002/asi.20284
van Raan, A. F. J. (2008). Scaling rules in the science system: influence of field-specific citation characteristics on the impact of research groups. J. Am. Soc. Inf. Sci. 59 (4), 565–576. doi:10.1002/asi.20765
van Raan, A. F. J. (2013). Universities scale like cities. PLoS One 8 (3), e59384e59384. doi:10.1371/journal.pone.0059384
van Raan, A. F. J. (2014a). Advances in bibliometric analysis: research performance assessment and science mapping. Dordretch: Portland Press.
van Raan, A. F. J. (2014b). “Bibliometrics: use and abuse in the review of research performance,” in Advances in bibliometric analysis: research performance assessment and science mapping. Editors W Blockmans, L. Engwall, and D. Weaire (London, UK: Portland Press), 17–28.
van Raan, A. F. J. (2020). Urban scaling, geography, centrality: relation with local government structures. PLoS One 15 (9), e0238418e0238418. doi:10.1371/journal.pone.0238418
Waltman, L. (2017). A review of the literature on citation impact indicators. ArXiv. Available at: https://arxiv.org/abs/1507.02099 (Accessed September 18, 2017).
Keywords: citation impact analysis, complex innovation system, national science systems, power-law, scale-independent, self-similarity, relative impact
Citation: Ronda-Pupo GA (2021) A Framework to Assess the Citation Performance of Complex Innovation Systems. Front. Res. Metr. Anal. 6:622006. doi: 10.3389/frma.2021.622006
Received: 27 October 2020; Accepted: 18 February 2021;
Published: 26 April 2021.
Edited by:
Viv Cothey, Independent researcher, London, United KingdomReviewed by:
Aparna Basu, National Institute of Science, Technology and Development Studies (CSIR), IndiaFélix de Moya Anegón, SCImago Research Group, Spain
Copyright © 2021 Ronda-Pupo. This is an open-access article distributed under the terms of the Creative Commons Attribution License (CC BY). The use, distribution or reproduction in other forums is permitted, provided the original author(s) and the copyright owner(s) are credited and that the original publication in this journal is cited, in accordance with accepted academic practice. No use, distribution or reproduction is permitted which does not comply with these terms.
*Correspondence: Guillermo Armando Ronda-Pupo, Z3VpbGxlcm1vLnJvbmRhQHVmcm9udGVyYS5jbA==, Z3JvbmRhQHVjbi5jbA==