Abstract
Quantitative monitoring and measurement of hand motion in children are crucial to support healthy development. Electrical impedance tomography-based tactile sensors, also known as tomographic tactile sensors, provide a promising approach for grasp classification. Our previous study in adults and children demonstrated the feasibility of pinch classification using a cylindrical device equipped with the tomographic tactile sensor. In this study, we developed a new sensing device to classify the power grip and precision grip in children. In order to address concerns that children might lick or swing the device, a cylindrical sensing device was integrated sensor and measurement circuit, incorporated a protective layer for enhanced safety. Seventeen children participated in an experiment to evaluate the feasibility of the grasp classification. The classification features were voltage vectors and reconstructed images obtained from the sensor, and two machine learning methods were used as the classifiers. The average classification accuracy exceeded 85% for both feature types, surpassing the chance level of 50%. These results demonstrate that the basic grasp patterns in children can be accurately classified using a tomographic tactile sensor. This study provides new insights into the future application of grasp motion classification in children.
1 Introduction
Humans have uniquely developed manual dexterity and built an advanced civilization using tools through motions, such as gripping a hammer and pinching nails. Napier divided these grasps into two basic definitions: power grip and precision grip (Napier, 1956). The power grip is defined as a motion that involves grasping an object with the palm and thumb and corresponds to the motion of gripping a hammer. This grasping is observed in healthy infants at 25 weeks post-pregnancy (Allen and Capute, 1986). On the other hand, precision grip is defined as a motion in which an object is pinched between the thumb and other fingers, corresponds to the motion of pinching nails. A study analyzing grasping patterns through video coding in infants between 2 and 22 weeks of age reported that the pre-precision grip was first performed at 2.74 months of age and the precision grip was first performed at 5.97 months of age (Wallace and Whishaw, 2003).
These grasping motions are related to various aspects of the infant and child development. For example, some studies have suggested that fine motor skills (FMS) associated with precision grip are related to early numerical skills, early counting, and conceptual counting knowledge (Barrocas et al., 2020; Fischer et al., 2018; Suggate et al., 2017). Another study reported that children who were trained in FMS through intervention improved not only their pegboard test scores but also their mathematical performance compared to a control group that read books (Asakawa et al., 2019). Moreover, some studies have indicated a potential correlation between the FMS and reading and writing abilities (Lê et al., 2023; Suggate et al., 2023). These findings suggest that children’s hand dexterity is related to the development of academic abilities such as mathematical, reading, and writing skills.
In addition, information on children’s grasping skill development is beneficial from a medical perspective. A delay in the development of infant FMS has been suggested as a useful indicator for early diagnosis of developmental disorders. Autism spectrum disorder (ASD), which is characterized by poor communication, strong interest, preoccupation, and obsessive behavior, is usually diagnosed at 3 years of age. However, some prospective studies have reported that infants at high risk for ASD, who were later diagnosed with the condition exhibited developmental delays in fine motor skills compared to typically developing infants (Choi et al., 2018; Landa and Garrett-Mayer, 2006). It has also been reported that children of ages five to ten with attention deficit hyperactivity disorder (ADHD), which is characterized by inattention, hyperactivity, and impulsiveness, have significantly delayed motor development in all domains of the Motor Development Scale, including the FMS, compared to typically developing children (Neto et al., 2015).
In this context, quantitative techniques for monitoring and measuring hand motion in infants and children are important, because they are believed to contribute to healthy development. According to a review by Xue et al., human hand motion analysis can be classified into five methods: 1) data glove-based capturing; 2) attached force-based capturing; 3) surface electromyography-based capturing; 4) optical markers-based capturing; and 5) vision-based capturing (Xue et al., 2019). Based on the review, conventional devices for children listed in Table 1. Although these methods have unique advantages, they have unavoidable limitations. For example, the methods of 1) data glove-based capturing, 3) surface electromyography-based capturing, and 4) optical marker-based capturing require sensors to be attached. This could lead to a decrease in the children’s attention and interfere with their grasp. In addition, the method of 5) vision-based capturing has some limitations, such as a limited angle of view and privacy. Owing to these limitations, 2) attached force-based capturing is considered a powerful method. However, the conventional method limited the degree of freedom of shape and identification of contact area. To overcome these limitations, we focused on a tomographic tactile sensor based on resistive coupling, which is a sensing technology with extended flexibility, shape versatility, and designability compared with electrical impedance tomography (EIT)-based tactile sensors (Yoshimoto et al., 2024; 2020). This technology is based on the principles of EIT-based tactile sensors (Kato et al., 2007; Nagakubo et al., 2007; Silvera-Tawil et al., 2015).
TABLE 1
| Reference | Method | Classification of hand motion | Does not interfere with grasping | Angle of view | Degree of freedom of shape | Identification of contact area | Division by Xue et al. (2019) |
|---|---|---|---|---|---|---|---|
| Wallace and Whishaw (2003) | Video coding | Intra-rater and inter-rater reliability were 90% and 74%, respectively, with four grasp patterns | No | Limited | High | Partially possible | 5) vision-based capturing |
| Campolo et al. (2008) | Hemispherical sensing devices using force sensors and kinematic sensor | Not reported | No | Not limited | Unclear | Not reported | 2) attached force-based capturing |
| Boschi and Frère (2013) | Sensing devices using limit switches, micro switches | The agreement from the physical therapists and the system was 86.6% for five different movements | No | Not limited | Low | Partially possible | 2) attached force-based capturing |
|
Del Maestro et al. (2011)
Serio S et al. (2013) (Serio et al., 2013) |
Sensing device using air pressure sensor | Not reported | No | Not limited | Low | Impossible | 2) attached force-based capturing |
| Rocha et al. (2016) | Cylindrical sensing device digital camera, a special convex mirror, and IMU sensor | A preliminary hand posture evaluation was reported, though visually performed, suggesting the possibility of future application | No | The image quality degrades at the vertex part of the convex mirror when converted to panoramic format | Unclear | Possible | 2) attached force-based capturing & 5) vision-based capturing |
| Schröer et al. (2021) | Optical motion capture | Recording of hand motion (reaching) | Possible interference | Not limited | Unclear | Impossible | 4) optical markers-based capturing |
| Owada et al. (2022) | Data glove | Classified eight grasps with an accuracy of 98.75% in a study of adults (Pratap et al., 2024) | Possible interference | Not limited | High | Partially possible | 1) data glove-based capturing |
| Udayagiri et al. (2024) | Optical force sensors | Classified four actions of adults with an accuracy of approximately 100% | No | Not limited | High | Not reported | 2) attached force-based capturing |
| Battraw et al. (2024) | Surface electromyography | Nine participants with unilateral congenital below-elbow deficiency were classified into 11 hand movements, with a maximum accuracy of 95.37% using KNN. | Possible interference | Not limited | Unclear | Impossible | 3) surface electromyography-based capturing |
| Our study | Tomographic tactile sensor based on resistive coupling | The maximum average accuracies classed by power grip or precision grip was 88.5% | No | Not limited | High | Possible | 2) attached force-based capturing |
Conventional classification method of infants’ and children’s hand motions.
Park et al. reported the superior discriminability of touch modalities using a tomographic tactile sensor (Park et al., 2021). Additionally, we developed a small peg-based device and demonstrated that six types of pinching in adults could be classified with an accuracy exceeding 80% (Asahi et al., 2024b). In children, we have reported a classification study on the same six types of pinching. The results showed an accuracy of approximately 60%, which was lower than that of adults, revealing limitations and challenges in classifying children’s hand motion (Asahi et al., 2024a).
Children’s hands differ from those of adults in terms of size, grip strength, and dexterity (Bear-Lehman et al., 2002). Consequently, results obtained from adult participants may not be directly applicable to children. Moreover, protective measures for the device and an extension of its swing range are necessary, as children may lick or swing the device. Considering these factors, as a first step toward developing a hand motion analysis system for children, we focused on the fundamental classification of power grip and precision grip defined by Napier (1956), along with the implementation of protective measures and an extended swing range. Thus, demonstrating the ability to classify power and precision grips in this study represents an essential step toward more comprehensive and generalized grasp classifications. Our findings may contribute to the development of educational toys and diagnostic systems for assessing developmental disabilities.
2 Materials and methods
2.1 Sensing device overview
2.1.1 Development of sensing devices
Regarding the development of sensing device, we first decided the design requirements of the device. The previous devices had measurement circuits outside the device. This limits their swing range and portability. To overcome these limitations, we developed a new cylindrical sensing device. It could contain the measurement circuit (Figure 1). The device height and diameter were 85 mm and 40 mm, respectively. The sensor consists of five layers: protective, driving, insulating, detection, and electrode layers (Figure 2a). The protective layer was added because the children torn through the drive layer during the preliminary experiments. The protective layer consisted of a 1-mm-thick yellow felt cloth. The driving layer consisted of a conductive silicone sheet (EC-20BH, Shin-Etsu Chemical Co. Ltd.). This layer was connected to a 3.3 V DC voltage source. The DC voltage source used a 3.3 V pin microcontroller (ESP32-DevKitC, Espressif Systems). The insulating layer was a glass fiber sheet (13-7127, KLASS). The detection layer was composed of a conductive sheet (ZC-85, ENGINEER) with a surface resistance of 10 kΩ/sq. When the driving layer contacts with the detection layer, the electrical circuit is closed. As a result, current flows to the electrodes through the detection layer (Figure 2b). The electrode and detection layer were bonded using a conductive epoxy (CW2400, CircuitWorks). The electrode layer was an original flexible printed circuit board with 16 electrodes and a diameter of 2 mm. One of these electrodes was used as the ground condition and the other was used as the measurement electrode. This operation was repeated until all electrodes were used in all conditions. Thus, 256 voltage data points (16 grounding conditions × 16 electrodes) are obtained. The multiplexer (MUX) used was CD74HC4067 (Texas Instruments). The measurement period was 0.25 s per frame.
FIGURE 1

Cylindrical sensing device. (a) Height: 85 mm (b) Diameter: 40 mm. (c) Device containing the measurement circuit.
FIGURE 2

(a) Layer of tomographic tactile sensors based on resistive coupling. The protective layer was a yellow felt cloth. This layer was used only in experiment I. A conductive silicone sheet connected to a DC voltage source (3.3 V) was used was as the driving layer. The insulating layer was a glass fiber sheet. The detection layer was a conductive sheet. The electrode layer was a flexible printed circuit board. (b) Schematic illustration of contact between driving layer and detection layer and current flow.
2.1.2 Reconstruction
A tomographic tactile sensor requires a solver to reconstruct pressure distribution from the measured voltage vector. This solver addresses an ill-posed problem because the output dimension (reconstructed image) is larger than the input dimension (measured voltage vector). Therefore, we used the linear reconstruction method of Tikhonov regularization with two-dimensional finite element method (FEM) model, based on our previous studies (Asahi et al., 2024b; Yoshimoto et al., 2020). The hyperparameter of the Tikhonov regularization was set to 5000. These reconstruction processes were performed using MATLAB 2023b (MathWorks Inc.).
2.2 Experiment methods
2.2.1 Participant information
In this study, participants were required to meet two criteria: (1) the ability to perform both power grip and precision grip, and (2) an age at which they could sufficiently understand verbal instructions. Regarding (1) the ability to perform power grip and precision grip, as mentioned in the introduction, primitive grasping has been reported to emerge between 2 and 22 weeks, while precision grip develops at 5.97 months. Regarding (2) the ability to sufficiently understand verbal instructions, B. Buckley have reported that three-year-old children are capable of communicating using language. Additionally, four-year-old children can focus on and follow verbal instructions even without explicit cues, such as being called by name (Buckley, 2003). Based on these considerations, this study targeted four-year-old children as participants. The participants of this study were 17 children (4.43 ± 0.30 years old, 8 boys, 9 girls). In order to ensure that the participants had adequate communication skills and no developmental disorders, we administered the KINDER INFANT DEVELOPMENT SCALE questionnaire type C prior to the experiment (Hassanein, 1982). None of the participants had any serious disease or disorder. In the analysis, 11 children (5 boys and 6 girls) were included, excluding those who stopped the measurement halfway through because they could not listen to the experimenter’s instructions or did not want to participate (4 participants), those whose actual dominant hand seemed to differ from that reported by their parents (1 participant), and those who grasped without placing their palm on the object during the power grip (1 participant). Evaluation of the modified Japanese version of the FLANDERS handedness questionnaire (Okubo et al., 2014) indicated 10 right-handed children and one left-handed child.
This study was approved by the Ethics Committees of Shibaura Institute of Technology and Keio University. The experiment was conducted only when informed consent was obtained from the parents of the participating children.
2.2.2 Measurement method
The participants practiced freely grasping the device, without external assistance. Voltage measurements were also performed during the hardware and software testing. The participants were then instructed to perform either a power grip or precision grip, with the order being counterbalanced. Each grip was measured ten times. However, if the hand was released during the measurement process or if the grasp force was not applied (i.e., the object was grasped only by the frictional force of the fingers), the grasp was excluded from the analysis, and an additional measurement was performed. Ten times per grasp were measured, that is, 100 measurement frames (10 measurements × 10 times) were obtained for each grasping category.
2.2.3 Classification method
The measured voltage vectors and reconstructed images were used as features to classify the power grip and precision grip. For classification using the measured voltage vectors, 256 data points were used (16 electrodes × 16 measurements). For classification using the reconstructed images, the FEM values normalized from 0% to 100% were used. The size of FEM model was 43 × 66 × 1.
In this study, we considered more practical applications, such as educational toys or diagnostic systems for developmental disabilities. For such applications, we conducted a comparative analysis using the k-Nearest Neighbors (KNN) algorithm (Bansal et al., 2022), which is computationally efficient and easy to implement, and the Convolutional Neural Network (CNN), which has been reported to achieve high classification accuracy (Park et al., 2021). In KNN, we used the MATLAB function (fitcknn) with a k value of 1. The network architecture of the CNN consisted of 17 layers, as listed in Table 2. The input layer was configured to input each feature with dimensions of 16 × 16 × 1 for classification using the measured voltage vectors, and 43 × 66 × 1 for classification using the reconstructed images. Subsequently, a three-step convolution was performed. The convolution layers were organized with filter sizes of 3 × 3 × 32, 3 × 3 × 64, and 3 × 3 × 128, in that order. In each convolution layer, the ReLU was applied as the activation function after batch normalization. In steps one and two, a 2 × 2 max pooling layer is utilized, resulting in downsampling with a stride of two. In step three, a fully connected layer was used to classify the data into two classes. The Softmax function was applied to the output layer, resulting in a final classification into two classes: power grip and precision grip. Stochastic gradient descent was employed for training with an initial learning rate of 0.001. In addition, the learning rate was configured to be reduced by 95% after ten epochs. The maximum number of epochs was set to 36, and the data were randomized at the beginning of each epoch.
TABLE 2
| No | Layer | Description |
|---|---|---|
| 1 | Input 2D | Each classification has different inputs |
| 2 | Convolutional 2D | 32 3 × 3 convolutions with stride 1 |
| 3 | Batch Normalization | Batch Normalization |
| 4 | ReLU | ReLU |
| 5 | Max Pooling 2D | 2 × 2 Max Pooling |
| 6 | Convolutional 2D | 64 3 × 3 convolutions with stride 1 |
| 7 | Batch Normalization | Batch Normalization |
| 8 | ReLU | ReLU |
| 9 | Max Pooling 2D | 2 × 2 Max Pooling |
| 10 | Convolutional 2D | 128 3 × 3 convolutions with stride 1 |
| 11 | Batch Normalization | Batch Normalization |
| 12 | ReLU | ReLU |
| 13 | Fully Connected | 256 fully connected |
| 14 | ReLU | ReLU |
| 15 | Fully Connected | 2 fully connected |
| 16 | Softmax | Softmax |
| 17 | Classification | Output layer |
CNN classification network architecture.
Cross-validation was performed to validate the classification accuracy of these two types of features and classification methods. Verification was performed for each participant, with one grasp (10 frames) as the test data and the remaining grasps (190 frames) as the training data, and was repeated until all grasps were the test data.
For the evaluation of classification results, the following accuracy was calculated for each participant as Equation 1:where, initial character T or F indicates whether the class predicted by the classifier matches the true class or not. The characters Pow and Pre indicate power grip and precision grip, respectively. Thus, TPow is the matching case of the power grip as predicted class by the classifier and the power grip as true class. Subsequently, to evaluate the classification performance in different grasps, a confusion matrix was calculated for each grasp. Precision (Prec), recall, and F-measure were then calculated for each grasp as follow Equations 2–4:
These index values ranged from 0 to 1. In addition, t-Distributed Stochastic Neighbor Embedding (t-SNE) has been used to confirm the distribution of features and clustering trends (Van Der Maaten and Hinton, 2008). The classification features were compressed into a two-dimension map by t-SNE. The distances between points in the t-SNE plot reflect similarity relationships in the original high-dimensional space. Additionally, clearly separated clusters indicate natural groupings based on differences in classification features.
3 Results
We classified the basic grip classifications—power grip and precision grip—in children (Figure 3a). The average accuracy values are shown in Figure 4a. When classified using the measured voltage vector (Figure 3b), the average classification accuracy using KNN was 86.8%. The highest and lowest accuracies for the participants were 95.5% and 79.0%, respectively. The average accuracy obtained using the CNN was 88.5%, and the highest and lowest accuracies were 95.0% and 75.5%, respectively. When classifying using the reconstructed image as a feature (Figure 3c), the average accuracy was 85.7% using KNN. The highest and lowest accuracies are 94.5% and 72.5%, respectively. In the classification using CNN with the reconstructed image as the feature, the average accuracy was 87.9%. The highest and lowest accuracies are 99.0% and 77.0%, respectively. All average classification accuracies exceeded the chance level (50%).
FIGURE 3

Representative images. The upper section corresponds to the power grip, and the lower section corresponds to the precision grip. (a) Images captured for each grasp. (b) Measured voltage vector. (c) Reconstructed 2D image.
FIGURE 4

(a) Mean and standard deviation of classification accuracy. The average classification accuracies of the measured voltage vector (VV) with KNN and CNN classifications were 86.8% and 88.5%, respectively. The average classification accuracies of the reconstructed images (RI) with KNN and CNN classifications were 85.7% and 87.9%, respectively. (b) Cross-validation of each classification. The closer the color of the diagonal cell is to black, the higher the classification accuracy.
The confusion matrixes shows that the classification results were better for the precision grip than for the power grip for all classification methods (Figure 4b). As shown in Table 3, Prec was higher for power grip across all classifiers. However, Recall was higher for the precision grip in all cases. Similarly, the F-measure was also higher for the precision grip across all classifiers. Figure 5 presents the t-SNE plot of the participant who achieved the highest accuracy. The results indicated that clustering was achieved based on feature labels. However, some instances of the power grip appear to be located within the precision grip cluster.
TABLE 3
| Accuracy [%] | VV KNN | VV CNN | RI KNN | RI CNN | |
|---|---|---|---|---|---|
| 86.8 | 88.5 | 85.7 | 87.9 | ||
| Prec | power | 0.889 | 0.892 | 0.871 | 0.896 |
| precision | 0.849 | 0.877 | 0.843 | 0.864 | |
| Recall | power | 0.841 | 0.875 | 0.837 | 0.858 |
| precision | 0.895 | 0.894 | 0.876 | 0.900 | |
| F-measure | power | 0.864 | 0.883 | 0.854 | 0.876 |
| precision | 0.871 | 0.886 | 0.859 | 0.881 | |
Classification index.
FIGURE 5
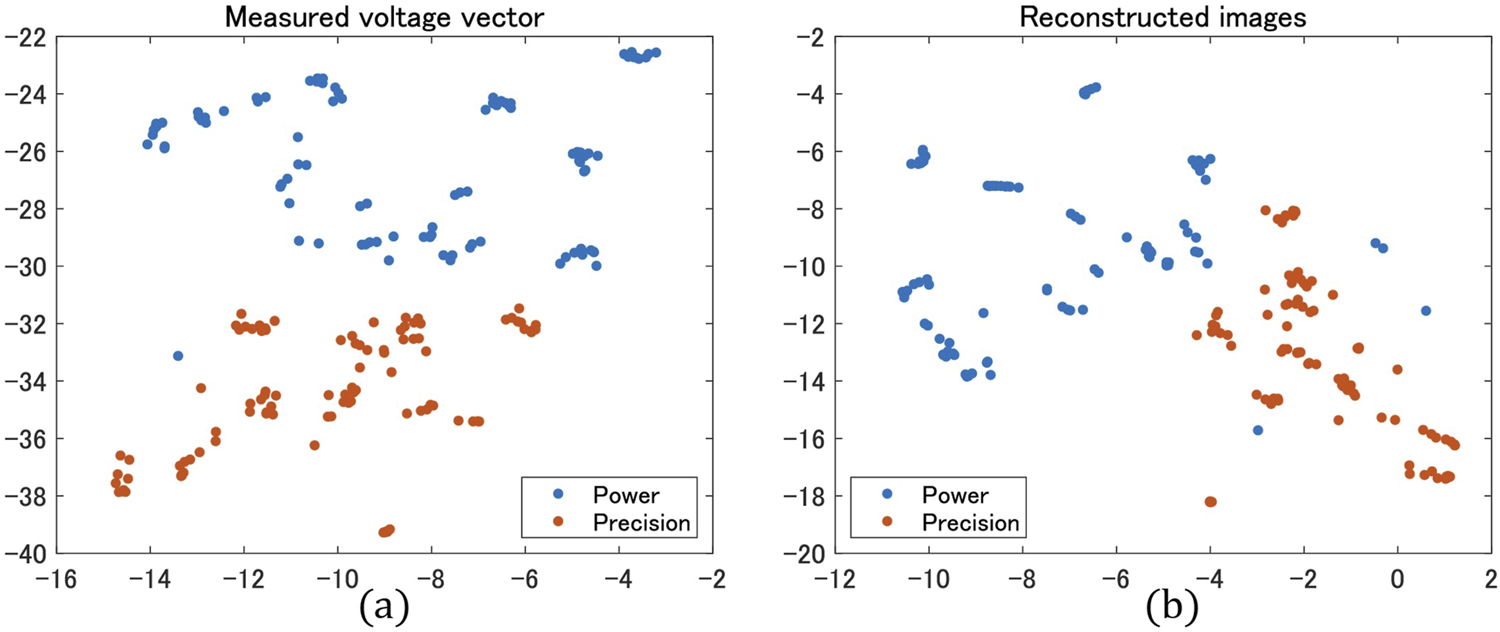
T-SNE plots with measured voltage vectors and reconstructed images for participants who achieved the highest classification accuracy. The perplexity was set to 50, and the learning rate was set to 750. The input classification features were normalized. (a) t-SNE plot using the measured voltage vector (b) t-SNE plot obtained using the reconstructed images.
4 Discussion
The purpose of this study is to demonstrate the feasibility of classifying power grip and precision grip in children using a tomographic tactile sensor based on resistive coupling, as a first step towards the development of a hand motion analysis system for children. In order to avoid accidents and damage due to unexpected behavior of children, the sensor device and measurement circuit were integrated into a single unit and a felt fabric layer was added. As a result, there was no damage to the device during the experiment. Using this device, the results of power and precision grip classification showed an average classification accuracy of over 85%, higher than the chance level of 50%.
4.1 Sensing device and measurements on children
Children’s behavior is differed from adults, they may lick or throw the device. In fact, during a preliminary experiment, one child scratched the driving layer with their fingernails, causing damage. To address such risks, the device must be designed to minimize potential breakage factors. As one protective measure, we introduced a felt fabric with cushioning properties as a protective layer. This layer serves to prevent licking and damage to the driving layer. Such felt fabric is suitable as a protective material for children due to its safe composition, durability, availability in various colors, and flexibility. Regarding the safety of the device itself, the felt fabric and PLA material used in this study are non-toxic and hypoallergenic, ensuring no safety concerns.
Additionally, to prevent damage from being thrown or mishandled, the device needed to cover a broader swing range. To achieve this, the sensor and measurement circuit were integrated into a sensing device. Furthermore, a 2-meter cable was used for communication between the PC and the measurement circuit. As a result of these design improvements, no participants damaged the device during the experiment. Furthermore, wireless measurement is an effective approach to improving operational range and portability. In this study, the computer and sensing device were connected via a cable. However, as reported by Yoshimoto et al., wireless measurement is feasible, and its implementation is expected to eliminate limitations in the measurement environment (Yoshimoto et al., 2020).
Finally, regarding the experimental protocol, grasping motions were instructed verbally in this experiment. However, some participants treated the device as a cup, mimicking toasting or pretending to drink from it. This suggests that a role-play-based protocol may be more suitable for future studies.
4.2 Classification method
Reconstructed images and measured voltage vectors were used as classification features, and both CNN- and KNN-based methods achieved an average accuracy exceeding 85%, which is higher than the 50% chance level. These findings indicate that classification using a tomographic tactile sensor can achieve a high classification performance and reproducibility. The difference in classification accuracy among all classifications was 2.8%. Thus, it demonstrated a comparable classification accuracy across all methods.
Analysis of the confusion matrix revealed that the precision grip was classified more accurately than the power grip. Although the Prec for the power grip was higher than that for the precision grip across all methods, the recall and F-measure for the precision grip were higher (Table 3). These results suggest that while all classification methods correctly identified the precision grip, the power grip was frequently misclassified as the precision grip. Moreover, as illustrated in the t-SNE plots (Figure 5), some plots in the power grip were mixed in the precision grip cluster. This indicates that the classification error did not depend on the classifier but rather on the potential classification features.
One potential factor differentiating the power grip from the precision grip is the contact area. Visual assessments indicated that the contact area of the power grip was larger than that of the precision grip (Figure 3c). In the power grip, opposition is generated by the thumb, other fingers, and the palm; however, in the precision grip, opposition was generated by the thumb and other fingers (Figure 3a). This difference is considered to be the cause of the difference in the contact area. Another distinguishing factor is the number of virtual fingers (VF), which indicates the number of primary force vectors generated during grasping. The precision grip is characterized by VF2 due to its pinching action. In contrast, the power grip can be characterized by either VF2 or VF3, as it involves both the fingers and the palm (Figure 6). These differences in contact area and VF may contribute to the misclassification of the power grip relative to the precision grip. It is also possible that the power grip in t-SNE is the cause of some mixing with the precision grip cluster (Figure 5).
FIGURE 6

Illustration of Virtual fingers. (a) Precision grip in VF2. (b) Power grip in VF3. (c) Power grip in VF2.
A previous study examining the agreement between experienced physical therapists and devices for analyzing the locations of gripping (the power grip) and functional pinching (the precision grip) reported an agreement of 86.6% (Boschi and Frère, 2013). Although direct comparisons could not be made owing to the differences in the experimental conditions, the results of this study demonstrated comparable accuracy.
4.3 Limitations and future prospects
There are two mainly limitation in this study. First is that the device size was fixed at a height of 85 mm and a diameter of 40 mm. Customizing the device to accommodate individual hand sizes could enhance its ease of grasping, and improve classification accuracy. Second is the grasp types used for classification. In this study, the basic categories of the power grip and precision grip were classified. For practical applications, a more detailed classification of grasping may be necessary.
Based on the results of this study, there are three prospects for future research: The first is to develop a sensing device with a system that provides humorous feedback stimuli. Feedback systems encourage children to take action (Boschi and Frère, 2013). The feedback system that uses the grasp classification system developed in this study may contribute to rehabilitation and intervention. The second is to identify the specific fingers contacting the sensor. This identification system might be a useful alternative to the video coding. The video coding typically requires a lot of time and effort. Previous studies have reported that it took 3 hours to code a 10-min video (Wallace and Whishaw, 2003). Replacing video coding with sensor-based analysis could reduce the analysis time. To achieve this, a large amount of data on the children must be collected. We believe that making the device toy-shaped will help keep children’s attention and enable the measurement of a large amount of data. Lastly, we propose the potential application of this system as a diagnostic support tool for developmental disorders. Previous studies have reported that children at high risk for ASD often exhibit delayed development of fine motor skills compared to typically developing children. Accordingly, if the present system can be employed to assess fine motor skills in both typically developing children and high-risk ASD children, it may contribute to early diagnostic support for ASD. To examine this feasibility, future research should aim to measure and compare grasping behaviors between these two groups.
5 Conclusion
In this study, we demonstrated the feasibility of classifying power grip and precision grip in children using a tomographic tactile sensor based on resistive coupling. To address concerns that children might lick or swing the device, we developed a medium-sized cylindrical sensing device with an integrated sensor and measurement circuit, incorporating a protective layer for enhanced safety. These design considerations ensured that no damage occurred to the device during the experiment.
Using the device, machine learning-based classification of children’s grasps demonstrated that power grip and precision grip could be classified with an accuracy exceeding 85%, above the chance level of 50%. These grip types are among the major categories in the GRASP taxonomy, which defines 33 distinct grasp classifications. Therefore, the findings of this study represent a foundational step toward classifying a broader range of grasp types and establishing a comprehensive grasp classification system.
Statements
Data availability statement
The raw data supporting the conclusions of this article will be made available by the authors, without undue reservation.
Ethics statement
The studies involving humans were approved by The biotechnology ethics committee of Shibaura Institute of Technology (24-009), and the ethics committee of Keio University, Faculty of Literature (240290000). The studies were conducted in accordance with the local legislation and institutional requirements. Written informed consent for participation in this study was provided by the participants’ legal guardians/next of kin.
Author contributions
RA: Conceptualization, Writing – original draft, Writing – review and editing, Software, Investigation, Formal Analysis, Data curation, Visualization, Methodology. ST: Writing – review and editing, Investigation. YM: Resources, Writing – review and editing. SY: Writing – review and editing. HS: Project administration, Funding acquisition, Writing – review and editing, Conceptualization, Supervision, Investigation.
Funding
The author(s) declare that financial support was received for the research and/or publication of this article. This work was supported by JSPS KAKENHI (Grant Number 23K25652).
Acknowledgments
We would like to express our gratitude to the children and their parents who participated in this study. We also wish to thank Hina Furukawa from the Shibaura Institute of Technology, Hina Katayama from Keio University, and the staff members of Keio University for their support during the experiments.
Conflict of interest
The authors declare that the research was conducted in the absence of any commercial or financial relationships that could be construed as a potential conflict of interest.
The author(s) declared that they were an editorial board member of Frontiers, at the time of submission. This had no impact on the peer review process and the final decision.
Generative AI statement
The author(s) declare that no Generative AI was used in the creation of this manuscript.
Publisher’s note
All claims expressed in this article are solely those of the authors and do not necessarily represent those of their affiliated organizations, or those of the publisher, the editors and the reviewers. Any product that may be evaluated in this article, or claim that may be made by its manufacturer, is not guaranteed or endorsed by the publisher.
References
1
Allen M. C. Capute A. J. (1986). The evolution of primitive reflexes in extremely premature infants. Pediatr. Res.20, 1284–1289. 10.1203/00006450-198612000-00018
2
Asahi R. Yoshimoto S. Fujita T. Toriyama S. Shimada Y. Itakura S. et al (2024a). “Classification of pinching action in children using a tomographic tactile sensor,” in 2024 IEEE international symposium on medical measurements and applications, MeMeA 2024 - proceedings. 10.1109/MeMeA60663.2024.10596747
3
Asahi R. Yoshimoto S. Sato H. (2024b). Development of pinching motion classification method using EIT-based tactile sensor. IEEE Access12, 62089–62098. 10.1109/ACCESS.2024.3395271
4
Asakawa A. Murakami T. Sugimura S. (2019). Effect of fine motor skills training on arithmetical ability in children. Eur. J. Dev. Psychol.16, 290–301. 10.1080/17405629.2017.1385454
5
Bansal M. Goyal A. Choudhary A. (2022). A comparative analysis of K-nearest neighbor, genetic, support vector machine, decision tree, and long short term memory algorithms in machine learning. Decis. Anal. J.3, 100071. 10.1016/j.dajour.2022.100071
6
Barrocas R. Roesch S. Gawrilow C. Moeller K. (2020). Putting a finger on numerical development – reviewing the contributions of kindergarten finger gnosis and fine motor skills to numerical abilities. Front. Psychol.11, 1012. 10.3389/fpsyg.2020.01012
7
Battraw M. A. Fitzgerald J. Winslow E. J. James M. A. Bagley A. M. Joiner W. M. et al (2024). Surface electromyography evaluation for decoding hand motor intent in children with congenital upper limb deficiency. Sci. Rep.14, 31741. 10.1038/s41598-024-82519-z
8
Bear-Lehman J. Kafko M. Mah L. Mosquera L. Reilly B. (2002). An exploratory look at hand strength and hand size among preschoolers. J. Hand Ther.15, 340–346. 10.1016/S0894-1130(02)80005-9
9
Boschi S. R. M. S. Frère A. F. (2013). Grip and pinch capability assessment system for children. Med. Eng. Phys.35, 626–635. 10.1016/j.medengphy.2012.07.008
10
Buckley B. (2003). Children's Communication Skills: From Birth to Five Years. Routledge. 10.4324/9780203865750
11
Campolo D. Taffoni F. Schiavone G. Laschi C. Keller F. Guglielmelli E. (2008). “A novel technological approach towards the early diagnosis of neurodevelopmental disorders,” in Proceedings of the 30th annual international conference of the IEEE engineering in medicine and biology society, EMBS’08 - “personalized healthcare through technology.”. 10.1109/iembs.2008.4650306
12
Choi B. Leech K. A. Tager-Flusberg H. Nelson C. A. (2018). Development of fine motor skills is associated with expressive language outcomes in infants at high and low risk for autism spectrum disorder. J. Neurodev. Disord.10, 14. 10.1186/s11689-018-9231-3
13
Del Maestro M. Cecchi F. Serio S. M. Laschi C. Dario P. (2011). Sensing device for measuring infants’ grasping actions. Sens. Actuators A Phys.165, 155–163. 10.1016/j.sna.2010.08.016
14
Feix T. Romero J. Schmiedmayer H. B. Dollar A. M. Kragic D. (2016). The GRASP taxonomy of human grasp types. IEEE Trans. Hum. Mach. Syst.46, 66–77. 10.1109/THMS.2015.2470657
15
Fischer U. Suggate S. P. Schmirl J. Stoeger H. (2018). Counting on fine motor skills: links between preschool finger dexterity and numerical skills. Dev. Sci.21, e12623. 10.1111/desc.12623
16
Hassanein R. S. (1982). The KIDS Chart: A Simple, Reliable Infant Development Screening Tool. Am. J. Dis. Child136, 1012. 10.1001/archpedi.1982.03970470041012
17
Kato Y. Mukai T. Hayakawa T. Shibata T. (2007). “Tactile sensor without wire and sensing element in the tactile region based on EIT method,” in Proceedings of IEEE sensors. 10.1109/ICSENS.2007.4388519
18
Landa R. Garrett-Mayer E. (2006). Development in infants with autism spectrum disorders: a prospective study. J. Child. Psychol. Psychiatry47, 629–638. 10.1111/j.1469-7610.2006.01531.x
19
Lê M. Quémart P. Potocki A. Gimenes M. Chesnet D. Lambert E. (2023). Improving literacy development with fine motor skills training: a digital game-based intervention in fourth grade. Cogn. Dev.67, 101363. 10.1016/j.cogdev.2023.101363
20
Nagakubo A. Alirezaei H. Kuniyoshi Y. (2007). “A deformable and deformation sensitive tactile distribution sensor,” in 2007 IEEE international conference on robotics and biomimetics, ROBIO. 10.1109/ROBIO.2007.4522352
21
Napier J. R. (1956). The prehensile movements of the human hand. J. Bone Jt. Surg. Br.38, 902–913. 10.1302/0301-620x.38b4.902
22
Neto F. R. Goulardins J. B. Rigoli D. Piek J. P. de Oliveira J. A. (2015). Motor development of children with attention deficit hyperactivity disorder. Rev. Bras. Psiquiatr.37, 228–234. 10.1590/1516-4446-2014-1533
23
Okubo M. Suzuki H. Nicholls M. E. R. (2014). A Japanese version of the FLANDERS handedness questionnaire. Jpn. J. Psychol.85, 474–481. 10.4992/jjpsy.85.13235
24
Owada S. Sugimura H. Isshiki M. (2022). “Toddler’s hand motion acquisition with hand-made data glove,” in LifeTech 2022 - 2022 IEEE 4th global conference on life sciences and technologies. 10.1109/LifeTech53646.2022.9754849
25
Park H. Park K. Mo S. Kim J. (2021). Deep neural network based electrical impedance tomographic sensing methodology for large-area robotic tactile sensing. IEEE Trans. Robotics37, 1570–1583. 10.1109/TRO.2021.3060342
26
Pratap S. Narayan J. Hatta Y. Ito K. Hazarika S. M. (2024). Glove-net: enhancing grasp classification with multisensory data and deep learning approach. Sensors24, 4378. 10.3390/s24134378
27
Rocha A. C. P. Tudella E. Pedro L. M. Appel V. C. R. Da Silva L. G. P. Caurin G.A. de P. (2016). A novel device for grasping assessment during functional tasks: preliminary results. Front. Bioeng. Biotechnol.4, 16. 10.3389/fbioe.2016.00016
28
Schröer L. Cooper R. P. Mareschal D. (2021). Science with Duplo: multilevel goal management in preschoolers’ toy house constructions. J. Exp. Child. Psychol.206, 105067. 10.1016/j.jecp.2020.105067
29
Serio S. M. Cecchi F. Assaf T. Laschi C. Dario P. (2013). Design and development of a sensorized wireless toy for measuring infants’ manual actions. IEEE Trans. Neural Syst. Rehabilitation Eng.21, 444–453. 10.1109/TNSRE.2013.2255066
30
Silvera-Tawil D. Rye D. Soleimani M. Velonaki M. (2015). Electrical impedance tomography for artificial sensitive robotic skin: a review. IEEE Sens. J.15, 2001–2016. 10.1109/JSEN.2014.2375346
31
Suggate S. Stoeger H. Fischer U. (2017). Finger-based numerical skills link fine motor skills to numerical development in preschoolers. Percept. Mot. Ski.124, 1085–1106. 10.1177/0031512517727405
32
Suggate S. P. Karle V. L. Kipfelsberger T. Stoeger H. (2023). The effect of fine motor skills, handwriting, and typing on reading development. J. Exp. Child. Psychol.232, 105674. 10.1016/j.jecp.2023.105674
33
Udayagiri R. Yin J. Cai X. Townsend W. Trivedi V. Shende R. et al (2024). Towards an AI-driven soft toy for automatically detecting and classifying infant-toy interactions using optical force sensors. Front. Robot. AI11, 1325296. 10.3389/frobt.2024.1325296
34
Van Der Maaten L. Hinton G. (2008). Visualizing data using t-SNE. J. Mach. Learn. Res.9.
35
Wallace P. S. Whishaw I. Q. (2003). Independent digit movements and precision grip patterns in 1-5-month-old human infants: hand-babbling, including vacuous then self-directed hand and digit movements, precedes targeted reaching. Neuropsychologia41, 1912–1918. 10.1016/S0028-3932(03)00128-3
36
Xue Y. Ju Z. Xiang K. Chen J. Liu H. (2019). Multimodal human hand motion sensing and analysis-A review. IEEE Trans. Cogn. Dev. Syst.11, 162–175. 10.1109/TCDS.2018.2800167
37
Yoshimoto S. Kuroda Y. Oshiro O. (2020). Tomographic approach for universal tactile imaging with electromechanically coupled conductors. IEEE Trans. Industrial Electron.67, 627–636. 10.1109/TIE.2018.2879296
38
Yoshimoto S. Sakamoto K. Takeda R. Yamamoto A. (2024). Design of a high-performance tomographic tactile sensor by manipulating the detector conductivity. IEEE Trans. Industrial Electron.71, 16783–16791. 10.1109/TIE.2024.3384613
Summary
Keywords
children, classification, electrical impedance tomography, neuro-developmental Engineering, power grip, precision grip, tactile sensors
Citation
Asahi R, Toriyama S, Minagawa Y, Yoshimoto S and Sato H (2025) Classification of power grip and precision grip in children using an EIT-based tactile sensor. Front. Sens. 6:1598903. doi: 10.3389/fsens.2025.1598903
Received
24 March 2025
Accepted
03 June 2025
Published
19 June 2025
Volume
6 - 2025
Edited by
Muhammad Zia Ur Rehman, Riphah International University, Pakistan
Reviewed by
Guillem Domènech-Gil, Linköping University, Sweden
Jawad Ahmad, Prince Mohammad bin Fahd University, Saudi Arabia
Updates
Copyright
© 2025 Asahi, Toriyama, Minagawa, Yoshimoto and Sato.
This is an open-access article distributed under the terms of the Creative Commons Attribution License (CC BY). The use, distribution or reproduction in other forums is permitted, provided the original author(s) and the copyright owner(s) are credited and that the original publication in this journal is cited, in accordance with accepted academic practice. No use, distribution or reproduction is permitted which does not comply with these terms.
*Correspondence: Hiroki Sato, hiroki@shibaura-it.ac.jp
Disclaimer
All claims expressed in this article are solely those of the authors and do not necessarily represent those of their affiliated organizations, or those of the publisher, the editors and the reviewers. Any product that may be evaluated in this article or claim that may be made by its manufacturer is not guaranteed or endorsed by the publisher.