Abstract
The agricultural sector in Indonesia is one of the sectors producing a variety of food crops including tea plants. Tea (Camellia sinensis) is one of the plants that is widely consumed by the world community. In particular, black tea is one type of tea that is in great demand in Indonesia. PT Perkebunan Nusantara (PTPN) VIII Kebun Rancabali is one of the companies that take part in producing black tea plants and produces around 30 tons of black tea per day. In its production, black tea plants go through various stages to be processed into quality tea powder. It is necessary to know in advance the quality of the black tea leaves themselves before entering the processing stage to produce quality tea products. Therefore, in this research, a system for quality classification on black tea plants using Convolutional Neural Network (CNN) based on MobileNetV2 architecture was created. Based on the test scenario, the use of Adam optimizer with learning rate 0.001 achieved the highest accuracy of 97% and RMSprop optimizer achieved 96% accuracy. This research uses a dataset of 2000 images, so the accuracy results obtained are expected to reflect more reliable model performance and better generalization capabilities.
1 Introduction
Indonesia has abundant natural resources, including various agricultural commodities such as tea. However, despite significant tea production, quality assessment still relies heavily on manual labour, which is often inconsistent and time-consuming. This motivates the need for automation through deep learning (Pardede, 2023). Tea is one of the plants that is widely consumed by the world community and plays an important role in building food security of tea-producing countries in the world (Leonardo et al., 2019). Tea plants (Camellia sinensis) come from subtropical regions that can grow well with cool conditions and temperatures ranging from 13 to 25O C, require sufficient sunlight and relative humidity of more than 70% during the day (Riyana et al., 2023). According to the Food and Agriculture Organization (FAO), the global tea industry has experienced rapid growth (Food and Agriculture Organization of the United Nations, 2022). Based on Statista data in 2022, Indonesia ranks eighth as the largest tea producing country in the world and managed to produce 136.8 tons of tea with a revenue value of US$ 4.2 billion (Tea - Indonesia, 2023). The tea market in Indonesia has experienced a surge in demand for tea crop production, so the tea market is projected to increase annually by 4.81%. Black tea is one type of tea that is in great demand by the world community, including in Indonesia. PT Perkebunan Nusantara (PTPN) VIII Kebun Rancabali is one of the companies that contribute to producing black tea plants. Tea products produced by PTPN VIII Kebun Rancabali are black tea with two types of processing, namely, orthodox and CTC. PTPN VIII plays an important role in black tea production by contributing 41% of total black tea production in the country (Humas Kementerian Koordinator Bidang Perekonomian, 2022).
With the increasing demand of the world community for black tea production, this is a challenge for the Indonesian tea industry in meeting this demand (Ramanda et al., 2021). Currently, PTPN VIII Kebun Rancabali has produced around 30 tons of black tea a day. In this production, black tea plants go through various stages to be processed into quality tea powder, such as withering, grinding, fermenting, drying, sorting, quality testing and product packaging. Although the black tea plant has gone through several stages during processing, it is necessary to know first the quality of the black tea leaves themselves before entering the processing stage to produce quality tea products. Therefore, a classification is needed using the right technology to determine the quality of the black tea plant.
In this study, a system was made for quality classification in black tea plants which is divided into Premium and non-Premium classes through deep learning-based leaf images which are divided into two comparison scenarios, namely, classification using two different optimizations, namely, Adam and RMSprop by determining the number of epochs and different learning rates to get the best accuracy results. The method used in this study is Convolutional Neural Network (CNN) based on MobileNetV2 architecture with transfer learning techniques. CNN can be referred to as a deep learning technique that takes input in the form of images or other data from data sets that give bias and weight to different elements in the image to distinguish them (Datta and Gupta, 2023a). The purpose of this study is to be able to determine the quality of black tea plants in two comparison scenarios and can help farmers in the process of classifying the quality of black tea plants through leaf image and maintaining the quality of black tea plant production.
2 Materials and methods
In this study, a design was carried out regarding the application of the CNN method based on MobileNetV2 architecture for quality classification in black tea plants based on leaf image. The tea leaf recognition method used in this test will go through several stages such as data pre-processing and classification (Gensheng et al., 2019a). The performance of this system is measured based on measurement parameters which include precision, recall, F1 score and accuracy (Perera et al., 2022a). The design flow of this system can be seen in Figure 1.
FIGURE 1

System flowchart.
Based on Figure 1, the following is an explanation of some of the stages carried out in this study.
2.1 Initiation
The first step in the procedure is to clearly define the major goals and start the categorisation pipeline. At this point, the main goals of the classification system are laid out (for example, telling the difference between premium and non-premium tea leaves), the target variables are set, and the overall process is planned out in a general way. Careful planning at the beginning makes sure that all the actions that follow are in line with the desired results and that the necessary resources (such data sources, computational tools, and evaluation measures) are found early on.
2.2 Data acquistion
The data collection of this research was taken personally from PTPN VIII Kebun Rancabali dan Kebun Kertamanah. The dataset is grouped into Premium and non-Premium classes with 1,000 images each, bringing the total data to 2000 images. In addition to being divided into premium and non-premium tea datasets, the datasets were made to vary from position to brightness. Sample pictures of the tea quality of each grade can be seen in Figures 2, 3.
FIGURE 2
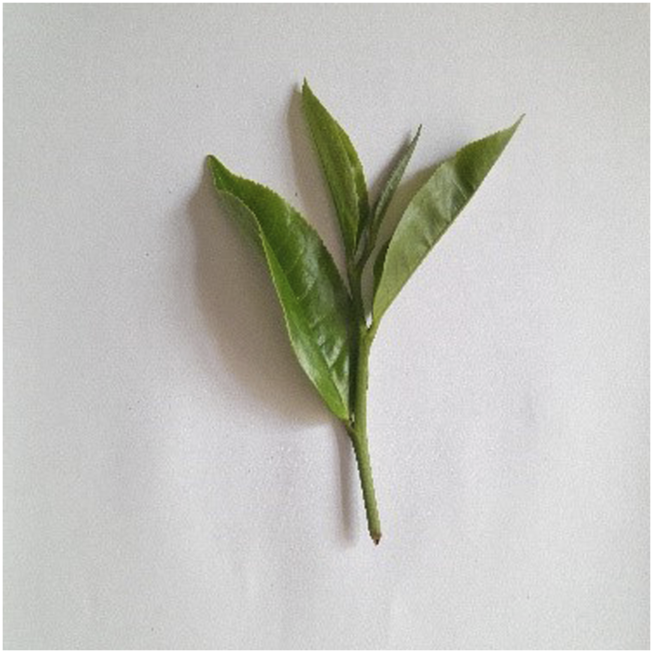
Premium tea.
FIGURE 3
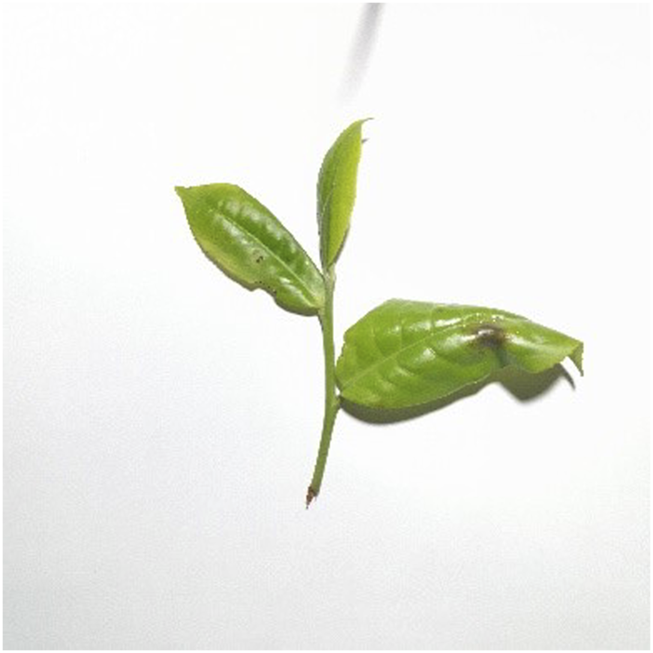
Non-premium tea.
Then the dataset is inserted into Google Drive by creating folders according to the contents of the dataset class. After that, the dataset on Google Drive will be linked to Google Colab as the platform used in this study. Google Colab is a cloud-based platform that allows users to run and share Jupyter notebooks (Gelar Guntara, 2023). Google Colab can run program code more flexibly and GPU is free, so it can collaborate with other users (Carneiro et al., 2018).
2.3 Data preparation
At this stage, raw data is collected from relevant and reliable sources. Some of these sources could be field observations, and camera photos. The quality and variety of data collected at this stage has a huge impact on how well the final model works and how widely it can be used. The goal of rigorous data collection methods is to get a complete picture of how things change in the real world, so that the model can handle situations it has never encountered before.
Furthermore, the dataset will enter the data pre-processing stage to improve the quality and availability of the training data without collecting more new data before entering the further modeling stage. Size in the data set can affect model performance. If the data set is not large enough, overfitting occurs. Therefore, it is necessary to increase the amount of data for the deep learning process (Wei et al., 2022a). This data pre-processing stage is also carried out to perform calculations on the neural network (Fajri et al., 2022). At this stage, the dataset will go through several actions such as the normalization process to change the scale of the data into a uniform range and the augmentation process to increase the amount and variety of training data by creating variations from the original data (Sucia et al., 2023). The dataset will be augmented using several parameters that can be seen in Tables 1, 2.
TABLE 1
| Parameters | Descriptions |
|---|---|
| Rotation Range | 20 |
| Width and Height Shift Range | 0.2 |
| Shear Range | 0.2 |
| Horizontal Flip | True |
| Zoom Range | 0.2 |
| Image Size | 224 × 224 |
| Color Mode | RGB |
| Class Mode | Categorical |
| Batch Size | 32 |
| Preprocessing Function | MobileNetV2 |
Data augmentation.
TABLE 2
| Hyper-Parameters | Value |
|---|---|
| Optimizer | Adam |
| Learning Rate | 0.01–0.001 |
| Epoch | 90 |
Hyper-parameters used for training model.
2.4 Data partitioning
Once the data is prepared, it is divided into two main subsets: a training set and a testing set. This division allows the model to learn from one subset (training data) and then be objectively evaluated on an independent subset (testing data). A commonly used partition ratio is 80% for training and 20 for testing.
Datasets on Google Drive that are already connected to Google Collab and have gone through data pre-processing will carry out a random data sharing process by the system which will be divided into three stages, namely, training data, validation data and test data. The training data will perform the model training process on the dataset, the validation data will evaluate and optimize the model performance of the dataset during the training process, while the test data will test the final performance of the dataset model that has been trained and validated using separate data and is not used during the training or validation process (Karimah, 2023).
2.5 Training model building
After the dataset is divided into three stages randomly, the dataset will go through a training process. This training model is used to perform the model training process using CNN-based MobileNetV2 architecture. In the training process using several pre-set hyperparameter configurations, such as learning rate configuration, optimizer, epoch, and batch size (Trihardianingsih et al., 2023). The model training process goes through convolution stages, non-linear activation functions, full connection layers, mean collection, and classification (Altim et al., 2022). The stages of data processing are presented in Table 3.
TABLE 3
| Input | Operator | t | c | n | s |
|---|---|---|---|---|---|
| 2242 × 3 | conv2d | - | 32 | 1 | 2 |
| 1122 × 32 | bottleneck | 1 | 16 | 1 | 1 |
| 1122 × 16 | bottleneck | 6 | 24 | 2 | 2 |
| 562 × 24 | bottleneck | 6 | 32 | 3 | 2 |
| 282 × 32 | bottleneck | 6 | 64 | 4 | 2 |
| 142 × 64 | bottleneck | 6 | 96 | 3 | 1 |
| 142 × 96 | bottleneck | 6 | 160 | 3 | 2 |
| 72 × 160 | bottleneck | 6 | 320 | 1 | 1 |
| 72 × 320 | conv2d 1 × 1 | - | 1,280 | 1 | 1 |
| 72 × 1,280 | avgpool 7 × 7 | - | - | 1 | - |
| 1 × 1 × 1,280 | conv2d 1 × 1 | - | k | - | - |
MobileNetV2 architecture (Ekoputris, 2018).
Based on Table 3, the model training process has several stages. In this training process, the model will perform convolution operations on two-dimensional inputs to process input features by learning relevant patterns in the data. This process helps the model to understand and extract the necessary essential features (Bao et al., 2022). Then insert bottleneck layers or inverted residual blocks to reduce channel dimensions and computational complexity on the remaining blocks resulting in a lighter and more efficient model without sacrificing the representation of important features (Rizal et al., 2020). Then the average merging process with a kernel size of 7 × 7 is scanned on the input feature and the average value on the kernel is taken as the output value. This training process takes a long time to obtain an identification model due to the large number of images that must be processed (Yucel and Yildirim, 2023).
2.6 Testing model
After the training process is carried out, the model then enters the testing process. Before entering the testing process, the model has gone through a validation process to evaluate and optimize model performance from the dataset during the training process (Hossain et al., 2018). The results of the model pattern on training will be tested to measure accuracy. If the test results show a high loss value, then the training will be rerun (Teka, 2024). The results of this training and testing process will result in a quality classification on black tea plants.
2.7 Classification results
The output produced by the model is the classification result for the test data. After going through several stages, the model will produce a quality classification on black tea plants by knowing the accuracy results of the model that has been trained and tested.
2.8 Performance assesment
After the data is trained, validated, and tested, it can be analyzed to determine the result of quality classification in black tea plants. The results of the analysis can show a high accuracy in classifying the quality of black tea plants. CNNs are known to perform well in classifying and recognizing problems in image processing and have improved accuracy in many machine learning tasks (Paranavithana and Kalansuriya, 2021). However, if it turns out that the results of the analysis show poor accuracy, then the model needs to be tested again starting from the data processing stage by changing values.
3 Results and discussion
This section will explain the results of quality classification testing on black tea plants using CNN-based MobileNetV2 architecture with transfer learning techniques. The dataset is grouped into Premium and non-Premium classes with 1,000 images each, bringing the total data to 2000 images.
3.1 First scenario testing
In the first scenario test, the dataset was used to determine the best accuracy results by varying the number of epochs using two optimizers: Adam and RMSprop (both with a learning rate of 0.001). The accuracy results obtained during testing with these optimizers and different epoch settings are shown in Table 4.
TABLE 4
| Adam (Learning Rate 0.001) | |
|---|---|
| Epoch | Accuracy Results |
| 10 | 88.89% |
| 20 | 94.69% |
| 30 | 89.72% |
| 40 | 96.35% |
| 50 | 97.18% |
| 60 | 97.18% |
| 70 | 96.68% |
| 80 | 97.35% |
| 90 | 97.84% |
| 100 | 97.84% |
| RMSProp (Learning Rate 0.001) | |
|---|---|
| Epoch | Accuracy Results |
| 10 | 90.88% |
| 20 | 94.36% |
| 30 | 94.69% |
| 40 | 96.19% |
| 50 | 96.02% |
| 60 | 95.52% |
| 70 | 96.52% |
| 80 | 96.85% |
| 90 | 96.52% |
| 100 | 96.35% |
Results of accuracy of black tea leaf quality classification testing using Adam and RMSprop optimization with Learning Rate 0.001.
Based on Table 4, the best accuracy using Adam was obtained at epoch 90 and 100 with an accuracy of 97.84%, while for RMSprop, the best accuracy was achieved at epoch 80 with an accuracy of 96.85%. Overall, the Adam optimizer outperformed RMSprop on this dataset.
Based on Figure 4, the results of the accuracy graph of testing the quality classification of black tea leaves using Adam’s optimization showed quite clear results and the total loss produced was 17%. As for the graphic results and total loss from testing the quality classification of black tea leaves using RMSprop optimization can be seen in Figure 5.
FIGURE 4
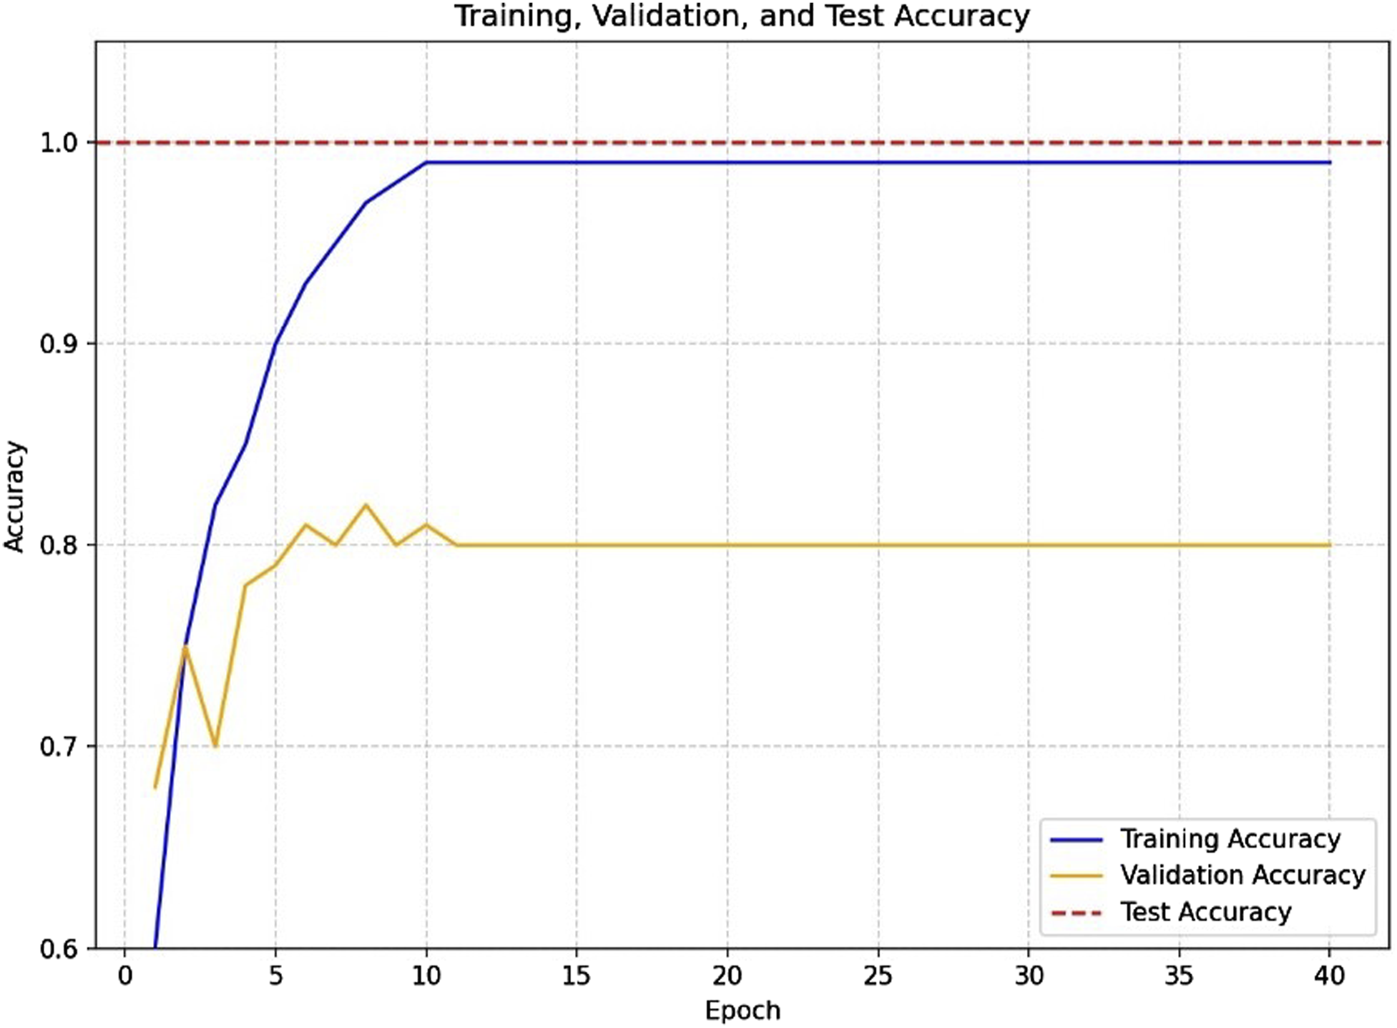
Accuracy graph of black tea leaf quality classification testing using Adam optimization with epoch 90.
FIGURE 5
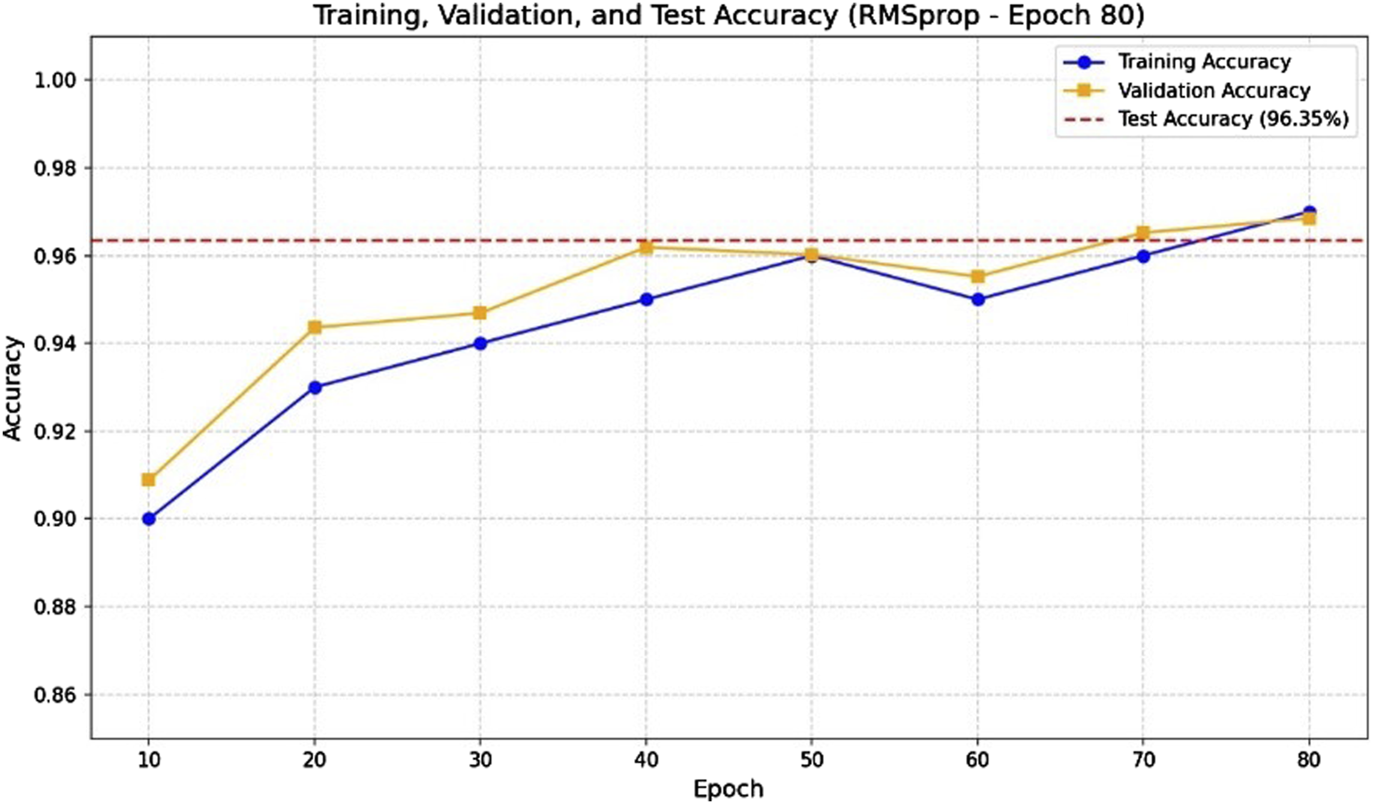
Accuracy graph of black tea leaf quality classification testing using RMSprop optimization with epoch 80.
The accuracy graph for the black tea leaf quality classification using Adam optimizer at epoch 80 shows consistent improvement, with a final accuracy of 97.84% and a relatively low total loss value. Meanwhile, using RMSprop at epoch 80, the accuracy reached 96.85% with stable loss reduction. These results indicate that both optimizers performed well, but Adam achieved slightly higher peak accuracy on this classification task.
3.2 Second scenario testing
In the second testing scenario, the dataset was used to determine the best accuracy results by varying the learning rate, while keeping the number of epochs at 90 and 80, as set in the first scenario. Two types of optimizers were tested: Adam and RMSprop. The accuracy results obtained using these optimizers with various learning rates are presented in Table 5.
TABLE 5
| Adam (epoch 90) | |
|---|---|
| Learning Rate | Accuracy Results |
| 0.1 | 49% |
| 0.01 | 89% |
| 0.001 | 97% |
| 0.0001 | 93% |
| 0.00001 | 78% |
| 0.000001 | 70% |
| 1.0 | 50% |
| RMSProp (epoch 80) | |
|---|---|
| Learning Rate | Accuracy Results |
| 0.1 | 53% |
| 0.01 | 84% |
| 0.001 | 96% |
| 0.0001 | 92% |
| 0.00001 | 76% |
| 0.000001 | 69% |
| 1.0 | 46% |
Results of accuracy testing of black tea leaf quality classification using Adam optimization and RMSprop.
Based on Table 5, the best accuracy using Adam was achieved with a learning rate of 0.001, resulting in an accuracy of 97%. Meanwhile, for RMSprop, the highest accuracy was obtained at a learning rate of 0.001, both reaching 96%.
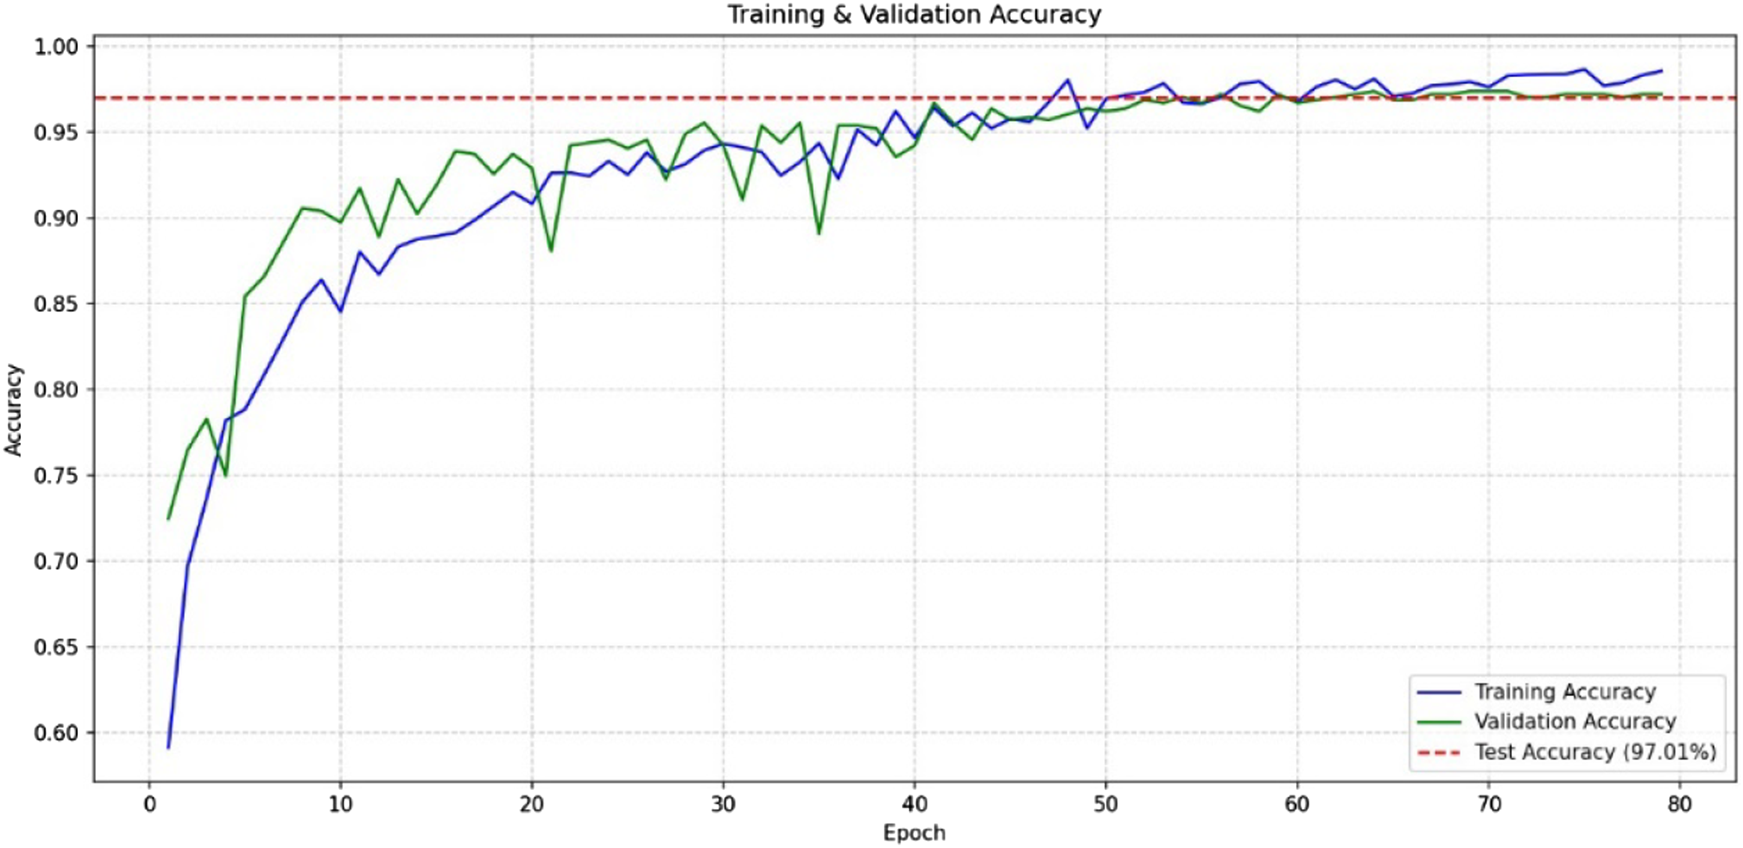
Based on Figure 6, the results of the accuracy graph of testing the quality classification of black tea leaves using Adam’s optimization at epoch 90 showed with a learning rate, reaching accuracy of 97%.
FIGURE 6
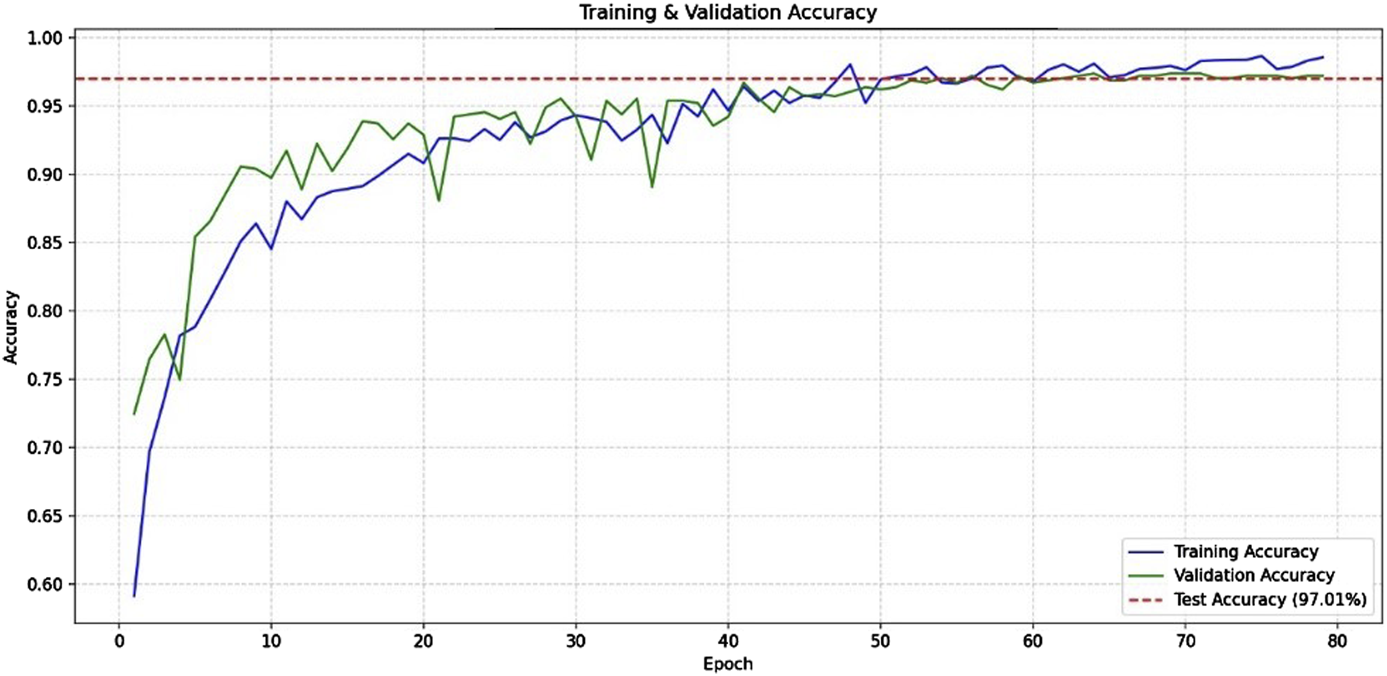
Graph of accuracy of testing the quality classification of black tea leaves using Adam’s optimization with a learning rate of 0.001.
Based on Figure 7, the results of the accuracy graph of testing the quality classification of black tea leaves show the accuracy curve for RMSprop optimizer with a learning rate of 0.001 at epoch 80, reaching 96%.
FIGURE 7
Graph of accuracy of testing the quality classification of black tea leaves using RMS’s optimization with a learning rate of 0.001.
Based on Table 6, it can be concluded that in this study, the best accuracy using Adam was achieved at epoch 90 with a learning rate of 0.001 (accuracy of 97%). Meanwhile, using RMSprop, the best accuracy was obtained at epoch 80 with a learning rate of 0.001, resulting in 96%.
TABLE 6
| Test | Learning rate | Accuracy optimization | |
|---|---|---|---|
| Adam (epoch 90) | RMSProp (epoch 80) | ||
| 1 | 0.1 | 49% | 53% |
| 2 | 0.01 | 89% | 84% |
| 3 | 0.001 | 97% | 96% |
| 4 | 0.0001 | 93% | 92% |
| 5 | 0.00001 | 78% | 76% |
| 6 | 0.000001 | 70% | 69% |
| 7 | 1.0 | 50% | 46% |
Comparison of Adam and RMSprop optimization usage test results.
The comparison between the proposed study and previous research highlights its unique focus on tea quality classification rather than disease detection, positioning it as a valuable tool for improving tea production (Table 7). The use of MobileNetV2, a lightweight and efficient architecture, allows for real-time quality control in low-resource environments like tea farms, making it highly practical. Despite using a relatively smaller dataset, the proposed study achieves an impressive 96.19% accuracy, outperforming previous studies by leveraging RMSprop and Adam optimizations alongside data augmentation. This approach addresses a critical need in the tea industry by providing a scalable, mobile-friendly solution for premium tea leaf classification, directly contributing to better quality control and production consistency, unlike prior studies focused primarily on disease management.
TABLE 7
| Aspect | Proposed Study | Datta & Gupta (2023a) | Gensheng et al. (2019a) | Perera et al. (2022a) | Hossain et al. (2018) | Wei et al. (2022a) |
|---|---|---|---|---|---|---|
| Objective | Classifying black tea leaf quality (Premium vs. non-Premium) | Detecting tea leaf diseases | Identifying tea leaf diseases | Real-time object detection of tea leaf diseases | Detecting diseases in tea leaves | Fluorescence-based tea leaf classification |
| Method/Architecture | MobileNetV2, CNN, Transfer Learning | CNN-based, Custom Model | Improved Deep CNN (ID-CNN) | Faster R-CNN | Hybrid CNN and RNN | AX-RetinaNet |
| Dataset | 2000 images (1,000 Premium, 1,000 non-Premium) | 500 images (various tea leaf diseases) | 1,000+ images of diseased leaves | 500 images of tea leaves | 300+ images of diseased leaves | Fluorescence imaging dataset |
| Pre-processing Techniques | Data Augmentation (Rotation, Shift, Shear, Flip) | Data Augmentation | Data Augmentation | Standard Augmentation | Standard Augmentation | Fluorescence Imaging |
| Accuracy | 97% (Adam optimization) | 85% | 90% | 92% | 88% | 93% |
| Optimization Algorithm | RMSprop and Adam | Adam | Adam | SGD | Adam | AX-RetinaNet built-in optimizer |
| Number of Epochs | 90 | 50 | 30 | 100 | 20 | 60 |
| Focus on Tea Quality | Yes (Premium and non-Premium classification) | No (disease detection) | No (disease detection) | No (disease detection) | No (disease detection) | No (leaf condition classification) |
| Technology Suitability | Suitable for mobile and embedded systems | General deep learning models | Designed for cloud-based systems | Suitable for real-time systems | Not specified | Specialized for fluorescence imaging |
| Contribution to Tea Industry | Quality classification for optimizing tea production | Tea health management | Disease management | Real-time disease detection | Disease classification | Specialized classification based on leaf characteristics |
Comparison of proposed tea leaf quality classification study with previous research.
4 Conclusion
This study successfully developed a deep learning–based system for classifying the quality of black tea leaves into Premium and non-Premium categories using the MobileNetV2 architecture. By applying two optimization techniques, Adam and RMSprop, and adjusting the number of epochs and learning rates, the system achieved high accuracy results. Specifically, Adam achieved the highest accuracy of 97% at 90 epochs with a learning rate of 0.001, while RMSprop reached 96% at 80 epochs with the same learning rate. The dataset consisted of 2,000 images, with 80% used for training and 20% for testing, which helped reduce model bias and improve reliability.
While the system demonstrates strong potential, further validation is required using larger and more diverse datasets to confirm its generalizability and performance in real-world scenarios. Future research should expand the dataset with real-world variations and include comprehensive evaluations using confusion matrix, precision, recall, and F1-score to gain deeper insights into the model’s behavior beyond accuracy alone. Additionally, exploring other deep learning architectures, such as EfficientNet or DenseNet, may offer improvements in processing speed and efficiency, especially for real-time applications. Integrating this system into mobile platforms for on-site, real-time tea leaf quality assessment could further enhance its practical utility for farmers and production facilities, providing a scalable and accessible solution to support quality control in the tea industry.
Statements
Data availability statement
The raw data supporting the conclusions of this article will be made available by the authors, without undue reservation.
Author contributions
II: Writing – original draft, Project administration, Formal Analysis, Methodology, Supervision, Data curation, Visualization, Software, Conceptualization, Validation, Resources, Writing – review and editing, Funding acquisition, Investigation. AA: Investigation, Supervision, Data curation, Methodology, Writing – review and editing, Software, Conceptualization, Visualization, Resources, Formal Analysis, Funding acquisition, Validation, Writing – original draft, Project administration.
Funding
The author(s) declare that no financial support was received for the research and/or publication of this article.
Conflict of interest
The authors declare that the research was conducted in the absence of any commercial or financial relationships that could be construed as a potential conflict of interest.
Generative AI statement
The author(s) declare that no Generative AI was used in the creation of this manuscript.
Publisher’s note
All claims expressed in this article are solely those of the authors and do not necessarily represent those of their affiliated organizations, or those of the publisher, the editors and the reviewers. Any product that may be evaluated in this article, or claim that may be made by its manufacturer, is not guaranteed or endorsed by the publisher.
References
1
Altim M. Z. Faisal S., K. Yudhistira A. Syamsul R. A. Andi Y. Rita A. S. (2022). Pengklasifikasi beras menggunakan metode cnn (convolutional neural network). J. instek inform. sains dan. teknol.7, 151–155. 10.24252/instek.v7i1.28922
2
Bao W. Fan T. Liang D. Li H. (2022). Detection and identifcation of tea leaf diseases based on AX-RetinaNet. Sci. Rep. 10.1038/s41598-022-06181-z
3
Carneiro T. Nobrega R. V. Nepomuceno T. Bian G.-B. (2018). Performance analysis of google colaboratory as a tool for accelerating deep learning applications. IEEE6, 61677–61685.
4
Datta S. Gupta N. (2023a). “A novel approach for the detection of tea leaf disease using,” in International conference on machine learning and data engineering.
5
Datta S. Gupta N. (2023b). “A novel approach for the detection of tea leaf disease using CNN,” in International conference on machine learning and data engineering.
6
Ekoputris R. O. (2018). Mobilenet: deteksi objek pada platform Mobile. Available online at: https://medium.com/nodeflux/mobilenet-deteksi-objek-pada-platform-mobile-bbbf3806e4b3.
7
Fajri F. N. Tholib A. Yuliana W. (2022). “Penerapan machine learninguntuk penentuan matakuliah pilihan pada program studi informatika,” in Jurnal teknik informatika dan sistem informasi.
8
Food and Agriculture Organization of the United Nations (2022). International tea market: market situation, prospects and emerging issues. Food Agric. Organ. U. N. Available online at: https://www.fao.org/3/cc0238en/cc0238en.pdf.
9
Gelar Guntara R. (2023). Pemanfaatan google colab untuk aplikasi pendeteksian masker wajah menggunakan algoritma deep learning YOLOv7. J. Teknol. Dan. Sist. Inf. Bisnis5 (1), 55–60. 10.47233/jteksis.v5i1.750
10
Gensheng H. Xiaowei Y. Yan Z. Mingzhu W. (2019a). Identification of tea leaf diseases by using an improved deep. J. Pre-proof Sustain. Comput. Inf. Syst.
11
Gensheng H. Xiaowei Y. Yan Z. Mingzhu W. (2019b). Identification of tea leaf diseases by using an improved deep CNN. Sustain. Comput. Inf. Syst. 10.1016/j.suscom.2019.100353
12
Hossain M. S. Mou R. M. Hasan M. M. Chakraborty S. Razzak M. A. (2018). Recognition and detection of tea leaf’s diseases. Int. Colloquium Signal Process. and its Appl.
13
Humas Kementerian Koordinator Bidang Perekonomian (2022). Kolaborasi dan sinergi untuk tingkatkan produksi dan daya saing the Indonesia. Kementerian Koordinator Bidang Perekonomian Republik Indonesia. Available online at: https://www.ekon.go.id/publikasi/detail/3950/kolaborasi-dan-sinergi.
14
Karimah F. (2023). Preliminary study for cyber intrusion detection using machine learning approach. Jurnal Sistem Informasi dan Teknik Informatika.
15
Leonardo F. Taufik N. I. Rianawati D. (2019). Analisa Karakteristik Peminum The di Kota Bandung. J. Akunt.11, 77–97. 10.28932/jam.v11i1.1543
16
Paranavithana I. R. Kalansuriya V. R. (2021). Deep convolutional neural network model for. IAENG Int. J. Comput. Sci.
17
Pardede H. F. (2023). Penerapan Pembelajaran Mesin (Machine Learning) dan Pembelajaran Dalam (Deep Learning) Berkinerja Tinggi untuk Mendukung Sektor Pertanian di Indonesia. Badan Ris. Dan. Inov. Nas. 10.55981/brin.872
18
Perera L. H. Devotta S. D. Withanage S. M. (2022a). “An effective tea leaf classifier using faster R-CNN with real-time object detection,” in Research gate.
19
Perera L. H. Devotta S. D. Withanage S. M. (2022b). An effective tea leaf classifier using faster R-CNN with real-time object detection. 10.13140/RG.2.2.23607.80802
20
Ramanda M. R. Nurjanah S. Widyasanti A. (2021). Energy analysis of Black tea processing process (CTC) with decision-making systems by space method. J. Tek. Pertan. Lampung. 10.23960/jtep-l.v10.i2.183-192
21
Riyana I. Suarna N. Dwilestari G. (2023). Analisa dataset penjualan the menggunakan algoritma linear regresi. J. Teknol. Ilmu Komput.10.56854/jtik.v2i2.81
22
Rizal S. Caesar N. K. Ibrahim N. Vidya H. Saidah S. Fu'adah Y. N. (2020). Klasifikasi daun the seri GMB menggunakan convolutional neural network. J. Electr. Syst. Control Eng.
23
Sucia D. Larasabi A. T. Azhar Y. Sari Z. (2023). Classification of coffee leaf diseases using CNN. Game Technol. Inf. Syst. Comput. Netw. Comput. Electron. Control.
24
Tea - Indonesia (2023). Available online at: https://www.statista.com/outlook/cmo/hotdrinks/tea/indonesia.
25
Teka D. (2024). Automatic tea leaf classification using deep learning models. EJAS J. Sci. Technol.
26
Trihardianingsih L. Sunyoto A. Hidayat T. (2023). Classification of tea leaf diseases based on ResNet-50 and inception V3. Sink. J. Dan. Penelit. Tek. Inform.8, 1564–1573. 10.33395/sinkron.v8i3.12604
27
Wei K. Chen B. Li Z. Chen D. Liu G. Lin H. et al (2022a). Classification of tea leaves based on fluorescence imaging and. MDPI.
28
Wei K. Chen B. Li Z. Chen D. Liu G. Lin H. et al (2022b). Classification of tea leaves based on fluorescence imaging and AX-RetinaNet. MDPI Sensors. 10.3390/s22062181
29
Yucel N. Yildirim M. (2023). Classification of tea leaves diseases by developed CNN, feature fusion, and. Int. J. Appl. Math. Electron. Comput.
Summary
Keywords
CNN, epoch, quality, learning rate, MobileNetV2, black tea
Citation
Irawati ID and Adianggiali A (2025) MobileNetV2-based classification of premium tea leaves for optimized production. Front. Sens. 6:1625488. doi: 10.3389/fsens.2025.1625488
Received
09 May 2025
Accepted
28 July 2025
Published
15 October 2025
Volume
6 - 2025
Edited by
Navod Neranjan Thilakarathne, University of Colombo, Sri Lanka
Reviewed by
Zaharaddeen Karami Lawal, Universiti Brunei Darussalam, Brunei
Nethmini T. Weerawarna, University of Colombo, Sri Lanka
Updates
Copyright
© 2025 Irawati and Adianggiali.
This is an open-access article distributed under the terms of the Creative Commons Attribution License (CC BY). The use, distribution or reproduction in other forums is permitted, provided the original author(s) and the copyright owner(s) are credited and that the original publication in this journal is cited, in accordance with accepted academic practice. No use, distribution or reproduction is permitted which does not comply with these terms.
*Correspondence: Indrarini Dyah Irawati, indrarini@telkomuniversity.ac.id
Disclaimer
All claims expressed in this article are solely those of the authors and do not necessarily represent those of their affiliated organizations, or those of the publisher, the editors and the reviewers. Any product that may be evaluated in this article or claim that may be made by its manufacturer is not guaranteed or endorsed by the publisher.