 Ntsoaki Mphuthi
 Lucky Mashudu Sikwhivhilu
 Suprakas Sinha Ray
 Bulelwa Ntsendwana
- 1DSI-Mintek Nanotechnology Innovation Centre, Randburg, South Africa
- 2Department of Chemical Sciences, University of Johannesburg, Doornfontein, South Africa
- 3Department of Chemistry, Faculty of Science, Engineering and Agriculture, University of Venda, Thohoyandou, South Africa
- 4Centre for Nanostructures and Advanced Materials, DSI-CSIR Nanotechnology Innovation Centre, Council for Scientific Industrial Research, Pretoria, South Africa
Abnormal dopamine (DA) levels in the human body are associated with severe health conditions, making their accurate detection crucial for early diagnosis and monitoring. Therefore, the development of a highly sensitive electrochemical sensor for DA detection is of significant importance in physiological, biochemical, pharmaceutical, and medical applications. In this study, screen-printed electrodes (SPEs) were fabricated using MoS2-based conductive inks containing varying concentrations of silver nanoparticles (Ag NPs) to enhance electrocatalytic activity. The ink composition included ethyl cellulose and polyvinylpyrrolidone (PVP) as binders, providing structural integrity and adhesion, while terpineol was used as the solvent to achieve the desired viscosity for smooth and consistent printing. The printed electrodes underwent comprehensive electrochemical characterization to assess their performance, including stability, reproducibility, and sensitivity. Electrochemical analysis revealed that the SPCE/MoS2-Ag,4 electrode exhibited the best sensing characteristics due to the optimized interaction between MoS2 and Ag NPs, which facilitated improved electron transfer and enhanced detection capability. The electroanalytical performance of the sensors was assessed using cyclic voltammetry (CV), electrochemical impedance spectroscopy (EIS), and chronoamperometry. The SPCE/MoS2-Ag,4 sensor demonstrated a wide linear detection range from 0.01 to 0.08 mM and an exceptionally low limit of detection (LOD) of 0.016 μM for DA. Additionally, the sensor exhibited excellent reproducibility, high sensitivity, and strong selectivity, making it a promising candidate for reliable dopamine detection in biomedical and clinical applications.
1 Introduction
Dopamine (DA) is a neurotransmitter essential for regulating human metabolism. It plays a crucial role in emotional regulation and cognitive functions, including stress, behavior, and attention (Sajid et al., 2016). In human blood samples, DA levels typically range from 10−6 to 10−9 mol/L (Sajid et al., 2019; Rana et al., 2023; Li et al., 2025). Abnormal concentrations of DA are linked to various diseases, including Alzheimer’s, Huntington’s, and Parkinson’s diseases, schizophrenia, Tourette syndrome, thyroid hormone deficiency, depression, epilepsy, and cardiovascular disorders (Sajid et al., 2019; Rana et al., 2023; Li et al., 2025; Balkou et al., 2023), among others. Therefore, monitoring DA levels in biological fluids is essential for the rapid, accurate, and early diagnosis of these diseases. Additionally, analytical methods that offer sensitive, selective, simple, easy-to-use, efficient, and cost-effective DA detection are highly needed. Electrochemical methods, in general, provide all these advantages. Unlike traditional laboratory-based analytical techniques, Electrochemical methods are not complex, expensive, or time-consuming and do not require highly skilled laboratory personnel to operate them (Balkou et al., 2023; Patella et al., 2021). Additionally, they can be easily miniaturized into portable systems that can be applied for on-site measurements, which are very crucial in monitoring diseases. DA, classified as an electroactive and easily oxidizable catecholamine, can be effectively detected electrochemically without the need for enzymes. However, its detection is often challenged by interference from other compounds present in biological samples, such as uric acid (UA) and ascorbic acid (AA), which coexist at concentrations far exceeding that of DA (Sajid et al., 2016; Patella et al., 2021). In physiological fluids, UA is present at much higher concentrations (160–500 µM) and AA ranges from 11.5 to 115 µM (Deffo et al., 2022; Moradpour and Beitollahi, 2022; Mazzara et al., 2021).
UA is a byproduct of purine metabolism, and its presence in biological samples can indicate symptoms of various health conditions. AA, a natural reducing agent, plays a crucial role in protecting the body against biological oxidative processes (Sajid et al., 2016). Moreover, DA, UA, and AA have very similar oxidation potentials, making their electrochemical detection very challenging (Sajid et al., 2016; Patella et al., 2021). To address these challenges, researchers have developed various chemically modified electrodes, as the accuracy and sensitivity of electrochemical detection largely depend on the electrode material used. Chemically modified electrodes offer enhanced electrocatalytic activity for detecting target analytes due to the unique properties of the modification material. Compared to bare electrodes, they are less prone to surface fouling and oxide formation (Sajid et al., 2019). As a result, numerous research articles focus on electrochemical methods for detecting DA, both individually and in the presence of other neurotransmitters, particularly UA and AA, using chemically modified electrodes. Despite the excellent electrochemical performance of the developed modified electrodes, most remain at the proof-of-concept stage and are not suitable for real-life applications. This limitation arises due to challenges such as complex material synthesis, high costs, labor-intensive and highly complex modification processes, and the lack of biocompatibility in certain electrode materials (Sajid et al., 2019). The most commonly used modification process is drop-casting. It is simple, convenient, and cost-effective, requiring minimal equipment. However, it has several downsides, such as low reproducibility, uneven distribution of the deposited material (Pavličková et al., 2022), lack of scalability, and formation of the coffee ring effect, where solute particles accumulate at the edges of the drying droplet, resulting in non-uniform film thickness (Dikansky et al., 2023). In contrast, screen-printing as a modification method provides several advantages, especially for the fabrication of electrochemical sensors. This technique enables the production of low-cost, single-use screen-printed electrodes with customizable thickness, surface properties, and composition (Pavličková et al., 2022; Paimard et al., 2023). Additionally, it allows for the easy incorporation of catalysts into the printing ink, enhancing the electroactive surface area and enabling reproducible manufacturing, which improves the sensitivity and specificity of the resulting sensors (Paimard et al., 2023; Bonacin et al., 2018). Lastly, the inks can also be printed on both rigid and flexible substrates (Pavličková et al., 2022).
In that context, researchers continue to explore novel electrode materials and enhance electrochemical sensor technology while striving to overcome existing limitations. Their efforts focus on developing approaches that are not only highly sensitive and selective but also simple, cost-effective, and scalable for mass production. The ultimate goal is to create practical and efficient electrochemical sensing platforms that can be seamlessly integrated into real-life applications. Two-dimensional (2D) nanomaterials such as molybdenum disulfide (MoS2) have emerged as highly promising candidates for the development of selective and ultrasensitive electrochemical sensors (Kalambate et al., 2022), due to remarkable physicochemical properties, such as high surface-to-volume ratio, excellent mechanical strength, diverse electrical characteristics ranging from metallic to semiconducting, enhanced catalytic activity, and unique intercalated morphologies (Kalambate et al., 2022). Furthermore, 2D MoS2 exhibits remarkable properties, including layer-dependent band gaps, a large surface area, biocompatibility, high electron mobility, enhanced optical absorption, mechanical stability, and ease of surface modification (Ghosh et al., 2024). Its large surface area also provides abundant active sites along the edges of 2D MoS2, which in turn enhances its catalytic activity, making it highly effective for various chemical reactions, including the electrochemical oxidation of DA (Sabar et al., 2022). However, due to its layered structure and high surface energy, MoS2 tends to aggregate through π-π interactions, which can block these catalytic edge sites and hinder its performance (Wu et al., 2022). To address this challenge, various strategies have been developed, one of the most effective being the formation of nanocomposites with other materials (Ghosh et al., 2024; Sabar et al., 2022; Wu et al., 2022). Research has demonstrated that surface and edge defects in MoS2 allow for easy surface modification and generate free sulfur (S) sites, creating vacancies that promote integration with other materials. This, in turn, significantly enhances sensing efficiency (Ghosh et al., 2024; Wu et al., 2022). Moreover, the detection capabilities of MoS2 are greatly improved when functionalized or combined with metal nanoparticles, further boosting its electrochemical performance (Mphuthi et al., 2022). For instance, incorporating metal nanoparticles can enhance the charge transport rate and create synergistic effects, while combining MoS2 with other 2D materials can significantly reduce self-aggregation (Ghosh et al., 2024). Given these advantages, extensive research has been conducted on MoS2-based biosensors. The expanding body of literature highlights the growing interest in MoS2 as a highly promising material for advancing next-generation of electrochemical biosensors.
In this study, highly viscous and screen-printable MoS2 inks were developed by mixing MoS2 with varying concentrations of silver nanoparticles (Ag NPs). The formulated inks were screen-printed onto carbon-based screen-printed electrodes (SPCEs) on a flexible polyethylene terephthalate (PET) substrate, ensuring a cost-effective and versatile platform for electro-oxidation of DA in the presence of AA and UA interfering species found in body fluid samples.
2 Experimental procedure
2.1 Materials
All chemicals used in this study were of analytical grade (purity ≥98%) and were utilized without any further purification. Uric acid (UA), Dopamine (DA), Ascorbic acid (AA), Serotonin, Potassium chloride, Sodium chloride (NaCl), Phosphate buffered saline (PBS) tablets, Potassium ferricyanide, Terpineol, Sodium molybdate, Thioure, Polyvinylpyrrolidone (PVP), hydrazine hydrate (N2H4), Ethylcellulose (EC), and Triethylamine were purchased from Merck (South Africa). Hydrochloric acid (HCl) and silver nitrate were purchased from Associated Chemical Enterprises (ACE) (South Africa). Carbon ink (C2130814D2), silver/silver chloride ink (Ag/AgCl) (C2130809D5), and dielectric ink (D2070200P6) were purchased from Sun Chemical (USA). Polyethylene terephthalate (PET) substrate was purchased from HIFI Polyester Film, (UK).
2.2 Hydrothermal synthesis of MoS2 nanosheets
A modified hydrothermal method, adapted from references (Li et al., 2016; Miao et al., 2016), was used for the synthesis of MoS2 nanosheets. Sodium molybdate (0.0074 mol) and thiourea (0.03 mol) in a 1:4 M ratio were dissolved in 150 mL of deionized water. Approximately 15 mL of hydrazine hydrate was added as a reducing agent. The pH of the precursor solution was adjusted to five using dilute HCl. After continuous stirring for 30 min, the resulting solution was transferred to a 200 mL Teflon-lined stainless steel autoclave, which was then placed in an oven and heated at 220 C for 24 h. Once cooled to room temperature, the synthesized MoS2 nanosheets were centrifuged and washed several times with 0.1 M HCl and ethanol. Finally, the nanosheets were dried overnight at 60 C.
2.3 Synthesis of silver nanoparticles
The synthesis of Ag NPs was adapted from reference (Wu and Hsu, 2011). In a typical procedure, approximately 1.7 g of silver nitrate (AgNO3) was dissolved in 10 mL of deionized water to prepare a 1 M solution. To this solution, 1.395 mL of triethylamine was added, resulting in a colour change from colourless to black. The mixture was stirred continuously at room temperature for 3 h and 30 min. The resulting precipitates were washed multiple times with ethanol and centrifuged to remove any unbound triethylamine. Finally, the obtained Ag NPs were dried at 60 C for 24 h. The dried silver nanoparticles were then re-dispersed in terpineol to prepare Ag NP suspensions for further use.
2.4 MoS2 and MoS2-Ag ink preparation
First, the polymeric binders were prepared by separately dissolving polyvinylpyrrolidone (PVP) and ethyl cellulose in terpineol. The two binder solutions were then combined. MoS2 ink was formulated by dispersing MoS2 nanosheets into the prepared polymeric binder. MoS2-Ag inks were formulated by dispersing MoS2 nanosheets functionalized with varying amounts of Ag NPs into the same polymeric binder. All ink formulations were homogenized through ultrasonication for 6 h. The experimental parameters are summarized in Table 1.
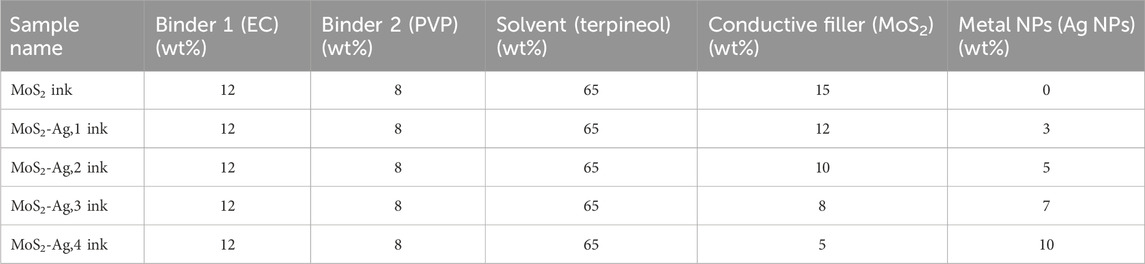
Table 1. Experimental parameters for ink formulation.
2.5 Screen-printing and fabrication of SPCE/MoS2 and SPCE/MoS2-Ag
The screen-printed carbon electrodes (SPCEs) were printed on PET substrates measuring 32.1 cm × 36.1 cm with a thickness of 250 microns, using a DEK248 semi-automatic screen printer. The printing process was controlled by the DEK printing machines 2.4.0 software. Initially, carbon ink was screen-printed to form the conductive layer, which was then allowed to dry at room temperature for 24 h. Following this, MoS2 and MoS2-Ag inks were printed onto the carbon layer to serve as the working electrodes (WE) and counter electrodes (CE). Silver/silver chloride (Ag/AgCl) ink was used to print the reference electrode. The working electrode had a diameter of 3 mm.
2.6 Characterization techniques
UV-visible spectroscopy (Molecular Devices, SpectraMax ABS Plus) was used to investigate the optical absorption properties of the synthesized MoS2 nanosheets and Ag NPs. Measurements were performed over a wavelength range of 200–1000 nm. The samples were placed in plastic cuvettes with a path length of 1 cm, and ethanol and terpineol were used as the reference solvents to ensure accurate baseline correction. The crystallinity and phase composition of the Ag and MoS2 nanomaterials were investigated using X-ray diffraction (D8 Advance diffractometer equipped with Lynx-eye XE detector operated at 40 kV, 20 mA, CuKα1 radiation (λ = 1.78897). The X-ray diffraction patterns were recorded in the 2θ range from 5° to 80°. Compound identification was accomplished by comparison of measured spectra with the spectra of pure samples from the database (JCPDS, Card No. 00-001–1041 and 1011286). The morphology and structural characterization of the as-synthesized MoS2 and Ag nanostructures were characterized using a transmission electron microscope (TEM, G2 F30). The chemical functional groups on the synthesized MoS2 were studied using an attenuated total reflectance Fourier transform infrared (ATR-FTIR) spectrophotometer (PerkinElmer Spectrum UATR Two) and Raman spectroscopy (Renishaw Invia Raman spectrometer equipped with a laser (λ = 532 nm).
2.7 Electrochemical measurements
All electrochemical experiments were conducted using a computer-controlled Autolab Potentiostat/Galvanostat PGSTAT 302 N (Eco Chemie, Utrecht, the Netherlands), which was operated by NOVA 2.1.4 data processing software for precise control and data acquisition. Electrochemical impedance spectroscopy (EIS) measurements were performed with the integrated AUTOLAB frequency response analyzer (FRA32M). The data obtained from the EIS experiments were fitted using the Randles circuit model available in the NOVA software, ensuring accurate analysis of the electrochemical parameters such as charge transfer resistance, double-layer capacitance, and solution resistance.
3 Results and discussion
3.1 Optical properties
Ag NPs have unique optical properties, making them a key focus in nanoscience research. While their well-known surface plasmon resonance (SPR) absorption band appears around 400 nm, the absorption band at 300 nm in UV-Vis spectra is linked to electronic transitions and material interactions. In Figure 1a, the absorption band at 325 nm is mainly due to interband transitions in Ag NPs, where electrons from the 4d valence band valence band are excited to the 5sp conduction band when exposed to UV light (Abkhalimov et al., 2022; Ershov et al., 2021). Unlike SPR, which results from the collective oscillation of free electrons, interband transitions involve discrete electron energy states, leading to a broad absorption band in the UV range (≤320 nm). This transition starts around 3.8 eV (320 nm) and extends to higher energies, sometimes overlapping with the SPR band in smaller nanoparticles
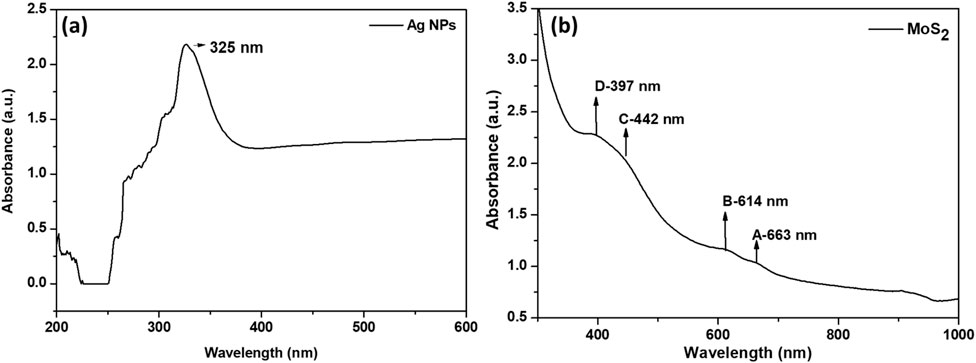
Figure 1. UV-vis absorption spectrum of (a) Ag nanoparticles and (b) MoS2 nanosheets.
Figure 1b shows the UV–vis absorption spectrum of the synthesized MoS2 nanosheets dispersed in a 1:1 mixture of water and ethanol. The absorption spectra exhibited two distinctive absorbance peaks assigned to exciton bands A and B between 600 and 700 nm (Eda et al., 2011; Vikraman et al., 2017). These excitonic peaks are considered to result from direct band gap transitions between the maxima of split valence bands and the minimum of the conduction band, all positioned at the K point of the Brillouin zone (Eda et al., 2011; Mak et al., 2010). The A and B excitons peaks in single-layer MoS2 are found to shift upwards in energy relative to those of the bulk counterpart and have smaller separation due to the spin-orbit splitting of transitions at K point (Wang et al., 2013). The C and D absorption peaks between 400 nm and 450 nm may be attributed to the direct transition from the deep valence band to the conduction band (Vikraman et al., 2017). Furthermore, the peaks (C and D) have been reported to be influenced by the lateral dimensions of MoS2 sheets (Ghayeb Zamharir et al., 2018). As the amount of nano-sized MoS2 sheets increases, the absorption peaks C and D become higher, while the relative intensity of the absorption peaks A and B decreases. Also, the energy of C and D absorption peaks undergoes blue shift as the size of the MoS2 sheets is decreased, demonstrating a quantum size effect (Ghayeb Zamharir et al., 2018; Mukherjee et al., 2015).
3.2 Structural properties
3.2.1 FTIR analysis
FTIR spectroscopy was conducted to analyze the functional groups in the synthesized Ag NPs and 2D MoS2 nanosheets, (Figure 2). The Ag NPs spectra exhibited transmission peaks corresponding to amine (N-H) and hydroxyl (O-H) groups, indicating the presence of triethylamine as a reducing and capping agent. A weak vibration band at 2,929 cm-1 was assigned to the asymmetric stretching of C-H in aliphatic groups (Ansari et al., 2021; Anju et al., 2021). Absorption bands at 1930, 2,105, and 2,236 cm-1 corresponded to ═C–H, alkynes, and CN groups, respectively (Pasieczna-Patkowska et al., 2025; Naveed et al., 2022). The band at 1527 cm-1 was attributed to amide II stretching (Pasieczna-Patkowska et al., 2025), while the 1367 cm-1 band likely resulted from C-N (amine-like) or C-O (phenol-like) functional groups (Prabakaran et al., 2023). The tertiary amine’s C–N asymmetric stretching vibration appeared at 1026 cm-1 (Pasieczna-Patkowska et al., 2025). The tertiary amine aids in reducing Ag+ to Ag0 by donating electrons from its nitrogen lone pair. This process initiates nucleation, where Ag+ ions in solution accept electrons to form metallic silver clusters (Pasieczna-Patkowska et al., 2025). The strong absorption band at 810 cm-1 was due to the stretching vibrations of Ag NPs (Patil and Chougale, 2021; Sharma et al., 2022). After reduction, triethylamine adsorbs onto the Ag NP surfaces through coordination bonding between its nitrogen lone pair and silver atoms. This interaction forms a protective layer that prevents agglomeration by providing steric hindrance and adjusting the surface charge to enhance electrostatic repulsion (Pasieczna-Patkowska et al., 2025).
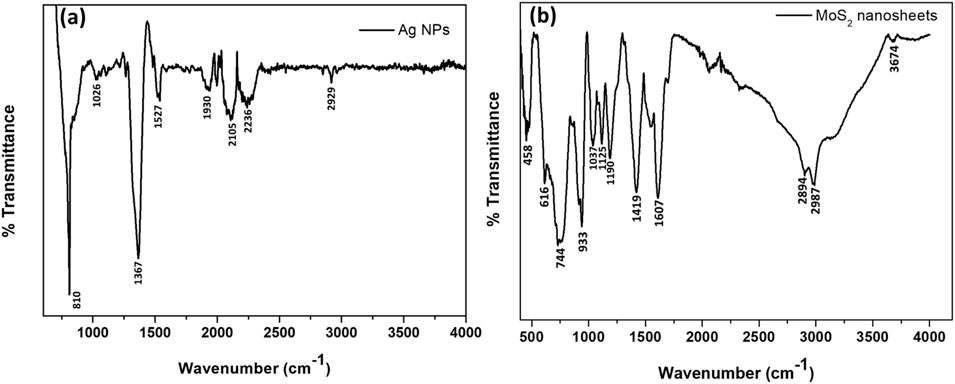
Figure 2. FTIR spectrum of (a) Ag nanoparticles and (b) MoS2 nanosheets.
The FTIR spectra of MoS2 confirmed the formation of pure MoS2 nanosheets, as evidenced by the presence of characteristic absorption bands and the absence of detectable impurities. The spectra showed absorption bands at 458, 616, 744, 933, 1037, 1125, 1190, 1419, 1607, 2,894, 2,987, 3,674 cm-1. The bands at 458 and 616 cm-1 correspond to Mo-S bonds in MoS2, while the band at 933 cm-1 is attributed to S-S bonds (Chaudhary et al., 2018; Massey et al., 2016). The absorption bands in the 1037–1125 cm-1 range are associated with the asymmetric S–O stretching of sulfate species (Feng et al., 2013). The absorption band at 1190 cm-1 is attributed to the presence of Mo-O bonds and their stretching vibrations (Chaudhary et al., 2018). Moreover, the band at 1419 cm-1 corresponds to the stretching vibration of the S-Mo-S bond (Han et al., 2022). The presence of Mo-O stretching suggests possible oxidation, which can influence the electronic structure and charge transfer properties of MoS2. This, in turn, affects its optical absorption characteristics observed in UV-Vis spectroscopy, where shifts in excitonic peaks can be linked to structural alterations. Similarly, the S-Mo-S stretching band highlights the retention of the layered MoS2 structure, which correlates with its characteristic exciton absorption peaks in the 600–700 nm range. The spectra exhibited vibrational modes at 1607 and 3,674 cm-1, which are attributed to hydroxyl functionalities from adsorbed moisture on the MoS2 nanosheets (Massey et al., 2016; Han et al., 2022). The symmetric and asymmetric vibrations of -CH2- groups appeared at approximately 2,894 and 2,987 cm-1, respectively. The presence of carbon-containing groups in the samples may result from residual precursors and intermediate products formed during the hydrothermal reaction process (Zhou et al., 2017).
3.2.2 XRD analysis
X-ray diffraction (XRD) was employed to analyze the crystallinity, structure, phase composition, and interlayer dynamics of the synthesized nanomaterials (Figure 3). All peaks observed in the XRD pattern of MoS2 are distinctly indexed to the pure hexagonal MoS2 phase, belonging to the space group P63/mmc. The diffraction peaks shown at 2θ = 16.34°, 38.97°, 46.44°, 57.92°, and 69.62°, correspond to the (002), (101), (103), (105), and (110) crystallographic planes of the MoS2 phase, respectively (Zhang et al., 2019). The sharp diffraction peak at 2θ = 16.34° (002) corresponds to a d-spacing of 0.62 nm and matches JCPDS card number 01-075–1539. This peak confirms the formation of a well-stacked S-Mo-S layered structure along the c-axis, with its intensity influenced by crystallite size and stacking order (Li et al., 2016; Wang et al., 2017). In bulk 2H-MoS2, the (002) peak is typically dominant, whereas nanosheets often exhibit peak broadening or reduced intensity due to a decreased number of layers (Li et al., 2016; Solomon et al., 2020). This structural change directly affects the UV-Vis absorption spectrum. As the number of MoS2 layers decreases, the material shifts from an indirect bandgap (bulk) to a direct bandgap (monolayer), causing a blueshift in the A and B excitonic peaks. This shift occurs due to quantum confinement, where thinner layers restrict electron movement, increasing the bandgap energy. As a result, the absorption edge moves to higher energy (shorter wavelengths), aligning with the broadening and reduced intensity of the (002) diffraction peak (Mak et al., 2010; Mondal et al., 2023).
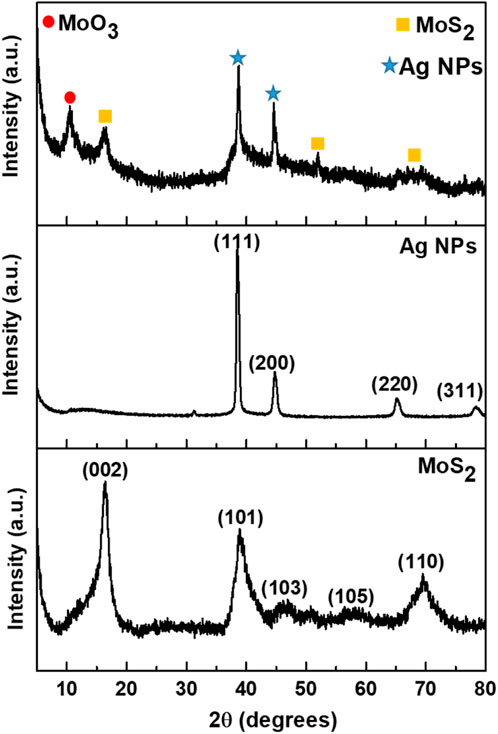
Figure 3. XRD patterns of as-synthesized nanomaterials.
The XRD pattern of Ag NPs displayed diffraction peaks at approximately 2θ = 38.91°, 44.85°, 65.29°, and 78.61°, corresponding to the (111), (200), (220), and (311), crystallographic lattice planes respectively (JCPDS card numbers 00-001–1041). The diffraction peaks reveal the polycrystalline nature of the synthesized silver nanoparticles, confirming the formation of face-centered cubic (FCC) crystalline silver (Mistry et al., 2021; Ali et al., 2023). The crystalline size of the nanoparticles was calculated using the Debye–Scherrer Equation 1 (Mistry et al., 2021; Ali et al., 2023).
Where D is the average diameter of the particles, β is the full width at half maximum calculated from the peak with the highest intensity in radians, λ is the X-ray wavelength in nanometer (nm), and K is Debye Scherer constant (0.9) and the θ is Braggs angle. The crystalline size of Ag NPs was calculated to be 15.3 nm. After decorating MoS2 with Ag NPs, the XRD pattern of the MoS2-Ag nanocomposite exhibited peaks corresponding to both MoS2 and Ag NPs, confirming the successful formation of the composite structure. Additionally, a new peak appeared at 10.56°, associated with the orthorhombic phase of MoO3, likely resulting from the oxidation of MoS2 in a humid environment.
3.2.3 Raman spectroscopy
Raman spectroscopy was utilized to verify the atomic structural arrangement of MoS2. The Raman characteristics, including peak frequency, intensity, and width, are strongly influenced by the number of layers. As shown in Figure 4, the Raman spectrum of MoS2 nanosheets exhibits two primary vibrational modes. These vibrational modes of MoS2 nanosheets appeared at approximately 378.04 cm-1 and 402.21 cm-1 corresponding to the in-plane (E12g) vibrational mode of S atoms and out-of-plane (A1g) vibrational mode of Mo and S atoms respectively (Wang et al., 2013; Sundaram et al., 2013). Previous studies have reported that as the number of MoS2 layers increases, the frequency of the E12g peak gradually decreases, while the A1g peak shifts to a higher frequency (Wang et al., 2013; Sundaram et al., 2013). The weak van der Waals interactions between layers affect the intralayer bonding and influence the lattice vibrations of molybdenum and sulfur atoms (Solomon et al., 2020). Furthermore, the narrowing of the gap between the E12g and A1g bands signifies the exfoliation of MoS2. The frequency difference between these modes is widely recognized as a reliable indicator of layer thickness in 2D MoS2 nanosheets (Wang et al., 2013; Sundaram et al., 2013). The peak separation decreased from 25.52 cm-1 in bulk MoS2 to 24.17 cm-1 in the MoS2 nanosheets, confirming that the synthesized MoS2 has been reduced to a few thin layers. The decrease in peak separation corresponds to a blueshift in the UV-Vis absorption spectrum, where the excitonic peaks shift to shorter wavelengths due to quantum confinement effects and an increase in bandgap energy.
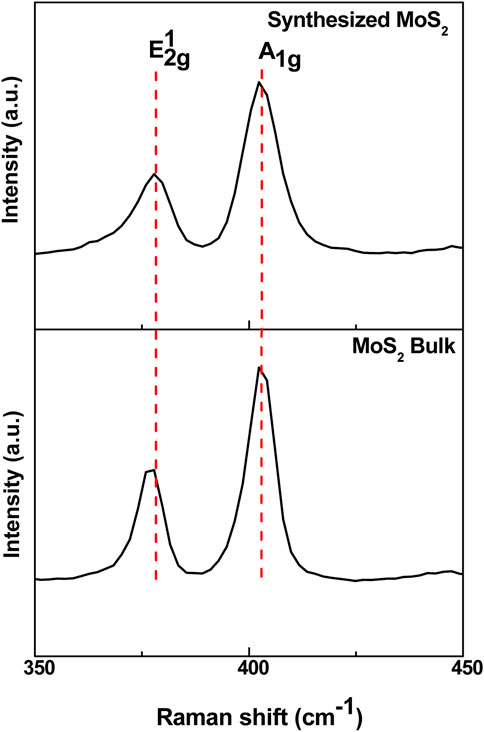
Figure 4. Raman Spectra of bulk MoS2 and MoS2 nanosheets.
3.3 Morphological properties
The TEM image (Figure 5a,b) shows well-dispersed Ag NPs with sizes ranging from 4 to 18 nm. The nanoparticles exhibit a relatively uniform size distribution, with most appearing spherical. However, some variations in shape, including slightly elongated or irregular particles, are also observed. While individual nanoparticles are largely well-separated, minor aggregation is present, likely due to van der Waals interactions or inadequate surface capping by stabilizing agents. The average crystallite size calculated using the Scherrer equation from XRD data is 15.3 nm, aligning well with TEM observations. The TEM image of MoS2 nanosheets (Figure 5c) reveals thin, sheet-like structures. Their transparent to semi-transparent appearance suggests an ultrathin nature. Wrinkling and folding are evident, likely due to the nanosheets' flexible structure and van der Waals interactions between layers. High-magnification TEM imaging indicates that the MoS2 nanosheets primarily consist of five to six stacked monatomic layers. The measured interlayer spacing is approximately 0.62 nm, corresponding to the (002) diffraction plane of MoS2 (Zhang et al., 2014).
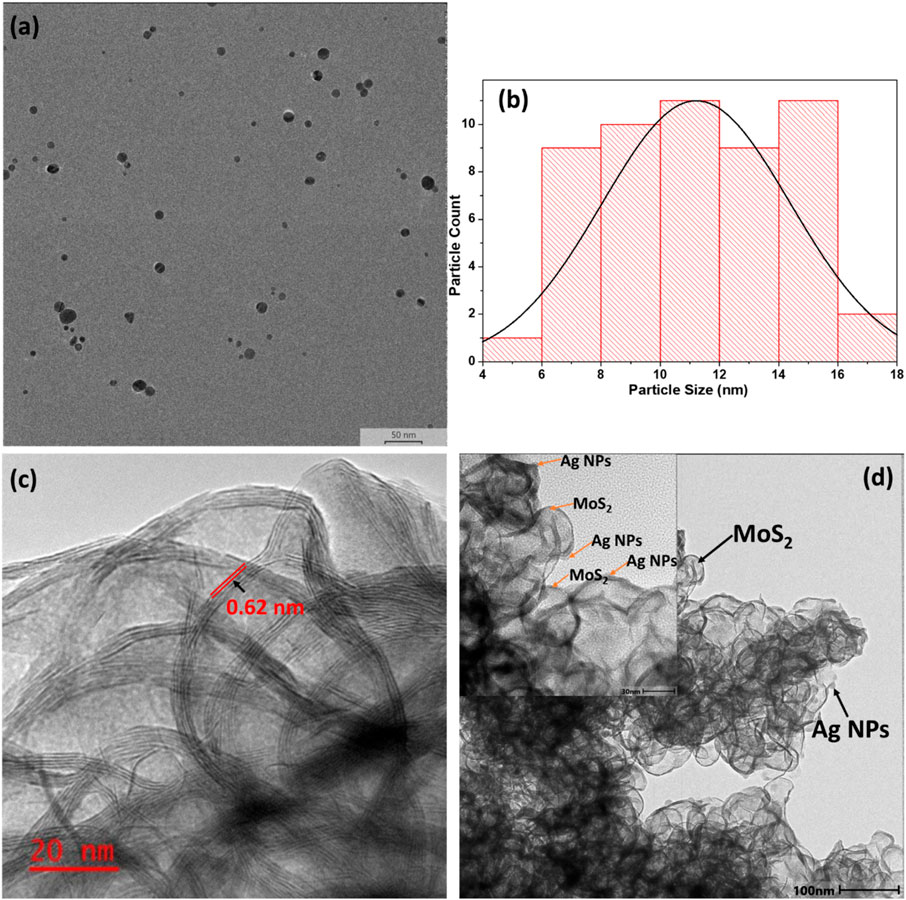
Figure 5. TEM images of (a) Ag NPs, (b) Ag NPs histogram (c) MoS2 nanosheets and (d) MoS2-Ag nanocomposite. Insert: high-magnification TEM image.
The TEM image of MoS2 nanosheets functionalized with Ag (Figure 5d) NPs revealed a well-integrated hybrid nanostructure, where Ag NPs are dispersed across the MoS2 surface. The Ag NPs are anchored onto the nanosheets, suggesting strong interactions between the metal nanoparticles and the MoS2. While the majority of Ag NPs are uniformly distributed, certain regions exhibit clustering or slight aggregation, likely due to strong interparticle interactions. The MoS2 nanosheets maintain their characteristic sheet-like morphology. The presence of Ag NPs did not appear to have significantly altered the structural integrity of the MoS2 sheets, indicating that the functionalization process effectively preserves their ultrathin structure.
3.4 Electrochemical characterization
To comprehensively study the electrochemical performance of the formulated inks, cyclic voltammetry (CV) and electrochemical impedance spectroscopy (EIS) were performed to analyze the electrochemical behaviour of the prepared electrodes. These measurements were conducted in the presence of a 1 mM [Fe(CN)6]3-/4- redox probe in 0.1 M KCl, at a potential range of −1.0 to 1.0 V at a fixed scan rate of 0.01 V s-1. EIS was recorded over the frequency range from 100 kHz to 0.1 Hz and 0.05 Vrms sinusoidal modulation. The redox behaviour of [Fe(CN)6]3−/4− is observed by a couple of redox peaks corresponding to the reversible Fe3+/Fe2+ reduction and oxidation processes. Figure 6 presents various electrodes fabricated using MoS2-Ag-based inks, which were prepared by incorporating different weight percentages of Ag NPs into MoS2. This variation in composition was designed to systematically assess the individual contributions of MoS2 and Ag NPs to the overall sensor performance. By adjusting the Ag NPs concentration, the study aimed to optimize the electrochemical properties of the electrodes and enhance their sensitivity, stability, and overall efficiency in detecting the target analyte. The optimal Ag NP concentration (10 wt%) produced the highest current response, with increasingly distinct oxidation and reduction peaks of the [Fe(CN)6]3-/4- redox probe as Ag content increased. Ag NPs provide excellent conductivity and fast electron transfer kinetics, enhancing the catalytic performance of SPCE/MoS2–Ag electrodes compared to bare SPCE (Belaid et al., 2025). Meanwhile, MoS2 contributes a layered structure with high surface area, offering additional active sites for electron transfer. The combination of Ag and MoS2 generates a synergistic effect that improves charge mobility, further improving the electrode’s overall electrochemical performance (T et al., 2023). The MoS2-Ag,4 composite was identified as the optimal formulation, balancing sufficient Ag loading for conductivity enhancement with preservation of MoS2’s electroactive sites. Higher Ag content (>10 wt%) caused agglomeration and blocked active sites, reducing surface area and hindering electron transfer. This formulation maximizes the synergistic interaction between Ag and MoS2, resulting in the best overall electrochemical performance.
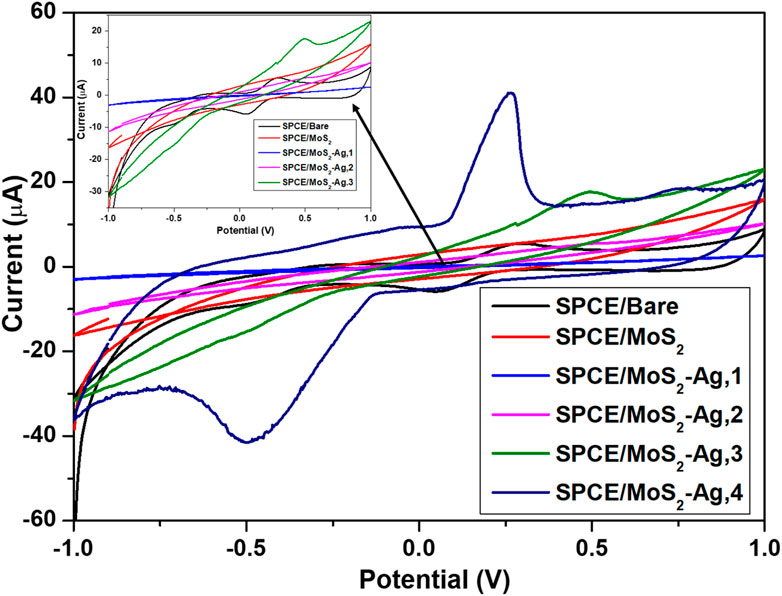
Figure 6. Cyclic voltammetry plots of bare and modified SPCE in 1 mM K [Fe(CN)6]3−/4− redox probe. Insert: cyclic voltammogram highlighting the SPCE-Bare, SPCE/MoS2, and SPCE/MoS2-Ag,1, SPCE/MoS2-Ag,2 and SPCE/MoS2-Ag,3.
The electrochemical surface area was determined to gain deeper insight into the optimization and performance of the fabricated electrodes. This calculation helps evaluate the efficiency of electron transfer and the availability of electroactive sites, ensuring that the electrodes are designed and utilized effectively for enhanced sensor performance. The electroactive surface area (A) was determined using the Randles–Sevcik Equation 2 (Zhang et al., 2024; Maheshwaran et al., 2022).
Where Ip is the peak current, n is the number of electrons involved in the [Fe(CN)6]−3/4 redox process, A is the electroactive surface area, D is the diffusion coefficient of [Fe(CN)6]−3/4 (7.6 × 10⁻⁶ cm2s-1), C the concentration of ferricyanide solution (1 mM) and υ is the scan rate (0.01 Vs-1). The electroactive surface area of SPCE-Bare was 0.0265 cm2, while that of SPCE/MoS2-Ag,2, SPCE/MoS2-Ag,3, SPCE/MoS2-Ag,4 were found to be 0.0272 cm2, 0.0857 cm2, and 0.205 cm2 respectively. A larger electroactive surface area provides more sites for electrochemical reactions, boosting catalytic activity and speeding up electron transfer for better redox efficiency. It also enhances sensitivity by allowing more analyte interactions, resulting in stronger signal responses.
EIS was employed to analyze electrochemical impedance variations and evaluate fabricated electrodes' interfacial electron transfer resistance (Rct) at the electrode-electrolyte interface. The Nyquist plots and the Randles equivalent circuit of bare SPCE and SPCE/MoS2-Ag are illustrated in Figure 7. The fitted equivalent circuit module parameters are also described in Table 2. The Nyquist plots display a semicircle in the low-frequency region, with its diameter representing the Rct of the modified electrodes. Additionally, a straight line at a 45° angle to the horizontal axis in the low-frequency region indicates a diffusion-limited process characterized by the Warburg element (Anuar et al., 2020). The Randles circuit showed characteristic elements; solution resistance (Rs), Rct, constant phase element (CPE), double layer capacitance (Cdl), and Warburg element. All MoS2-Ag modified electrodes displayed semicircles of varying diameters, indicating differences in Rct. The SPCE/MoS2 electrode exhibited a high Rct value of approximately 300 kΩ, indicating significant resistance to electron transfer from [Fe(CN)6]3-/4- due to the inherently poor conductivity of MoS2 (Devi et al., 2019). However, upon incorporating Ag NPs into MoS2, the Rct value decreased considerably, with further reductions observed as the Ag NP content increased. This decline in resistance suggests enhanced electron transfer kinetics of [Fe(CN)6]3-/4- at the electrode surface, highlighting the superior conductivity of the MoS2-Ag nanocomposite. The improved charge transfer efficiency demonstrates the synergistic effect of Ag NPs, which effectively enhance the electrochemical performance of the modified electrode.
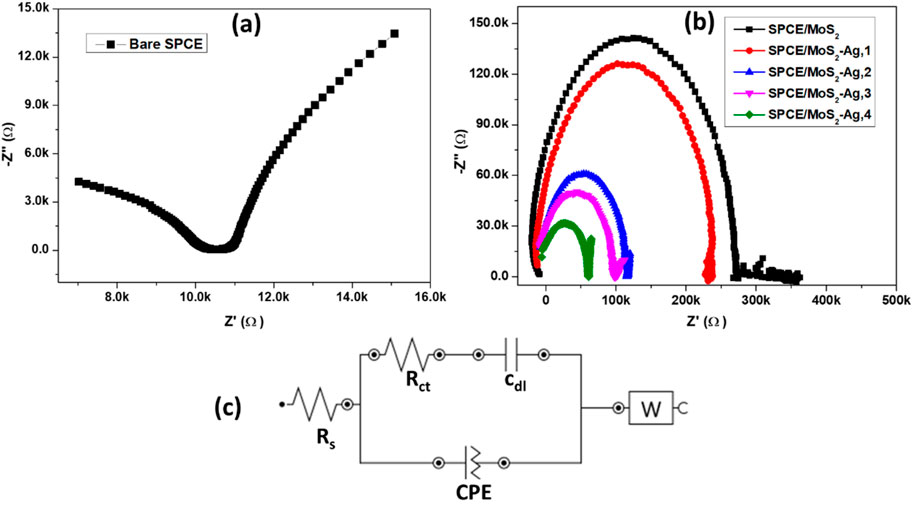
Figure 7. Nyquist plots of (a) bare and (b) modified SPCE in 1 mM K [Fe(CN)6]3−/4− redox probe. (c) Randles equivalent circuit.
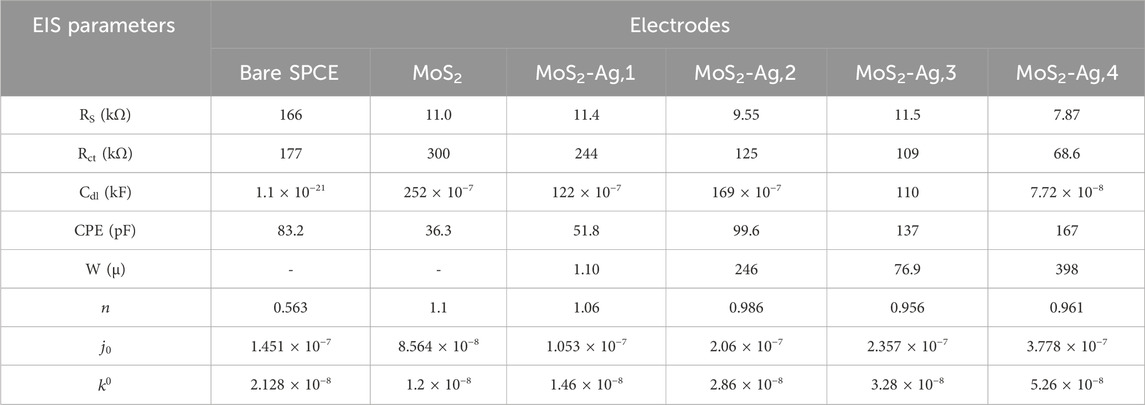
Table 2. EIS data of bare and modified SPCE in 1 mM K [Fe(CN)6]−3/4-.
Additionally, the electron transfer rate constant (
Determining the heterogeneous electron transfer rate constant
3.5 Dopamine detection
To evaluate the DA sensing performance of SPCE/MoS2-Ag,4, cyclic voltammetry (CV) was conducted over a potential range of −1 V to 1 V, both in the absence and presence of 1 mM DA in a 0.1 M phosphate buffer solution (pH 7.4). The SPCE/MoS2-Ag,4 electrode was chosen for DA detection due to its superior electrochemical performance compared to other electrodes, as demonstrated in earlier sections. As shown in Figure 8, a pair of well-defined redox peaks were observed at I (0.148 V), II (0.126 V), and II (−0.164 V), indicating the presence of Ag NPs in the MoS2-Ag conductive ink. The anodic peak corresponds to the oxidation of Ag0 to Ag+, while the cathodic peaks represent the reduction of Ag+ to Ag0 and the reduction of Ag2+ to Ag+, respectively (T et al., 2023; Anshori et al., 2021). Upon the addition of 1 mM DA, a distinct oxidation peak appeared, highlighting the excellent electrochemical performance of the SPCE/MoS2-Ag4 electrode. The enhanced oxidation response arises from the synergistic effects of Ag nanoparticles, and MoS2 nanosheets. Ag nanoparticles provide high conductivity, efficient electrochemical activity, and fast electron transfer, consistent with their well-established electrocatalytic properties for dopamine detection (T et al., 2023; Anshori et al., 2021). Moreover, MoO3, generated through partial oxidation of MoS2, serves as an additional electron mediator that facilitates redox processes and enhances dopamine oxidation. Combined with the large active surface area of the 2D MoS2 nanosheets, the integrated material significantly improves the sensitivity and overall electrochemical performance of the modified electrode (Sharma et al., 2023; Zribi et al., 2021). To determine whether the DA oxidation process on the SPCE/MoS2-Ag,4 electrode is governed by a diffusion-controlled or adsorption-controlled reaction, the effect of scan rate on the peak current response of DA was examined.
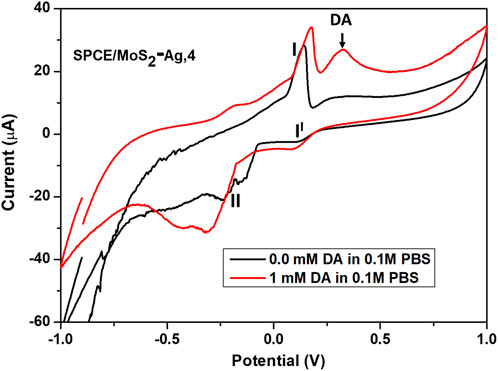
Figure 8. Cyclic voltammograms of the SPCE/MoS2-Ag,4 in the absence and presence of 1 mM DA in 0.1 M phosphate buffer solution of pH 7.4.
3.6 Scan rate studies of SPCE/MoS2-Ag,4 electrode
A scan rate study is commonly used to assess the reaction kinetics of an analyte on the surface of a modified electrode. To investigate the redox properties of the SPCE/MoS2-Ag,4 sensor, the relationship between its electrochemical activity and varying scan rates was examined. The voltammogram response at different scan rates provided valuable kinetic insights into the electrocatalytic process, including diffusion and adsorption effects. Figure 9a presents CV’s of the SPCE/MoS2-Ag,4 recorded within a potential window of −1 to 1 V, with scan rates ranging from 5 to 20 mV/s in an electrolyte solution of 1 mM DA in 0.1 M phosphate buffer (pH 7.4). The results show that the oxidation peak current increases with increasing scan rate, accompanied by a slight shift toward more positive anodic peak potential values. Additionally, the anodic peak current (Ipa) exhibits a linear correlation with the square root of the scan rate (Figure 9b), indicating that the electrooxidation of DA at the electrode surface is primarily adsorption-controlled with partial diffusion effects (Masood et al., 2024). The linear equation describing this relationship and the corresponding correlation coefficient R2 is:
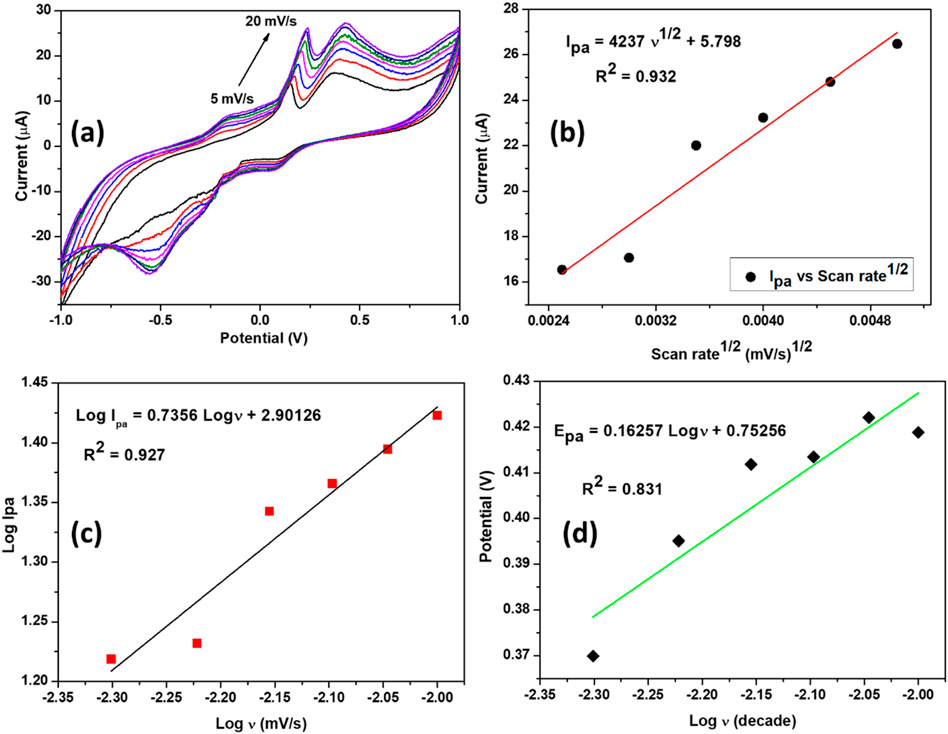
Figure 9. (a) Cyclic voltammograms of the SPCE/MoS2-Ag,4 at different scan rates (5–20 mV/s) in 0.1 M phosphate buffer solution of pH 7.4 containing 1 mM of DA. (b) graph of the anodic peak current versus the square root of scan rate. (c) A graph of the logarithm of anodic peak current versus logarithm of scan rate. (d) A graph of the peak potential versus the logarithm of scan rate.
To further confirm the nature of the processes occurring at the electrode surface, an alternative approach was employed. Specifically, a logarithmic plot of the peak current (log I) versus the scan rate (log v) (Figure 9c) was constructed, as the slope of this plot provides insights into the reaction mechanism. A slope close to one suggests an adsorption-controlled process, whereas a value near 0.5 indicates a diffusion-controlled reaction (Masood et al., 2024; Lang et al., 2022). The obtained correlation slope was 0.735, which is closer to the theoretical value of 1, suggesting that the oxidation reaction at the SPCE/MoS2-Ag,4 electrode is primarily governed by an adsorption-controlled mechanism. The resulting regression equations is:
Furthermore, we investigated the relationship between the anodic peak potential (Ep) and the logarithm of the scan rate (log ʋ) to gain deeper insights into the electrochemical behaviour of the SPCE/MoS2-Ag,4 sensor. The analysis revealed a linear correlation between Ep and log ʋ, indicating a systematic dependence of the oxidation process on the scan rate. To further interpret these findings, the Tafel slope (b) was determined using the Tafel Equation 5, where
The calculated Tafel slope was 0.325 V/dec, which exceeds the theoretical value of 0.118 V/dec expected for a one-electron transfer process (Adesanya and Fayemi, 2024; Tetyana et al., 2023). This deviation suggests the involvement of additional surface interactions, such as the adsorption of reactants or intermediates on the electrode surface (Adesanya and Fayemi, 2024; Tetyana et al., 2023). These results further support the hypothesis that the oxidation process at the SPCE/MoS2-Ag,4 electrode is influenced by adsorption effects, complementing the conclusions drawn from the scan rate studies.
3.7 Repeatability and reproducibility of SPCE/MoS2-Ag,4 sensor
Reproducibility and repeatability are essential parameters for assessing the reliability and overall performance of a sensor. To evaluate the repeatability of the developed DA sensor, 12 consecutive measurements were conducted under identical conditions. As illustrated in Figure 10a, the results demonstrated minimal variation in both the peak potential and current response, confirming that the sensor maintains consistent performance over multiple runs. This stability suggests that a single modified electrode can be utilized for multiple measurements without significant loss of activity, making it suitable for repeated DA detection. Additionally, the reproducibility of the SPCE/MoS2-Ag,4 (Figures 10b,c)sensor was examined using CV across six independently fabricated electrodes. The obtained relative standard deviation (RSD) was 0.13%, indicating excellent reproducibility in the electrode preparation process. This low RSD value confirms that the fabrication method is highly reliable, ensuring uniform sensor performance across different electrodes. Such high reproducibility and repeatability highlight the robustness of the developed sensor, making it a promising candidate for practical applications in DA detection.
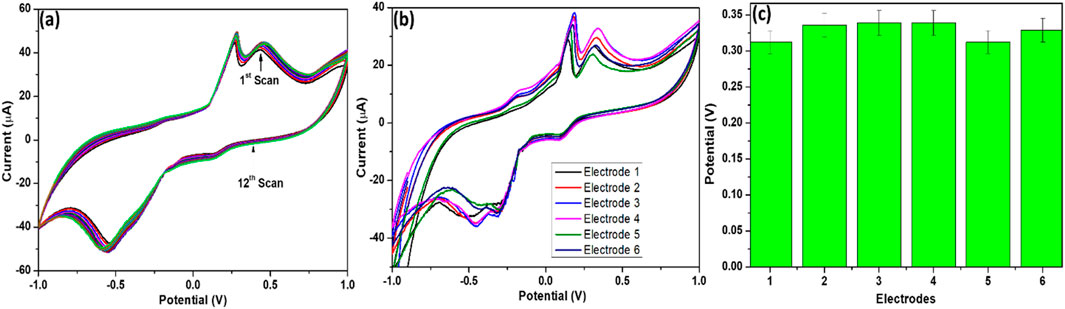
Figure 10. (a) Current response of 12 scans, (b) Cyclic voltammograms and (c) histogram representation of the current responses of six different SPCE/MoS2-Ag,4 sensors in 0.1 M phosphate buffer solution containing 1 mM DA.
3.8 Amperometric detection of DA at SPCE/MoS2-Ag,4 sensor
Amperometric studies were conducted to evaluate the influence of DA concentration on the performance of the developed sensor at a fixed potential of 0.4 V, as well as to determine its detection limit (DL) for DA. To achieve this, chronoamperometric measurements were performed over a period of 100 s, as shown in Figure 11a. The experiments were carried out in an electrolyte solution containing varying DA concentrations, ranging from 0.01 to 0.08 mM, prepared in a 0.1 M phosphate buffer solution (pH 7.4). For each measurement, a freshly prepared SPCE/MoS2-Ag,4 electrode was used to ensure accuracy and eliminate potential carryover effects. The recorded chronoamperometric responses provided insights into the sensor’s sensitivity and response dynamics, helping to characterize its ability to detect DA at different concentration levels. A significant increase in the amperometric current was observed with the gradual rise in DA concentration, demonstrating the sensor’s sensitivity toward dopamine oxidation. Notably, the sensor reached a steady-state current within 40 s, indicating a relatively rapid response time. This fast stabilization suggests efficient electron transfer kinetics and strong interaction between DA and the SPCE/MoS2-Ag,4 electrode surface. Figure 11b represents the calibration curve of the modified electrode toward DA detection and a very good linear response was established with a linear regression equation:
![(a) Graph showing current (µA) versus time (seconds) for various dopamine concentrations from 0.0 to 0.08 mM. Current decreases sharply before stabilizing. (b) Scatter plot of current (µA) against dopamine concentration (mM), with a linear fit equation I (µA) = 6.134 [Dopamine] (mM) + 0.12579, and an R-squared value of 0.988, indicating high correlation.](https://www.frontiersin.org/files/Articles/1650004/fsens-06-1650004-HTML/image_m/fsens-06-1650004-g011.jpg)
Figure 11. (a) Chronoamperometry responses of SPCE/MoS2-Ag,4 sensor at different concentrations of DA (0.01–0.08 mM) in 0.1 M phosphate buffer solution and (b) the corresponding calibration curve.
The MoS2 in the composite has a widened interlayer distance, creating a favourable channel that reduces diffusion barriers and improves electron transfer. Additionally, the MoS2-Ag nanocomposite exhibits a significantly higher current response, demonstrating the synergistic enhancement of Ag on MoS2 (Raju et al., 2024). These results indicate the sensor’s capability to detect low dopamine concentrations with strong signal responsiveness. The low limit of detection suggests that the sensor is well-suited for applications requiring high sensitivity, while the notable sensitivity value reflects its efficiency in translating DA concentration changes into measurable electrochemical signals. This performance highlights the potential of the SPCE/MoS2-Ag,4 sensor for reliable and accurate DA detection in real-life applications. To assess the effectiveness of the proposed DA sensor, its performance was compared with previously reported MoS2-based DA sensors that utilized various electrode types. A detailed comparison, presented in Table 3, highlights key parameters such as sensitivity, detection limit, and linear detection range. The SPCE/MoS2-Ag,4 sensor showed similar sensitivity and a low detection limit compared to other reported sensors without needing binder materials to boost its electrocatalytic activity. This binder-free design makes fabrication easier while preserving high performance. Its sensing ability matches that of existing sensors, highlighting its potential for dopamine detection.
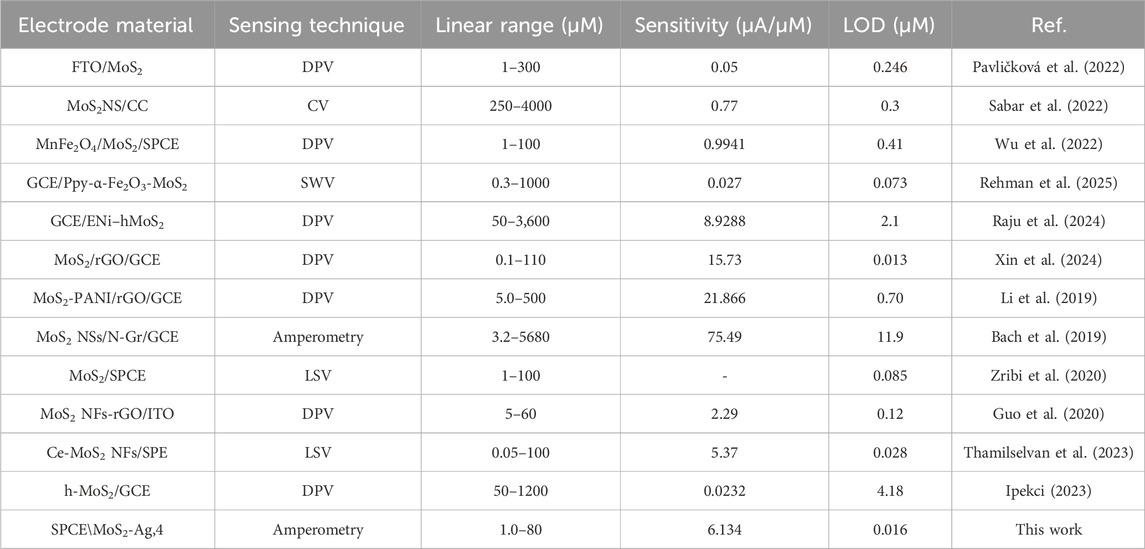
Table 3. Comparative analytical results of various electrochemical sensors performances against dopamine.
3.9 Interference studies of SPCE/MoS2-Ag,4 sensor
Studies have shown that overlapping electrical signals from AA and UA in the human body can interfere with the accurate detection of low DA concentrations. Therefore, enhancing the electrochemical sensor’s anti-interference capability in the presence of AA and UA is crucial for improving its practical applicability. The selectivity of the SPCE/MoS2-Ag,4 sensor for DA detection in the presence of common interfering species at their typical physiological concentrations was evaluated using the chronoamperometric method, as shown in Figure 12a. The study analyzed DA alongside biomolecules such as glucose, AA, UA, serotonin, and metal ions like NaCl and KCl, each at a concentration of 100 μM. The results confirmed the sensor’s ability to selectively detect dopamine, as no significant current response was observed for other biomolecules or metal ions at the working potential of 0.4 V. The presence of glucose, AA, UA, serotonin, NaCl, and KCl did not interfere with the detection of 100 μM DA, as these species produced negligible effects on the sensor’s response. As shown in Figure 12b, the current signals generated by these potential interferents were significantly lower than that of dopamine, demostrating the excellent selectivity and strong anti-interference capability of the SPCE/MoS2–Ag4 sensor. Among the tested species, only serotonin exhibited a measurable current response, approximately one-third of the dopamine signal. Although this reflects a degree of signal overlap, the response remains comparatively small, indicating only minor interference when compared to the dominant DA response. Overall, the sensor demonstrates high specificity, ensuring reliable dopamine detection even in complex biological environments, thereby confirming its strong potential for practical applications.
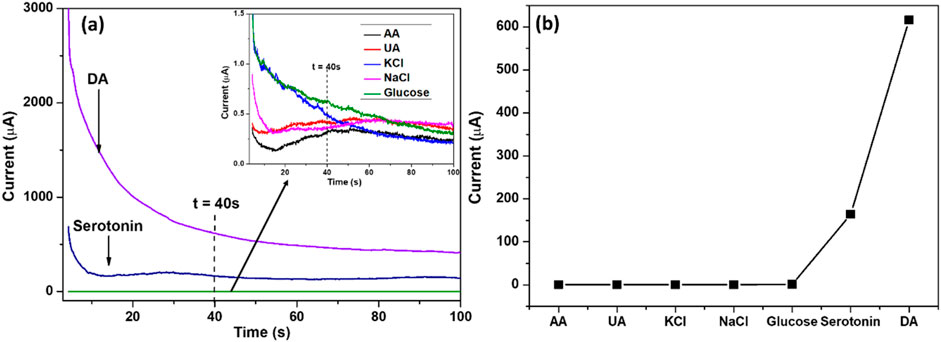
Figure 12. (a) Chronoamperometric responses of SPCE/MoS2-Ag,4 in 100 μM glucose and 100 μM of the interference species; AA, UA, glucose, serotonin, KCl, and NaCl. (b) A graph representing the current responses of DA and interfering species.
4 Conclusion
In this study, a novel electrochemical sensor was developed for DA detection using a MoS2-Ag nanocomposite conductive ink. The formulated MoS2-Ag ink exhibited enhanced electrochemical properties, making it a highly effective sensing material. The sensor demonstrated excellent catalytic performance, achieving a low detection limit of 0.016 μM and a broad dynamic linear range from 0.01 to 0.08 mM for DA detection. Additionally, it exhibited high selectivity, effectively minimizing interference from other biomolecules and metal ions. The SPCE/MoS2-Ag,4 sensor also displayed remarkable reproducibility and strong electrocatalytic activity, primarily due to its superior conductivity, efficient electrochemical response, and rapid direct electron transfer facilitated by the presence of Ag NPs. The unique layered structure of MoS2, characterized by a large surface area, provided additional active sites for electron transfer, further enhancing the sensor’s performance. When combined with Ag, a synergistic effect was observed, improving charge mobility and optimizing the electrode’s overall electrochemical behaviour. These combined properties highlight the potential of the SPCE/MoS2-Ag,4 sensor as a reliable and efficient platform for DA detection in real-life applications.
Data availability statement
The original contributions presented in the study are included in the article/supplementary material, further inquiries can be directed to the corresponding author.
Author contributions
NM: Methodology, Data curation, Writing – original draft, Writing – review and editing, Conceptualization, Investigation. LMS: Resources, Formal Analysis, Investigation, Writing – review and editing, Conceptualization, Funding acquisition, Supervision. SR: Supervision, Writing – review and editing, Conceptualization, Investigation, Funding acquisition, Resources, Formal Analysis. BN: Resources, Funding acquisition, Formal Analysis, Investigation, Supervision, Writing – review and editing, Conceptualization.
Funding
The author(s) declare that financial support was received for the research and/or publication of this article. The authors acknowledge the financial and resource support from DSTI/Mintek Nanotechnology Innovation Centre, grant number: ADE42604.
Conflict of interest
The authors declare that the research was conducted in the absence of any commercial or financial relationships that could be construed as a potential conflict of interest.
Generative AI statement
The author(s) declare that no Generative AI was used in the creation of this manuscript.
Any alternative text (alt text) provided alongside figures in this article has been generated by Frontiers with the support of artificial intelligence and reasonable efforts have been made to ensure accuracy, including review by the authors wherever possible. If you identify any issues, please contact us.
Publisher’s note
All claims expressed in this article are solely those of the authors and do not necessarily represent those of their affiliated organizations, or those of the publisher, the editors and the reviewers. Any product that may be evaluated in this article, or claim that may be made by its manufacturer, is not guaranteed or endorsed by the publisher.
References
Abkhalimov, E., Ershov, V., and Ershov, B. (2022). Determination of the concentration of silver atoms in hydrosol nanoparticles. Nanomaterials 12, 3091. doi:10.3390/nano12183091
Adesanya, F. A., and Fayemi, O. E. (2024). Electro-oxidation of pyrene on glassy carbon electrode modified with fMWCNTs/CuO nanocomposite. Mater. Res. Express. 11, 025004. doi:10.1088/2053-1591/ad176d
Ali, M. H., Azad, M. A. K., Khan, K. A., Rahman, M. O., Chakma, U., and Kumer, A. (2023). Analysis of crystallographic structures and properties of silver nanoparticles synthesized using PKL extract and nanoscale characterization techniques. ACS Omega 8, 28133–28142. doi:10.1021/acsomega.3c01261
Anju, T. R., Parvathy, S., Valiya Veettil, M., Rosemary, J., Ansalna, T. H., Shahzabanu, M. M., et al. (2021). Green synthesis of silver nanoparticles from Aloe vera leaf extract and its antimicrobial activity. Mater. Today Proc. 43, 3956–3960. doi:10.1016/j.matpr.2021.02.665
Ansari, M. A., Asiri, S. M., Alzohairy, M. A., Alomary, M. N., Almatroudi, A., and Khan, F. A. (2021). Biofabricated fatty acids-capped silver nanoparticles as potential antibacterial, antifungal, antibiofilm and anticancer agents. Pharmaceuticals 14, 139. doi:10.3390/ph14020139
Anshori, I., Nuraviana Rizalputri, L., Rona Althof, R., Sean Surjadi, S., Harimurti, S., Gumilar, G., et al. (2021). Functionalized multi-walled carbon nanotube/silver nanoparticle (f-MWCNT/AgNP) nanocomposites as non-enzymatic electrochemical biosensors for dopamine detection. Nanocomposites 7, 97–108. doi:10.1080/20550324.2021.1948242
Anuar, N. S., Basirun, W. J., Shalauddin, M., and Akhter, S. (2020). A dopamine electrochemical sensor based on a platinum–silver graphene nanocomposite modified electrode. RSC Adv. 10, 17336–17344. doi:10.1039/C9RA11056A
Bach, L. G., Nguyen, D. M., Bui, Q. B., Ai-Le, P. H., and Nhac-Vu, H.-T. (2019). Hierarchical molybdenum dichalcogenide nanosheets assembled nitrogen doped graphene layers for sensitive electrochemical dopamine detection. Mater. Chem. Phys. 236, 121814. doi:10.1016/j.matchemphys.2019.121814
Balkourani, G., Brouzgou, A., and Tsiakaras, P. (2023). A review on recent advancements in electrochemical detection of dopamine using carbonaceous nanomaterials. Carbon N. Y. 213, 118281. doi:10.1016/j.carbon.2023.118281
Bashir, N., Akhtar, M., Nawaz, H. Z. R., Warsi, M. F., Shakir, I., Agboola, P. O., et al. (2020). A high performance electrochemical sensor for Pb2+ ions based on carbon Nanotubes functionalized CoMn2O4 nanocomposite. ChemistrySelect. 5, 7909–7918. doi:10.1002/slct.202001393
Belaid, S., Zribi, R., Chelly, M., Saadaoui, E., Fazio, E., and Neri, G. (2025). Silver nanoparticles synthesized using Eucalyptus salmonophloia essential oil as potential electrode material for the electrochemical sensing of dopamine. Microchem. J. 208, 112493. doi:10.1016/j.microc.2024.112493
Bonacin, J. A., Dos Santos, P. L., Katic, V., Foster, C. W., and Banks, C. E. (2018). Use of screen-printed electrodes modified by Prussian blue and Analogues in sensing of Cysteine. Electroanalysis 30, 170–179. doi:10.1002/elan.201700628
Chaudhary, N., Khanuja, M., and Islam, S. S. (2018). Hydrothermal synthesis of MoS2 nanosheets for multiple wavelength optical sensing applications. Sensors Actuators A Phys. 277, 190–198. doi:10.1016/j.sna.2018.05.008
Deffo, G., Basumatary, M., Hussain, N., Hazarika, R., Kalita, S., Njanja, E., et al. (2022). Eggshell nano-CaCO3 decorated PANi/rGO composite for sensitive determination of ascorbic acid, dopamine, and uric acid in human blood serum and urine. Mater. Today Commun. 33, 104357. doi:10.1016/j.mtcomm.2022.104357
Devi, R., Gogoi, S., Barua, S., Sankar Dutta, H., Bordoloi, M., and Khan, R. (2019). Electrochemical detection of monosodium glutamate in foodstuffs based on Au@MoS2/chitosan modified glassy carbon electrode. Food Chem. 276, 350–357. doi:10.1016/j.foodchem.2018.10.024
Dikansky, Y. I., Semenova, S. A., and Drozdov, A. S. (2023). The influence of electric and Magnetic Fields on the structure of Flat Drops of Magnetic fluids upon drying. Coatings 13, 540. doi:10.3390/coatings13030540
Eda, G., Yamaguchi, H., Voiry, D., Fujita, T., Chen, M., and Chhowalla, M. (2011). Photoluminescence from chemically exfoliated MoS2. Nano Lett. 11, 5111–5116. doi:10.1021/nl201874w
Erk, N., Bouali, W., Genc, A. A., Salamat, Q., and Soylak, M. (2024). An ultrasensitive electrochemical sensor using Banana Peel Activated carbon/NiFe2O4/MnCoFe-LDH nanocomposites for Anticancer drug determination. ACS Omega 9, 27446–27457. doi:10.1021/acsomega.4c02460
Ershov, V., Tarasova, N., and Ershov, B. (2021). Evolution of electronic state and properties of silver nanoparticles during their formation in aqueous solution. Int. J. Mol. Sci. 22, 10673. doi:10.3390/ijms221910673
Feng, X., Tang, Q., Zhou, J., Fang, J., Ding, P., Sun, L., et al. (2013). Novel mixed–solvothermal synthesis of MoS2 nanosheets with controllable morphologies. Cryst. Res. Technol. 48, 363–368. doi:10.1002/crat.201300003
Ghayeb Zamharir, S., Karimzadeh, R., and Aboutalebi, S. H. (2018). Laser-assisted tunable optical nonlinearity in liquid-phase exfoliated MoS2 dispersion. Appl. Phys. A 124, 692. doi:10.1007/s00339-018-2115-2
Ghosh, S., Yang, C.-J., and Lai, J.-Y. (2024). Optically active two-dimensional MoS2-based nanohybrids for various biosensing applications: a comprehensive review. Biosens. Bioelectron. 246, 115861. doi:10.1016/j.bios.2023.115861
Guo, X., Yue, H., Song, S., Huang, S., Gao, X., Chen, H., et al. (2020). Simultaneous electrochemical determination of dopamine and uric acid based on MoS2nanoflowers-graphene/ITO electrode. Microchem. J. 154, 104527. doi:10.1016/j.microc.2019.104527
Han, S., Ding, Y., Teng, F., Yao, A., and Leng, Q. (2022). Molecularly imprinted electrochemical sensor based on 3D-flower-like MoS2 decorated with silver nanoparticles for highly selective detection of butylated hydroxyanisole. Food Chem. 387, 132899. doi:10.1016/j.foodchem.2022.132899
Hensel, R. C., Moreira, M., Riul, A., Oliveira, O. N., Rodrigues, V., and Hillenkamp, M. (2020). Monitoring the dispersion and agglomeration of silver nanoparticles in polymer thin films using localized surface plasmons and Ferrell plasmons. Appl. Phys. Lett. 116, 103105. doi:10.1063/1.5140247
Ipekci, H. H. (2023). Holey MoS2-based electrochemical sensors for simultaneous dopamine and uric acid detection. Anal. Methods. 15, 2989–2996. doi:10.1039/D3AY00573A
Kalambate, P. K., Thirabowonkitphithan, P., Kaewarsa, P., Permpoka, K., Radwan, A. B., Shakoor, R. A., et al. (2022). Progress, challenges, and opportunities of two-dimensional layered materials based electrochemical sensors and biosensors. Mater. Today Chem. 26, 101235. doi:10.1016/j.mtchem.2022.101235
Lang, J., Wang, W., Zhou, Y., Guo, D., Shi, R., and Zhou, N. (2022). Electrochemical behavior and direct quantitative determination of Paclitaxel. Front. Chem. 10, 834154. doi:10.3389/fchem.2022.834154
Li, M., Wang, D., Li, J., Pan, Z., Ma, H., Jiang, Y., et al. (2016). Facile hydrothermal synthesis of MoS2 nano-sheets with controllable structures and enhanced catalytic performance for anthracene hydrogenation. RSC Adv. 6, 71534–71542. doi:10.1039/C6RA16084K
Li, S., Ma, Y., Liu, Y., Xin, G., Wang, M., Zhang, Z., et al. (2019). Electrochemical sensor based on a three dimensional nanostructured MoS2 nanosphere-PANI/reduced graphene oxide composite for simultaneous detection of ascorbic acid, dopamine, and uric acid. RSC Adv. 9, 2997–3003. doi:10.1039/C8RA09511F
Li, J., Xie, G., Dai, L., Yang, M., and Su, Y. (2025). Rapid and highly selective dopamine sensing with CuInSe2-modified nanocomposite. J. Compos. Sci. 9, 123. doi:10.3390/jcs9030123
Maheshwaran, S., Balaji, R., Chen, S.-M., Chang, Y.-S., Tamilalagan, E., Chandrasekar, N., et al. (2022). Ultrasensitive electrochemical detection of furazolidone in biological samples using 1D-2D BiVO4@MoS2 hierarchical nano-heterojunction composites armed electrodes. Environ. Res. 205, 112515. doi:10.1016/j.envres.2021.112515
Mak, K. F., Lee, C., Hone, J., Shan, J., and Heinz, T. F. (2010). Atomically thin ${\mathrm{MoS}}_{2}$: a new direct-gap semiconductor. Phys. Rev. Lett. 105, 136805. doi:10.1103/PhysRevLett.105.136805
Masood, Z., Muhammad, H., and Tahiri, I. A. (2024). Comparison of different electrochemical methodologies for electrode reactions: a Case study of Paracetamol. Electrochem 5, 57–69. doi:10.3390/electrochem5010004
Massey, A. T., Gusain, R., Kumari, S., and Khatri, O. P. (2016). Hierarchical Microspheres of MoS2 nanosheets: efficient and Regenerative adsorbent for removal of water-soluble dyes. Ind. Eng. Chem. Res. 55, 7124–7131. doi:10.1021/acs.iecr.6b01115
Mazzara, F., Patella, B., Aiello, G., O’Riordan, A., Torino, C., Vilasi, A., et al. (2021). Electrochemical detection of uric acid and ascorbic acid using r-GO/NPs based sensors. Electrochim. Acta. 388, 138652. doi:10.1016/j.electacta.2021.138652
Miao, H., Hu, X., Sun, Q., Hao, Y., Wu, H., Zhang, D., et al. (2016). Hydrothermal synthesis of MoS2 nanosheets films: microstructure and formation mechanism research. Mater. Lett. 166, 121–124. doi:10.1016/j.matlet.2015.12.010
Mistry, H., Thakor, R., Patil, C., Trivedi, J., and Bariya, H. (2021). Biogenically proficient synthesis and characterization of silver nanoparticles employing marine procured fungi Aspergillus brunneoviolaceus along with their antibacterial and antioxidative potency. Biotechnol. Lett. 43, 307–316. doi:10.1007/s10529-020-03008-7
Mondal, K. G., Jana, P. C., and Saha, S. (2023). Optical and structural properties of 2D transition metal dichalcogenides semiconductor MoS2. Bull. Mater. Sci. 46, 15. doi:10.1007/s12034-022-02852-9
Moradpour, H., and Beitollahi, H. (2022). Simultaneous electrochemical sensing of dopamine, ascorbic acid, and uric acid using nitrogen-doped graphene sheet-modified glassy carbon electrode. C 8, 50. doi:10.3390/c8040050
Mphuthi, N., Sikhwivhilu, L., and Ray, S. S. (2022). Functionalization of 2D MoS2 nanosheets with various metal and metal oxide nanostructures: their properties and application in electrochemical sensors. Biosensors 12, 386. doi:10.3390/bios12060386
Mukherjee, S., Maiti, R., Midya, A., Das, S., and Ray, S. K. (2015). Tunable direct bandgap optical transitions in MoS2 nanocrystals for Photonic Devices. ACS Photonics 2, 760–768. doi:10.1021/acsphotonics.5b00111
Naveed, M., Bukhari, B., Aziz, T., Zaib, S., Mansoor, M. A., Khan, A. A., et al. (2022). Green synthesis of silver nanoparticles using the plant extract of acer oblongifolium and study of its antibacterial and Antiproliferative activity via Mathematical approaches. Molecules 27, 4226. doi:10.3390/molecules27134226
Paimard, G., Ghasali, E., and Baeza, M. (2023). Screen-printed electrodes: fabrication, modification, and biosensing applications. Chemosensors 11, 113. doi:10.3390/chemosensors11020113
Pasieczna-Patkowska, S., Cichy, M., and Flieger, J. (2025). Application of Fourier transform infrared (FTIR) spectroscopy in characterization of green synthesized nanoparticles. Molecules 30, 684. doi:10.3390/molecules30030684
Patella, B., Sortino, A., Mazzara, F., Aiello, G., Drago, G., Torino, C., et al. (2021). Electrochemical detection of dopamine with negligible interference from ascorbic and uric acid by means of reduced graphene oxide and metals-NPs based electrodes. Anal. Chim. Acta. 1187, 339124. doi:10.1016/j.aca.2021.339124
Patil, R. B., and Chougale, A. D. (2021). Analytical methods for the identification and characterization of silver nanoparticles: a brief review. Mater. Today Proc. 47, 5520–5532. doi:10.1016/j.matpr.2021.03.384
Pavličková, M., Lorencová, L., Hatala, M., Kováč, M., Tkáč, J., and Gemeiner, P. (2022). Facile fabrication of screen-printed MoS2 electrodes for electrochemical sensing of dopamine. Sci. Rep. 12, 11900. doi:10.1038/s41598-022-16187-2
Prabakaran, L., V Sathyaraj, W., V Yesudhason, B., Subbaraj, G. K., and Atchudan, R. (2023). Green synthesis of Multifunctional silver nanoparticles using Plectranthus amboinicus for sensitive detection of triethylamine, with potential in vitro antibacterial and Anticancer Activities. Chemosensors 11, 373. doi:10.3390/chemosensors11070373
Raju, C. V., Ramya, R., Imran, K., Basha, C. K., Wilson, J., Boobalan, T., et al. (2024). Simultaneous electrochemical detection of dopamine and uric acid based on tri-composite of poly-pyrrole and α-Fe2O3 embedded MoS2 sheets modified electrode. Microchem. J. 198, 110189. doi:10.1016/j.microc.2024.110189
Rana, D. S., Sharma, R., Gupta, N., Sharma, V., Thakur, S., and Singh, D. (2023). Development of metal free carbon catalyst derived from Parthenium hysterophorus for the electrochemical detection of dopamine. Environ. Res. 231, 116151. doi:10.1016/j.envres.2023.116151
Rehman, A. U., Anwar, M., Khan, A., Kalhoro, K. A., Zhang, C., Zhang, Y., et al. (2025). Perforated MoS2 nanosheets adorned with Ni nanoparticles: an electrochemical sensor for concurrent detection of dopamine and uric acid. Microchem. J. 209, 112821. doi:10.1016/j.microc.2025.112821
Sabar, M., Amara, U., Riaz, S., Hayat, A., Nasir, M., and Nawaz, M. H. (2022). Fabrication of MoS2 enwrapped carbon cloth as electrochemical probe for non-enzymatic detection of dopamine. Mater. Lett. 308, 131233. doi:10.1016/j.matlet.2021.131233
Sajid, M., Nazal, M. K., Mansha, M., Alsharaa, A., Jillani, S. M. S., and Basheer, C. (2016). Chemically modified electrodes for electrochemical detection of dopamine in the presence of uric acid and ascorbic acid: a review. Trac. Trends Anal. Chem. 76, 15–29. doi:10.1016/j.trac.2015.09.006
Sajid, M., Baig, N., and Alhooshani, K. (2019). Chemically modified electrodes for electrochemical detection of dopamine: challenges and opportunities. Trac. Trends Anal. Chem. 118, 368–385. doi:10.1016/j.trac.2019.05.042
Sharma, N. K., Vishwakarma, J., Rai, S., Alomar, T. S., AlMasoud, N., and Bhattarai, A. (2022). Green Route synthesis and characterization techniques of silver nanoparticles and their biological adeptness. ACS Omega 7, 27004–27020. doi:10.1021/acsomega.2c01400
Sharma, P., Thakur, D., and Kumar, D. (2023). Novel enzymatic biosensor utilizing a MoS2/MoO3 nanohybrid for the electrochemical detection of xanthine in fish Meat. ACS Omega 8, 31962–31971. doi:10.1021/acsomega.3c03776
Solomon, G., Mazzaro, R., Morandi, V., Concina, I., and Vomiero, A. (2020). Microwave-Assisted vs. Conventional hydrothermal synthesis of MoS2 nanosheets: application towards hydrogen evolution reaction. Crystals 10, 1040. doi:10.3390/cryst10111040
Sundaram, R. S., Engel, M., Lombardo, A., Krupke, R., Ferrari, A. C., Avouris, P., et al. (2013). Electroluminescence in single layer MoS2. Nano Lett. 13, 1416–1421. doi:10.1021/nl400516a
Tchekep, A. G. K., Suryanarayanan, V., and K Pattanayak, D. (2023). Alternative approach for highly sensitive and free-interference electrochemical dopamine sensing. Carbon N. Y. 204, 57–69. doi:10.1016/j.carbon.2022.12.043
Tetyana, P., Mphuthi, N., Jijana, A. N., Moloto, N., Shumbula, P. M., Skepu, A., et al. (2023). Synthesis, characterization, and electrochemical evaluation of Copper Sulfide nanoparticles and their application for non-enzymatic glucose detection in blood samples. Nanomaterials 13, 481. doi:10.3390/nano13030481
Thamilselvan, A., V Dang, T., and Kim, M. I. (2023). Highly conductive Peroxidase-like Ce-MoS2 nanoflowers for the simultaneous electrochemical detection of dopamine and Epinephrine. Biosensors 13, 1015. doi:10.3390/bios13121015
Vikraman, D., Akbar, K., Hussain, S., Yoo, G., Jang, J.-Y., Chun, S.-H., et al. (2017). Direct synthesis of thickness-tunable MoS2 quantum dot thin layers: optical, structural and electrical properties and their application to hydrogen evolution. Nano Energy 35, 101–114. doi:10.1016/j.nanoen.2017.03.031
Wang, Y., Lia, X., and Glasses, C. W. (2017). Synthesis and characterization of MoS2 nanocomposites by a high pressure hydrothermal method. J. Non-Oxide Glas. 9, 47–54. Available online at: https://www.chalcogen.ro/47_WangY.pdf.
Wang, K., Wang, J., Fan, J., Lotya, M., O’Neill, A., Fox, D., et al. (2013). Ultrafast Saturable absorption of two-dimensional MoS2 nanosheets. ACS Nano 7, 9260–9267. doi:10.1021/nn403886t
Wu, J.-T., and Hsu, S.L.-C. (2011). Preparation of triethylamine stabilized silver nanoparticles for low-temperature sintering. J. Nanoparticle Res. 13, 3877–3883. doi:10.1007/s11051-011-0341-z
Wu, P., Huang, Y., Zhao, X., Lin, D., Xie, L., Li, Z., et al. (2022). MnFe2O4/MoS2 nanocomposite as Oxidase-like for electrochemical simultaneous detection of ascorbic acid, dopamine and uric acid. Microchem. J. 181, 107780. doi:10.1016/j.microc.2022.107780
Xin, Y.-Y., Liu, L.-H., Liu, Y., Deng, Z.-P., Cheng, X.-L., Zhang, X.-F., et al. (2024). Nanoflower MoS2/rGO composite rich in edge defects for enhanced electrochemical sensing of nM-level dopamine. Microchem. J. 197, 109878. doi:10.1016/j.microc.2023.109878
Zhang, X., Tang, H., Xue, M., and Li, C. (2014). Facile synthesis and characterization of ultrathin MoS2 nanosheets. Mater. Lett. 130, 83–86. doi:10.1016/j.matlet.2014.05.078
Zhang, F.-J., Li, X., Sun, X.-Y., Kong, C., Xie, W.-J., Li, Z., et al. (2019). Surface partially oxidized MoS2 nanosheets as a higher efficient cocatalyst for photocatalytic hydrogen production. Appl. Surf. Sci. 487, 734–742. doi:10.1016/j.apsusc.2019.04.258
Zhang, Y., Li, N., Liu, B., and Zhang, H. (2024). Hydrogen Peroxide and dopamine sensors based on electrodeposition of reduced graphene oxide/silver nanoparticles. Sensors 24, 355. doi:10.3390/s24020355
Zhou, K., Gao, R., Gui, Z., and Hu, Y. (2017). The effective reinforcements of functionalized MoS2 nanosheets in polymer hybrid composites by sol-gel technique. Compos. Part A Appl. Sci. Manuf. 94, 1–9. doi:10.1016/j.compositesa.2016.12.010
Zribi, R., Maalej, R., Gillibert, R., Donato, M. G., Gucciardi, P. G., Leonardi, S. G., et al. (2020). Simultaneous and selective determination of dopamine and tyrosine in the presence of uric acid with 2D-MoS2 nanosheets modified screen-printed carbon electrodes. FlatChem 24, 100187. doi:10.1016/j.flatc.2020.100187
Keywords: molybdenum disulfide, silver nanoparticles, dopamine, conductive ink, electrochemical sensor
Citation: Mphuthi N, Sikwhivhilu LM, Ray SS and Ntsendwana B (2025) Electrooxidation of dopamine using MoS2-Ag conductive ink on screen-printed electrodes for electrochemical sensing. Front. Sens. 6:1650004. doi: 10.3389/fsens.2025.1650004
Received: 19 June 2025; Accepted: 06 October 2025;
Published: 21 October 2025.
Edited by:
Omid Kavehei, The University of Sydney, AustraliaReviewed by:
Yuanjie Su, University of Electronic Science and Technology of China, ChinaDinakaran Thirumalai, Dublin City University, DCU, Ireland
Copyright © 2025 Mphuthi, Sikwhivhilu, Ray and Ntsendwana. This is an open-access article distributed under the terms of the Creative Commons Attribution License (CC BY). The use, distribution or reproduction in other forums is permitted, provided the original author(s) and the copyright owner(s) are credited and that the original publication in this journal is cited, in accordance with accepted academic practice. No use, distribution or reproduction is permitted which does not comply with these terms.
*Correspondence: Ntsoaki Mphuthi, TnRzb2FraW1AbWludGVrLmNvLnph, YnVsZWx3YW5AbWludGVrLmNvLnph