 Amana Jemal Kedir
 Judith Nyiraneza
 Kelly Anne Hawboldt
 David Bruce McKenzie
 Adrian Unc
- 1School of Science and the Environment, Memorial University of Newfoundland, Corner Brook, NL, Canada
- 2Environmental Science Program, Memorial University of Newfoundland, St. John’s, NL, Canada
- 3Charlottetown Research and Development Centre, Agriculture and Agri-Food Canada, Charlottetown, PE, Canada
- 4Faculty of Engineering and Applied Science, Memorial University, St. John’s, NL, Canada
- 5St. John’s Research and Development Centre, Agriculture and Agri-Food Canada, St. John’s, NL, Canada
- 6Department of Natural Resource Sciences, McGill University, Montreal, QC, Canada
Repetitive long-term fertilizer application leads to phosphorus (P) accumulation in agricultural soils. This can pose environmental risks if the soil’s phosphorus storage capacity is not well understood and considered when planning nutrient management. We investigated the P sorption capacity (PSC) in the surface (0-20 cm, n = 23) and subsurface (20-40 cm, n = 23) of long-term managed podzolic soils in Newfoundland (Nfld), Canada, through batch adsorption using two P concentrations of 150 and 500 mg P L-1, and developed pedotransfer functions to estimate PSC using selected soil properties. Also, the correlation between actual PSC, soil properties, and estimated Phosphorus saturation index (PSI) and soil P sorption capacity (SPSC) both from standard soil test were evaluated. The surface and subsurface soils provided similar median PSC (1.34 and 1.32 mg g-1, respectively, p = 0.16) when examined with the 150 mg P L-1 solution. With 500 mg P L-1 solution, the subsurface soils had significantly higher median PSC than the surface soils of the same fields (2.74 and 2.27 mg g-1, respectively, p = 0.02); and had a better linear relationship (R2 >0.40, p <0.05) with SPSC than at the lower P concentration. The surface soils had significantly higher extractable median P in water, citric acid, and Mehlich-3, higher soil organic matter (SOM), moisture content, Mehlich-3-Fe, -Ca, and -K, PSI, electrical conductivity, silt, and clay contents, while Mehlich-3-Al, Mehlich-3-Al : Fe ratio, SPSC, and sand were lower than those in the subsurface soils. All soils had comparable pH (~6.3). Pedotransfer function revealed that the PSC could be predicted using SOM, Mehlich-3-Al, and Mehlich-3-PICP and thus may be employed for developing testable hypotheses relevant to environmentally and economically viable P management strategies for acidic soils in boreal regions.
Introduction
Phosphorus (P), a critical element for metabolic regulation of all living cells, is a non-renewable and depleted resource (1). Following World War II, and with increased access to fossil fuel (2, 3), P has been heavily mined with ~82% used as fertilizer. This increased the soils’ legacy P (4).
During the Green Revolution (5), excessive application of fertilizer led to P accumulation (i.e., legacy P) in agricultural and pasture soils (6). Since then, and with continued P fertilizer applications, soil P build-up has become a major agronomic and environmental concern (7–9). For example, excessive and repetitive manure application to Dutch fields in the 1980s led to an average legacy P of 2,050 kg P ha-1 (10, 11). Also, in Germany, an average of 1,100 kg P ha-1 was reported in 2010 (12). In Newfoundland (Nfld), Canada, lands converted from boreal forests to agricultural use in the early and mid-20th century were continually manured to maintain fertility. In podzolic soils the large application of manure, calculated to satisfy crop requirements for N, might result in P accumulation (13). There is a lack of information on the long-term managed podzolic soil’s P sorption capacity and its relationships with soil properties in Nfld, a region undergoing agricultural expansion through land-use conversion on podzolic soils. The region is similar to other locations in the circumboreal that might undergo similar transformations (14).
The P accumulated in agricultural soils is either strongly fixed by clay minerals and sesquioxides of Al, Fe and Ca and organometallic chelate (6, 15) or loosely adsorbed on the soil surface. The weakly attached P (labile P) can be easily desorbed to maintain the P equilibrium in the soil-solution (16). Based on the soil properties, and mainly to the soil pH, the non-labile P could be transformed to labile and then to available P and vice-versa (17). The legacy P can be brought into the available pool to reduce the need for further P inputs by adjusting the soil pH.
The accumulation of P in soils is thus related to soil buffering capacity in the context of the management history (6, 15, 18). In Denmark, century-old managed arable soils, including Podzols, have higher annual P accumulations (up to 25 kg P ha-1) in surface soils (0-25 cm) and a higher total P mobility to depths of up to 75 cm than adjacent deciduous forest soils (19, 20). Long term (30 years) intensely fertilized Oxisols in Mato Grosso, Brazil, release 14 kg of legacy P ha-1 annually. However, 75% of the legacy P may be inaccessible to plants despite the decline of P sorption by the soils; this might be related to the presence of high content of reactive Al and Fe oxides (6). For example, the Ap horizons (plough layer) of long-term managed Podzols in eastern Nfld have a high P sorption capacity, strongly correlated with the soil’s high Al content (21). It is thus necessary to understand P dynamics in long-term managed agricultural podzolic soils to ensure efficient utilization of P resources and provide environmental stewardship while satisfying crop requirements (6).
For agronomic or environmental management of P, several soil P extraction protocols (P-tests), adsorption tests, and indices were developed to assess the status of P in soils under different management regimes. Among these, soil P storage capacity (SPSC) is used as a proximate parameter for assessing and predicting the P storage and release capacities of soils over short- or long-term after receiving P fertilizers (10). P-tests such as Mehlich-1, Mehlich-3, or others, initially developed for agronomic purposes, have recently been also employed for environmental risk assessments (22–25). Phosphorus saturation index (PSI) is calculated from the molar ratio of P to Al or Al plus Fe which can be used as an alternative tool to monitor P status relevant to environmental protection (26–28). The soil’s P sorption capacity has thus been well studied to determine soil fertility and assess environmental risks for various soils (29–32). However, site-specific P sorption studies are required to account for regional specificity of soil and environmental variations (33). Phosphorus sorption in long-term managed podzolic soils, particularly the variability in sorption by the depth, has not yet been thoroughly investigated for Nfld podzolic soils, representative of circumboreal podzolic soils.
We aimed to (1) determine and calculate the residual P sorption capacity (PSC) of long-term managed surface (0-20 cm) and subsurface (20-40 cm) podzolic soils using point adsorption technique, i.e., 150 and 500 mg P L-1, and (2) assess the relationships between point P sorption capacities and soil properties and P indices. This information is critical for the development of sustainable P management plans and a data-informed decision support system for the planned agricultural expansion in eastern Canada and elsewhere in the boreal regions with similar soil types and management.
Materials and Methods
Site Description
Soils were sampled at the St. John’s Research and Development Centre, Agriculture and Agri-Food Canada, (47.56° N, 52.71° W). The site has an elevation ~114 m above sea level with an annual mean rainfall of 1534 mm and temperature of 5° C (34). The sampled fields have been farmed for ~150 to 160 years, mainly for perennial forage production followed, in the last 50 to 80 years, by field crop experiments (35–38). The site covers an area of ~28 hectares divided into 23 unequally partitioned fields, which had been under deep plough farming, mainly for perennial forage production for dairy farms in the Avalon Peninsula (35), since the 1860s. These fields received 227 kg ha-1 of 6-12-12 fertilizer and an unknown amount of manure, as often as 2 to 3 times per year, for the first 30 years. During the same period, the fields received three applications of limestone at the rate of 4 Mg ha-1 (39, 40). Since 1949, the fields have been used for field trials for forage, annual crops, and vegetables. Most fields were managed under timothy (Phleum pratense), red clover (Trifolium pratense) and alsike clover (Trifolium hybridum) mixtures in rotation with research crops and have received various rates of manure, amended with mineral fertilizer, and with intermittent lime applications. The forage fields yielded 1 to 2 cuts annually; silage production and earlier harvesting has allowed for 2 to 3 cuts per year in recent years. Another field, rocky and with poor drainage due to shallow hardpans, was allowed to naturally revert to forest in the 1970s to early 1980s and today is covered by black spruce (Picea mariana), mountain ash (Sorbus americana), and serviceberry (Amelanchier bartramiana) (David McKenzie, Personal Communication, 2018). The at the site is an Humo-Ferric Podzol developed on a glacial till materials (41).
Soil Sampling
Soil samples were collected from 23 managed fields in November 2017, with a stainless-steel sand auger. Proportional to the field size, 3 to 5 sampling locations per field were randomly selected. From each sampling location, triplicated cores were collected at 1-metre intervals from 0-20 cm (surface) and 20-40 cm (subsurface) depths. Thus, for each field a variable number of 9 to 15 same-size samples of about 300 g each were collected in clean bucket for each depth and composited to produce one sample per depth for each field (46 samples). Eventually an aliquot of about 1 L of fresh soil was transferred into 1.5 L polyethylene Ziploc bags and transported to the laboratory.
Sample Handling, Processing,and Analysis
The soils were air-dried for 3 to 5 d in a temperature-controlled room (~35°C with air movement) and then passed through a 2 mm sieve. Samples were analyzed for: soil organic matter (SOM) based on the loss-on-ignition method at 430°C heated for 6 h (42, 43); moisture content (MC) determined by drying field-fresh sample in the forced-air oven at 105°C for 24 hr (43); pH and electrical conductivity (EC) measured in 1:2 soil to water ratio (44); particle size distribution was determined using hydrometer method (45); selected samples were used for mineralogical analysis using a Rigaku Ultima-IV Powder X-Ray Diffractometer (XRD) (Rigaku Corporation, Tokyo, Japan) at 2Theta theta-1, 40kV and 44mA. The mineralogical analysis was conducted for selected samples to identify the dominant mineral phases in long term managed podzolic soils. The extractable (potentially available) P was determined in Mehlich-3 (46) 1% citric acid (CA) (47), and deionized water (48, 49) extracts (1:10 soil to solution ratio) using the ascorbic acid method as described by Murphy and Riley (50) and modified by Watanabe and Olsen (51). Mehlich-3 extractable total P and micro- and macro-nutrients were determined using a Prodigy High Dispersion ICP-OES (Teledyne Leeman Labs, Manson, USA).
Point Sorption Test
For all 46 samples, representing surface and subsurface soils, two-point P sorption capacity tests were performed in triplicate (52) using initial concentrations of 150 and 500 mg P L-1. These initial P concentrations were identified from the calibrated sorption isotherm experiment employed in our previous work (21). Briefly, a 2 ± 0.01 g sample of air-dried soil was added to a 125 mL Erlenmeyer flask and saturated with 20 mL of 0.01M KCl solution containing either 150 or 500 mg P L-1. The soil-solution mixture was agitated for 1 h on an end-to-end shaker followed by equilibration at room temperature (~20°C) for 22 h and eventually re-agitated for another 1 h (53). The soil-solution was filtered through 0.45 µm filter paper to collect the filtrate (30, 54–56). The equilibrium P in the filtrate was determined using the ascorbic acid method as described by Murphy and Riley (1962) (50) and modified by Watanabe and Olsen (51).
The point P sorption protocol used in this study is similar to that employed in other studies (30, 54–57) except that microbial inhibitors like toluene or chloroform were not used as they might increase dissolved P in solution through lysis of microbial cells (58). The amount of phosphate sorbed at equilibrium (qe) was calculated using Equation (1):
where: qe (mg g-1 of soil) is the amount of P adsorbed at equilibrium; Ci, Ce, and Co are the initial, equilibrium, and labile P concentrations (mg L-1), respectively; V is the volume of the solution in L and m is the oven-dry soil mass (g) (59).
Estimation of Soil P Sorption Capacity From Mehlich-3 Test
Additionally, we calculated PSI and SPSC indices (9, 26, 60–62) from Equation (2) and (3).
Critical PSI’s of 0.10 for agronomic (SPSC-1) and 0.14 for environmental (SPSC-2) purposes were adopted from the Canadian Maritime provinces (26, 60) and a NL soil fertility survey that was based on standard farmers’ soil tests (63). An SPSC value less than zero indicates that the soil serves as a source of P for the plant or environmental contamination (64). Both PSI and SPSC can inform the soil P status related to management history and properties of the specific soil types.
Statistical Analysis
Descriptive and explanatory statistics were carried out using PAST3 (65) and Origin (Pro) version 2019 (OriginLab Corporation, Northampton, MA, USA., 2019). The data distribution was tested using Shapiro-Wilk test before inferential analysis. The P sorption capacity and soil properties, for the surface and subsurface soils, were compared using the Kruskal Wallis test. Pearson correlation (r) was performed to identify the relationship between point P and calculated sorption capacities and soil properties. Additionally, stepwise multiple linear regressions were employed to assess the statistical relationship between point P sorption capacity and selected soil properties. The established relationship can be used to estimate the P sorption capacities of managed podzolic soils from routine soil tests. Tests are considered statistically significant at PH0 < 0.05.
Results and Discussion
Soil Characteristics
The surface soils had either silty loam or loamy texture, whereas the subsurface soils had mainly loamy texture. The median contents of clay, silt, and SOM in surface soils were significantly greater than for subsurface soils (p <0.001) while the reverse was observed for Al and sand content (Table 1). Surface soils had a median pH of 6.3, EC of 239 µS cm-1, and SOM of 12% (Table S1). Subsurface soils have a median pH of 6.3, EC of 148 µS cm-1, and SOM of 9% (Table S2). The soil texture and SOM of surface soils are comparable with reference samples collected from the B horizon of adjacent land covered with natural vegetation while the subsurface soils have higher clay and SOM, and lower sand content compared to non-managed BC horizon (21)Click or tap here to enter text.
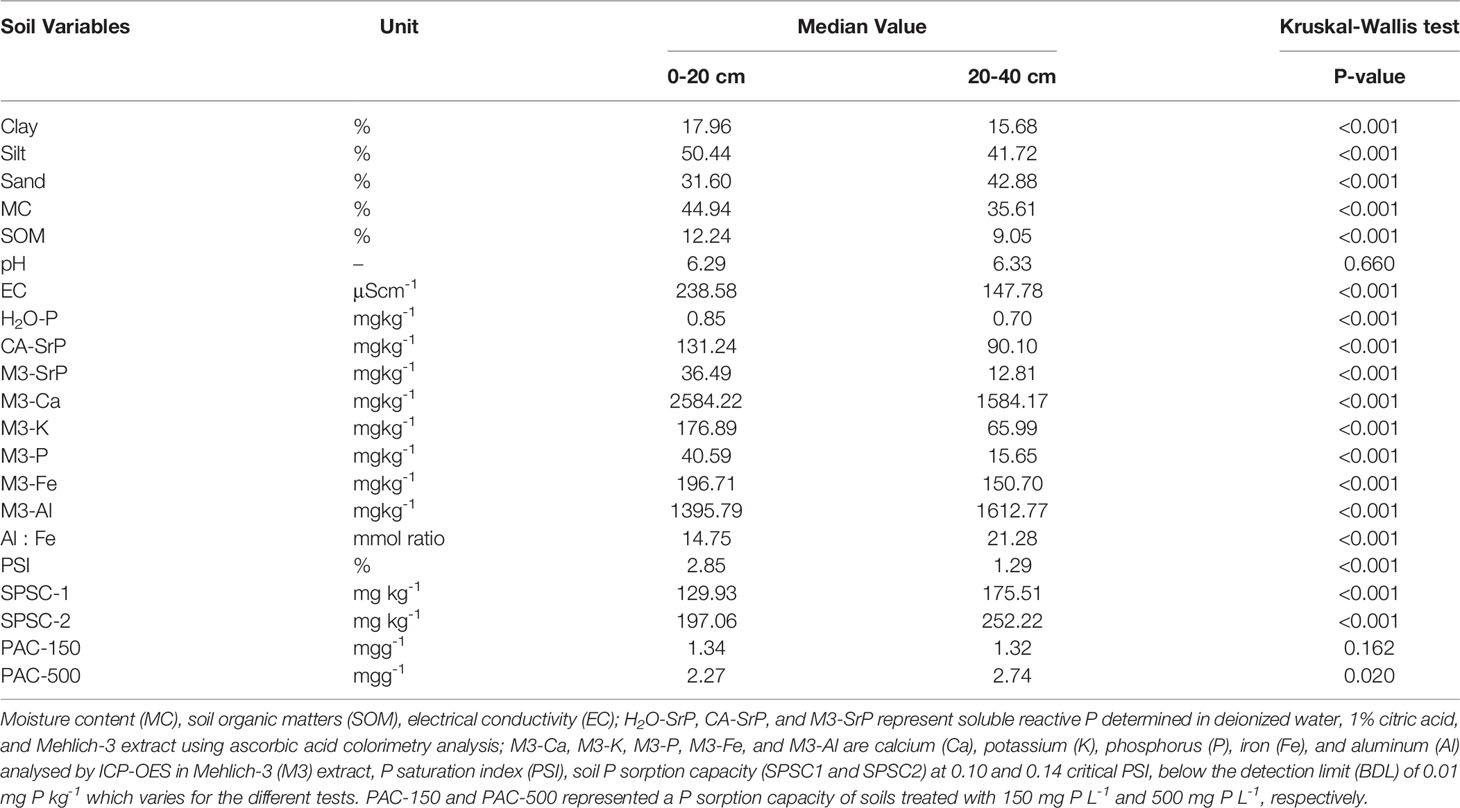
Table 1 Comparison of median values of soil’s P sorption capacities and soil characteristics between surface (0-20 cm, n = 23) and subsurface (20-40 cm, n = 23) of long term managed podzolic soils.
Nevertheless, the XRD mineralogical analysis showed similar mineral phases in both surface and subsurface soils except for Berlinite (AlPO4), which was only detected in the surface soils (Table S3). Differences in soil characteristics between the surface and subsurface could be attributed to the management history as most of the soil-plant interactions and tillage and manure input happened in the top 15-20 cm of the soil. Additionally, the surface soils may have an accelerated biomass turnover resulting in higher SOM in addition to long-term manure application which also increases moisture retention and EC. The surface soils, with higher SOM, had significantly higher EC than subsurface soils (Table 1). The SOM is the source of carboxyl and phenolic acids, the largest contributors to cations exchange capacity in the soil (66, 67). Remarkably, the median pH of the surface and subsurface soils was not significantly different. The minor pH increases in the subsurface could be due to cumulative calcium leaching from surface into the subsurface over several years (68) and lower SOM in the subsurface compared to surface soils (Table 1). Both surface and subsurface soils have relatively higher SOM compared to other podzolic soils sampled in the western NL, managed for about 60 years (21), or the nearby Canadian Maritime provinces (60). This could be attributed to higher organic carbon input in the Hummo-Ferric podzol through repeated application of manure.
Median molybdate reactive P concentrations in the Mehlich-3, citric acid, and water extract were 36.5, 131.2, and 0.9 mg P kg-1 in surface soils and 12.8, 90.1, and 0.7 mg P kg-1 in subsurface soils, respectively (Table S1). The soluble reactive P measured in water, citric acid, and Mehlich-3 solutions were significantly higher in surface than subsurface soils (Table 1). The higher P extractability in citric acid solution for both surface and subsurface soils compared to water and Mehlich-3 solution might be due to the ability of the 1% citric acid solution to extract more organic and inorganic P (69). The significant amount of P extracted by the citric acid from subsurface soils might suggest the vertical mobility of P due to long-term fertilizer input (20, 70, 71), combined with the natural podzolization mechanisms under the boreal climate (72).
The median of total P, potassium (K), calcium (Ca), and iron (Fe) extracted by Mehlich-3 from surface soils were significantly greater than for subsurface soils while for aluminum (Al) the trend was reversed (Table 1). The differences between surface and subsurface soils properties can be also attributed to the long-term recurring application of manure or mineral fertilizers, liming, and cropping (68, 73, 74). Previous studies (75–78) reported increased available or total P in surface soils of long-term managed fields. Different P-tests can be useful to assess the effect of long-term management on P pools (75). Furthermore, long term manure application leads to P build-up in surface (0-15 cm) soils but also to vertical mobility of available and total P (e.g., Whalen & Chang, 2001; 16 years of manure application).
The P build-up in the soil could occur due to various factors, including (i) nutrient-unbalanced over application of fertilizer, (ii) excessive application of manure targeting only the N requirements (13), and (iii) nature of the soil properties such as high Al and Fe content or low fertilizer responses (high P fixation) (21, 79). However, there is limited knowledge on the P sorption or storage capacity of the long-term managed podzolic soils. Thus, a single point P sorption test, the calculated P indexes based on Mehlich-3 test, and the measured soil properties were used to describe the P sorption capacity of the long-term managed podzolic soils.
Phosphorus Sorption Capacities Determined From a Point Sorption Test
The point P sorption capacity of 23 surface and 23 subsurface soils were significantly increased with increasing the initial P concentration from 150 to 500 mg P L-1 (Tables 1 and S4). When the soils were treated with an initial concentration of 150 mg P L-1, the median P sorption capacities of surface and subsurface were 1.34 and 1.32 mg P g-1, respectively, and not significantly different (Table 1). Nevertheless, when treated with 500 mg P L-1, the sorption capacity of subsurface soils (median: 2.74 mg P g-1) was significantly greater than for surface soils (median: 2.27 mg P g-1; Tables 1 and S4).
Surface and subsurface soils retained 89% and 88% of P applied at dose of 1.50 g P kg-1 dry soil or 150 mg P L-1, and 45% and 55% of P applied at dose of 5.00 g P kg-1 dry soil or 500 mg P L-1, respectively, after 24 hrs of contact time at ~20°C. The P retention characteristics can be explained by higher SOM, Ca, and Fe in surface soils and by the higher Al in the subsurface soils, as observed in this study and in our previous work (21). The higher P retention at lower P treatment shows that most P supplied was retained by the soils in forms likely not available for plant uptake. The higher fixation property of the studied soil at lower P concentration suggests adjusting the P recommendation based on soil’s sorption capacity in addition to standard P test. For the tested managed podzolic soils, and soils elsewhere with similar characteristics, rapid point P sorption test may be carried out with solution concentrations between 150 and 500 mg P L-1. The decline in proportional P retention capacity observed when the solution with the higher P concentration was used indicates the soils could be saturated in the future, and thus increases the risk of P losses. Börling et al. (2001) (52) also recommended that point P sorption testing should be carried out with a solution of 600 mg P kg-1.
A higher P sorption in the subsurface soils may be environmentally advantageous for reducing the leaching of P from the surface soil towards groundwater. The risk of particulate P losses cannot be ruled out. The P absorbed by the surface soils can be a source of labile P to replenish depleted P in the soil-solution. The long-term managed podzolic surface soils might thus serve as both source and sink while the subsurface soils mainly serve more as a sink for P. In the long-term, some deep-rooted crops might be able to access P accumulated in the subsurface soils depending on the chemical strength of fixed P species and soil management (80).
Previous reports for non-calcareous soils (grassland soils in Ireland) have also suggested Al as the dominant P fixing agent and have reported maximum P sorption capacities of 0.63 mg P g-1 (33). Values ranging from 0.19 to 0.38 mg P g-1 were reported for long-term managed (35-40 years) topsoil in central and southern Sweden (52). A maximum P sorption capacity of 8.23 and 3.12 mg P g-1 for a plough layer (Ap) and B horizon of managed field, and 5.08 and 5.35 mg P g-1 for unmanaged B and BC horizon were reported for the same study sites, respectively (21). The tested podzolic soils had several folds higher P sorption capacities than these other soils.
The mechanism of P sorption in the soil is linked to SOM, and mineral content (mainly Al), and possibly organometallic complexes (53, 57, 81). High level of calcium as result of long-term limestone application was also measured in surface soils (Table S1); Ca might precipitate P and contribute to the higher P sorption observed in our study (82), in addition to Al and Fe oxides (83–85). Nevertheless, the evidence for whether the SOM has negative or positive effect on P sorption in the soil is inconsistent (86). The SOM is a source of carboxyl anions (ROO−) that attract P-retaining cations in addition to Al and Fe oxyhydroxides (87). In our study, the SOM had a good Pearson correlation (r = 0.49 to 0.71, p <0.05) and linear relationships (r2 = 0.22 to 0.50, p <0.05) with the P sorption capacity for surface and subsurface soils (Figure 1). In the absence of detailed carbon chemical speciation, we cannot speculate on the mechanisms relating SOM to P sorption capacities. Phosphorus adsorbed on SOM and metal-organic surfaces may easily be mineralized to available P forms depending on the soil pH and microbial activities (82).
Despite the studied soils had long-term (>100 years) management history, the tested soils had lower labile P (colorimetric Mehlich-3-P), a function of a higher P sorption capacity (Tables 1 and S4), compared to some long-term managed podzolic soils in western Nfld, tropical sulfic soils in Brazil, or even alkaline soils in Manitoba and Ontario soils (6, 56, 63, 88). On the other hand, tropical acidic clay soils that received P fertilizers for three decades (6) had similar P retention trends regardless of the status of residual P. As often described, the Al and Fe levels in clay and Podzols are responsible for soil’s P sorption capacity (6, 33, 88, 89).
Citric acid-P and water-extracted P were also negatively correlated with P sorption capacity which confirmed the surface and subsurface soils to have a higher P retention capacity than reported elsewhere, with reactive Al oxides the most obvious driver (6, 78, 89).
Phosphorus Sorption Indices Calculated From Mehlich-3 Test
Surface soils had a significantly higher median PSI (2.85 ± 1.73%) than subsurface soils (1.29 ± 1.15%) (Tables 1, S1 and S2). The difference could be assigned by significantly lower aluminum to iron ratio and higher extractable P in surface than subsurface soils. The calculated P indices in this study are three to eight-fold lower than agronomically recommended PSI (10%) in the Canadian Maritime provinces (26, 60) or PSI values reported for farms in Nfld (63). The subsurface soils had a significant higher agronomic and environmental SPSC than surface soils due to higher Mehlich-3-Al and -Fe content (Table 1). The positive SPSCs indicates the studied soils can serve as P sink and this lower the risk of P loss. The estimated soil’s P sorption capacity is >20-folds lower compared to point P sorption in this study or maximum P sorption capacity measured in Nfld podzolic soils (21). The smaller SPSC might be attributed to the soil management conditions such as P sources, intensity, and history of fertiliser application, cropping systems, and crop types, and extractability of the Al and Fe in Mehlich-3 solution. Despite the huge difference observed, the P indices calculated from Mehlich-3 extractable P, Al, and Fe support the results obtained from the point P sorption capacity assessment. This implies that P sorption status of managed podzolic soils can be easily estimated either from standard soil test or point P sorption test.
Correlation of Point Phosphorus Sorption Capacity With Soil Properties
The point P sorption capacity assessed in this study had a significant positive correlation with Mehlich-3-Al, and SOM irrespective of the initial P concentrations (Figure 1). Aluminum and SOM were previously reported to be the main contributing factors for higher soil’s P sorption capacity (33, 90, 91). The dominant role of Al in controlling P sorption in podzolic soil was supported by the positive relationships between the point P sorption test with the Mehlich-3-Al to -Fe ratio and calculated SPSC (Figure 1). Furthermore, the point P sorption capacities of the tested soils had a significant positive linear correlation with the soil moisture content, which might reflect the significant correlation of moisture content with SOM (r = 0.51 and 0.77 for surface and subsurface, respectively, p <0.05; data not shown).
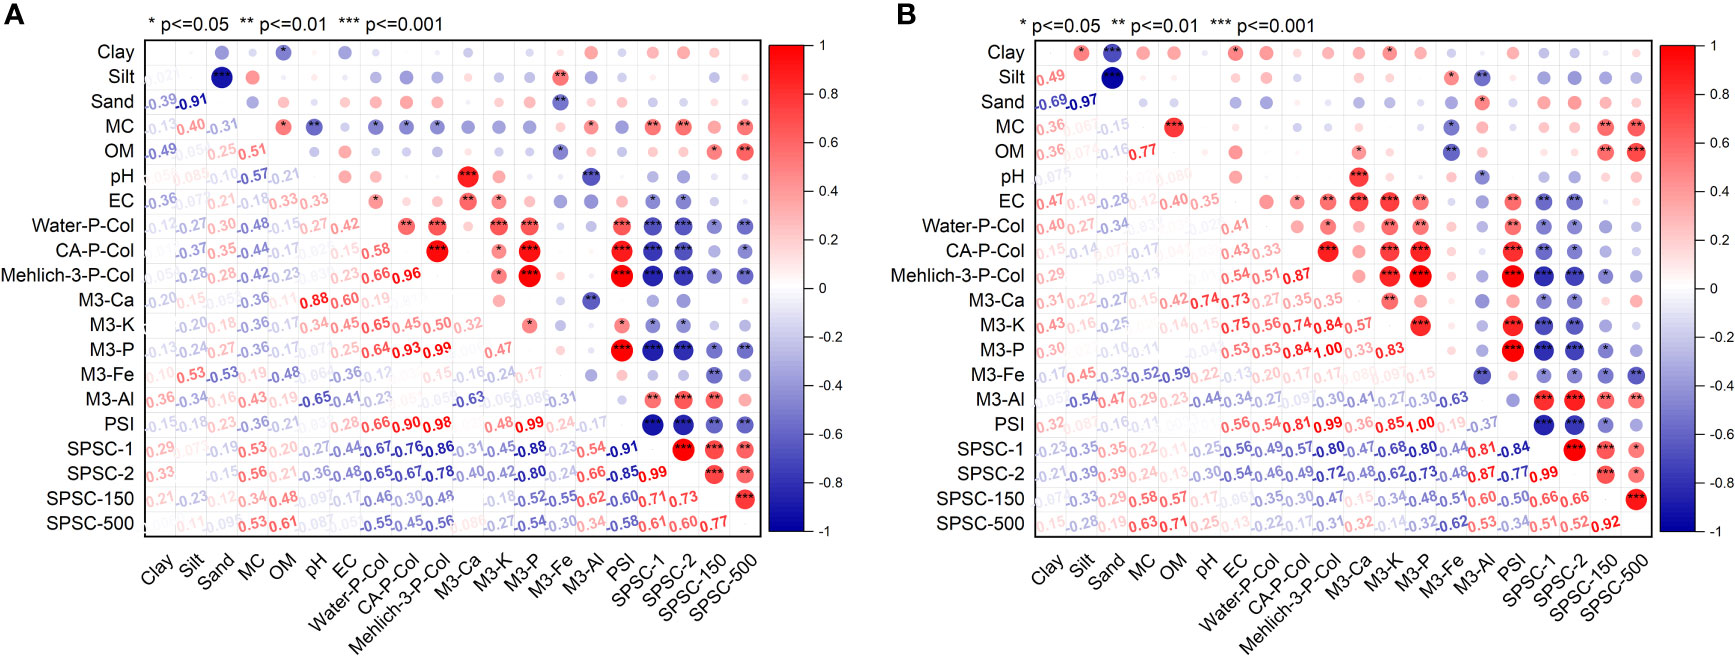
Figure 1 Pearson correlation between soil’s P sorption capacity and soil properties for managed SJRDC soils collected from (A) 0-20 cm (n = 23) and (B) 20-40 cm (n = 23). M3-Ca, M3-K, M3-P, M3-Fe, and M3-Al represent calcium (Ca), potassium (K), phosphorus (P), iron (Fe), and aluminum (Al)measured by ICP-OES in Mehlich-3 (M3) extract, respectively. Water-P-Col, CA-PCol, and M3-PCol represent soluble reactive P determined in deionized water, 1% citric acid, and Mehlich-3 extract using ascorbic acid colorimetry analysis, respectively; P saturation index (PSI), soil P sorption capacity (SPSC-1 and SPSC-2) at 0.10 and 0.14 critical PSI; PAC-150 and PAC-500 represented a P sorption capacity of soils treated with 150 mg P L-1 and 500 mg P L-1, respectively.
On the other hand, Mehlich-3-Fe and P extracted by Mehlich-3, 1% citric acid, and water, and calculated PSI were negatively correlated with P sorption capacities, confirming that soils with higher extractable P had lower P retention capacity and vice versa. Remarkably, the proportion of the silt fraction had a significant negative linear correlation with P sorption capacity of subsurface soil (Figure 1B). In agreement with Villapando and Graetz (2001) (91), there was a significant negative correlation between P sorption and Mehlich-3-Fe (Figure 1), which strengthens the argument that the Al oxides and possibly organic-Al chelates are the major players in P sorption, above iron, in podzolic soils.
The point P sorption capacities were not significantly correlated with clay content or pH (Figure 1). Previous studies reported both lower P mobility in soils with high clay (92), no impact of clays (52) or positive correlation of P sorption parameters with clay content (90). This suggests that the soil’s mineral composition have a role beyond the simple textural classification. Furthermore, long-term liming may mask the relation between P sorption capacity with clay and pH by modifying the clay surface charges. The pH range (6.3 ± 0.4) was near the ideal range for P availability and was likely not wide enough to allow for sufficient impact on the analysis. The significant linear correlations of P sorption with the extractable Mehlich-3-P, -Al, and -Fe, and SOM, obtained from standard farmers’ soil tests, widely employed in North America, suggest that these parameters can be used as input variables in pedotransfer functions for rapid estimation of the tested podzolic soils’ P sorption capacity. This could support the P fertilizer recommendation process.
Multiple Regression Analyses to Assess Relationships Between Phosphorus Sorption Capacity and Selected Soil Properties
Soil variables identified to have a significant correlation with the point P sorption capacity, based on simple linear correlations were used as independent variables for predictive multiple linear regressions. Collinear independent variables that were weakly correlated with dependent variables were excluded from the pedotransfer function.
The SOM alone explained about 20-50% of the variability of the P sorption capacity in both surface and subsurface soils (Table 2). The negative correlation between SOM and Fe (r = 0.48 and 0.59, p <0.05, data not shown), and Al and Fe (r = 0.31 and 0.63, p <0.05, data not shown) for surface and subsurface soils, respectively, demonstrated the dominant role of SOM and Al in P sorption capacity, an observation supported by other studies (78, 87). The SOM of surface and subsurface soils was greater than for soils in the nearby Canadian Maritime provinces (26, 60), likely due to long-term management or organic matter supplied from long-term manure application (93), and differences in cropping systems. For example, forage fields experience no or minimal soil disturbance or ploughing, while the potato fields common in Maritime provinces that require extensive soil preparation which might affect the SOM content (94, 95).
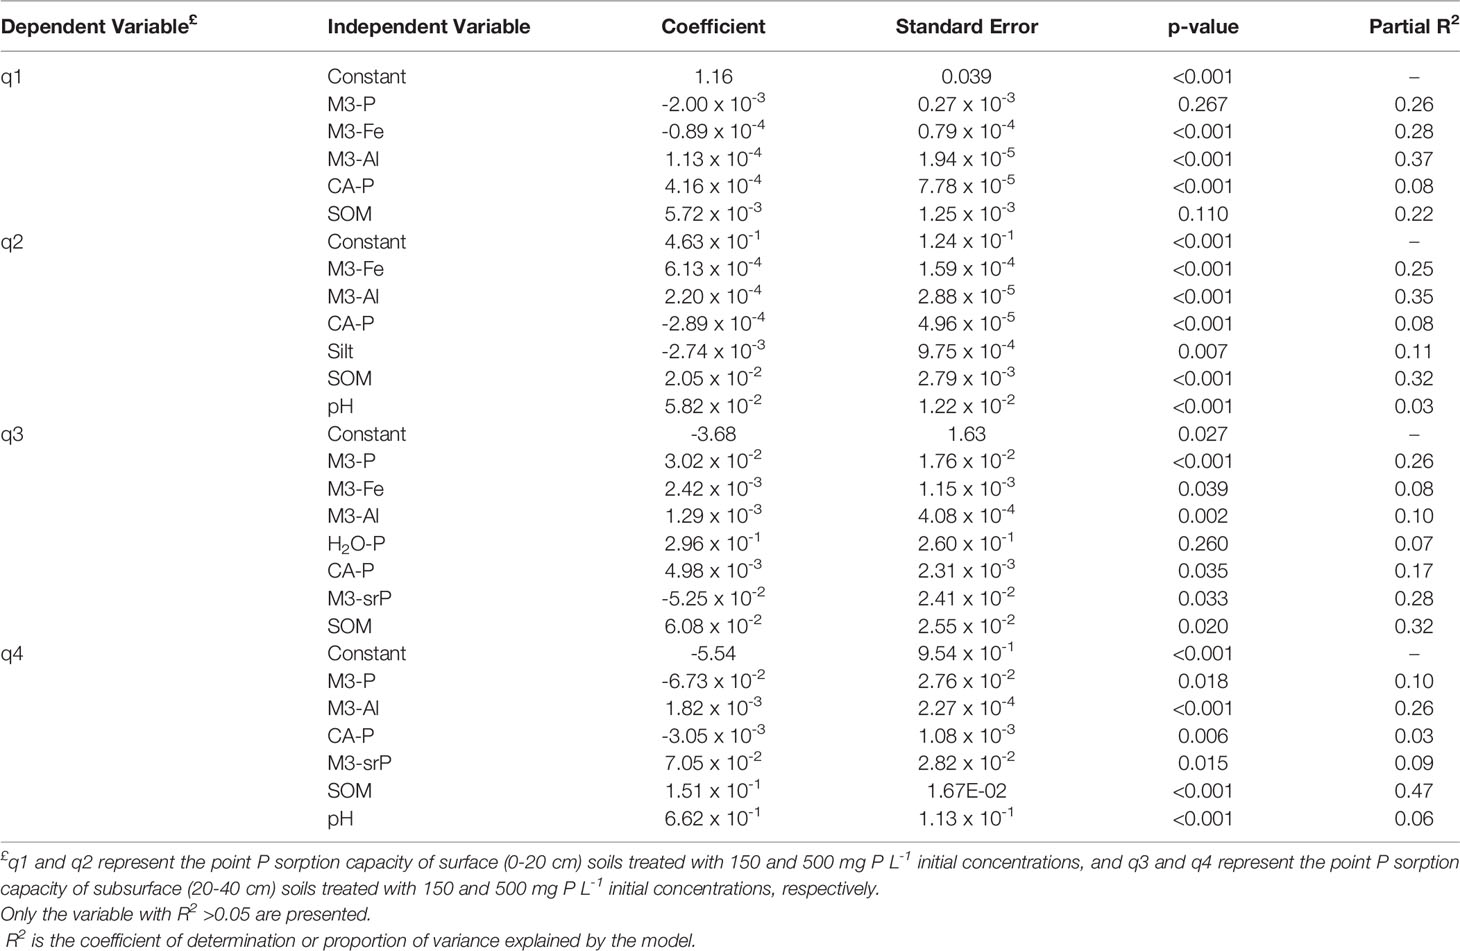
Table 2 Stepwise multivariate regression results for the relationships between P sorption parameters and selected soil variables.
Another important predictor of the soil’s P sorption capacity was the Al content of the soil, which explained up to 37% of the soil’s P sorption variability. Furthermore, Al was a better predictor in surface soils (Table 2). Villapando and Graetz (2001) concluded that copper chloride-extracted Al (organic matter-bound Al) was the major single factor controlling over 60% of the variability in the sorption of P in the Bh horizon of podzolic soils (91). The Mehlich-3-Al in this study might not fully account for the organic bound Al portion, similar to lower extractability of organic P (96).
The total P extracted by Mehlich-3 explained ~26% of the variability in the P sorption capacity when the soils are treated with lower initial P concentration (Table 2). The long-term fertilized soils expected to decrease the soil’s P sorption capacity (88) but the tested soils had not reached their maximum P sorption capacity (21). The models presented here could be used to predict the P sorption index of the long-term managed fields in similar settings, by using data available from routine farmer’s soil tests. However, the use of the P sorption capacity or soil test P for environmental risk assessments must be verified under field conditions (97, 98).
Conclusions
The long-term managed surface layer of podzolic soils had higher extractable Mehlich-3-P, -K, and -Fe, SOM, and EC, than the subsurface soils. The reverse was true for Al. The effect of long-term liming was reflected in the increased pH of both soil layers. The P accumulation in the surface soil and potential vertical P mobility to the subsurface soil layers signals the need for proper management of P in such soils. Thus, the tested surface soil likely acts as both source and sink for P while the subsurface soil might mainly serve as a P sink.
The measured P sorption capacities were comparable for both soil layers at the low P concentration(150 mg P L-1); however, a significantly higher P sorption capacity was observed in the subsurface than surface soils at the higher P concentration (500 mg P L-1), a phenomenon attributable to higher Al content. Therefore, a higher initial P concentration of 500 mg P L-1 is recommended for assessing the point P sorption capacity of similar podzolic soils. Alternatively, the P sorption capacity could be estimated from SOM, Mehlich-3-P, and -Al; related pedotransfer functions may be employed to develop testable hypotheses for the development of environmentally and economically viable P management strategies for acidic soils in boreal regions.
Data Availability Statement
The raw data supporting the conclusions of this article will be made available by the authors, without undue reservation.
Author Contributions
Conceptualization and methodology, AK, AU, and DM. Data analysis and interpretation, AK and AU. Investigation, AK. Writing – original draft, AK and AU. Writing – review and editing, AK, AU, JN, DM, and KH. Funding acquisition, AU. Resources, AU and DM. All authors contributed to the article and approved the submitted version.
Funding
This work was funded by the Memorial University of Newfoundland (Baseline graduate funding), a Natural Sciences and Engineering Research Council of Canada-Engage Grant awarded to AU, analytical support, including supplies costs, were partially covered by the Government of Newfoundland and Labrador, Department of Fisheries and Land Resources, Agriculture and Lands Branch.
Acknowledgments
We would like to thank the assistance of anonymous technicians at St. John’s Research and Development Centre, Agriculture and Agri-Food Canada, and Fagner T. at the Soil, Plant and Feed Laboratory, Department of Fisheries and Land Resources, Agriculture and Lands Branch.
Conflict of Interest
The authors declare that the research was conducted in the absence of any commercial or financial relationships that could be construed as a potential conflict of interest.
Publisher’s Note
All claims expressed in this article are solely those of the authors and do not necessarily represent those of their affiliated organizations, or those of the publisher, the editors and the reviewers. Any product that may be evaluated in this article, or claim that may be made by its manufacturer, is not guaranteed or endorsed by the publisher.
Supplementary Material
The Supplementary Material for this article can be found online at: https://www.frontiersin.org/articles/10.3389/fsoil.2022.931266/full#supplementary-material
Abbreviations
Ca, Mehlich-3 extractable calcium; Fe, iron; Al, aluminum; K, potassium; Nfld, Newfoundland; P, Phosphorus; PSC, batch phosphorus sorption capacity; PSI, Phosphorus Saturation Index; SOM, Soil Organic Matter; SPSC, Soil P Sorption Capacity.
References
1. Scholz RW, Ulrich AE, Eilittä M, Roy A. Sustainable Use of Phosphorus: A Finite Resource. Sci Tot Env (2013) 461:799–803. doi: 10.1016/j.scitotenv.2013.05.043
2. Cordell D, White S. Life’s Bottleneck: Sustaining the World’s Phosphorus for a Food Secure Future. Annu Rev Environ Res (2014) 39(1):161–88. doi: 10.1146/annurev-environ-010213-113300
3. Cordell D, Drangert JOO, White S. The Story of Phosphorus: Global Food Security and Food for Thought. Global Environ Change (2009) 19(2):292–305. doi: 10.1016/j.gloenvcha.2008.10.009
4. Smil V. Phosphorus in the Environment: Natural Flows and Human Interferences. Annu Rev Energy Environ (2000) 25(1):53–88. doi: 10.1146/annurev.energy.25.1.53
5. IFPRI. Curse or Blessing? Washington, DC: International Food Policy Research Institute (2002). Available at: http://www.ifpri.org/publication/green-revolution.
6. Roy ED, Willig E, Richards PD, Martinelli LA, Vazquez FF, Pegorini L, et al. Soil Phosphorus Sorption Capacity After Three Decades of Intensive Fertilization in Mato Grosso, Brazil. Agri Ecosyst Env (2017) 249:206–14. doi: 10.1016/j.agee.2017.08.004
7. Osman KT. Management of Soil Problems. 1st ed. Cham, Switzerland: Springer International Publishing (2018).
8. Nair VD. Soil Phosphorus Saturation Ratio for Risk Assessment in Land Use Systems. Front Environ Sci (2014) 2:1–4. doi: 10.3389/fenvs.2014.00006
9. Nair VD, Harris WG. Soil Phosphorus Storage Capacity for Environmental Risk Assessment. Adv Agric (2014) 2014:1–10. doi: 10.1155/2014/723064
10. Schoumans OF. Phosphorus Leaching From Soils: Process Description, Risk Assessment and Mitigation. Wageningen, Netherlands: Wageningen University and Research (2015). Available at: https://pdfs.semanticscholar.org/d98a/6ad92dc2017a73cd2393efb1c96a51ff9fa8.pdf.
11. Schoumans OF, Chardon WJ. Phosphate Saturation Degree and Accumulation of Phosphate in Various Soil Types in The Netherlands. Geoderma (2014) 237:325–35. doi: 10.1016/j.geoderma.2014.08.015
12. Fischer P, Pöthig R, Venohr M. The Degree of Phosphorus Saturation of Agricultural Soils in Germany: Current and Future Risk of Diffuse P Loss and Implications for Soil P Management in Europe. Sci Tot Environ (2017) 599–600:1130–9. doi: 10.1016/j.scitotenv.2017.03.143
13. Qian P, Schoenau JJ, Wu T, Mooleki P. Phosphorus Amounts and Distribution in a Saskatchewan Soil After Five Years of Swine and Cattle Manure Application. Can J Soil Sci (2004) 84:275–81. doi: 10.4141/S03-016
14. King M, Altdorff D, Li P, Galagedara L, Holden J, Unc A. Northward Shift of the Agricultural Climate Zone Under 21st-Century Global Climate Change. Sci Rep (2018) 8(1):7904. doi: 10.1038/s41598-018-26321-8
15. Eriksson AK, Hesterberg D, Klysubun W, Gustafsson JP. Phosphorus Dynamics in Swedish Agricultural Soils as Influenced by Fertilization and Mineralogical Properties: Insights Gained From Batch Experiments and XANES Spectroscopy. Sci Tot Environ (2016) 566–567:1410–9. doi: 10.1016/j.scitotenv.2016.05.225
16. Arruda Coelho MJ, Ruiz Diaz D, Hettiarachchi GM, Dubou Hansel F, Pavinato PS. Soil Phosphorus Fractions and Legacy in a Corn-Soybean Rotation on Mollisols in Kansas, USA. Geoder Reg (2019) 18:e00228. doi: 10.1016/j.geodrs.2019.e00228
17. Costa MG, Gama-Rodrigues AC, Gonçalves JL de M, Gama-Rodrigues EF, Sales MV da S, Aleixo S. Labile and non-Labile Fractions of Phosphorus and its Transformations in Soil Under Eucalyptus Plantations, Brazil. Forests (2016) 7(1):1–15. doi: 10.3390/f7010015
18. Luo L, Ma Y, Sanders RL, Xu C, Li J, Myneni SCB. Phosphorus Speciation and Transformation in Long-Term Fertilized Soil: Evidence From Chemical Fractionation and P K-Edge XANES Spectroscopy. Nut Cycling Agroecosys (2017) 107(2):215–26. doi: 10.1007/s10705-017-9830-5
19. Rubæk GH, Kristensen K, Olesen SE, Østergaard HS, Heckrath G. Phosphorus Accumulation and Spatial Distribution in Agricultural Soils in Denmark. Geoderma (2013) 209–210:241–50. doi: 10.1016/j.geoderma.2013.06.022
20. Glæsner N, Kjaergaard C, Rubæk GH, Magid J. Relation Between Soil P Test Values and Mobilization of Dissolved and Particulate P From the Plough Layer of Typical Danish Soils From a Long-Term Field Experiment With Applied P Fertilizers. Soil Use Manag (2013) 29(3):297–305. doi: 10.1111/sum.12060
21. Kedir AJ, Nyiraneza J, Galagedara L, Cheema M, Hawboldt KA, McKenzie DB, et al. Phosphorus Adsorption Characteristics in Forested and Managed Podzolic Soils. Soil Sci Soc America J (2021) 85(2):249–62. doi: 10.1002/saj2.20180
22. Howard AE. Agronomic Thresholds for Soil Phosphorus in Alberta: A Review. In: Alberta Soil Phosphorus Limits Project. Volume 5: Background Information and Reviews. Lethbridge, Alberta, Canada: Alberta Agriculture, Food and Rural Development (2006).
23. Radcliffe DE, Cabrera MLeditors. Modeling Phosphorus in the Environment. First. Boca Raton, FL: CRC Press (2006). doi: 10.2136/sssaj2007.0025br
24. Radcliffe DE, Reid DK, Blombäck K, Bolster CH, Collick AS, Easton ZM, et al. Applicability of Models to Predict Phosphorus Losses in Drained Fields: A Review. J Environ Quality (2015) 44(2):614–28. doi: 10.2134/jeq2014.05.0220
25. Wuenscher R, Unterfrauner H, Peticzka R, Zehetner F. A Comparison of 14 Soil Phosphorus Extraction Methods Applied to 50 Agricultural Soils From Central Europe. Plant Soil Env (2015) 61(2):86–96. doi: 10.17221/932/2014-PSE
26. Benjannet R, Khiari L, Nyiraneza J, Thompson B, He J, Geng X, et al. Identifying Environmental Phosphorus Risk Classes at the Scale of Prince Edward Island, Canada. Can J Soil Sci (2018) 98(2):317–29. doi: 10.1139/cjss-2017-0076
27. Dari B, Nair VD, Colee J, Harris WG, Mylavarapu R. Estimation of Phosphorus Isotherm Parameters: A Simple and Cost-Effective Procedure. Front Environ Sci (2015) 3:1–9. doi: 10.3389/fenvs.2015.00070
28. Maguire RO, Sims JT. Soil Testing to Predict Phosphorus Leaching. J Environ Quality. (2002) 31(5):1601–9. doi: 10.2134/jeq2002.1601
29. Nobile CM, Bravin MN, Tillard E, Becquer T, Paillat JM. Phosphorus Sorption Capacity and Availability Along a Toposequence of Agricultural Soils: Effects of Soil Type and a Decade of Fertilizer Applications. Soil Use Manage (2018) 34(4):461–71. doi: 10.1111/sum.12457
30. Jalali M, Jalali M. Relation Between Various Soil Phosphorus Extraction Methods and Sorption Parameters in Calcareous Soils With Different Texture. Sci Tot Environ (2016) 566–567(2015):1080–93. doi: 10.1016/j.scitotenv.2016.05.133
31. Muwamba A, Nkedi-Kizza P, Morgan KT. Determination of Sorption Coefficient of Phosphorus Applied for Sugarcane Production in Southwestern Florida. J Environ Quality (2016) 45(5):1760–8. doi: 10.2134/jeq2016.03.0087
32. Wang YT, Zhang TQ, O’Halloran IP, Tan CS, Hu QC. A Phosphorus Sorption Index and its Use to Estimate Leaching of Dissolved Phosphorus From Agricultural Soils in Ontario. Geoderma (2016) 274:79–87. doi: 10.1016/j.geoderma.2016.04.002
33. Daly K, Styles D, Lalor S, Wall DP. Phosphorus Sorption, Supply Potential and Availability in Soils With Contrasting Parent Material and Soil Chemical Properties. Eur J Soil Sci (2015) 66(4):792–801. doi: 10.1111/ejss.12260
34. Environment and Climate Change Canada. Canadian Climate Normals 1981-2010 Station Data - Climate - Environment and Climate Change Canada . Available at: https://climate.weather.gc.ca/climate_normals/results_1981_2010_e.html?stnID=6722&autofwd=1.
35. Cordeiro MRC, Rotz A, Kroebel R, Beauchemin KA, Hunt D, Bittman S, et al. Prospects of Forage Production in Northern Regions Under Climate and Land-Use Changes: A Case-Study of a Dairy Farm in Newfoundland, Canada. Agronomy (2019) 9(1):31. doi: 10.3390/agronomy9010031
36. Spaner D, Todd AG, McKenzie DB. Pea and Soybean Performance in Newfoundland. Can J Plant Sci. (2001) 81(4):723–6. doi: 10.4141/P00-195
37. Spaner D, Todd AG. Farmer-Directed on-Farm Experimentation Examining the Impact of Companion Planting Barley and Oats on Timothy-Alfalfa Forage Establishment in Central Newfoundland. Can J Plant Sci (2004) 84(1):217–21. doi: 10.4141/P03-020
38. Spaner D, Todd AG, McKenzie DB. The Effect of Seeding Rate and Nitrogen Fertilization on Barley Yield and Yield Components in a Cool Maritime Climate. J Agron Crop Sci (2001) 187(2):105–10. doi: 10.1046/j.1439-037X.2001.00507.x
39. Woodrow EF, RSt C, Wang C, Rees HW, McKenzie D, Bishop G, et al. Soil Quality Evaluation Program: Benchmark Site Documentation 25-F. St. John's, Newfoundland and Labrador, Canada: Agriculture and Agri-Food Canada (1996).
40. Spaner D, McKenzie DB, Todd AG, Simms A, MacPherson M, Woodrow EF. Six Years of Adaptive and on-Farm Spring Cereal Research in Newfoundland. Can J Plant Sci (2000) 80(1):205–16. doi: 10.4141/P99-076
41. Heringa PK. Soils of the Avalon Peninsula, Newfoundland Soil Survey Report No. 3. Canada: Research Branch Agriculture Canada, St. John's, Newfoundland and Labrador, (1981).
42. Jones JB Jr. Laboratory Guide for Conducting Soil Tests and Plant Analysis. Boca Raton, FL: CRC Press (2001).
43. Kalra YP, Maynard DG. Methods Manual for Forest Soil and Plant Analysis. Information Report No. R-X-319. Forestry Canada, Northwest Region: Northern Forestry Centre, Canada (1991).
44. Hendershot WH, Lalande H, Duquette M. Soil Reaction and Exchangeable Acidity. In: Carter MR, Gregorich EG, editors. Soil Sampling and Methods of Analysis. Second. Boca Raton, Florida: CRC Press Taylor & Francis Group (2008). p. 173–8.
45. Kroetsch D, Wang C. Soil Physical Analysis, Particle Size Distribution. In: Carter MR, Gregorich EG, editors. Soil Sampling and Methods of Analysis. Second. Boca Raton, Florida: CRC Press Taylor & Francis Group (2008). p. 713–25.
46. Mehlich A. Mehlich 3 Soil Test Extractant: A Modification of Mehlich 2 Extractant. Commun Soil Sci Plant Anal (1984) 15(12):1409–16. doi: 10.1080/00103628409367568
47. Thompson GR. The Direct Determination of Phosphorus in Citric Acid Soil Extracts by Colorimetry and Direct-Current Plasma Emission Spectroscopy. South Afr J Plant Soil (1995) 12(4):152–7. doi: 10.1080/02571862.1995.10634356
48. Fuhrman JK, Zhang H, Schroder JL, Davis RL, Payton ME. Water-Soluble Phosphorus as Affected by Soil to Extractant Ratios, Extraction Times, and Electrolyte. Commun Soil Sci Plant Anal (2005) 36(7–8):925–35. doi: 10.1081/CSS-200049482
49. Messiga AJ, Lam C, Li Y. Phosphorus Saturation Index and Water-Extractable Phosphorus in High-Legacy Phosphorus Soils in Southern British Columbia, Canada. Can J Soil Sci (2021) 101(3):365–77. doi: 10.1139/cjss-2020-0129
50. Murphy J, Riley JP. A Modified Single Solution Method for the Determination of Phosphate in Natural Waters. Anal Chem Acta (1962) 27:31–6. doi: 10.1016/S0003-2670(00)88444-5
51. Watanabe FS, Olsen SR. Test of an Ascorbic Acid Method for Determining P in Water and NaHCO3 Extracts From Soil. Soil Sci Soc America Proc (1965) 29:677–8. doi: 10.2136/sssaj1965.03615995002900060025x
52. Börling K, Otabbong E, Barberis E. Phosphorus Sorption in Relation to Soil Properties in Some Cultivated Swedish Soils. Nut Cycling Agroecosys (2001) 59(1):39–46. doi: 10.1023/A:1009888707349
53. Väänänen R, Hristov J, Tanskanen N, Hartikainen H, Nieminen M, Ilvesniemi H. Phosphorus Sorption Properties in Podzolic Forest Soils and Soil Solution Phosphorus Concentration in Undisturbed and Disturbed Soil Profiles. Boreal Environ Res (2008) 13(6):553–67.
54. Bache BW, Willims EG. A Phosphate Sorption Index for Soils. J Soil Sci (1971) 22(3):289–301. doi: 10.1111/j.1365-2389.1971.tb01617.x
55. do Carmo Horta M, Torrent J. Phosphorus Desorption Kinetics in Relation to Phosphorus Forms and Sorption Properties of Portuguese Acid Soils. Soil Sci (2007) 172(8):631–8. doi: 10.1097/ss.0b013e3180577270
56. Ige DV, Akinremi OO, Flaten DN. Environmental Index for Estimating the Risk of Phosphorus Loss in Calcareous Soils of Manitoba. J Environ Quality (2005) 34(6):1944–51. doi: 10.2134/jeq2004.0468
57. Olsen SR, Watanabe FS. A Method to Determine a Phosphorus Adsorption Maximum of Soils as Measured by the Langmuir Isotherm 1. Soil Sci Soc America J (1957) 21(2):144–9. doi: 10.2136/sssaj1957.03615995002100020004x
58. Pierzynski GM. Methods of Phosphorus Analysis for Soils, Sediments, Residuals, and Waters. Kansas State University Manhattan, Kansas State: Southern Cooperative Series Bulletin (2000) 396.
59. Chen X. Modeling of Experimental Adsorption Isotherm Data. Inf (Switzerland). (2015) 6(1):14–22. doi: 10.3390/info6010014
60. Benjannet R, Nyiraneza J, Khiari L, Fuller K, Bizimungu B, Savoie D, et al. An Agro-Environmental Phosphorus Model for Potato in the Canadian Maritime Provinces. Agron J (2018) 110(6):2566–75. doi: 10.2134/agronj2017.12.0751
61. Szara E, Sosulski T, Szymańska M, Szyszkowska K. Usefulness of Mehlich-3 Test in the Monitoring of Phosphorus Dispersion From Polish Arable Soils. Environ Monit Assess (2018) 190(5):298. doi: 10.1007/s10661-018-6685-4
62. Dari B, Nair VD, Harris WG. Approaches for Evaluating Subsurface Phosphorus Loss Potential From Soil Profiles. Agri Ecosyst Env (2017) 45(1):92–9. doi: 10.1016/j.agee.2017.05.006
63. Kedir AJ, Zhang M, Unc A. Understanding Soil Fertility Status in Newfoundland From Standard Farm Soil Tests. Can J Soil Sci (2021) 101(3):517–31. doi: 10.1139/cjss-2020-0108
64. Chakraborty D, Prasad R. Stratification of Soil Phosphorus Forms From Long-Term Repeated Poultry Litter Applications and its Environmental Implication. Environ Challenges (2021) 5:1–10. doi: 10.1016/j.envc.2021.100374
65. Hammer Ø, Harper DAT, Ryan PD. Past: Paleontological Statistics Software Package for Education and Data Analysis. Palaeontol Electronica (2001) 4(1):1–9.
66. Wang FL, Huang PM. Effects of Organic Matter on the Rate of Potassium Adsorption by Soils. Can J Soil Sci (2001) 81(3):325–30. doi: 10.4141/S00-069
67. Wang MC, Chang SH. Mean Residence Times and Characteristics of Humic Substances Extracted From a Taiwan Soil. Can J Soil Sci (2001) 81(3):299–307. doi: 10.4141/S00-068
68. Conyers MK, Mullen CL, Scott BJ, Poile GJ, Braysher BD. Long-Term Benefits of Limestone Applications to Soil Properties and to Cereal Crop Yields in Southern and Central New South Wales. Aust J Exp Agri (2003) 43(1):71–8. doi: 10.1071/EA01121
69. Wei L, Chen C, Xu Z. Citric Acid Enhances the Mobilization of Organic Phosphorus in Subtropical and Tropical Forest Soils. Biol Fertil Soils (2010) 46(7):765–9. doi: 10.1007/s00374-010-0464-x
70. McDowell RW, Worth W, Carrick S. Evidence for the Leaching of Dissolved Organic Phosphorus to Depth. Sci Tot Env (2021) 755:142392. doi: 10.1016/j.scitotenv.2020.142392
71. Ojekami A, Ige D, Hao X, Akinrem O. Phosphorus Mobility in a Soil With Long Term Manure Application. J Agr Sci (2011) 3(3):25–38. doi: 10.5539/jas.v3n3p25
72. Sanborn P, Lamontagne L, Hendershot W. Podzolic Soils of Canada: Genesis, Distribution, and Classification. Can J Soil Sci (2011) 91:843–80. doi: 10.4141/cjss10024
73. Johnston AE, Poulton PR. Phosphorus in Agriculture: A Review of Results From 175 Years of Research at Rothamsted, Uk. J Environ Quality. (2019) 48(5):1133–44. doi: 10.2134/jeq2019.02.0078
74. Johnston AE, Poulton PR, Fixen PE, Curtin D. Phosphorus. Its Efficient Use in Agriculture. In: Advances in Agronomy (2014) 123:177–228. doi: 10.1016/B978-0-12-420225-2.00005-4
75. Allen BL, Mallarino AP. Relationships Between Extractable Soil Phosphorus and Phosphorus Saturation After Long-Term Fertilizer or Manure Application. Soil Sci Soc America J (2006) 70(2):454–63. doi: 10.2136/sssaj2005.0031
76. Liu J, Hu Y, Yang J, Abdi D, Cade-Menun BJ. Investigation of Soil Legacy Phosphorus Transformation in Long-Term Agricultural Fields Using Sequential Fractionation, P K-Edge XANES and Solution P NMR Spectroscopy. Environ Sci Technol (2015) 49(1):168–76. doi: 10.1021/es504420n
77. Whalen JK, Chang C. Phosphorus Accumulation in Cultivated Soils From Long-Term Annual Applications of Cattle Feedlot Manure. J Environ Quality (2001) 30(1):229–37. doi: 10.2134/jeq2001.301229x
78. Eriksson AK, Gustafsson JP, Hesterberg D. Phosphorus Speciation of Clay Fractions From Long-Term Fertility Experiments in Sweden. Geoderma (2015) 241–242:68–74. doi: 10.1016/j.geoderma.2014.10.023
79. Grant C, Bittman S, Montreal M, Plenchette C, Morel C. Soil and Fertilizer Phosphorus: Effects on Plant P Supply and Mycorrhizal Development. Can J Plant Sci (2005) 85(1):3–14. doi: 10.4141/P03-182
80. Read DWL, Campbell CA. Bio-Cycling of Phosphorus in Soil by Plant Roots. Can J Soil Sci (1981) 61(4):587–9. doi: 10.4141/cjss81-069
81. Väänänen R, Kenttämies K, Nieminen M. Phosphorus Retention Properties of Forest Humus Layer in Buffer Zones and Clear-Cut Areas in Southern Finland. Boreal Environ Res (2007) 12:601–9.
82. Haynes RJ. Effects of Liming on Phosphate Availability in Acid Soils. Plant Soil (1982) 68(3):289–308. doi: 10.1007/BF02197935
83. Szafranek A, Skłodowski P. Phosphate Sorption in Relation to Extractable Iron and Aluminium in Orthic Luvisols. Polish J Soil Sci (1999) 32(2):35–44.
84. Grand S, Lavkulich LM. Potential Influence of Poorly Crystalline Minerals on Soil Chemistry in Podzols of Southwestern Canada. Eur J Soil Sci (2013) 64(5):651–60. doi: 10.1111/ejss.12062
85. Wang X, Phillips B, Boily JF, Hu Y, Hu Z, Yang P, et al. Phosphate Sorption Speciation and Precipitation Mechanisms on Amorphous Aluminum Hydroxide. Soil Sys (2019) 3(1):20. doi: 10.3390/soilsystems3010020
86. Yang X, Chen X, Yang X. Effect of Organic Matter on Phosphorus Adsorption and Desorption in a Black Soil From Northeast China. Soil Tillage. Res (2019) 187:85–91. doi: 10.1016/j.still.2018.11.016
87. Warrinnier R, Goossens T, Amery F, vanden Nest T, Verbeeck M, Smolders E. Investigation on the Control of Phosphate Leaching by Sorption and Colloidal Transport: Column Studies and Multi-Surface Complexation Modelling. Appl Geochem (2019) 100:371–9. doi: 10.1016/j.apgeochem.2018.12.012
88. Bhattacharyya P, Nayak AK, Shahid M, Tripathi R, Mohanty S, Kumar A, et al. Effects of 42-Year Long-Term Fertilizer Management on Soil Phosphorus Availability, Fractionation, Adsorption–Desorption Isotherm and Plant Uptake in Flooded Tropical Rice. Crop J (2015) 3(5):387–95. doi: 10.1016/j.cj.2015.03.009
89. Grand S, Lavkulich LM. Short-Range Order Mineral Phases Control the Distribution of Important Macronutrients in Coarse-Textured Forest Soils of Coastal British Columbia, Canada. Plant Soil (2015) 390(1–2):77–93. doi: 10.1007/s11104-014-2372-6
90. Moazed H, Hoseini Y, Naseri AA, Abbasi F. Determining Phosphorus Adsorption Isotherm in Soil and its Relation to Soil Characteristics. Int J Soil Sci. (2010) 5(3):131–9. doi: 10.3923/ijss.2010.131.139
91. Villapando RR, Graetz DA. Phosphorus Sorption and Desorption Properties of the Spodic Horizon From Selected Florida Spodosols. Soil Sci Soc America J (2001) 65(2):331–9. doi: 10.2136/sssaj2001.652331x
92. do Nascimento CAC, Pagliari PH, Faria L de A, Vitti GC. Phosphorus Mobility and Behavior in Soils Treated With Calcium, Ammonium, and Magnesium Phosphates. Soil Sci Soc America J (2018) 82(3):622. doi: 10.2136/sssaj2017.06.0211
93. Emilie Maillard A, Angers D. Animal Manure Application and Soil Organic Carbon Stocks: A Meta-Analysis. Global Change Biol (2014) 20:666–79. doi: 10.1111/gcb.12438
94. Ding G, Novak JM, Amarasiriwardena D, Hunt PG, Xing B. Soil Organic Matter Characteristics as Affected by Tillage Management. Soil Sci Soc America J (2002) 66(2):421. doi: 10.2136/sssaj2002.4210
95. Uwituze Y, Nyiraneza J, Fraser TD, Dessureault-Rompré J, Ziadi N, Lafond J. Carbon, Nitrogen, Phosphorus and Extracellular Soil Enzyme Responses to Different Land Use. Front Soil Sci (2022) 1AD:19. doi: 10.3389/fsoil.2022.814554
96. Ziadi N, Bélanger G, Gagnon B, Mongrain D. Mehlich 3 Soil Phosphorus as Determined by Colorimetry and Inductively Coupled Plasma. Commun Soil Sci Plant Anal (2009) 40(1–6):132–40. doi: 10.1080/00103620802649377
97. Buczko U, Kuchenbuch RO. Phosphorus Indices as Risk-Assessment Tools in the U.S.A. And Europe - A Review. J Plant Nutr Soil Sci (2007) 170(4):445–60. doi: 10.1002/jpln.200725134
Keywords: soil phosphorus sorption capacity, phosphorus saturation index, boreal agriculture, managed podzolic soils, point phosphorus adsorption capacity
Citation: Kedir AJ, Nyiraneza J, Hawboldt KA, McKenzie DB and Unc A (2022) Phosphorus Sorption Capacity and Its Relationships With Soil Properties Under Podzolic Soils of Atlantic Canada. Front. Soil Sci. 2:931266. doi: 10.3389/fsoil.2022.931266
Received: 28 April 2022; Accepted: 15 June 2022;
Published: 08 September 2022.
Edited by:
Xiaogang Yin, China Agricultural University, ChinaReviewed by:
Shamsollah Ayoubi, Isfahan University of Technology, IranTangyuan Ning, Shandong Agricultural University, China
Copyright © 2022 Amana Jemal Kedir, Kelly Anne Hawboldt, Adrian Unc, and Her Majesty the Queen in Right of Canada, as represented by the Minister of Agriculture and Agri-Food for the contribution of Judith Nyiraneza, David Bruce Mckenzie.. This is an open-access article distributed under the terms of the Creative Commons Attribution License (CC BY). The use, distribution or reproduction in other forums is permitted, provided the original author(s) and the copyright owner(s) are credited and that the original publication in this journal is cited, in accordance with accepted academic practice. No use, distribution or reproduction is permitted which does not comply with these terms.
*Correspondence: Amana Jemal Kedir, YWprZWRpckBtdW4uY2E=; Adrian Unc, YXVuY0BncmVuZmVsbC5tdW4uY2E=