 Moh’d M. Omar1,2*
 Mawazo J. Shitindi1Boniface H. J. Massawe1Ole Pedersen3Joel L. Meliyo4Kadeghe G. Fue5
- 1Department of Soil and Geological Sciences, Sokoine University of Agriculture, Morogoro, Tanzania
- 2Mlingano Centre, Tanzania Agricultural Research Institute (TARI), Tanga, Tanzania
- 3Department of Biology, University of Copenhagen, Copenhagen, Denmark
- 4Hombolo Center, Tanzania Agricultural Research Institute (TARI), Dodoma, Tanzania
- 5Department of Agricultural Engineering, School of Engineering and Technology, Sokoine University of Agriculture, Morogoro, Tanzania
Regression models were developed to estimate the electrical conductivity of saturated paste extract (ECe) from the electrical conductivity of soil-water ratio (EC1:2.5) for different soil textural classes. ECe is a crucial parameter used to indicate the presence, type, and distribution of salinity in soils. However, determining ECe is demanding, time-consuming, requires considerable skill to accurately identify the correct soil saturation point, and is not routinely performed by soil testing laboratories. Many laboratories, instead, commonly measure the electrical conductivity of soil-water extracts at various dilutions, such as EC1:1, EC1:2.5, or EC1:5. In this study, 706 soil samples were collected from depths of 0 - 30 cm across three rice irrigation schemes to determine EC1:2.5, with 50% analyzed for ECe. ECe values were grouped based on soil textural classes. The results showed a strong linear relationship between EC1:2.5 and ECe values, with a high coefficient of determination (R² > 0.95). The Root Mean Square Error values were low (1.4 < RMSE), and the Mean Absolute Error values were similarly low (0.85 < MAE). Therefore, the regression models developed provide a practical means of estimating ECe for various soil textural classes, thereby enhancing soil salinity assessment and management strategies.
1 Introduction
Salt-affected soils pose a significant threat to soil quality and agricultural productivity, particularly in arid and semi-arid regions, by affecting crop yields and soil health (1, 2) hence directly affecting food security (3–6). Consistent with food insecurity and environmental unsustainability, the impacts of salt-affected soil extend down to the individual farmers’ economies through crop yield losses and reclamation costs (1, 7). Salt-affected soils are characterized by the presence of cations such as sodium (Na+), calcium (Ca2+), magnesium (Mg2+), and potassium (K+), while common anions in salt affected soils are chlorides (Cl−), sulphates (SO42−), carbonates (CO32−), and bicarbonates (HCO3−) (8, 9). However, based on sodium ion and salt concentrations, salt-affected soils are classified as saline, sodic, and saline-sodic soils (9). These soils can negatively affect plant physiological, biochemical, and genetic properties, except for salt-tolerant plants (10–13). Numerous studies have highlighted the negative effects of salt-affected soils on plants, including inhibition of seed germination, plant growth and development (14–17); ion toxicity and nutrient imbalance (18, 19), inhibiting the functions of microorganisms (20), and reducing water and micronutrients uptake potential of the plant (21, 22). Further studies indicated that salt stress impairs plant photosynthetic mechanisms, nutrient transportation, gaseous exchange, and chloroplast metabolism and reduces stomatal conductance (23–27). The extent of yield reduction varies depending on the crop type and Ece threshold (28). Many researchers have reported that most important crops for humans are sensitive to different salt concentrations, but the degree of sensitivity and tolerance varies depending on crop species and growth stage (21, 29–32). Most crops are more sensitive to salts in early growth stages (i.e., germination and seedling stages) (29).
Salt hazards are assessed using the electrical conductivity of saturated paste extract (ECe), for which crop thresholds differ (33, 34). Historically, the electrical conductivity of saturated paste extract (ECe) has been used as an index to assess soil salinity and soil health (8). It is the most accurate and recommended method for determining critical effects of soil salinity which has a direct influence on plants (35). However, most laboratories determine and report the electrical conductivity (EC) of the soil in suspensions based on different ratios of soil: water (i.e., 1:1, 1:2.5, or 1:5). The effect of dissolved salts on plant growth is determined primarily by their concentration in the soil solution at a given time (36). High salt concentrations can hinder plant growth by reducing water uptake through osmotic stress and introducing toxic ions that can damage plant tissues (20). According to Richards (8), the concentration of the soluble salts in the saturation extract is about half the concentration found in the soil solution at field capacity. Conversely, it is about a quarter of the concentration observed at the dry end of the available moisture range (8). Therefore, the salt effect on soil can be accurately measured when the soil is in a state of saturation. Electrical conductivity (EC) is influenced not only by the concentration of ions in the soil but also by the specific properties of those ions and the overall salinity chemistry (37). Different ions have different conductivities in soil, with factors such as ion type, charge, and mobility affecting EC level (38). For instance, sodium (Na+) and chloride (Cl-) ions typically contribute more to EC due to their high mobility compared to less mobile ions like calcium (Ca2+) and magnesium (Mg2+) (39, 40). Likewise, sodium chloride (NaCl) dissociates completely in solution and increasing EC, whereas salts like calcium sulphate (CaSO4) are less soluble and contribute less to EC (37, 40). In addition, the interactions between ions, soil properties like texture and organic matter, soil pH, and environmental conditions such as moisture and temperature further impact EC (40). These complexities mean that EC values reflect more than just ion concentration, highlighting the importance of using standardized measurements electrical conductivity of the soil paste extract (ECe) for accurate soil salinity assessments.
The linear relationship between ECe and EC1:2.5, has been reported in several studies with different coefficients. According to Shahid et al. (9), the correlation coefficients vary depending on the region and soil type. Ismayilov et al. (37) also reported that the proportionality coefficient of the relationship between ECe and EC varies depending on the salinity type, ion-specific concentration.
Soil texture, which refers to the proportion of sand, silt and clay particles, influences how salts are retained and move in the soil (41). Coarse-textured soils such as sandy soils have larger pore spaces, allowing for faster drainage and more effective leaching of salts from the root zone. On the other hand, fine-structured soils such as clay soils have smaller pore spaces, which leads to slower drainage and higher water retention (41). These properties cause salts to accumulate more easily in the root zone of clay soils, potentially resulting in greater salinity stress for plants (41).Some of the proposed equations for the correlation between ECe and EC1:2.5 are given in Table 1. Electrical conductivity of a saturated paste extract is a key indicator of soil salinity, which influences plant growth and development (35). However, determination of electrical conductivity using saturated paste extracts is challenging, time-consuming, and requires more skills to determine the correct soil saturation point, especially when analyzing a large number of soil samples (35). In contrast, determination of regular EC in different ratios of soil:water suspensions (i.e., 1:1, 1:2, 1:2.5, and 1:5) is much simple and time-efficient (45). However, it’s measurement affected by various factors including soil moisture, pH and temperature (41). Therefore, according to Richard (8) the standard measurement of soil salinity is ECe. For this reason, the easiest, most efficient, and cost-effective way to obtain ECe values is to focus on developing appropriate models to convert EC to ECe based soil to water ratios. According to Shahid (42) conversion factor of EC to ECe is site specific and their direct use in other areas with different soils can be cautioned. It is recommended to develop similar correlations at local conditions (42).
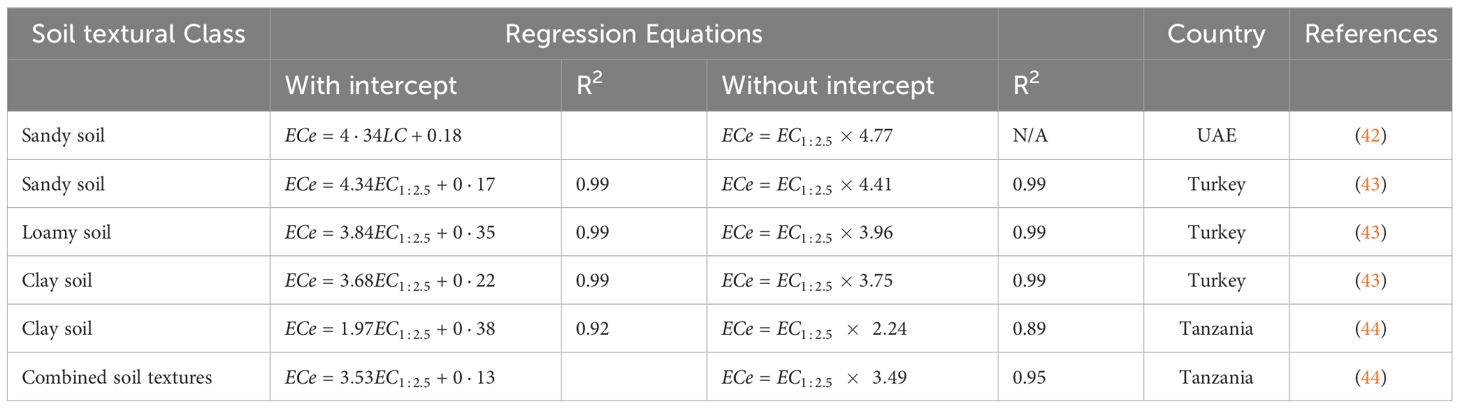
Table 1. Derived regression equations used by different studies to convert EC1:2.5 (soil:water) to ECe values.
The objective of this study is to develop and validate regression models to convert EC1:2.5 to ECe across different soil textures, facilitating easier soil salinity assessment. Our hypothesis assumed that a linear relationship exists between ECe and EC1:2.5 when a standardized method is used to determine the saturated paste extract. The regression models developed here serve several purposes: standardizing the reporting of salinity information, enabling rapid assessment and monitoring of salinity, and reducing the cost and time associated with laboratory analysis.
2 Materials and methods
2.1 Description of the study area
The study was conducted across three rice irrigation schemes, namely Mawala, Ndungu, and Uturo, strategically situated within diverse agro-ecological zones as illustrated in Figure 1. Mawala irrigation scheme lies within code (E1) on the map of agroecological zones of Tanzania (46), and corresponds to the Eastern Plateaux and Mountain Blocks. The landscape is characterized by plain to flat surfaces. While Ndugu irrigation scheme belongs to E2, it lies on the foot slope of the South Pare Mountains under Eastern Plateaux and Mountain Blocks (46). The area is characterized by alluvial/colluvial plain. Furthermore, Uturo irrigation scheme is under (Rukwa - Ruaha Rift Zone - Alluvial Flats) abbreviated by R2, in the map of agroecological zones of Tanzania (46). The landscape of the scheme is floodplains with a very gentle slope. The physiographic and climatic characteristics of the irrigation schemes are shown in Table 2.
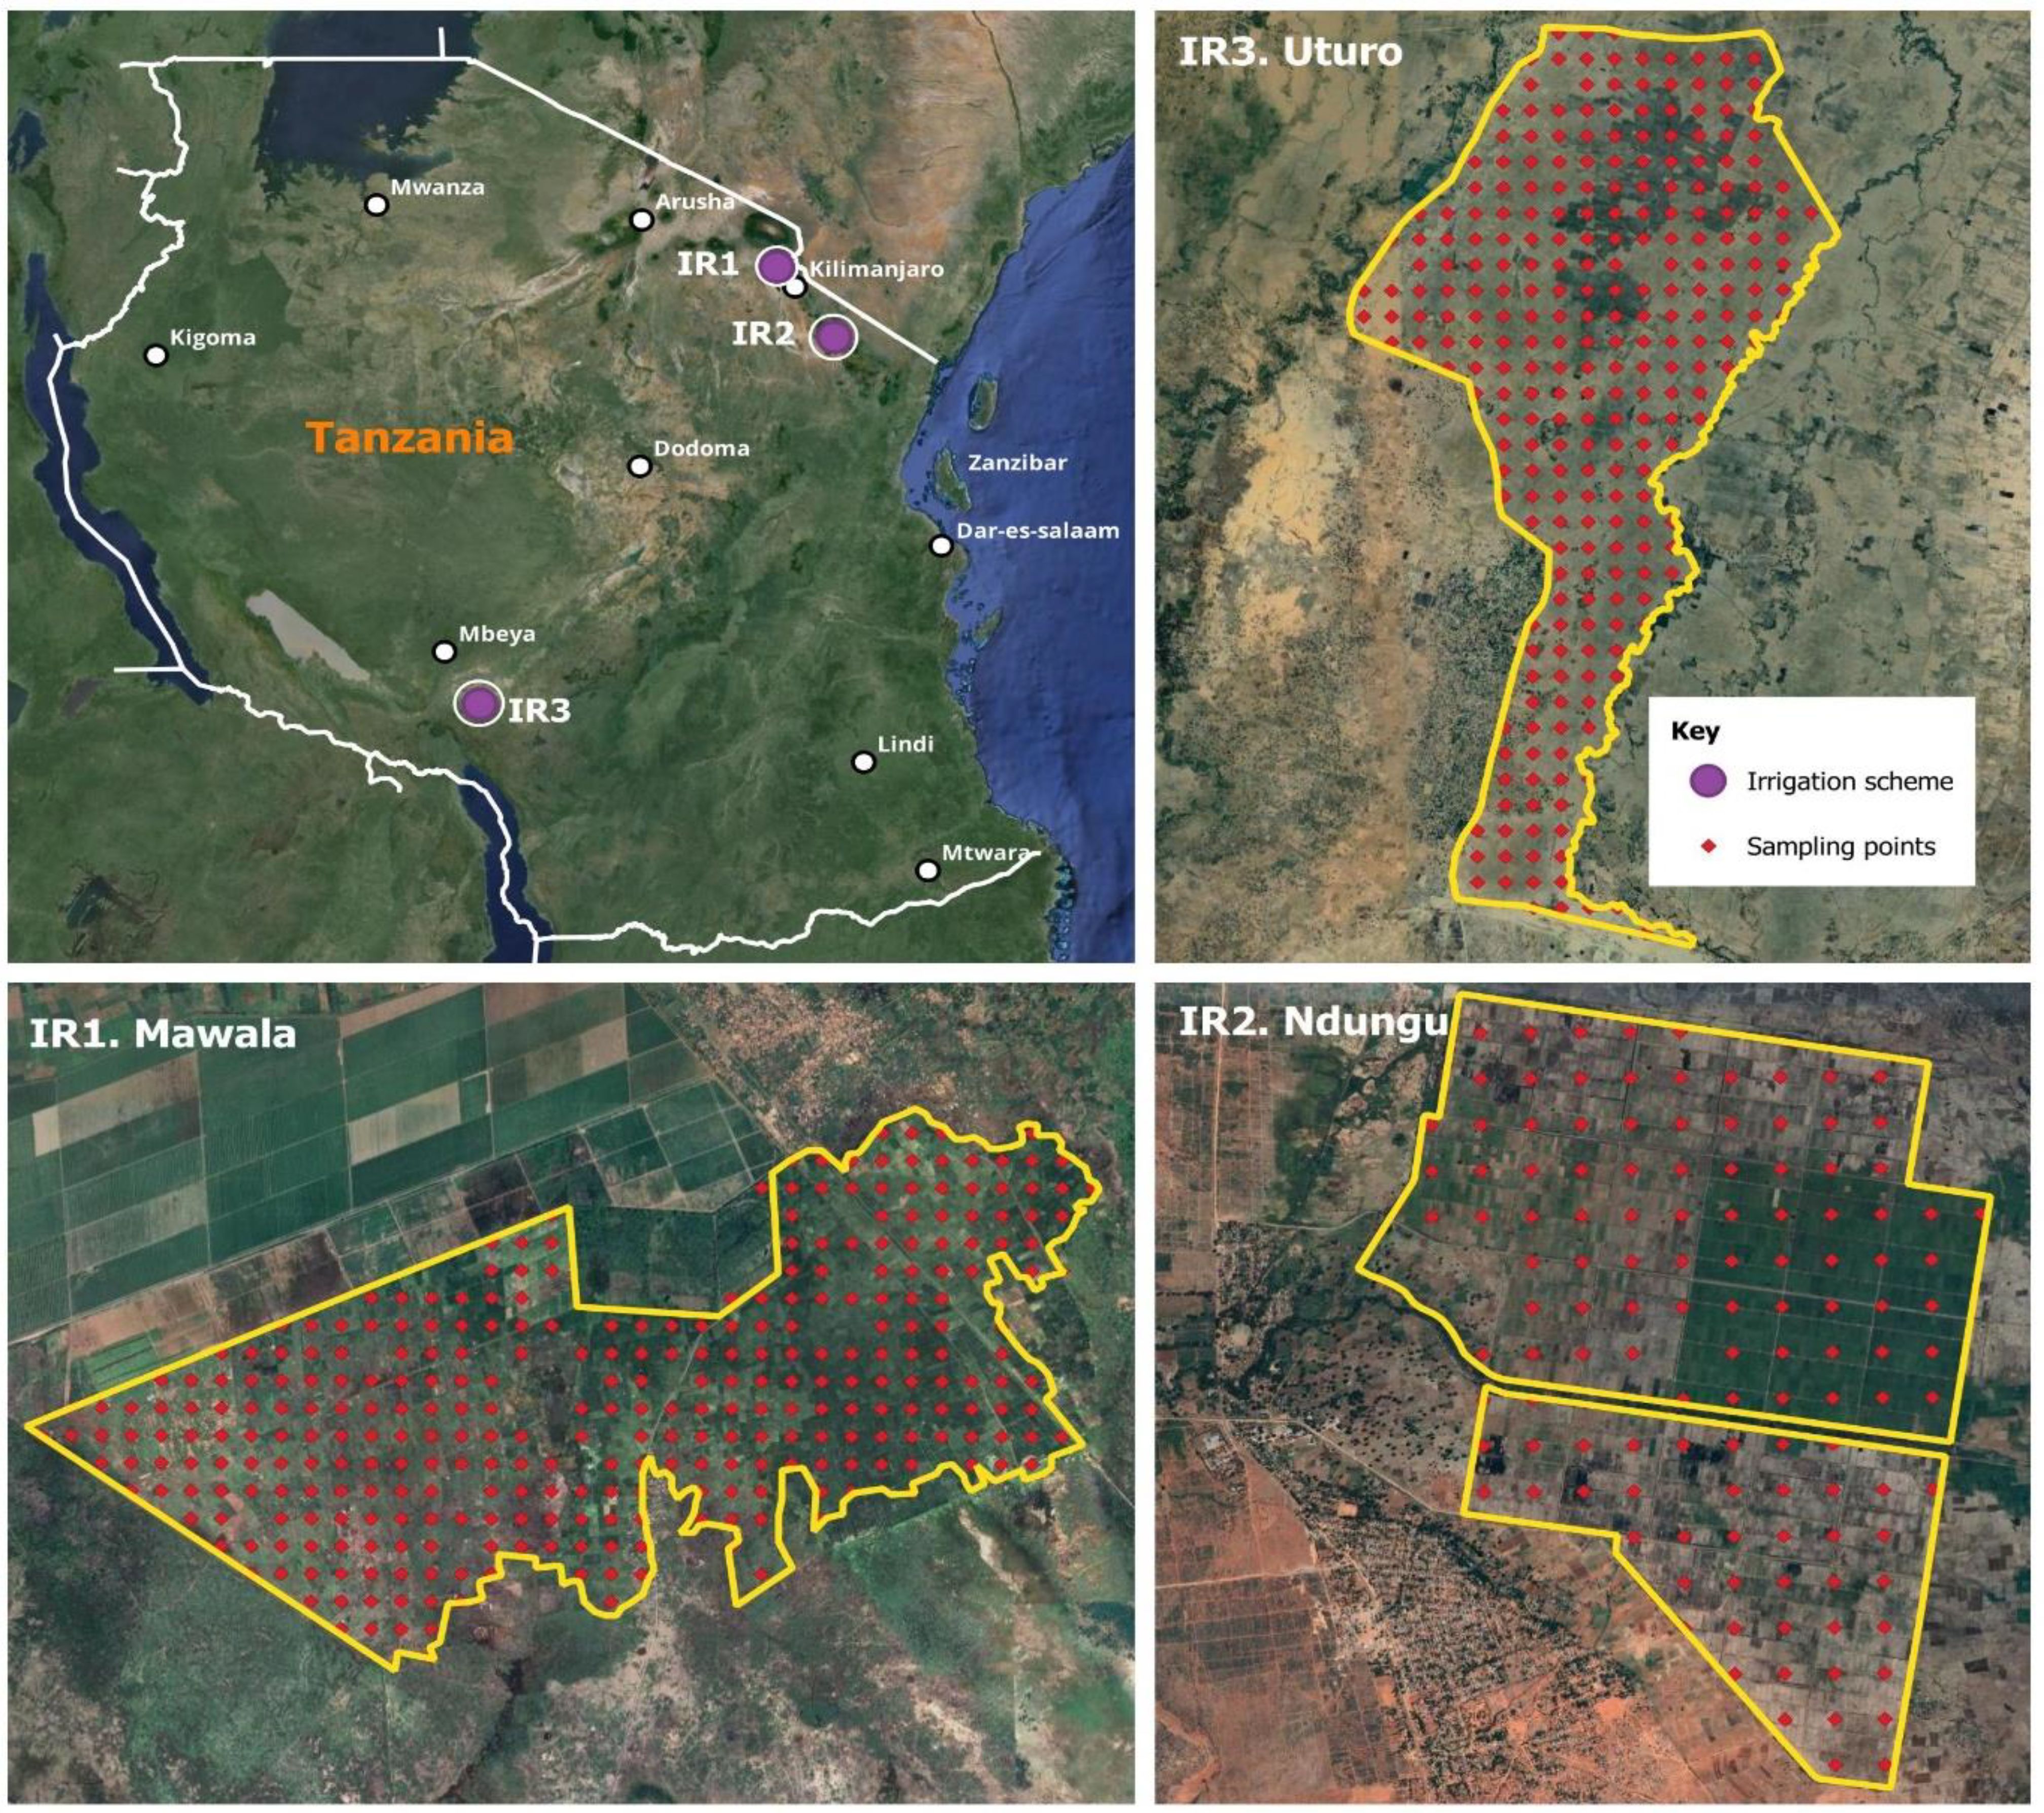
Figure 1. A map of Tanzania showing the location and distribution of sampling points in three irrigation schemes: IR1 = Mawala irrigation scheme; IR2 = Ndungu irrigation scheme; IR3 = Uturo irrigation scheme; purple dot location of irrigation scheme; red dot distribution of sampling points. This map was prepared using QGIS.
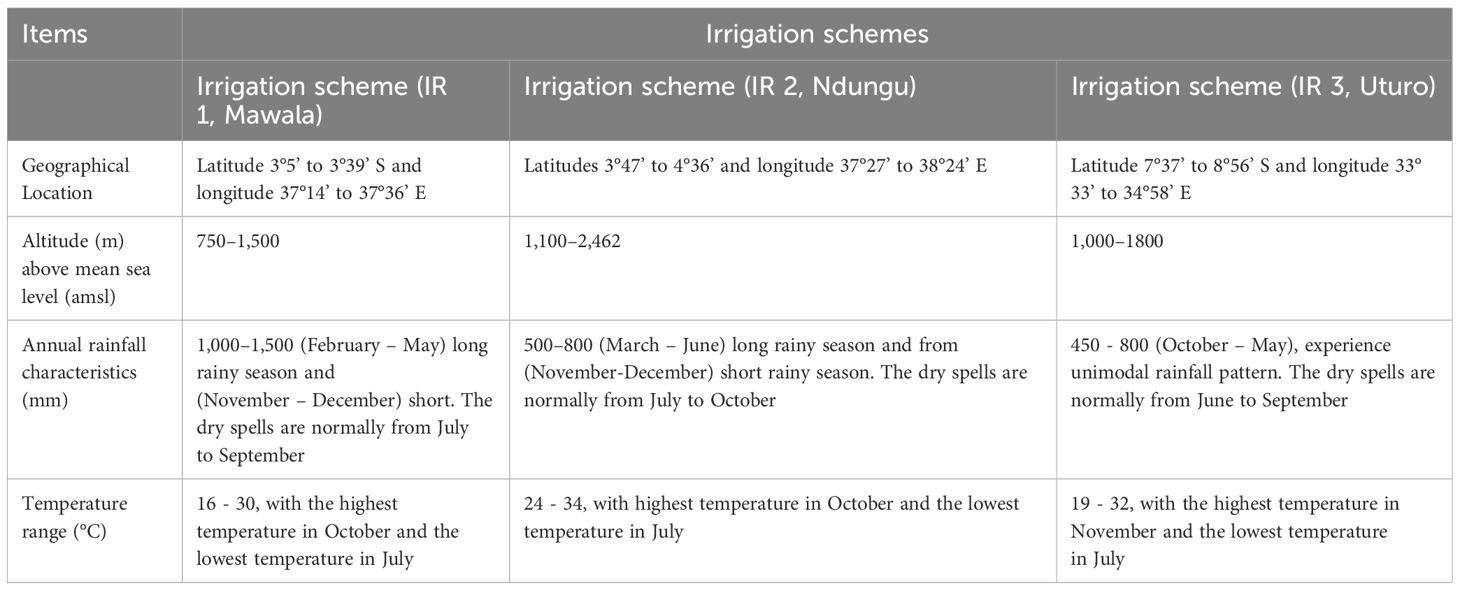
Table 2. Physiographic and climatic characteristics of the study sites (irrigation schemes).
2.2 Soil sampling procedures and analysis
A 250 m spacing grid was generated using ArcGIS 10.8 under the defined boundary for point soil sampling in each irrigation scheme (Figure 1). A total of 706 soil samples were collected at 0-30 cm depth, i.e., 317 samples from irrigation scheme (IR1), 266 samples from irrigation scheme (IR2) and 123 samples from Irrigation scheme (IR3). Given the predominantly flat nature of the studied areas, the sampling protocol ensured an adequate spatial distribution of sampling points, thereby established unique representative sites. Collected soil samples were air-dried, ground, and sieved through a 2 mm sieve, ensuring the homogeneity of the samples for precise and reliable subsequent analyses.
2.3 Electrical conductivity (EC1:2.5) soil: water ratio
10.0 g of dry soil was suspended in 25 ml of distilled water. The mixture was shaken by a mechanical shaker for 30 minutes to ensure thorough mixing, and then allowed to settle for 10 minutes. EC meter prob was inserted in a supernatant (clear liquid above the settled particles) for EC readings. The EC values were measured with an electrical conductivity meter (Model: PH 8 BENCHTOP PH METER; brand: Brand: Giorgio Bormac s.r.l) according to the method described by Mclean (47).
2.4 Determination of electrical conductivity of saturated paste extracts
Electrical conductivity of saturated paste extracts was determined following FAO guidelines (39). 200 g of dry soil sample was weighed into plastic container, and distilled water was slowly added while stirring until a saturated paste was achieved. The soil was properly mixed to form a homogeneous paste and kept for 24 hours before extraction. The extraction process was carried out with a vacuum pump using Whatman filter paper No. 42 with a diameter of 150 mm. After extraction, ECe was measured using an EC meter probe (Model: COND8 BENCHTOP CONDUCTIVITY METER; Brand: Giorgio Bormac s.r.l). Out of 706 soil samples collected, 355 were randomly selected for the determination of saturated paste extract.
2.5 Soil texture
Soil texture which is the relative proportions of sand, silt, and clay determined by hydrometer method (48). This method involves dispersing soil particles in a liquid and measuring the rate at which they settle, which varies depending on particle size. Textural classes were determined using USDA soil texture triangle (49). The similar textural classes were grouped and used to develop to develop specific regression models.
2.6 Soil salinity classification
This study adopted the salinity classification based on ECe and crop yield responses as described by (50) as shown in Table 3. This classification categorizes soils into different levels of salinity, which helps predict impacts on crop yields. Different crops have different ECe thresholds, meaning they tolerate different levels of soil salinity before yield loss occurs (51).
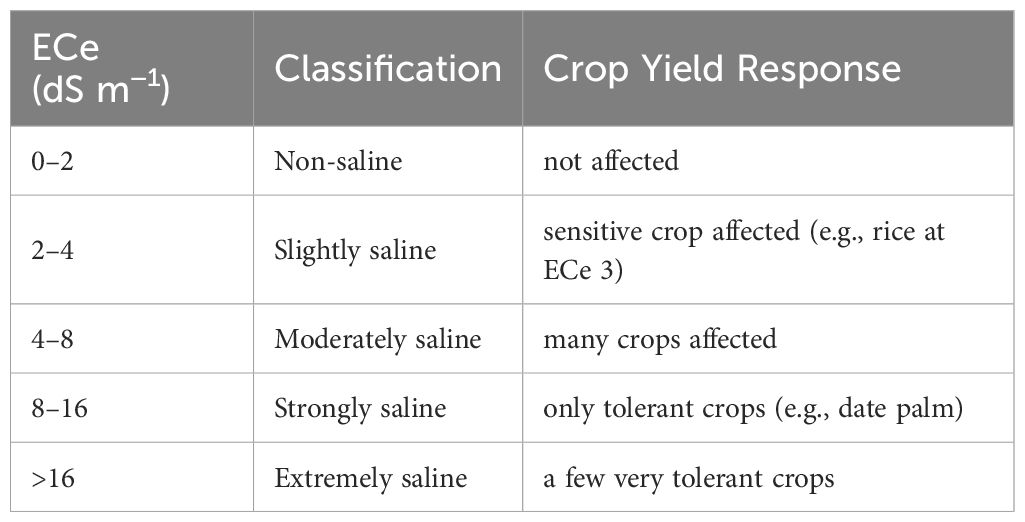
Table 3. Classification of soil salinity based on soil saturated paste extract (ECe) and their effect in crop yield response (50).
2.7 Model development, validation and comparison
Statgraphics Centurion statistical package (version 19) was used, and different regression models were applied to establish the best correlation between EC1:2.5 and ECe values. To ensure that a robust model is developed, the training and validation data sets were splits in ratios of 80:20, i.e., 80 percent of the data used for training and 20 percent for validation as suggested by Joseph (52) and Dobbin and Simon (53). Statistical parameters including the root mean square error (RMSE), mean absolute error (MAE) and coefficient of determination (R2) were used to select and validate models, ensuring accuracy and reliability. These evaluations were conducted with significance level at p-values of 0.05. Outliers were identified using studentized residual plots, with observations exceeding an absolute value of 3 flagged for further investigation. Observations that had studentized residuals exceeding an absolute value of 3 were classified as outliers, justifying further investigation on their validity, as suggested by Kargas and Londra (35). A good residual plot was characterized by a dense distribution of points in close proximity to the origin, while maintaining symmetry around the origin. Further detailed descriptions of the statistical parameters used in the model selection and validation process can be found in Table 4.
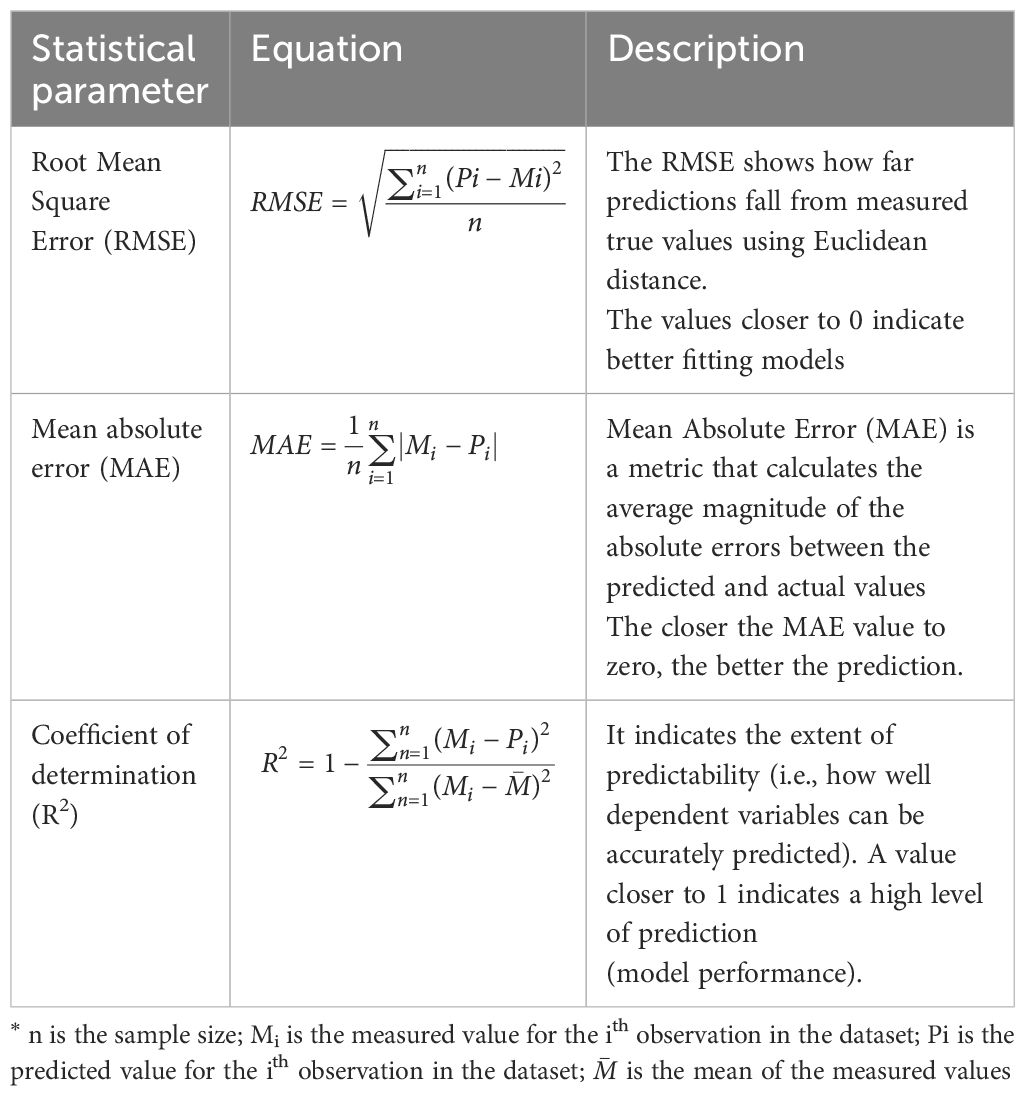
Table 4. Statistical parameters used for model selection and validation.
2.8 Statistical analysis
Descriptive statistics, including mean, standard deviation (SD), coefficient of variation (CV), range, median, minimum, maximum, skewness and kurtosis were employed to provide an overview of the salinity levels in different irrigation schemes. In addition, an assessment of the normality of the data distributions was conducted using Q-Q (Quantile-Quantile) plot in the Software Package for the Social Sciences (SPSS) version 20. Correlation analysis between ECe and EC was done followed by establishing simple liner regression models for estimation of ECe using EC as inputs in the models.
3 Results and discussion
3.1 Physical and chemical properties of the soil
3.1.1 Soil texture
Soil texture of the studied soils was dominated by clay (46.8%), followed by sandy (32.0%, and silt (21.2.0%), as shown in Table 5. Soil texture plays an important role in influencing soil salinity dynamics, and influences how salts are distributed, leached, or retained in the soil matrix (54, 55). According to Uri (56) and Gelaye et al. (57), fine-textured soils such as clay retain more water and salts, resulting in higher salinity, while coarse-textured soils like sand allow for faster drainage and leaching of salts. In addition, fine-textured soils influence capillary rise, potentially bringing salts to the surface, especially in dry regions (54). Therefore, soil textural classes influence water retention, drainage, and the movement of water and solutes within the soil profile, ultimately influencing the distribution of salts (58).
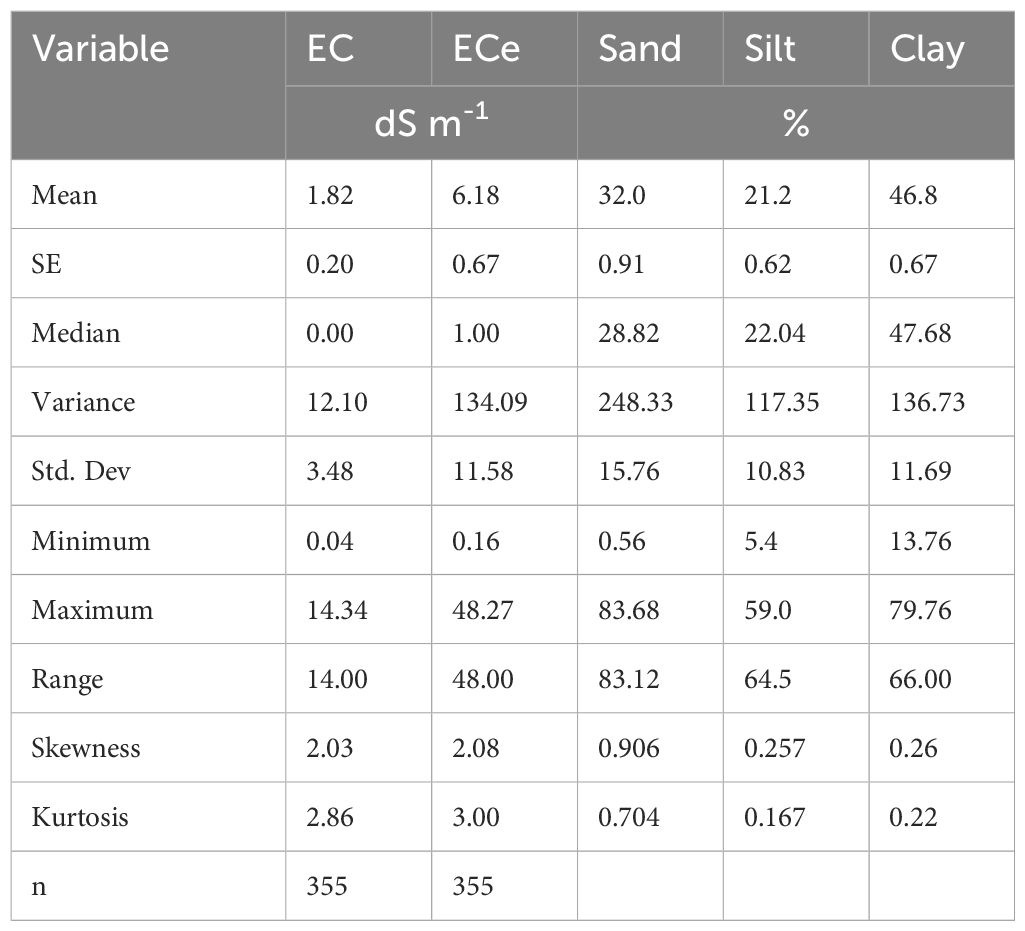
Table 5. Summary statistics of the parameters for establishing relationships between ECe and EC1:2.5.
3.1.2 Salinity indicator
The study recorded a wide range of EC and ECe values of the analysed soil samples, ranging from 0.04 to 14.34 dS m−1 and 0.16 to 48.27 dS m−1, respectively across three irrigation schemes (i.e., Mawala, Ndungu and Urturo). In Mawala irrigation scheme EC values ranged from 0.02 to 15.27 dS m−1 and 0.06 to 48.27 dS m−1 for ECe. Ndungu irrigation scheme, the EC values ranging from 0.01 to 12.25 dS m−1 for EC and 0.04 to 39.27 for ECe, while Uturo irrigation scheme the values ranging from 0.02 to 1.2.27 dS m−1 for EC and 0.06 to 2.7.87 dS m−1 for ECe. Based on the classification by Richards (1954), 68.7% of the soil analyzed had low ECe values, ranging from 0 to 2 dS m−1, indicating that these were non-saline (normal soils). On the other hand, 7.6% had ECe values in the range of 2 to 4 dS m−1 indicating that these were slightly saline, and 4.2% fell into the moderately saline salinity category, with ECe values ranging between 4 and 8 dS m−1. Notably, 5.6% showed elevated ECe values ranging from 8 -16 dS m−1, and the remaining 13.8% had ECe values exceeding 16 dS m−1 indicating that these were extremely saline.
Based on the results, the existence of ECe values above 4 dS m-1 indicates a substantial rice yield loss in the studied irrigation schemes since rice cannot tolerate such high salinity levels. According to Solis et al. (59), rice is a relatively very salt-sensitive crop, where an ECe threshold (3 dS m−1) can lead to yield losses (60). Furthermore, grain quality is also severely above the threshold of 8 dS m-1 (61, 62). According to Bundó et al. (63) rice is more tolerant to salt stress during germination and vegetative stages than during seedling and reproductive phases. Linh et al. (64) reported yield loss of 12% in rice at a salinity of ECe of 3 dSm−1, and yield loss of about a 50% was recorded at a salinity of ECe value of 6 dSm−1.
3.2 The relationship between ECe and EC1:2.5 under different soil texture
The correlation analyses were carried out for different soil textures, as shown in Figures 2–4, to determine conversion factors between two measures of electrical conductivity: EC1:2.5 and ECe. The results showed a strongly linear relationship between ECe and EC1:2.5 across different soil texture with R2 value above 0.95. RMSE values are low (1.4 < RMSE) and MAE values were similar low (0.85 < MAE). Despite the consistent linearity, the coefficient of the regression models varied depending on soil texture class. These results have similar trend with reported previous research findings on the same soil water ration other researchers (43, 65, 66), which also found linear relationships between saturated paste extracts and soil-water ratios (1:2.5). Notably, Research by Isdory, et al. (44) conducted in a relative environment observed a comparable linear relationship, especially combined textural model, although with slight variations in conversion factor. However, high difference of the coefficient was observed in clay regression equation Table 1. It is important to note the differences observed in the conversion factors derived in this study if compared with those reported by other researchers at the same soil water dilution ratio of (1:2.5) may attributed with several factors. These factors include the clay content and type clay mineral of soil samples (42, 43), which affect water retention and ion exchange properties of the soil, type of salts present (8, 67), gypsum and calcium carbonates (8), chemical composition of the soil solution, as well as the equilibration time and the preparation and extraction process determination (68), and percentage variations of sand and clay content in the soil (42, 67). Another factor that likely influenced differences between the models is ECe range of soil samples used to develop the conversion equations (66). However, it is important to note that the quality of the filter paper material used to extract the saturated paste is crucial. The consistency of the developed models, which closely matches findings from different studies, increases the reliability of the linear relationship between ECe and EC1:2.5 across different soil textures. On the other hand, a regression equation of loam soil was developed, which had not been previously reported. This finding provides new insights to the field, as illustrated in (Figure 4, E1). Table 6, it summarizes the developed models in this study and their performance using key statistical parameters R2, RMSE and MAE.
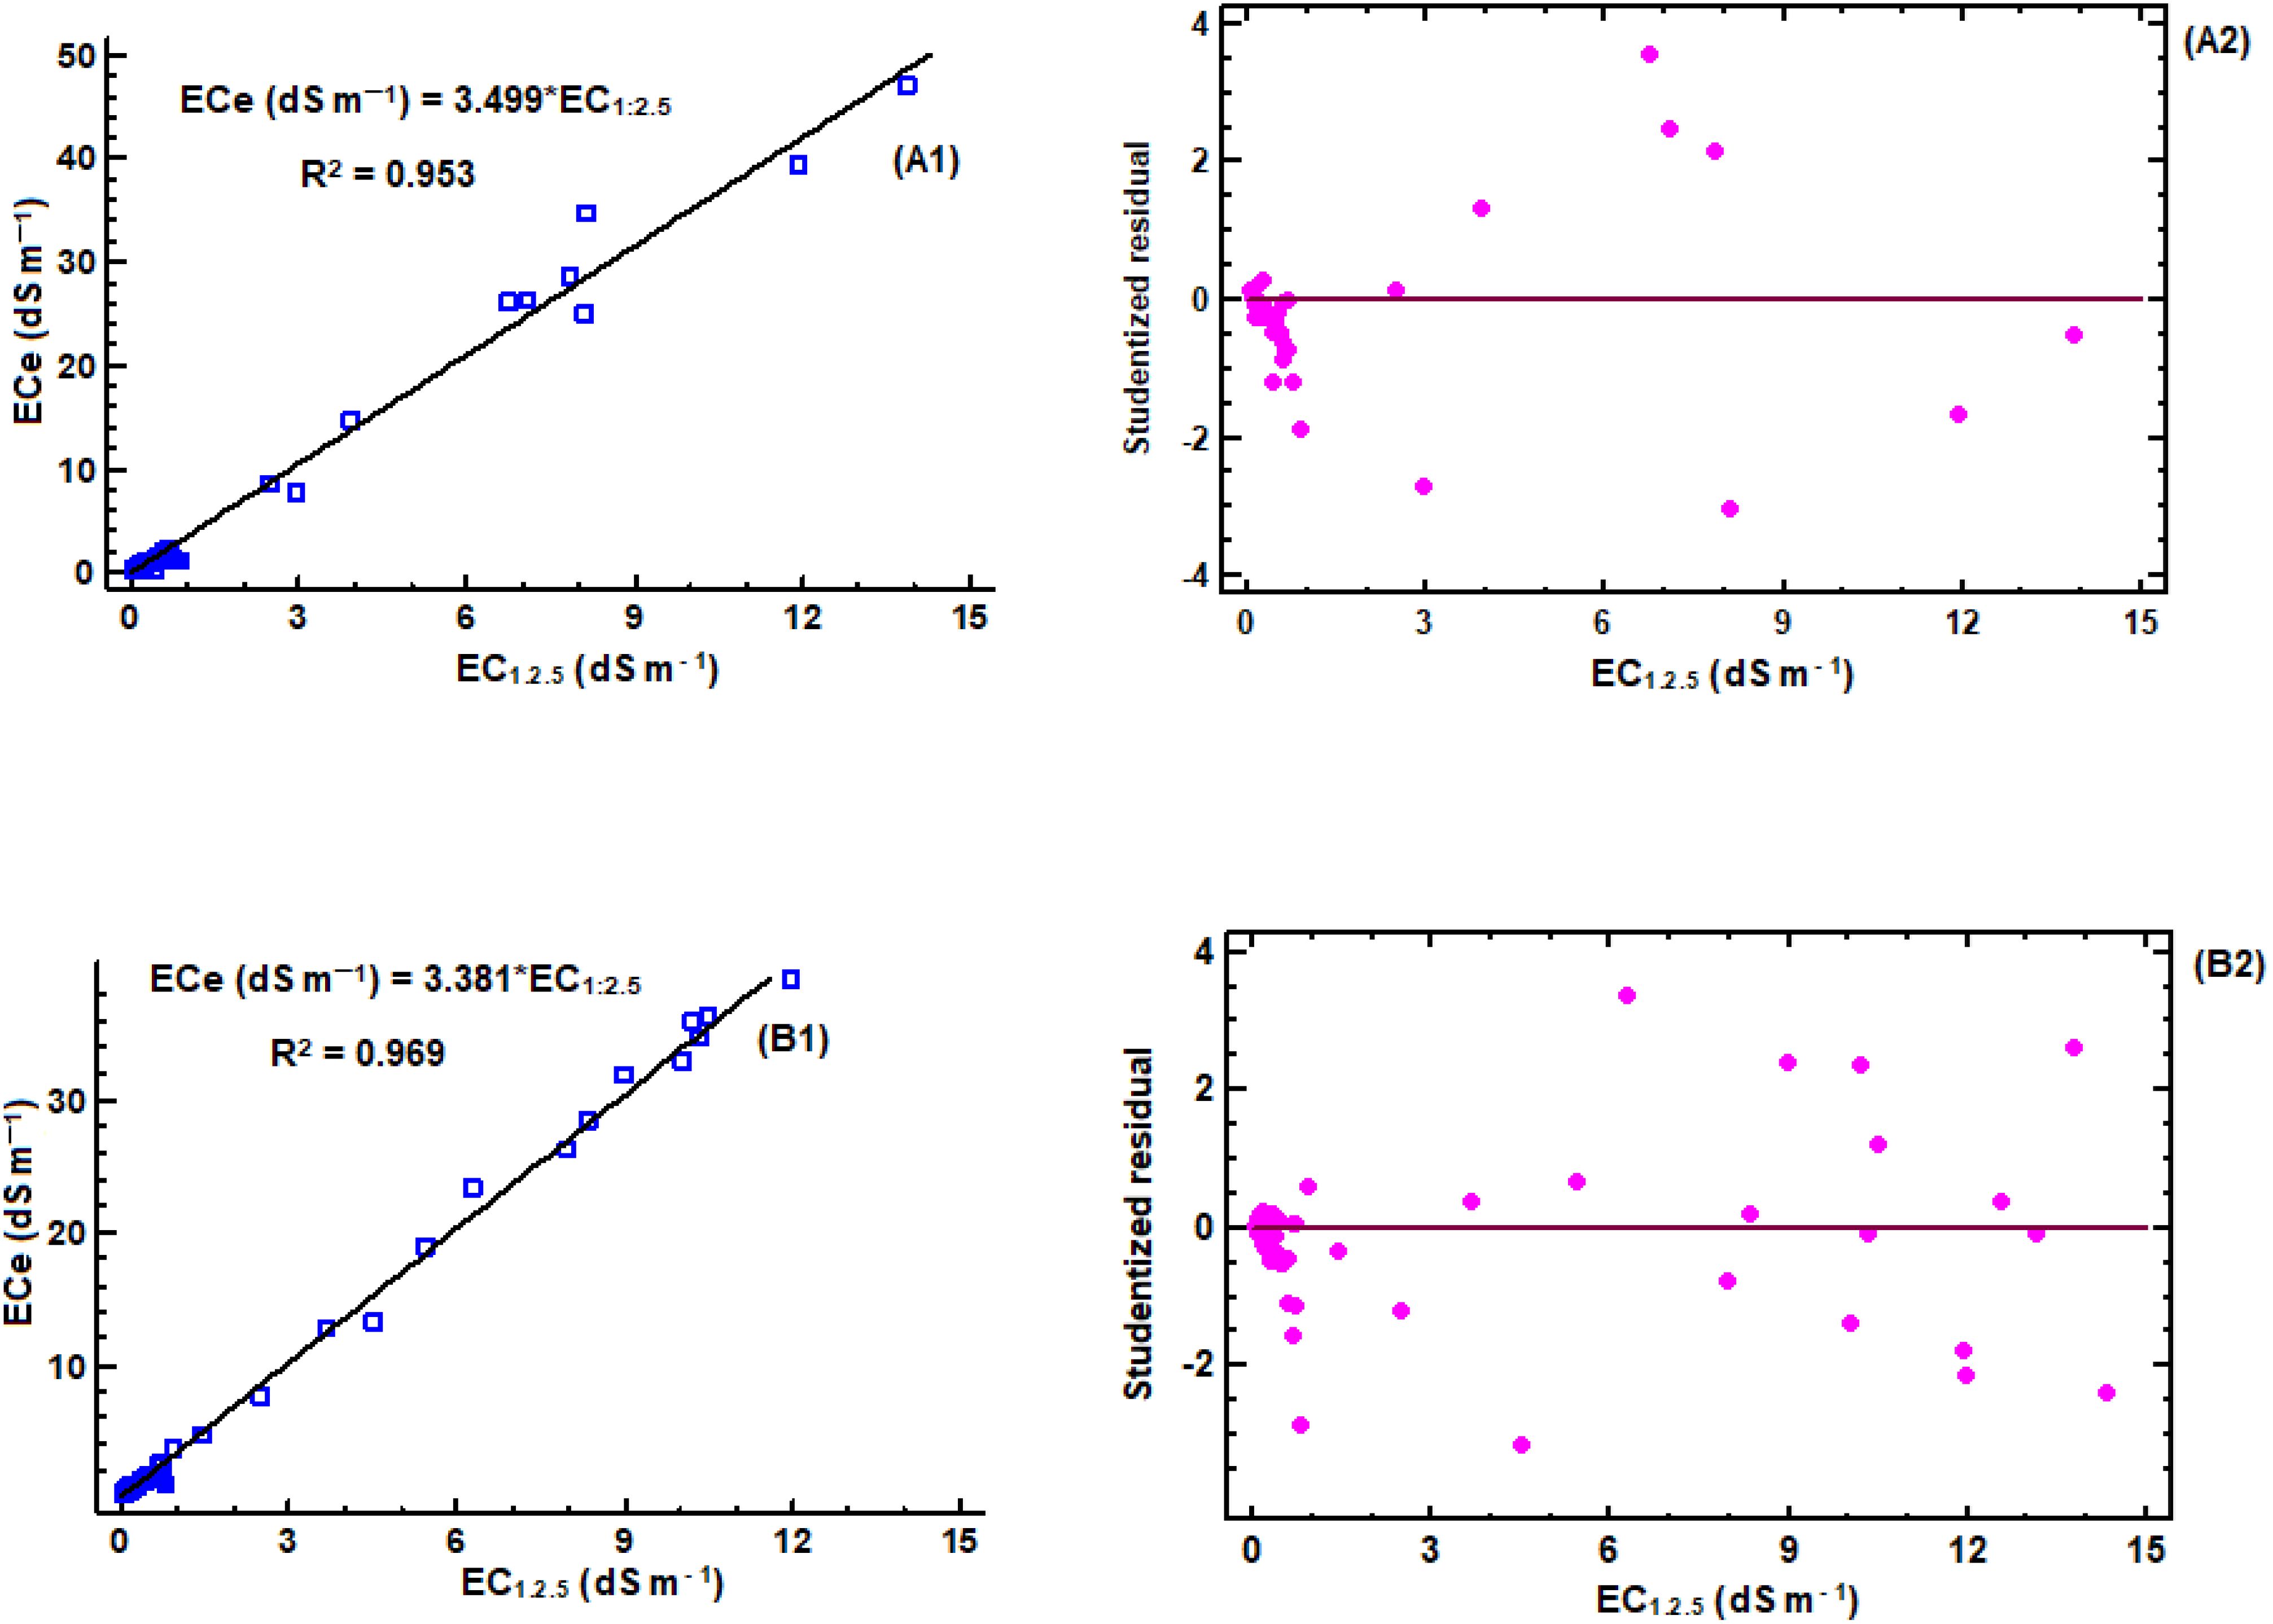
Figure 2. Linear regression models for estimation of ECe to EC1:2.5: (A1) regression equation for sandy clay soil (n = 59), (A2) corresponding studentized residual plot; (B1) regression equation for sand clay loam soil (n = 83), (B2) corresponding studentized residual plot.
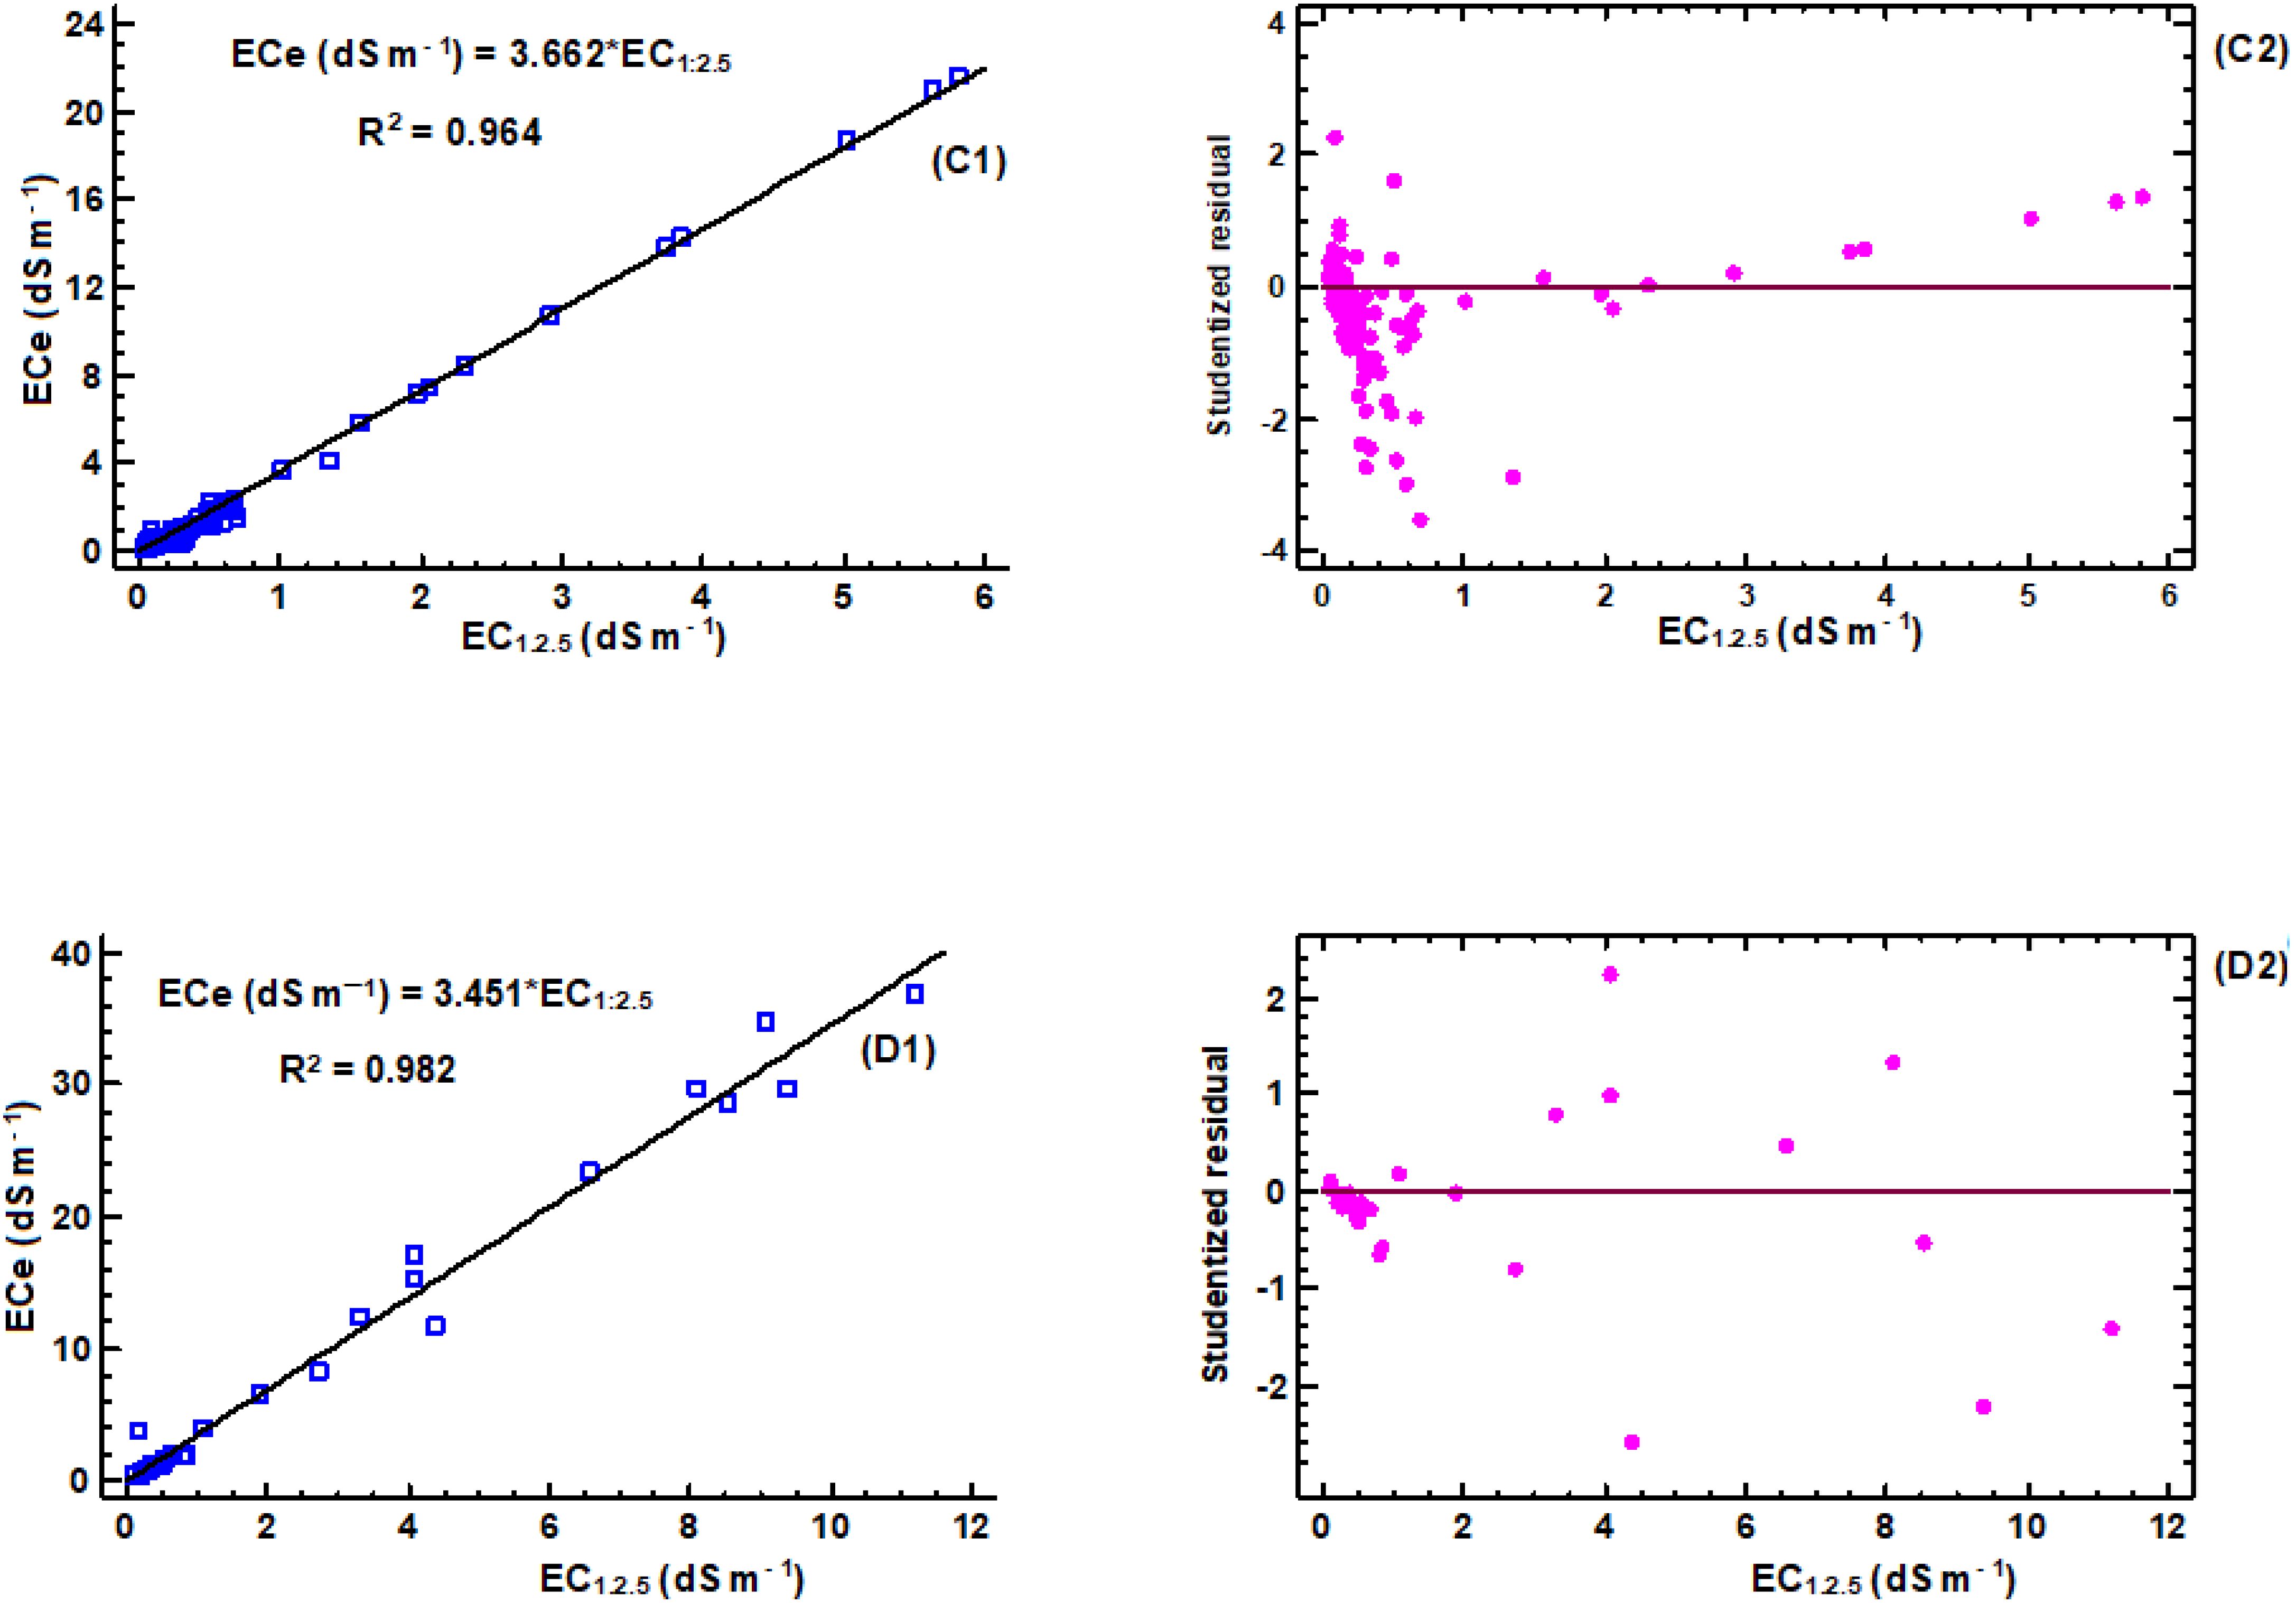
Figure 3. Linear regression models for estimation of ECe to EC1:2.5: (C1) regression equation for clay soil (n = 140), (C2) corresponding studentized residual plot; (D1) regression equation for clay loam soil (n = 41), (D2) corresponding studentized residual plot.
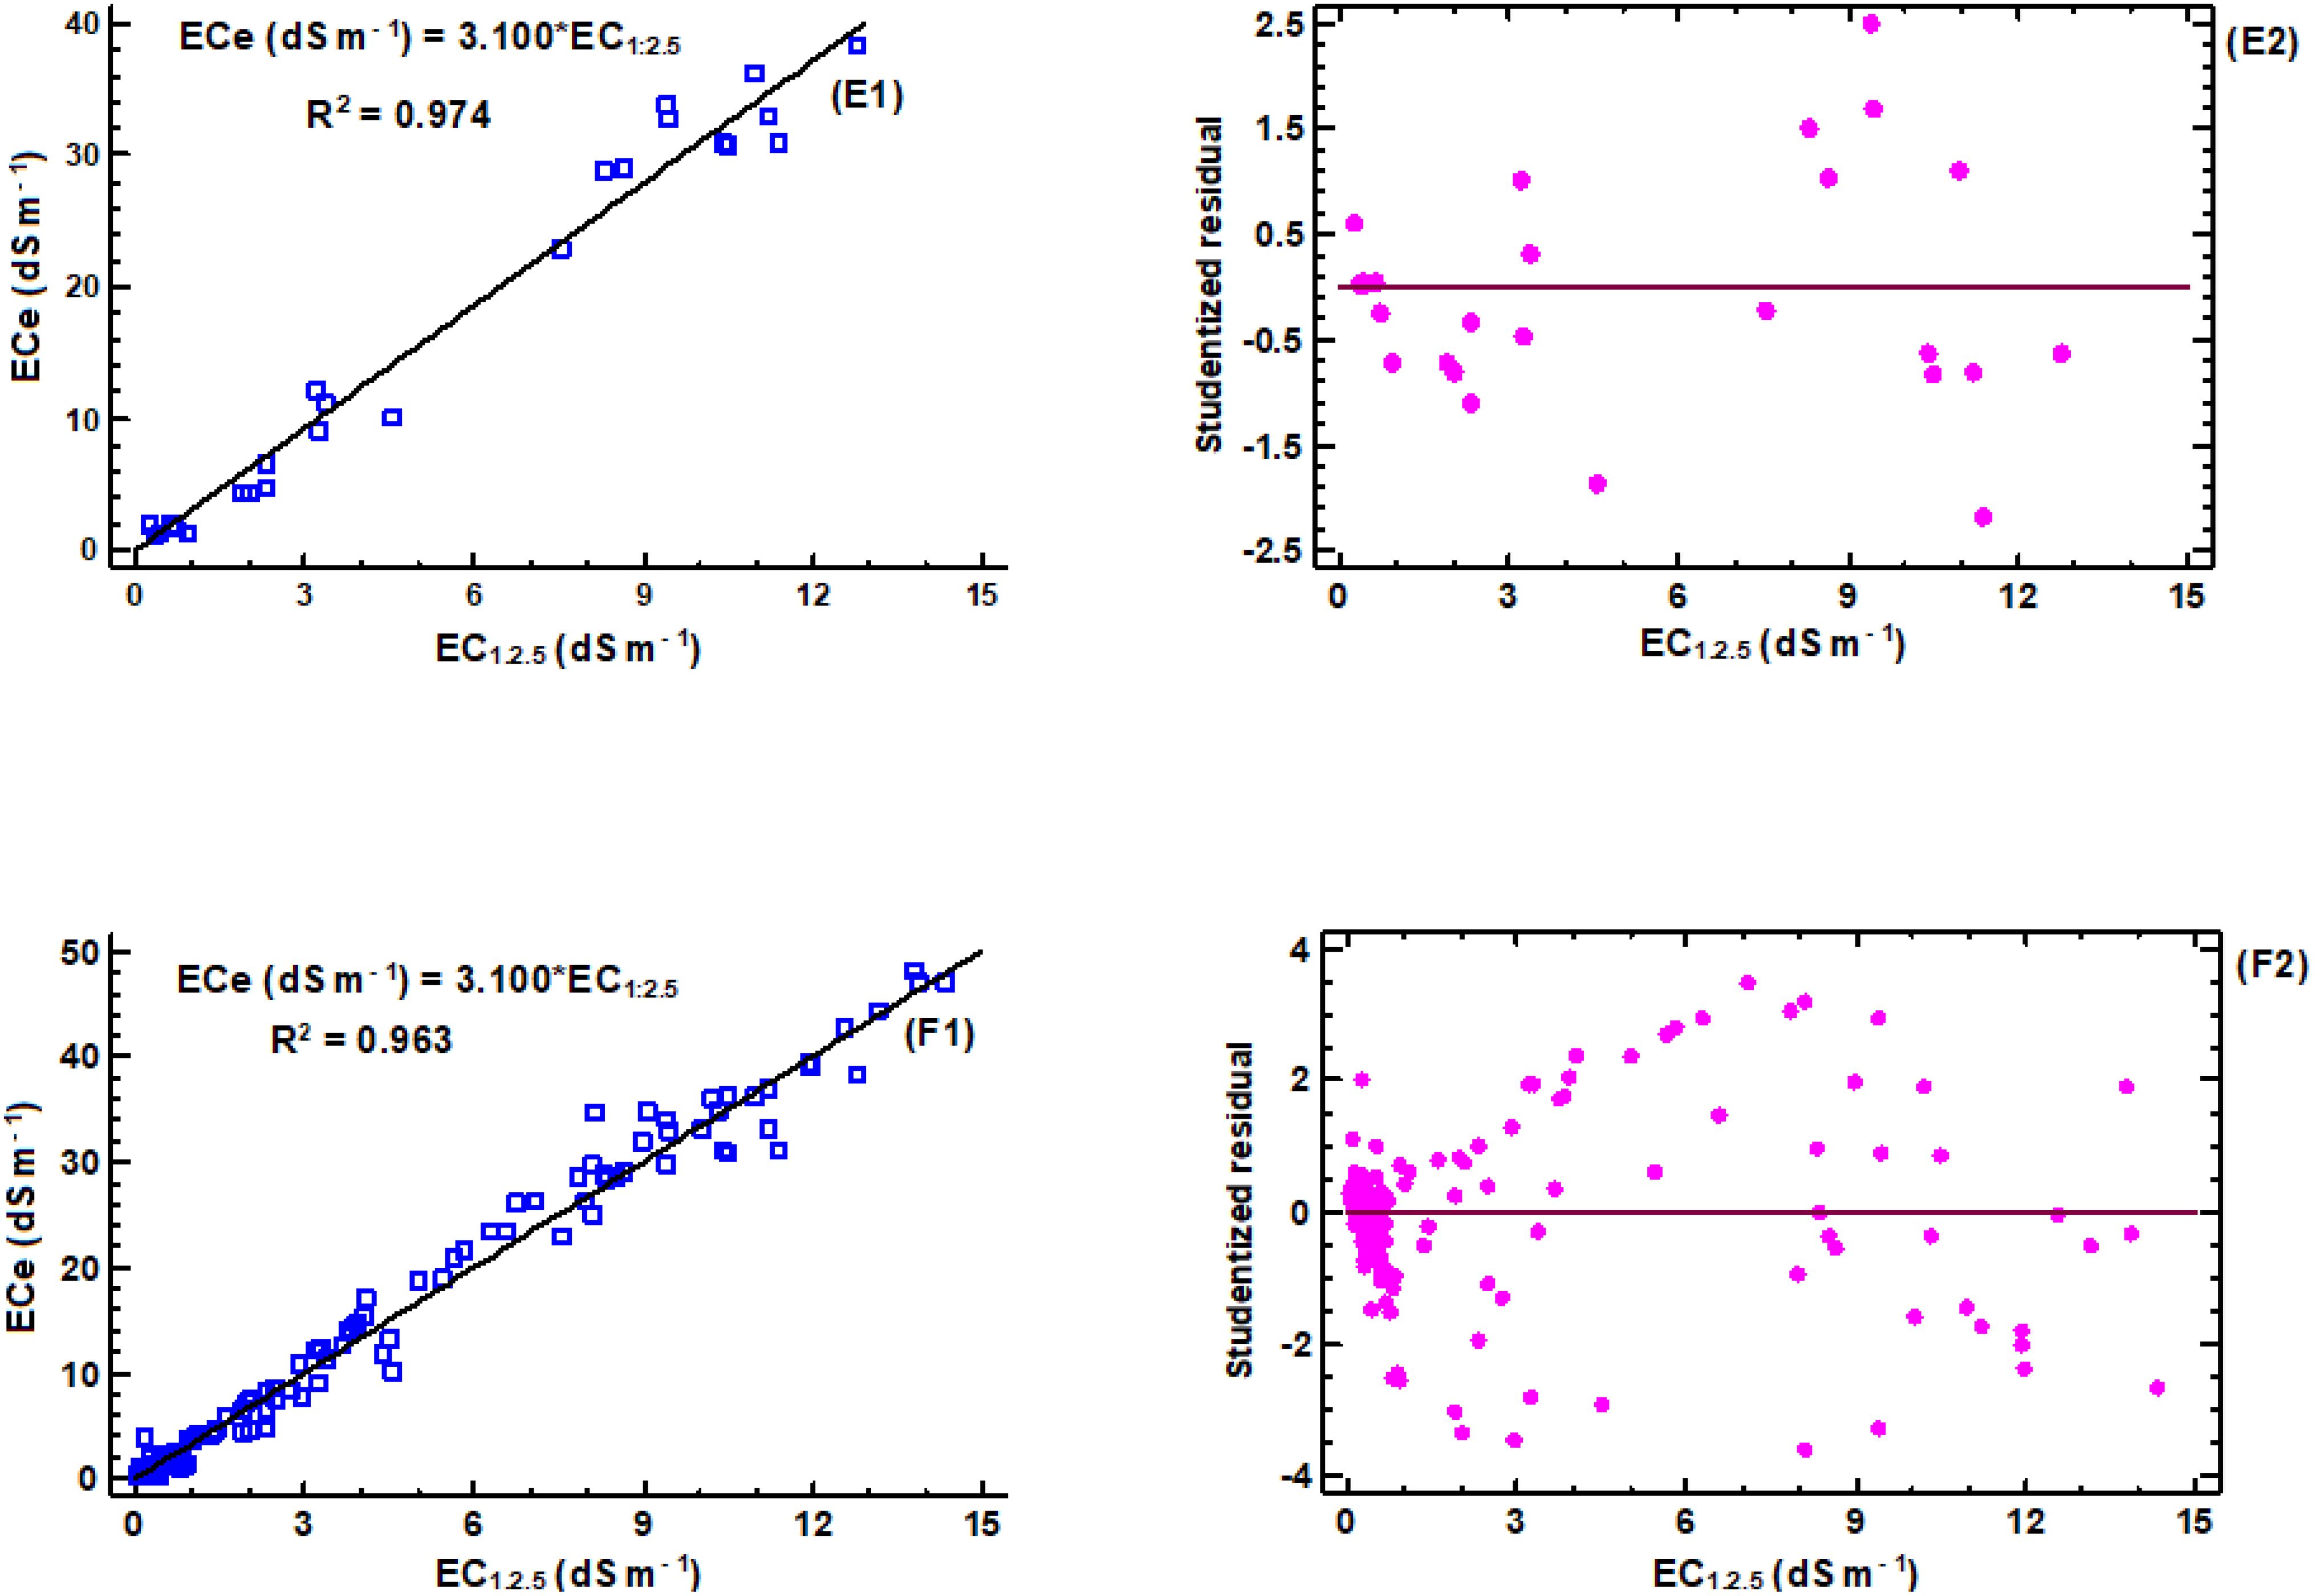
Figure 4. Linear regression models for estimation of ECe to EC1:2.5: (E1) regression equation for loam soil (n = 32), (E2) corresponding studentized residual plot; (F1) regression equation for combined textural classes (n = 355), (F2) corresponding studentized residual plot.
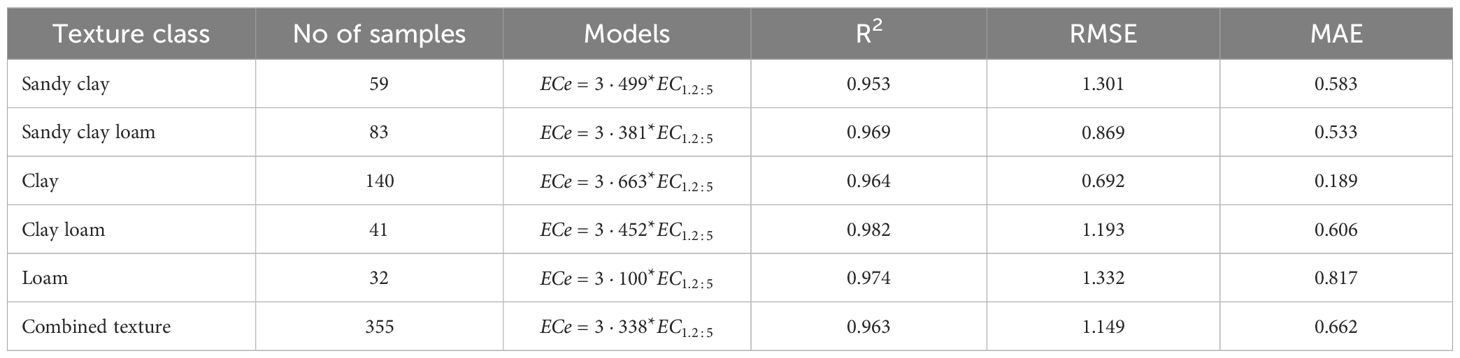
Table 6. Summarized statistics of accuracy and uncertainty of the developed models.
In coarse-textured soils, such as sandy soils, the conversion factor used to estimate ECe from EC1:2.5 measurements tend to have a higher value compared with fine-textured soils like clay soils (43, 69). This is due to the lower water retention and lower cation exchange capacity (CEC) of sandy soils, which result in salts being more easily leached and less tightly bound to soil particles. However, this condition may vary depending on chemical composition of the soil solution as well gypsum and calcium carbonates (8).
3.3 Model accuracy and uncertainty evaluation
Table 6 presents developed models for estimating ECe from EC1:2.5 soil water ratio in different soil textural classes. The proportionality ratio of 80:20 for training and validation gave the best fit to the developed regression equations. The validation used independent soil samples that were distinct from those used in creating the regression equations. Across different textural classes, generally, the models had high R2 values ranging from 0.953 to 0.982, indicating goodness of fit. The relatively low error metrics of both RMSE and MAE indicate that the models are highly reliable for predicting ECe from EC1:2.5. Interestingly, both individual and combined models provide the best ECe prediction from EC1:2.5, as shown by their error metrics. However, the accuracy of these predictions is likely to improve when models with specific soil texture classes are used. Figure 5 illustrates the relationship between measured and predicted values of soil saturation ECe using a combined model that includes all soil texture classes. The conversion factor of the validation models is approximately 1, indicating a strong linear correlation between the measured and predicted values. According to Zhang et al. (2005), if predicted values of ECe were exactly the same as measured ECe values, the slope would be equal to 1.0, and R2 would equal 1.0.
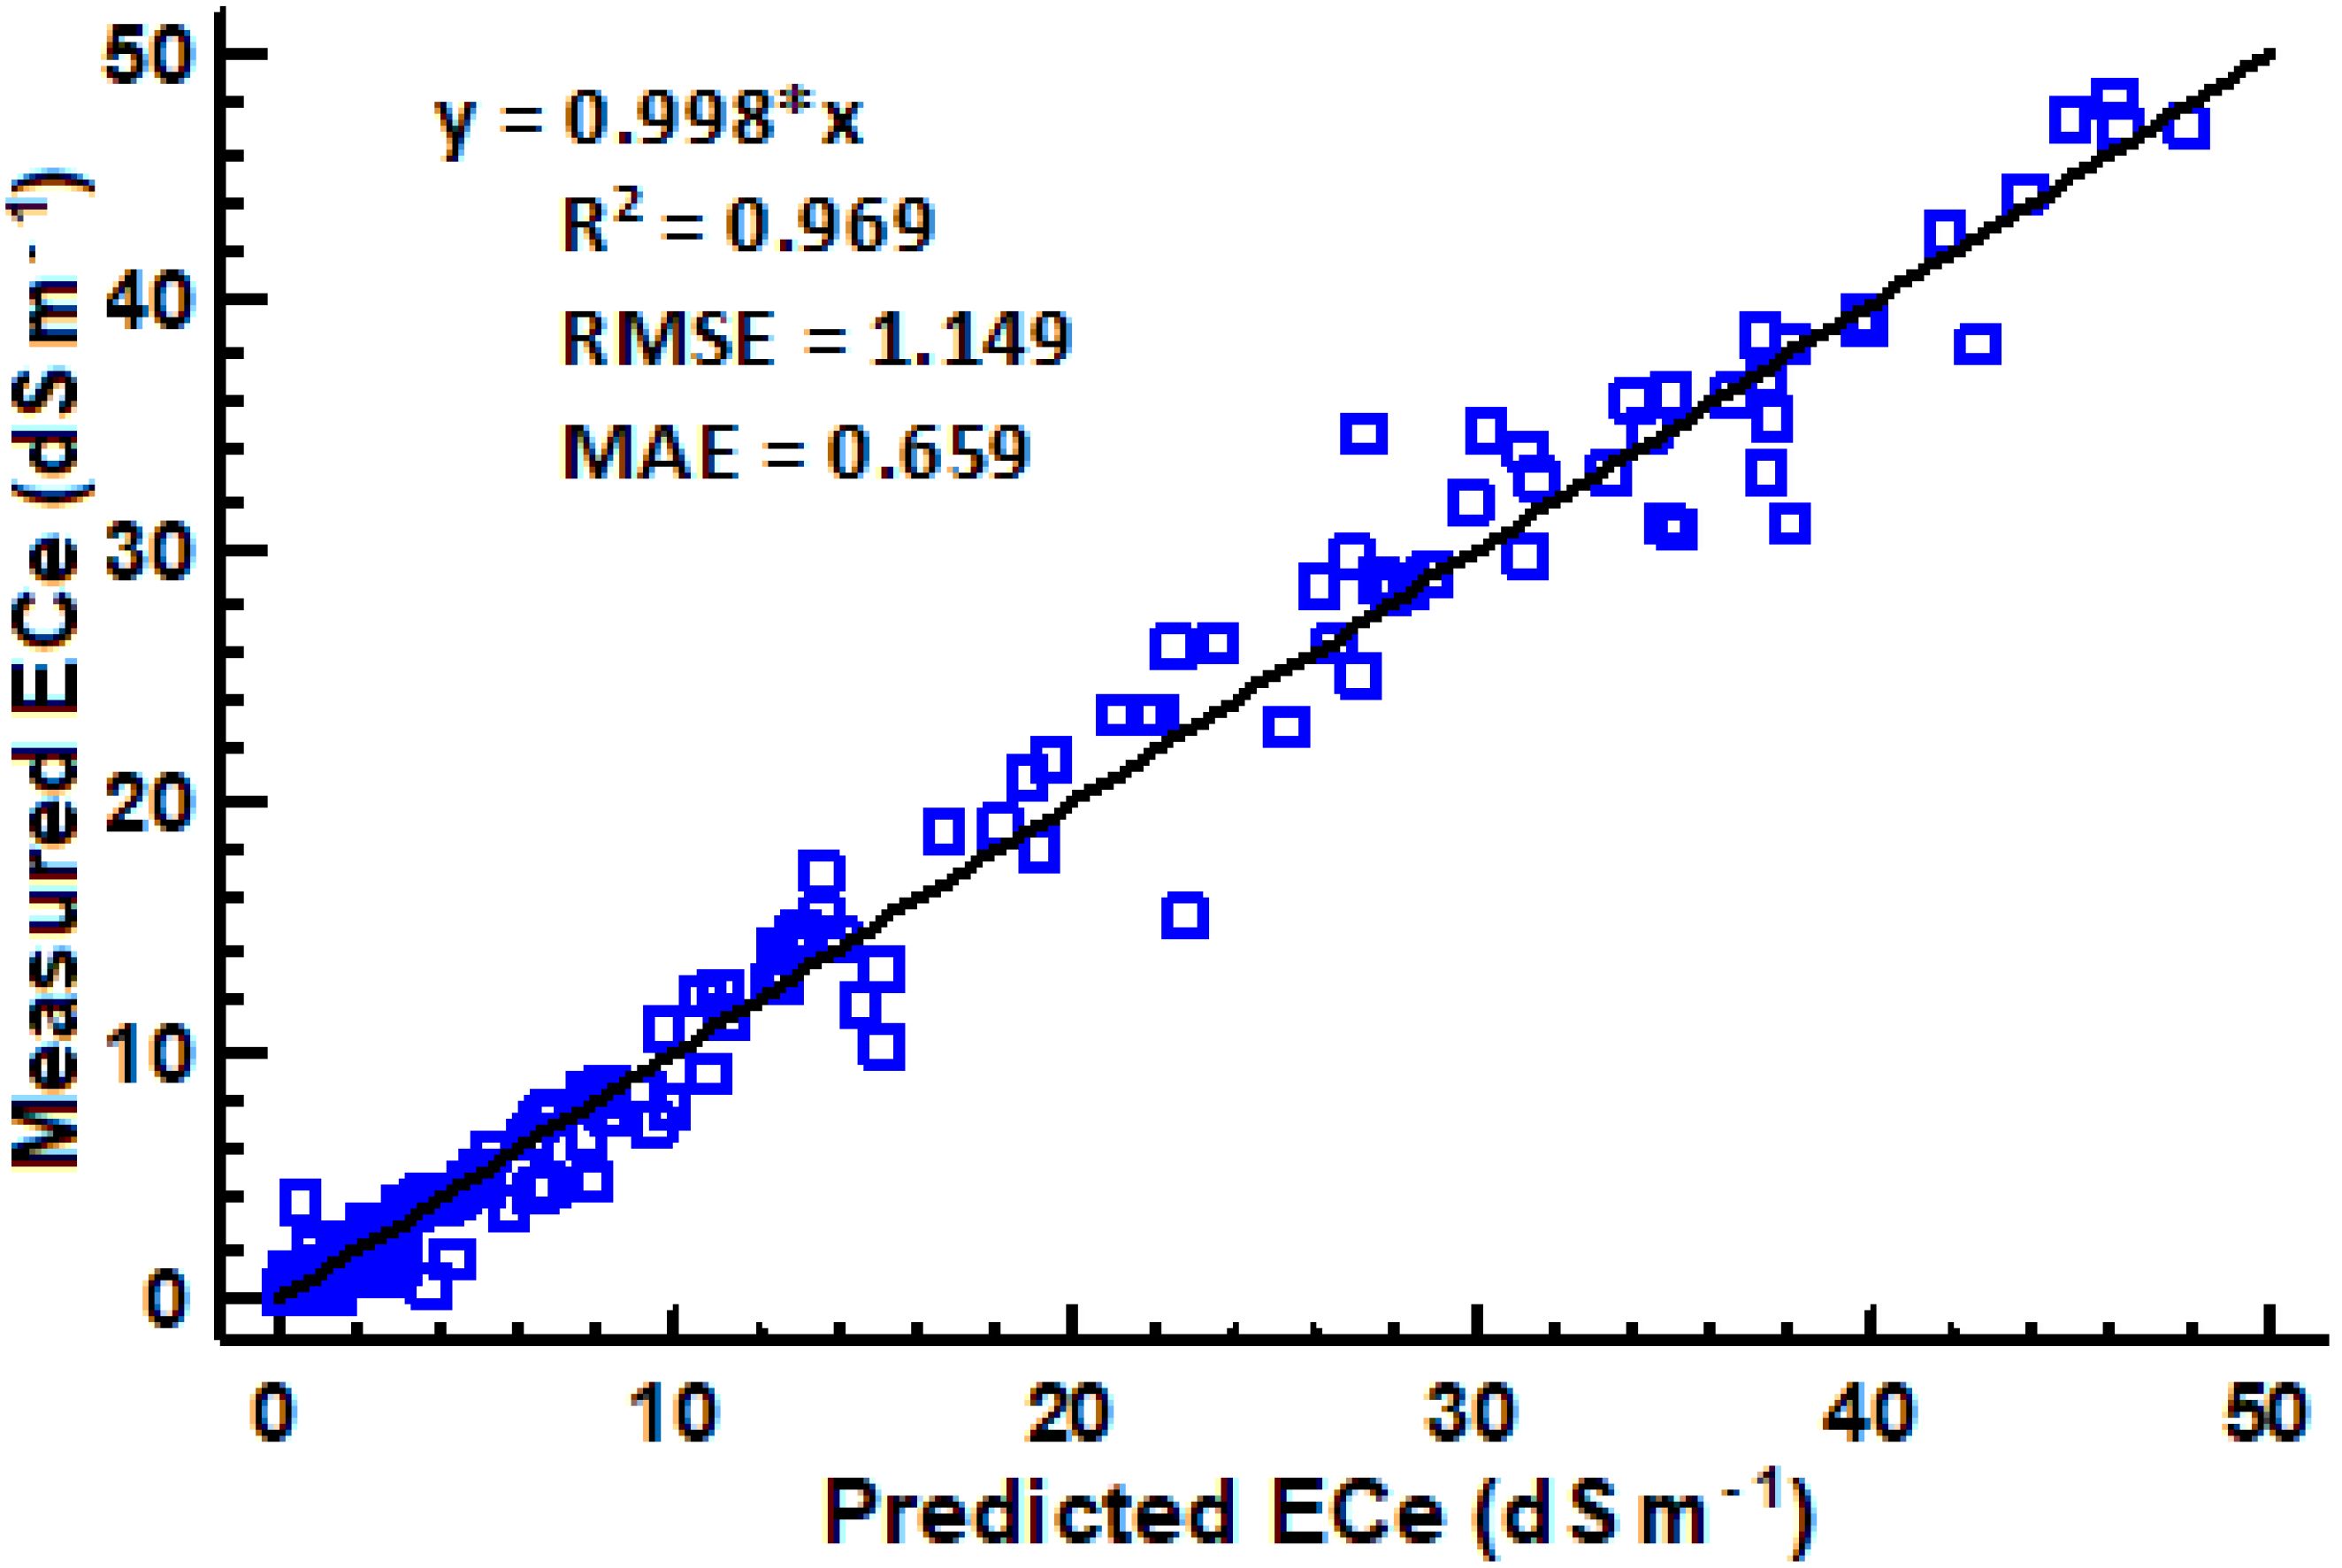
Figure 5. Relationship between measured and predicted ECe using a combined regression equation (n = 355).
4 Conclusions
The study derived the regression models for the estimation of ECe from the EC of the soil water ratio (1:2.5) under different soil textural classes. The results showed a strong relationship between ECe and EC of the developed models, with higher coefficients of determination (R2) ranged from (0.953 to 0.982), and lower values of RMSE and MAE. This indicates that the models have a high level of precision in predicting ECe from the EC1:2.5 water dilution ratio. Interestingly, the results also showed a high linear correlation between measured and predicted values tested in the combined linear regression model. Determining soil salinity using the electrical conductivity of saturated paste extracts is a standard method, but it is challenging due to the extraction time requirement and the need for more specialized skills often not offered by most soil testing laboratories. Therefore, the regression models developed in this study can help in i) standardizing the reporting of salinity information, ii) rapid assessment and monitoring of salinity, and iii) minimizing the cost and time spent on laboratory work. Therefore, this study concludes that established models can serve as useful tools to predict ECe values from EC measured in 1:2.5 dilutions, and when the soil textural class is known, using a specific soil texture conversion factor can increase the accuracy of the ECe prediction. The study recommends the use of a combined regression model for unknown soil textural classes. Further research should validate these models in other regions and soil types to enhance their generalizability and accuracy.
Data availability statement
The raw data supporting the conclusions of this article will be made available by the authors, without undue reservation.
Author contributions
MO: Conceptualization, Data curation, Formal Analysis, Investigation, Methodology, Validation, Writing – original draft, Writing – review & editing. MS: Writing – review & editing. BM: Writing – review & editing. OP: Writing – review & editing. JM: Writing – review & editing. KF: Writing – review & editing.
Funding
The author(s) declare that financial support was received for the research, authorship, and/or publication of this article. The authors gratefully acknowledge the Climate Smart Flood and Salinity Tolerant Africa Rice Project, funded by DANIDA through Grant No.19-03-KU, for financial Support.
Conflict of interest
The authors declare that the research was conducted in the absence of any commercial or financial relationships that could be construed as a potential conflict of interest.
Publisher’s note
All claims expressed in this article are solely those of the authors and do not necessarily represent those of their affiliated organizations, or those of the publisher, the editors and the reviewers. Any product that may be evaluated in this article, or claim that may be made by its manufacturer, is not guaranteed or endorsed by the publisher.
References
1. Kumar P, Sharma PK. Soil salinity and food security in India. Front Sustain Food Syst. (2020) 4:533781. doi: 10.3389/fsufs.2020.533781
2. Sunita K, Mishra I, Mishra J, Prakash J, Arora NK. Secondary metabolites from halotolerant plant growth promoting rhizobacteria for ameliorating salinity stress in plants. Front Microbiol. (2020) 11:567768. doi: 10.3389/fmicb.2020.567768
3. Mukhopadhyay R, Sarkar B, Jat HS, Sharma PC, Bolan NS. Soil salinity under climate change: Challenges for sustainable agriculture and food security. J Environ Manage. (2021) 280:14. doi: 10.1016/j.jenvman.2020.111736
4. Butcher K, Wick AF, Desutter T, Chatterjee A, Harmon J. Soil salinity: A threat to global food security. Agron J. (2016) 108:2189–200. doi: 10.2134/agronj2016.06.0368
5. Wen W, Timmermans J, Chen Q, van Bodegom PM. A review of remote sensing challenges for food security with respect to salinity and drought threats. Remote Sens (Basel). (2021) 13:1–14. doi: 10.3390/rs13010006
6. Mohanavelu A, Naganna SR. Irrigation induced salinity and sodicity hazards on soil and groundwater: an overview of its causes, impacts and mitigation strategies. Agriculture. (2021) 11:1–17. doi: 10.3390/agriculture
7. Sheoran P, Kumar A, Singh A, Parjapat K, Sharma R, Yadav RK. Pressmud alleviates soil sodicity stress in a rice – wheat rotation: Effects on soil properties, physiological adaptation and yield-related traits. Land Degrad Dev. (2021) 1:1–14. doi: 10.1002/ldr.3953
8. Richards LA. Diagnosis and improvement of saline and alkaline soils. Agriculture handbook No. 60. USDA, Washington. Soil Sci Soc America J. (1954) 18:348.
9. Shahid SA, Zaman M, Heng L. Introduction to Soil Salinity, Sodicity and Diagnostics Techniques. In: Guideline for Salinity Assessment, Mitigation and Adaptation Using Nuclear and Related Techniques. (Springer, Cham) (2018). p. 1–42. doi: 10.1007/978-3-319-96190-3_2
10. Shafeiee M, Ehsanzadeh P. Physiological and biochemical mechanisms of salinity tolerance in several fennel genotypes: Existence of clearly-expressed genotypic variations. Ind Crops Prod. (2019) 1:311–8. doi: 10.1016/j.indcrop.2019.02.042
11. Trejo-Téllez LI. Salinity stress tolerance in plants. Plants. (2023) 12:1–4. doi: 10.3390/plants12203520
12. El-Ramady H, Prokisch J, Mansour H, Bayoumi YA, Shalaby TA, Veres S, et al. Review of crop response to soil salinity stress: possible approaches from leaching to nano-management. Soil Syst. (2024) 8:1–29. doi: 10.3390/soilsystems8010011
13. Rashid M, Noreen S, Shah KH, Gaafar ARZ, Waqar R. Morphological and biochemical variations caused by salinity stress in some varieties of Pennisetum glaucum L. J King Saud Univ Sci. (2024) 36:1–9. doi: 10.1016/j.jksus.2023.102994
14. Wu L, Huo W, Yao D, Li M. Effects of solid matrix priming (SMP)and salt stress on broccoli and cauliflower seed germination and early seedling growth. Sci Hortic. (2019) 255:161–8. doi: 10.1016/j.scienta.2019.05.007
15. Stavridou E, Hastings A, Webster RJ, Robson PRH. The impact of soil salinity on the yield, composition and physiology of the bioenergy grass Miscanthus × giganteus. GCB Bioenergy. (2017) 9:92–104. doi: 10.1111/gcbb.12351
16. Egamberdieva D, Davranov K, Wirth S, Hashem A, Abd_Allah EF. Impact of soil salinity on the plant-growth – promoting and biological control abilities of root associated bacteria. Saudi J Biol Sci. (2017) 24:1601–8. doi: 10.1016/j.sjbs.2017.07.004
17. Arif Y, Singh P, Siddiqui H, Bajguz A, Hayat S. Salinity induced physiological and biochemical changes in plants: An omic approach towards salt stress tolerance. Plant Physiol Biochem. (2020) 156:64–77. doi: 10.1016/j.plaphy.2020.08.042
18. Xie W, Yang J, Gao S, Yao R, Wang X. The effect and influence mechanism of soil salinity on phosphorus availability in coastal salt-affected soils. Water. (2022) 14:1–15. doi: 10.3390/w14182804
19. Kamran M, Parveen A, Ahmar S, Hussain S, Chattha MS, Saleem MH, et al. An overview of hazardous impacts of soil salinity in crops, tolerance mechanisms, and amelioration through selenium supplementation. Int J Mol Sci. (2020) 21:1–27. doi: 10.3390/ijms21010148
20. Otlewska A, Migliore M, Dybka-Stępień K, Manfredini A, Struszczyk-Świta K, Napoli R, et al. When salt meddles between plant, soil, and microorganisms. Front Plant Sci. (2020) 11:553087. doi: 10.3389/fpls.2020.553087
21. Munns R, Tester M. Mechanisms of salinity tolerance. Annu Rev Plant Biol. (2008) 59:651–81. doi: 10.1146/annurev.arplant.59.032607.092911
22. Evelin H, Devi TS, Gupta S, Kapoor R, Ruiz-lozano JM. Mitigation of salinity stress in plants by arbuscular mycorrhizal symbiosis: current understanding and new challenges. Front Plant Sci. (2019) 10(4):1–21. doi: 10.3389/fpls.2019.00470
23. Pan T, Liu M, Kreslavski VD, Zharmukhamedov SK, Nie C, Yu M, et al. Non-stomatal limitation of photosynthesis by soil salinity. Crit Rev Environ Sci Technol. (2021) 51:791–825. doi: 10.1080/10643389.2020.1735231
24. Hannachi S, Steppe K, Eloudi M, Mechi L, Bahrini I, Van Labeke MC. Salt stress induced changes in photosynthesis and metabolic profiles of one tolerant (‘Bonica’) and one sensitive (‘Black beauty’) eggplant cultivars (Solanum melongena L.). Plants. (2022) 11:1–32. doi: 10.3390/plants11050590
25. Hnilickova H, Kraus K, Vachova P, Hnilicka F. Salinity stress affects photosynthesis, malondialdehyde formation, and proline content in portulaca oleracea l. Plants. (2021) 10:1–14. doi: 10.3390/plants10050845
26. Loudari A, Mayane A, Zeroual Y, Colinet G, Oukarroum A. Photosynthetic performance and nutrient uptake under salt stress: Differential responses of wheat plants to contrasting phosphorus forms and rates. Front Plant Sci. (2022) 13:1–16. doi: 10.3389/fpls.2022.1038672
27. Cruz JL, Coelho EF, Filho MAC, dos Santos AA. Salinity reduces nutrients absorption and efficiency of their utilization in cassava plants. Ciencia Rural. (2018) 48:1038672. doi: 10.3389/fpls.2022.1038672
28. Alkharabsheh HM, Seleiman MF, Hewedy OA, Battaglia ML, Jalal RS, Alhammad BA, et al. Field crop responses and management strategies to mitigate soil salinity in modern agriculture: A review. Agronomy. (2021) 11:1–22. doi: 10.3390/agronomy11112299
29. Farooq M, Gogoi N, Hussain M, Barthakur S, Paul S, Bharadwaj N, et al. Plant Physiology and Biochemistry Effects, tolerance mechanisms and management of salt stress in grain legumes. Plant Physiol Biochem. (2017) 118:199–217. doi: 10.1016/j.plaphy.2017.06.020
30. Flowers TJ, Munns R, Colmer TD. Sodium chloride toxicity and the cellular basis of salt tolerance in halophytes. Ann Bot. (2015) 115:419–31. doi: 10.1093/aob/mcu217
31. Liang W, Ma X, Wan P, Liu L. Plant salt-tolerance mechanism: A review. Biochem Biophys Res Commun. (2017) 1:1–6. doi: 10.1016/j.bbrc.2017.11.043
32. Phogat V, Pitt T, Cox JW, Šimůnek J, Skewes MA. Soil water and salinity dynamics under sprinkler irrigated almond exposed to a varied salinity stress at di ff erent growth stages. Agric Water Manag. (2018) 201(1):70–82. doi: 10.1016/j.agwat.2018.01.018
33. Acosta-Motos J Ramón, Ortuño MF, Bernal-Vicente A, Pedro D, Sanchez-Blanco MJ, Hernandez JA. Plant responses to salt stress: Adaptive mechanisms. Agronomy. (2017) 7:1–38. doi: 10.3390/agronomy7010018
34. Ding Z, Zhou Z, Lin X, Zhao F, Wang B, Lin F, et al. Biochar impacts on NH3-volatilization kinetics and growth of sweet basil (Ocimum basilicum L.) under saline conditions. Ind Crops Prod. (2020) 157:1–9. doi: 10.1016/j.indcrop.2020.112903
35. Kargas G, Londra P. Saturated paste extract electrical conductivity (ECe). Water. (2022) 14:1–10. doi: 10.3390/w14040642
36. Gondek M, Weindorf DC, Thiel C, Kleinheinz G. Soluble salts in compost and their effects on soil and plants: a review. Compost Sci Util. (2020). 28(2):59–75. doi: 10.1080/1065657X.2020.1772906
37. Ismayilov AI, Mamedov AI, Fujimaki H, Tsunekawa A, Levy GJ. Soil salinity type effects on the relationship between the electrical conductivity and salt content for 1:5 soil-to-water extract. Sustainability. (2021) 13:1–11. doi: 10.3390/su13063395
38. Zhao X, Xia J, Chen W, Chen Y, Fang Y, Qu F. Transport characteristics of salt ions in soil columns planted with Tamarix chinensis under different groundwater levels. PloS One. (2019) 14:1–17. doi: 10.1371/journal.pone.0215138
39. Tavakkoli E, Rengasamy P, McDonald GK. High concentrations of Na+ and Cl- ions in soil solution have simultaneous detrimental effects on growth of faba bean under salinity stress. J Exp Bot. (2010) 61:4449–59. doi: 10.1093/jxb/erq251
40. Rengasamy P. Transient salinity and subsoil constraints to dryland farming in Australian sodic soils: An overview. In: Aust J Exp Agricult. (2002) 1:351–61. doi: 10.1071/EA01111
41. She R, Yu Y, Ge C, Yao H. Soil texture alters the impact of salinity on carbon mineralization. Agronomy. (2021) 11:1–13. doi: 10.3390/agronomy11010128
42. Shahid SA. Developments in salinity assessment, modeling, mapping, and monitoring from regional to submicroscopic scales. In: Shahid SA, Abdelfattah MA, Taha FK, editors. Developments in Soil Salinity Assessment and Reclamation, vol. 1. Dordrecht: Springer (2013). p. 3–64. doi: 10.1007/978-94-007-5684-7_1
43. Sonmez S, Buyuktas D, Okturen F, Citak S. Assessment of different soil to water ratios (1:1, 1:2.5, 1:5) in soil salinity studies. Geoderma. (2008) 144:361–9. doi: 10.1016/j.geoderma.2007.12.005
44. Isdory DP, Massawe BHJ, Msanya BM. Predicting soil ECe based on values of EC1:2.5 as an indicator of soil salinity at magozi irrigation scheme, Iringa, Tanzania. Tanzania J Agric Sci. (2021) 20:63–71.
45. Hassannia M, Sotoodehnia A. Evaluation and analysis of different regression models for estimation of ECe from EC1:5 -With a case study from Buin. Irrigation and Drainage (2020) 1(5):1–12. doi: 10.1002/ird.2488
46. De Pauw E. Soils, Physiography and Agro-Ecological Zones of Tanzania. In: Crop Monitoring and Early Warning Systems Project, FAO. Ministry of Agriculture, Dar es Salaam, Tanzania (1984).
47. Mclean EO. Soil pH and Lime Requirement. In: Page AL, editor. Methods of Soil Analysis Part 2, 2nd ed. Madison, Wisconsin USA: American Society of Agronomy, Soil Science Society of America. (1982). p. 159–64.
48. Beretta AN, Silbermann AV, Paladino L, Torres D, Bassahun D, Musselli R, et al. Análisis de textura del suelo con hidrómetro: Modificaciones al método de Bouyoucus. Cienc Investig Agrar. (2014) 41:263–71. doi: 10.4067/S0718-16202014000200013
49. USDA. Soil survey manual. 4th ed. Vol. 8. Ditzler C, editor. Washington, DC: U.S. Govt. Printing Office (2017) p. 1–603. Available at: https://www.nrcs.usda.gov/resources/guides-and-instructions/soil-survey-manual.
50. Stavi I, Thevs N, Priori S. Soil salinity and sodicity in drylands: A review of causes, effects, monitoring, and restoration measures. Front Environ Sci. (2021) 9:712831. doi: 10.3389/fenvs.2021.712831
51. Nicolas F, Kamai T, Ben Gal A, Ochoa-Brito J, Daccache A, Ogunmokun F, et al. Assessing salinity impacts on crop yield and economic returns in the Central Valley. Agric Water Manage. (2023) 287:1–18. doi: 10.1016/j.agwat.2023.108463
52. Joseph VR. Optimal ratio for data splitting. Stat Anal Data Min. (2022) 15:531–8. doi: 10.1002/sam.11583
53. Dobbin KK, Simon RM. Optimally splitting cases for training and testing high dimensional classifiers. BMC Med Genomics. (2011) 4:1–8. doi: 10.1186/1755-8794-4-31
54. Yang T, Cherchian S, Liu X, Shahrokhnia H, Mo M, Šimůnek J, et al. Effect of water application methods on salinity leaching efficiency in different textured soils based on laboratory measurements and model simulations. Agric Water Manage. (2023) 5:1–13. doi: 10.1016/j.agwat.2023.108250
55. Wang D, Wang Z, Zhang J, Zhou B, Lv T, Li W. Effects of soil texture on soil leaching and cotton (Gossypium hirsutum l.) growth under combined irrigation and drainage. Water. (2021) 13:1–17. doi: 10.3390/w13243614
56. Uri N. Cropland soil salinization and associated hydrology: Trends, processes and examples. Water. (2018) 10:1–20. doi: 10.3390/w10081030
57. Gelaye KK, Zehetner F, Loiskandl W, Klik A. Effects of soil texture and groundwater level on leaching of salt from saline fields in Kesem irrigation scheme, Ethiopia. Soil Water Res. (2019) 14:221–8. doi: 10.17221/137/2018-SWR
58. Novák V, Hlaváčiková H. Modelling of water flow and solute transport in soil. Soil Water Res. (2019) 1(1):319–37. doi: 10.1007/978-3-030-01806-1_21
59. Solis CA, Yong MT, Zhou M, Venkataraman G, Shabala L, Holford P, et al. Evolutionary significance of NHX family and NHX1 in salinity stress adaptation in the genus oryza. Int J Mol Sci. (2022) 23:1–21. doi: 10.3390/ijms23042092
60. Maas EV. Plant growth response to salt stress. Int J Mol Sci. (1993) 23(4):279–91. doi: 10.1007/978-94-011-1858-3_31
61. Zheng C, Liu C, Liu L, Tan Y, Sheng X, Yu D, et al. Effect of salinity stress on rice yield and grain quality: A meta-analysis. Eur J Agro. (2023) 14:1–15. doi: 10.1016/j.eja.2023.126765
62. Zhang R, Wang Y, Hussain S, Yang S, Li R, Liu S, et al. Study on the effect of salt stress on yield and grain quality among different rice varieties. Front Plant Sci. (2022) 13:918460. doi: 10.3389/fpls.2022.918460
63. Bundó M, Martín-Cardoso H, Pesenti M, Gómez-Ariza J, Castillo L, Frouin J, et al. Integrative approach for precise genotyping and transcriptomics of salt tolerant introgression rice lines. Front Plant Sci. (2022) 12:797141. doi: 10.3389/fpls.2021.797141
64. Linh LH, Linh TH, Xuan TD, Ham LH, Ismail AM, Khanh TD. Molecular breeding to improve salt tolerance of rice (Oryza sativa L.) in the Red River Delta of Vietnam. Int J Plant Genomics. (2012) 1:1–9. doi: 10.1155/2012/949038
65. Zhang H, Schroder JL, Pittman JJ, Wang JJ, Payton ME. Soil salinity using saturated paste and 1:1 soil to water extracts. Soil Sci Soc America J. (2005) 69:1146–51. doi: 10.2136/sssaj2004.0267
66. Aboukila EF, Norton JB. Estimation of saturated soil paste salinity from soil-water extracts. Soil Sci. (2017) 182:107–13. doi: 10.1097/SS.0000000000000197
67. Khorsandi F, Yazdi FA. Gypsum and texture effects on the estimation of saturated paste electrical conductivity by two extraction methods. Commun Soil Sci Plant Anal. (2007) 38:1105–17. doi: 10.1080/00103620701278120
68. Kargas G, Londra P, Sotirakoglou K. The effect of soil texture on the conversion factor of 1:5 soil/water extract electrical conductivity (EC1:5) to soil saturated paste extract electrical conductivity (ECe). Water. (2022) 14:1–10. doi: 10.3390/w14040642
Keywords: soil health, soil salinity, ECe prediction models, salinity management, regression model, agricultural productivity
Citation: Omar MdM, Shitindi MJ, Massawe BHJ, Pedersen O, Meliyo JL and Fue KG (2024) Modeling the electrical conductivity relationship between saturated paste extract and 1:2.5 dilution in different soil textural classes. Front. Soil Sci. 4:1421661. doi: 10.3389/fsoil.2024.1421661
Received: 22 April 2024; Accepted: 18 November 2024;
Published: 04 December 2024.
Edited by:
Songchao Chen, ZJU-Hangzhou Global Scientific and Technological Innovation Center, ChinaReviewed by:
Junzhen Mi, Inner Mongolia Agricultural University, ChinaXiangyu Ge, Xinjiang University, China
Copyright © 2024 Omar, Shitindi, Massawe, Pedersen, Meliyo and Fue. This is an open-access article distributed under the terms of the Creative Commons Attribution License (CC BY). The use, distribution or reproduction in other forums is permitted, provided the original author(s) and the copyright owner(s) are credited and that the original publication in this journal is cited, in accordance with accepted academic practice. No use, distribution or reproduction is permitted which does not comply with these terms.
*Correspondence: Moh’d M. Omar, bW1hbmdhb21hcnlAZ21haWwuY29t