 Bryan A. Driscoll
 Maja Krzic
 Louis-Pierre Comeau
 Bianca N. I. Eskelson
 Sheng Li3
- 1Faculty of Land and Food Systems, University of British Columbia, Vancouver, BC, Canada
- 2Faculty of Forestry, University of British Columbia, Vancouver, BC, Canada
- 3Fredericton Research and Development Centre, Agriculture and Agri-Food Canada, Fredericton, NB, Canada
In this study we evaluated CO2, N2O, and CH4 fluxes in two integrated best management practices (BMPIs) comprised of the following individual practices: diversion terraces (DT), grassed waterways (GW), and contour tillage (CT) [i.e., DTGW]; and DT, GW, CT, and tile drainage (TD) [i.e., DTGW+TD], relative to CT that served as a control. It was anticipated that due to its effects on soil water redistribution and soil temperature, diversion terraces and grassed waterways would influence the pattern of greenhouse gas (GHG) emission. This is the first study in the world linking such erosion control structures with subsurface drainage. Cumulative CO2 emissions were greatest in DTGW in both 2020 and 2021. In 2019, DTGW+TD N2O emissions were significantly lower than CT and DTGW. N2O emissions were highest in DTGW in 2020 and 2021, though not statistically significant. There were no significant differences in CH4 in any year. Soil in all BMPIs acted as a weak CH4 sink during the study period. This study demonstrated that the addition of TD to DT and GW significantly reduced the loss of stored carbon (as CO2) relative to undrained DT and GW, while also not emitting significantly more carbon than CT, in the initial years after implementation. Results were similar with respect to the loss of nitrogen, as N2O, where undrained DT and GW generally emitted more N2O in the first years after implementation.
Introduction
New Brunswick farmers are producing 40% of Canada’s potatoes (1), but intensive potato cultivation practices have led to substantial soil degradation, necessitating improvements in management practices (2). Land scarcity has led to the regular practice of potato-grain and potato-potato-grain rotations in northwest New Brunswick (3). In the 1980s Wang et al. (4) reported an average of 17 g soil organic carbon (SOC) kg-1 in loam-textured plow layers of intensively cropped New Brunswick potato fields – down more than 50% from 1960s levels before potato production had intensified (5). Optimal SOC levels for potato production in the region are reported to be between 20.0 and 29.0 g kg-1 (6). While the combination of contour tillage with variable grade diversions and grassed waterways (a common local combination of best management practices) was shown to conserve soil and water in a long-term study of 23 benchmark sites in northwest New Brunswick from 1990 to 2000, the potato-potato-grain rotations did not maintain SOC levels (7). The cultural practices used in potato production caused soil displacement, encouraging the oxidation of SOC. Soil heterotrophic respiration (CO2 efflux from soil, excluding root respiration) releases significant amounts of CO2 into the atmosphere (8). Thus, any practices which increase heterotrophic respiration can incur significant impact on the climate (9).
The Landscape Integrated Soil and Water Conservation (LISWC) system is an innovative system that integrates multiple best management practices (BMPs) for potato production on sloped landscapes of New Brunswick (10, 11). The LISWC system combines diversion terraces, grassed waterways, tile drainage, water retention structures, supplemental irrigation, conservation tillage practices, and soil-landscape restoration. There are concerns, however, that in wet years the diversion terraces can lead to fields being too wet (2) since diversion terraces slow down surface runoff and direct more water into the soil profile. Soil water and temperature are the two most influential parameters for greenhouse gas (GHG) fluxes from soils (12). Soil water controls microbial activity and related microbial processes by solubilizing substrate compounds and, through diffusion, increases substrate availability to active microbial sites (13). Heightened microbial activity will then lead to higher decomposition of organic matter and higher microbial respiration rates that produce GHGs in soils. Rising soil temperature also increases microbial metabolic rates, further enhancing respiration (14). In saturated soils, anaerobic conditions foster the production of methane (CH4) and nitrous oxide (N2O) from methanogenesis and nitrification/denitrification, respectively. In regions with a humid climate (e.g., New Brunswick), denitrification is the dominant process producing GHG emissions (15).
Crop management practices can either increase or decrease GHG fluxes. For example, frequent tillage operations commonly used in potato production can break down aggregates and expose organic matter to oxidation or decomposition processes. In general, carbon (C) sequestration will be more successful in land management systems that minimize erosion and soil disturbances, maximize return of crop residues, or maximize the efficiency of crop water and nutrient use (16, 17). Because of the intensive nature of most cropping systems, it is possible to mitigate GHG production and reduce C and nitrogen (N) losses in the soil by modifying soil management practices (18). For example, because nitrate (NO3-) ions are prone to leaching, the water redistribution from diversion terraces, grassed waterways, and tile drainage may affect the NO3- concentrations within the soil. Fluxes of N2O are often a direct function of N application rate (19–21), and the NO3- supply rate within the soil to plants, after fertilization, may be affected by the different management practices, such as contour tillage, diversion terraces, grassed waterways, and tile drainage. Because of the large N fertilizer inputs required in attaining the demanded potato tuber yield and size distribution, concerns arise over increased N2O emissions (22). Nitrous oxide is responsible for stratospheric ozone depletion (23), and Canadian agriculture is now responsible for 75% of national N2O emissions (24).
The objective of our study was to evaluate the effects of two systems of BMP integration (i.e., BMPI), each comprised of several individual BMPs, on heterotrophic GHG fluxes and nitrate supply rates during the initial three years of management implementation, relative to contour tillage (CT), across three slope positions. The implications of these BMP integrations on GHG fluxes are unknown. The two BMPIs included the following combinations of individual practices: (i) DT, GW, and CT [labeled DTGW hereafter] and (ii) DT, GW, CT, and TD [labeled DTGW+TD hereafter], while CT served as a control.
Materials and methods
Site description
This landscape observational study was conducted between August 2019 and October 2021 on a field experimental site maintained by the Fredericton Research and Development Centre (FRDC) of Agriculture and Agri-Food Canada in Fredericton, New Brunswick, Canada. The study site was located on a northeast-facing slope facing the Saint John River (45°55’33.5”N 66°36’55.5”W). The whole Fredericton area, including the study site location, has been subject to glaciation, and most upland soils have been developed from weathered glacial till parent materials (25). The study site is located on soil that was part of the Research Station Association and classified as a Rustic Podzol (26, 27). This soil developed in areas with loose ablation till over compact lodgment till (28). The soil is moderately permeable sandy loam with 10 to 25% angular cobbles and gravels, averaging 55% sand, 34% silt, and 10% clay, with a pH of 5-6. The Fredericton area receives a mean annual rainfall of 886 mm and a mean annual snowfall of 215 cm (29).
Construction of the LISWC system on the study site was done in 2018. Prior to construction, the site was under grass for two seasons. In the initial season of 2019, the study site was seeded with oat (Avena sativa L.). Oats are a typical crop used in New Brunswick crop rotations. In 2020, the site was again seeded with oat, while in 2021, a potato (Solanum tuberosum L.) crop was planted.
The study consisted of three BMPIs, separated by 5 m of grass, constructed on a slope with a gradient of 10% (Supplementary Figure S1). Each BMPI represented a different combination of individual BMPs (11). The 1st BMPI consisted of a 70-m long field on the slope and a water retention pond at the base of the slope. It acted as a control and had only one BMP - contour tillage (CT).
For the 2nd BMPI, a 75-m long field was subdivided into three segments. Each of the three segments consisted of a 20 m block of arable field with a 5 m DT and GW constructed below the field block. This BMPI is referred to as DTGW. The 3rd BMPI, DTGW+TD, was a repeat of DTGW but with tile drainage installed – representative of the full BMPI system. Two polyvinyl chloride (PVC) tile drains (10 cm in diameter) were installed per block, 10 m apart. Edges of the BMPIs were lined with an impermeable plastic barrier extending to a depth of 1 m, to isolate each BMPI from potential inflows and outflows of shallow subsurface flow. Contour tillage was also implemented in both DTGW and DTGW+TD. In each BMPI, six plots were established at 5 m, 15 m, 30 m, 40 m, 55 m, and 65 m measured from the top of the field. For each plot, there were three subplots for sample and data collection − the middle subplot was installed with a soil moisture and temperature monitoring station, whereas the two subplots on the sides were for GHG chamber installation.
Field managements
2020 field season
The soil of the experiment site was disked on June 5th, followed by additional disking and harrowing on June 15th, before oats were planted on the same day. On the same day as planting, a 17-17-17 urea-based fertilizer was applied at a rate of 337 kg ha-1 (57 kg N ha-1). An herbicide (MCPA 600 + Refine SG + Activate Plus; 1 L/Ha + 30 g/Ha + 2 L/1000L) was sprayed on July 6th. Oats were harvested on September 22nd to prevent them from seeding in subsequent field seasons. The straw was mowed and left on the ground. A final plowing with a moldboard plow took place on October 1st.
2021 field season
The fields were planted with potato in the 2021 growing season. The CT management practice consisted of 68 total potato rows. In both DTGW and DTGW+TD, each block had a total of 16 rows, for a total of 48 rows per BMPI. Oats were grown at the base and top of CT, as well as at the bottom and top of each of the 3 blocks in both DTGW and DTGW+TD to prevent soil from washing out at the flumes into the water retention pond.
On June 7th, Russet Burbank potatoes were planted with rows spaced at 0.91 m and plants spaced at 0.38 m within rows. A 17-17-17 urea-based fertilizer was applied during planting at a rate of 1120 kg ha-1 (190.5 kg N ha-1). This was slightly lower than the 208 kg N ha-1 fertilizer rate that is the typical maximum fertilization rate for Russet B. in New Brunswick (30, 31). The fertilization rate used was the recommended rate for Russet B. potatoes in the soil at the FRDC (32). Potato rows were hilled on July 20th. An insecticide (Matador; 125 ml/ha) was sprayed on both July 23rd and August 11th to suppress Colorado potato beetle (Leptinotarsa decemlineata) activity. Fungicide (Revus; 600 ml/ha) spraying was scheduled every Friday (weather permitting) but sometimes took place a day earlier or later depending on rain events. Potato harvest took place on October 6th, 2021.
The 2021 field season was considerably wetter than 2020 and without as many peak temperatures in the mid-30°C (Figure 1). In June, July, and August of 2020, a total of 168 mm of precipitation fell, whereas 258 mm fell in the same three months of 2021 (33). The weather station on the study site recorded 51.2 mm of rain on July 9th during the remnants of Hurricane Elsa (Figure 1). Minor rill erosion was observed in all three land management practices the following day, causing exposed potato plant roots and small channels oriented along the slope.
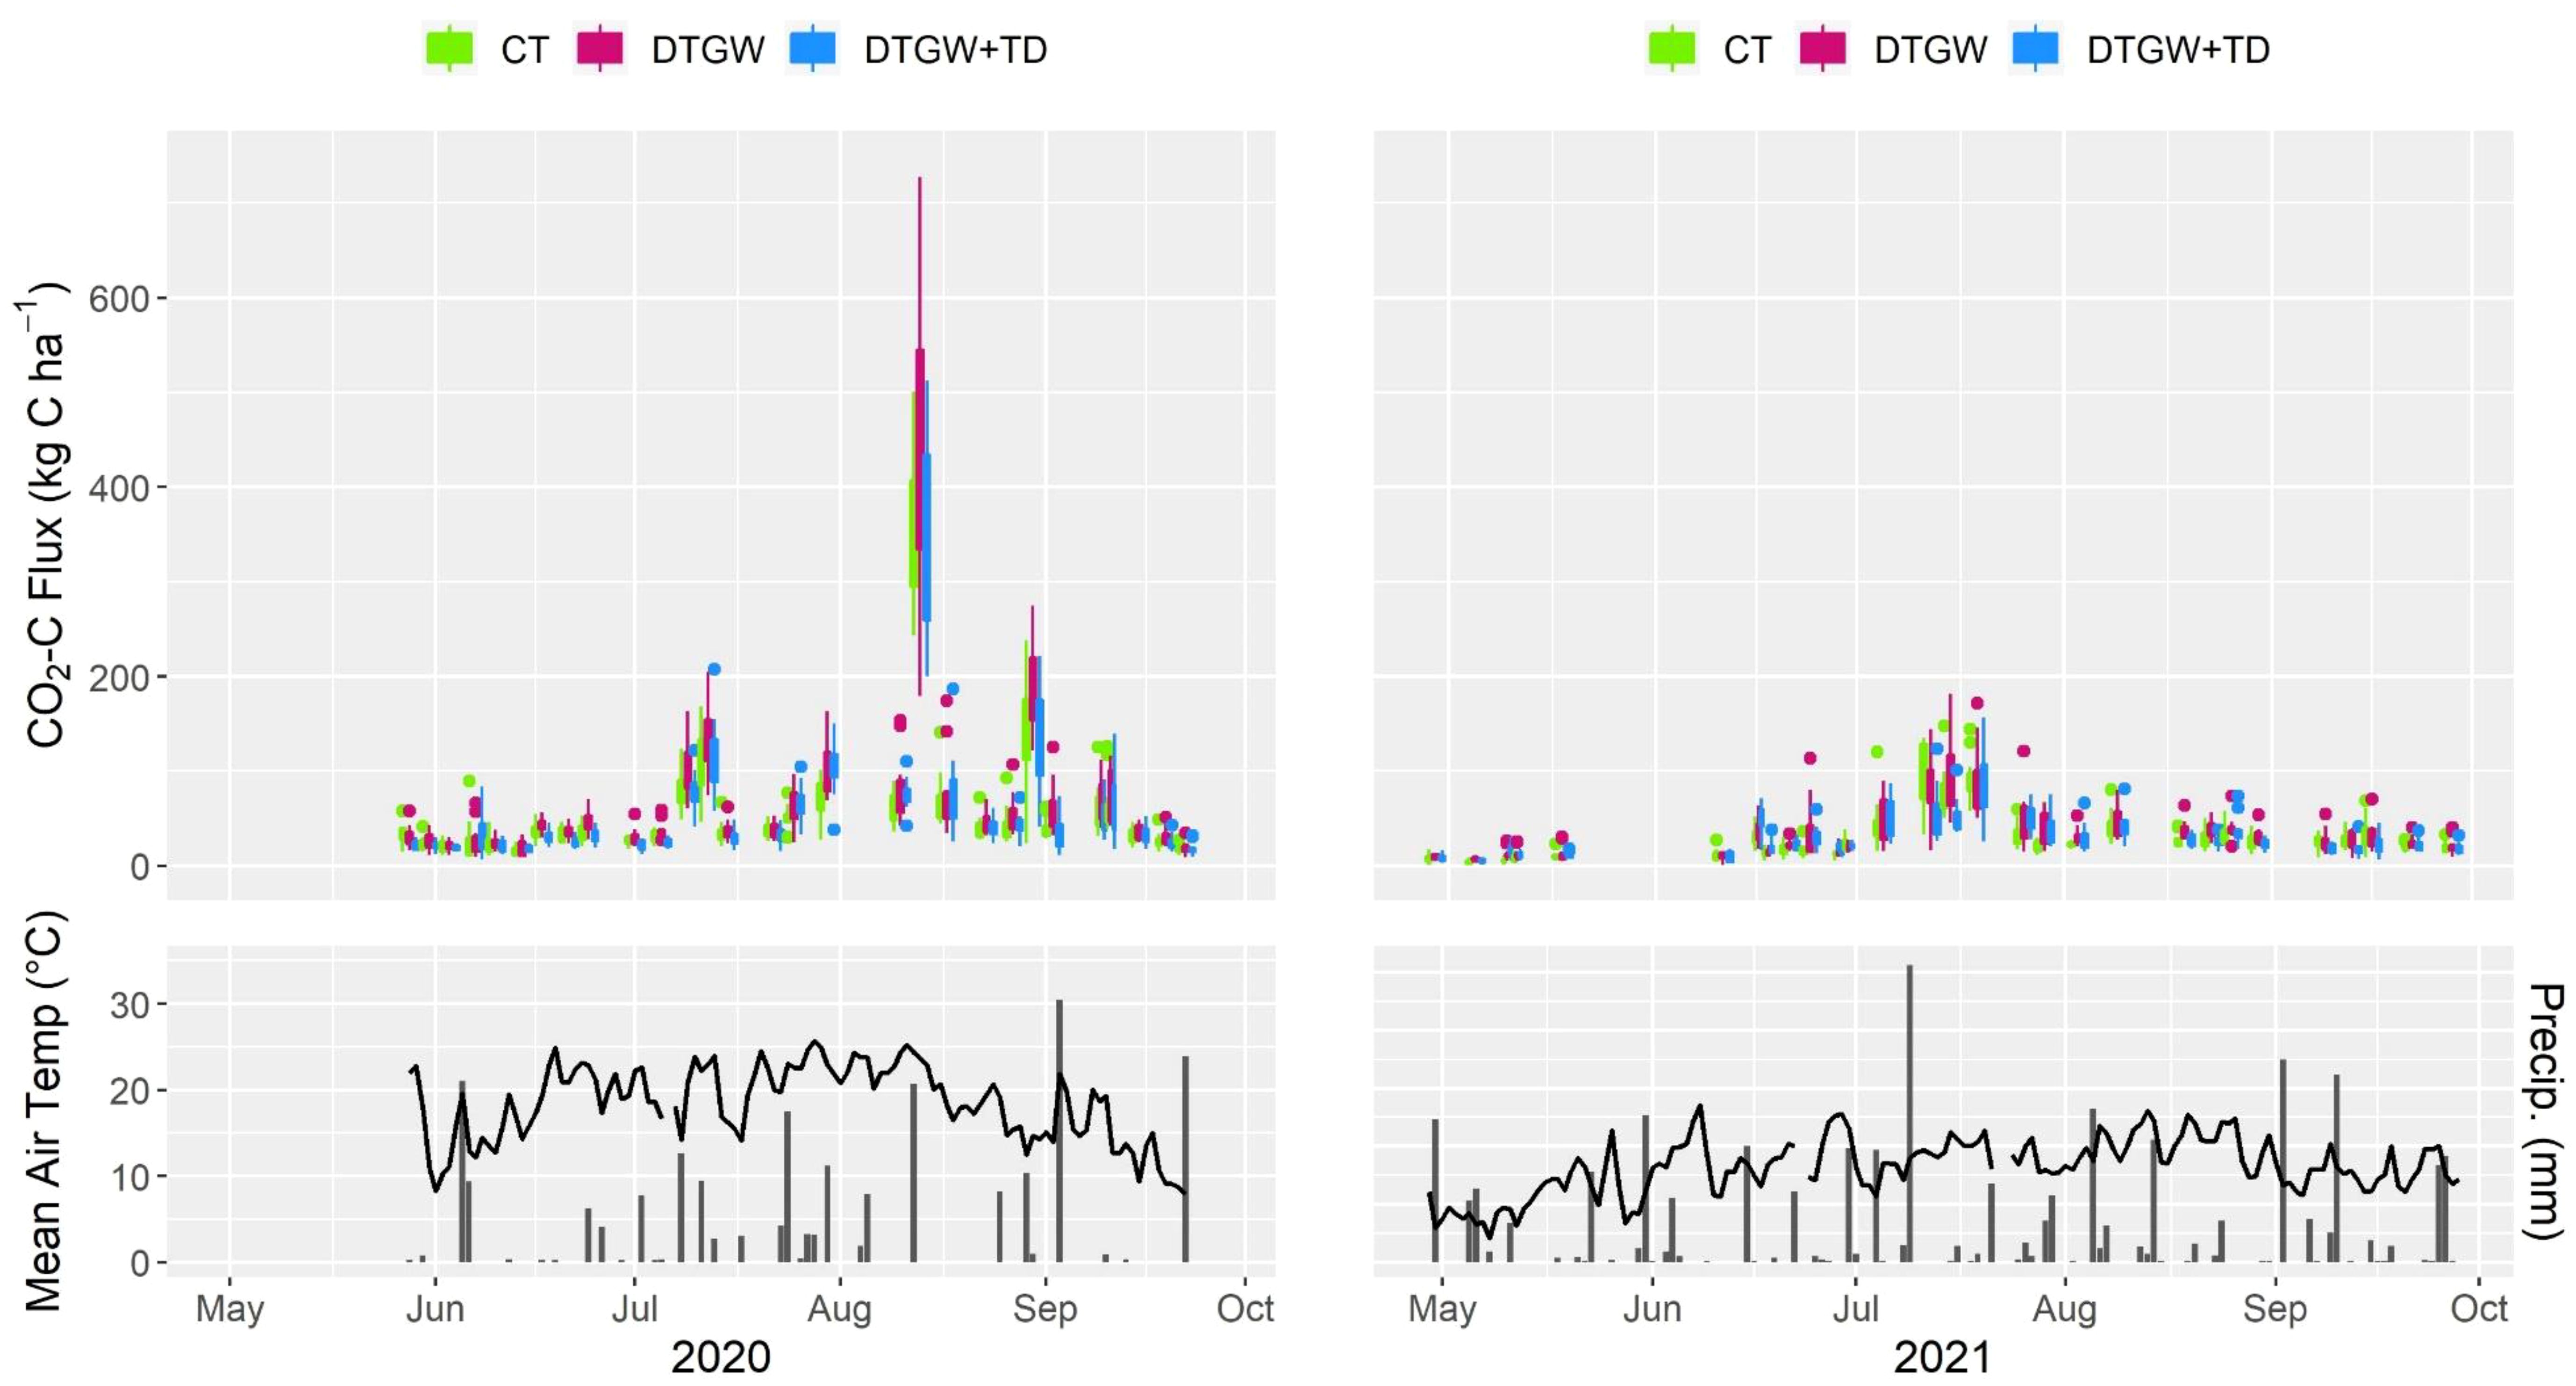
Figure 1. Top) CO2 fluxes from May 28th to September 22nd, 2020, and April 29th to September 28th, 2021in the three best management practice integration (BMPI) systems: CT (contour tillage), DTGW (diversion terraces and grassed waterways), and DTGW+TD (diversion terraces, grassed waterways, and tile drainage). Bottom) Corresponding mean daily temperature and precipitation levels.
Sampling and analysis
CO2 readings
To sample heterotrophic CO2 fluxes, an EGM-5 Portable CO2 Gas Analyzer (PP Systems, Amesbury, MA, USA) with an SRC-2 Soil Respiration Chamber was used throughout the growing seasons of 2020 and 2021. A HydraProbe sensor (Stevens Water Monitoring Systems, Portland, OR, USA) was used with the EGM gas analyzer to gather surface soil moisture and temperature data with each flux measurement.
Flux measurements were taken twice a week and began at 10:00 am to coincide with daily mean soil temperatures. Fluxes were measured for 60 seconds (34). Measurements in 2020 occurred between May 28th and September 22nd. Measurements in 2021 occurred between April 29th and September 28th. Measurements in both years occurred approximately twice a week, weather permitting. Once collars for N2O and CH4 were installed in the field, measurements were taken inside the collars, which stayed free of oat or potato roots.
The linear respiration rate was calculated by the EGM with the following formula:
where R is the respiration/assimilation rate (CO2 flux, or moles of CO2 unit area-1 unit time-1), C0 is the CO2 concentration at T=0, and Cn is the concentration at finishing time Tn. The area of soil exposed is represented by A, and V is the total system volume (35).
N2O and CH4 readings
Closed static dark chambers were used to make measurements of N2O and CH4 in the growing seasons of 2019, 2020, and 2021. A total of 36 cylindrical collars, measuring 38-cm tall and 30-cm in diameter were installed in the field at each subplot, at least 72 hours before the first measurement of the season (34). In 2019 and 2020, the site was seeded with oat, and any visible plant matter inside the collar was removed immediately after installation. In 2021, the collars were installed directly into potato rows on July 21st and 22nd. Any potato plants were pulled where each collar was to be installed, to ensure no seed potato or potato plant was inside the collar. This prevented fluxes associated with plant root respiration. In 2019, measurements were taken on August 28th and September 10th and 26th. In 2020, measurements were taken on July 29th, August 12th and 26th, and September 4th. In 2021, measurements were taken on July 28th, August 10th and 25th, and September 8th and 21st.
On each day of measurement, plastic lids were secured to the top of the collar to ensure an air-tight, closed system. Lids from plastic, 5-gallon buckets were custom fit with 2 one-touch fittings (SMC Corporation, Tokyo, Japan). Each fitting had placed inside of it a 10-inch length of 6-mm tubing with a one-way stopcock (Cole-Parmer, Montréal, Canada) at the halfway point. Stopcocks were used to ensure venting, so that buildup of any gas was prevented before the time 0 measurement. Lids also had a rubber septum in the middle where the syringe would draw a 20-mL gas sample into a pre-evacuated 12-mL exetainer.
Once all collars were secured with lids, measuring could begin. Four measurements were made for each collar at time 0, 30, 60, and 90 minutes. Measurements were staggered by 60 seconds so that there was time to draw a syringe sample and move to the next sampling location. Two people each took 18 samples at each of the 4 time intervals, leaving 12 minutes between the end of one interval and the beginning of the next.
All gas samples from exetainers were analyzed using a 7890A gas chromatograph (Agilent Technologies Inc., CA, USA) equipped with a flame ionization detector and electron capture detector. It was also equipped with a PAL auto-sampler (Agilent Technologies Inc., CA, USA). Fluxes were calculated with R, version 4.0.3 (36), in R Studio using the gasfluxes package (37). The lin.fit method from the package was used to fit a linear model via R’s lm function, using concentration and time data.
Continuous soil water and temperature data was taken from the 5TE sensors (METER Group). Data was taken from the 11:00 am reading – halfway between start and end of gas sampling – and from the 15-cm depth reading. During this study, measurements were only taken on fixed, plant-free locations – intentionally excluding plant root respiration and focusing solely on heterotrophic respiration (38).
Nitrate supply rates
The availability of NO3- was determined using Plant Root Simulator (PRS™-Probes) technology from Western Ag Innovations Inc., Saskatoon, Canada. The probes are ion exchange membranes (adsorbing surface area of 17.5 cm2/probe) encapsulated in a thin plastic probe. They were inserted into the 0–10 cm layer of the mineral soil where they adsorbed nutrients in their available forms. The probes also adsorbed ammonium ions, but a majority of the results were below method detection limits and were therefore not included. Probes were placed adjacent to the greenhouse gas sampling chambers in each of 2020 and 2021. Probes were sent back to Western Ag for analysis after the removal of each round of probes.
The four sampling periods in 2020 were: (1) June 17 – July 12; (2) July 2 – July 28; (3) July 28 – August 18; and (4) August 19 – September 8. The three sampling periods in 2021 were: (1) July 26 – August 16; (2) August 16 – September 7; and (3) September 7 – September 22.
Statistical analysis
The differences in GHG fluxes were analyzed using ANOVA and Tukey post-hoc tests. A linear mixed effects model was used with BMPI (CT, DTGW, DTGW+TD) and slope position (upper, middle, lower) as fixed effects, subplot as a random effect to account for repeated measurements, and soil water content and temperature as continuous explanatory variables (39). A model was fit for each gas separately. Soil temperature was not included in the N2O model, as it was not significant in the model. A linear mixed effects model was also used to assess volumetric water content (VWC); only BMPI, slope position, and their interaction were included in the model as fixed effects. For CO2, soil moisture and temperature values from the HydraProbe sensor were included as continuous explanatory variables. A linear mixed effects model was fitted with BMPI to assess total GHG emitted as CO2 equivalents, with 298 and 25 used as the conversion factors for global warming potentials (GWP) of N2O and CH4, respectively (40). Finally, for NO3- supply rate, a linear mixed effects model was fit with BMPI and slope position as fixed effects and subplot as a random effect.
Type III ANOVA was used to evaluate significance of interaction terms in the models. A Tukey post-hoc HSD test was performed using the emmeans function (41) if the main effects BMPI or slope position were significant without a significant interaction between the two. The ANOVA assumptions of normality and homogeneity of variance were assessed using Shapiro-Wilks test and Bartlett’s test, respectively, in addition to diagnostic plots. Data transformations were made when necessary to ensure conditions of ANOVA were met. A statistical significance threshold of α = 0.05 was used for hypothesis testing. Statistical analyses were conducted using R software, version 4.0.3 (36).
Results
Carbon dioxide
Mean daily fluxes (kg CO2-C ha-1) in 2020 were 56.6 ± 3.6, 68.8 ± 4.8, and 56.7 ± 3.7 in CT, DTGW, and DTGW+TD, respectively (Figure 2). In 2021, mean daily fluxes averaged 28.7 ± 1.4, 33.3 ± 1.5, and 28.6 ± 1.2 kg CO2-C ha-1 for the same treatments, respectively. Daily fluxes measured across the entire study length averaged 43.1 ± 2.0, 55.3 ± 3.3, and 42.5 ± 2.0 kg CO2-C ha-1, for the same treatments, respectively.
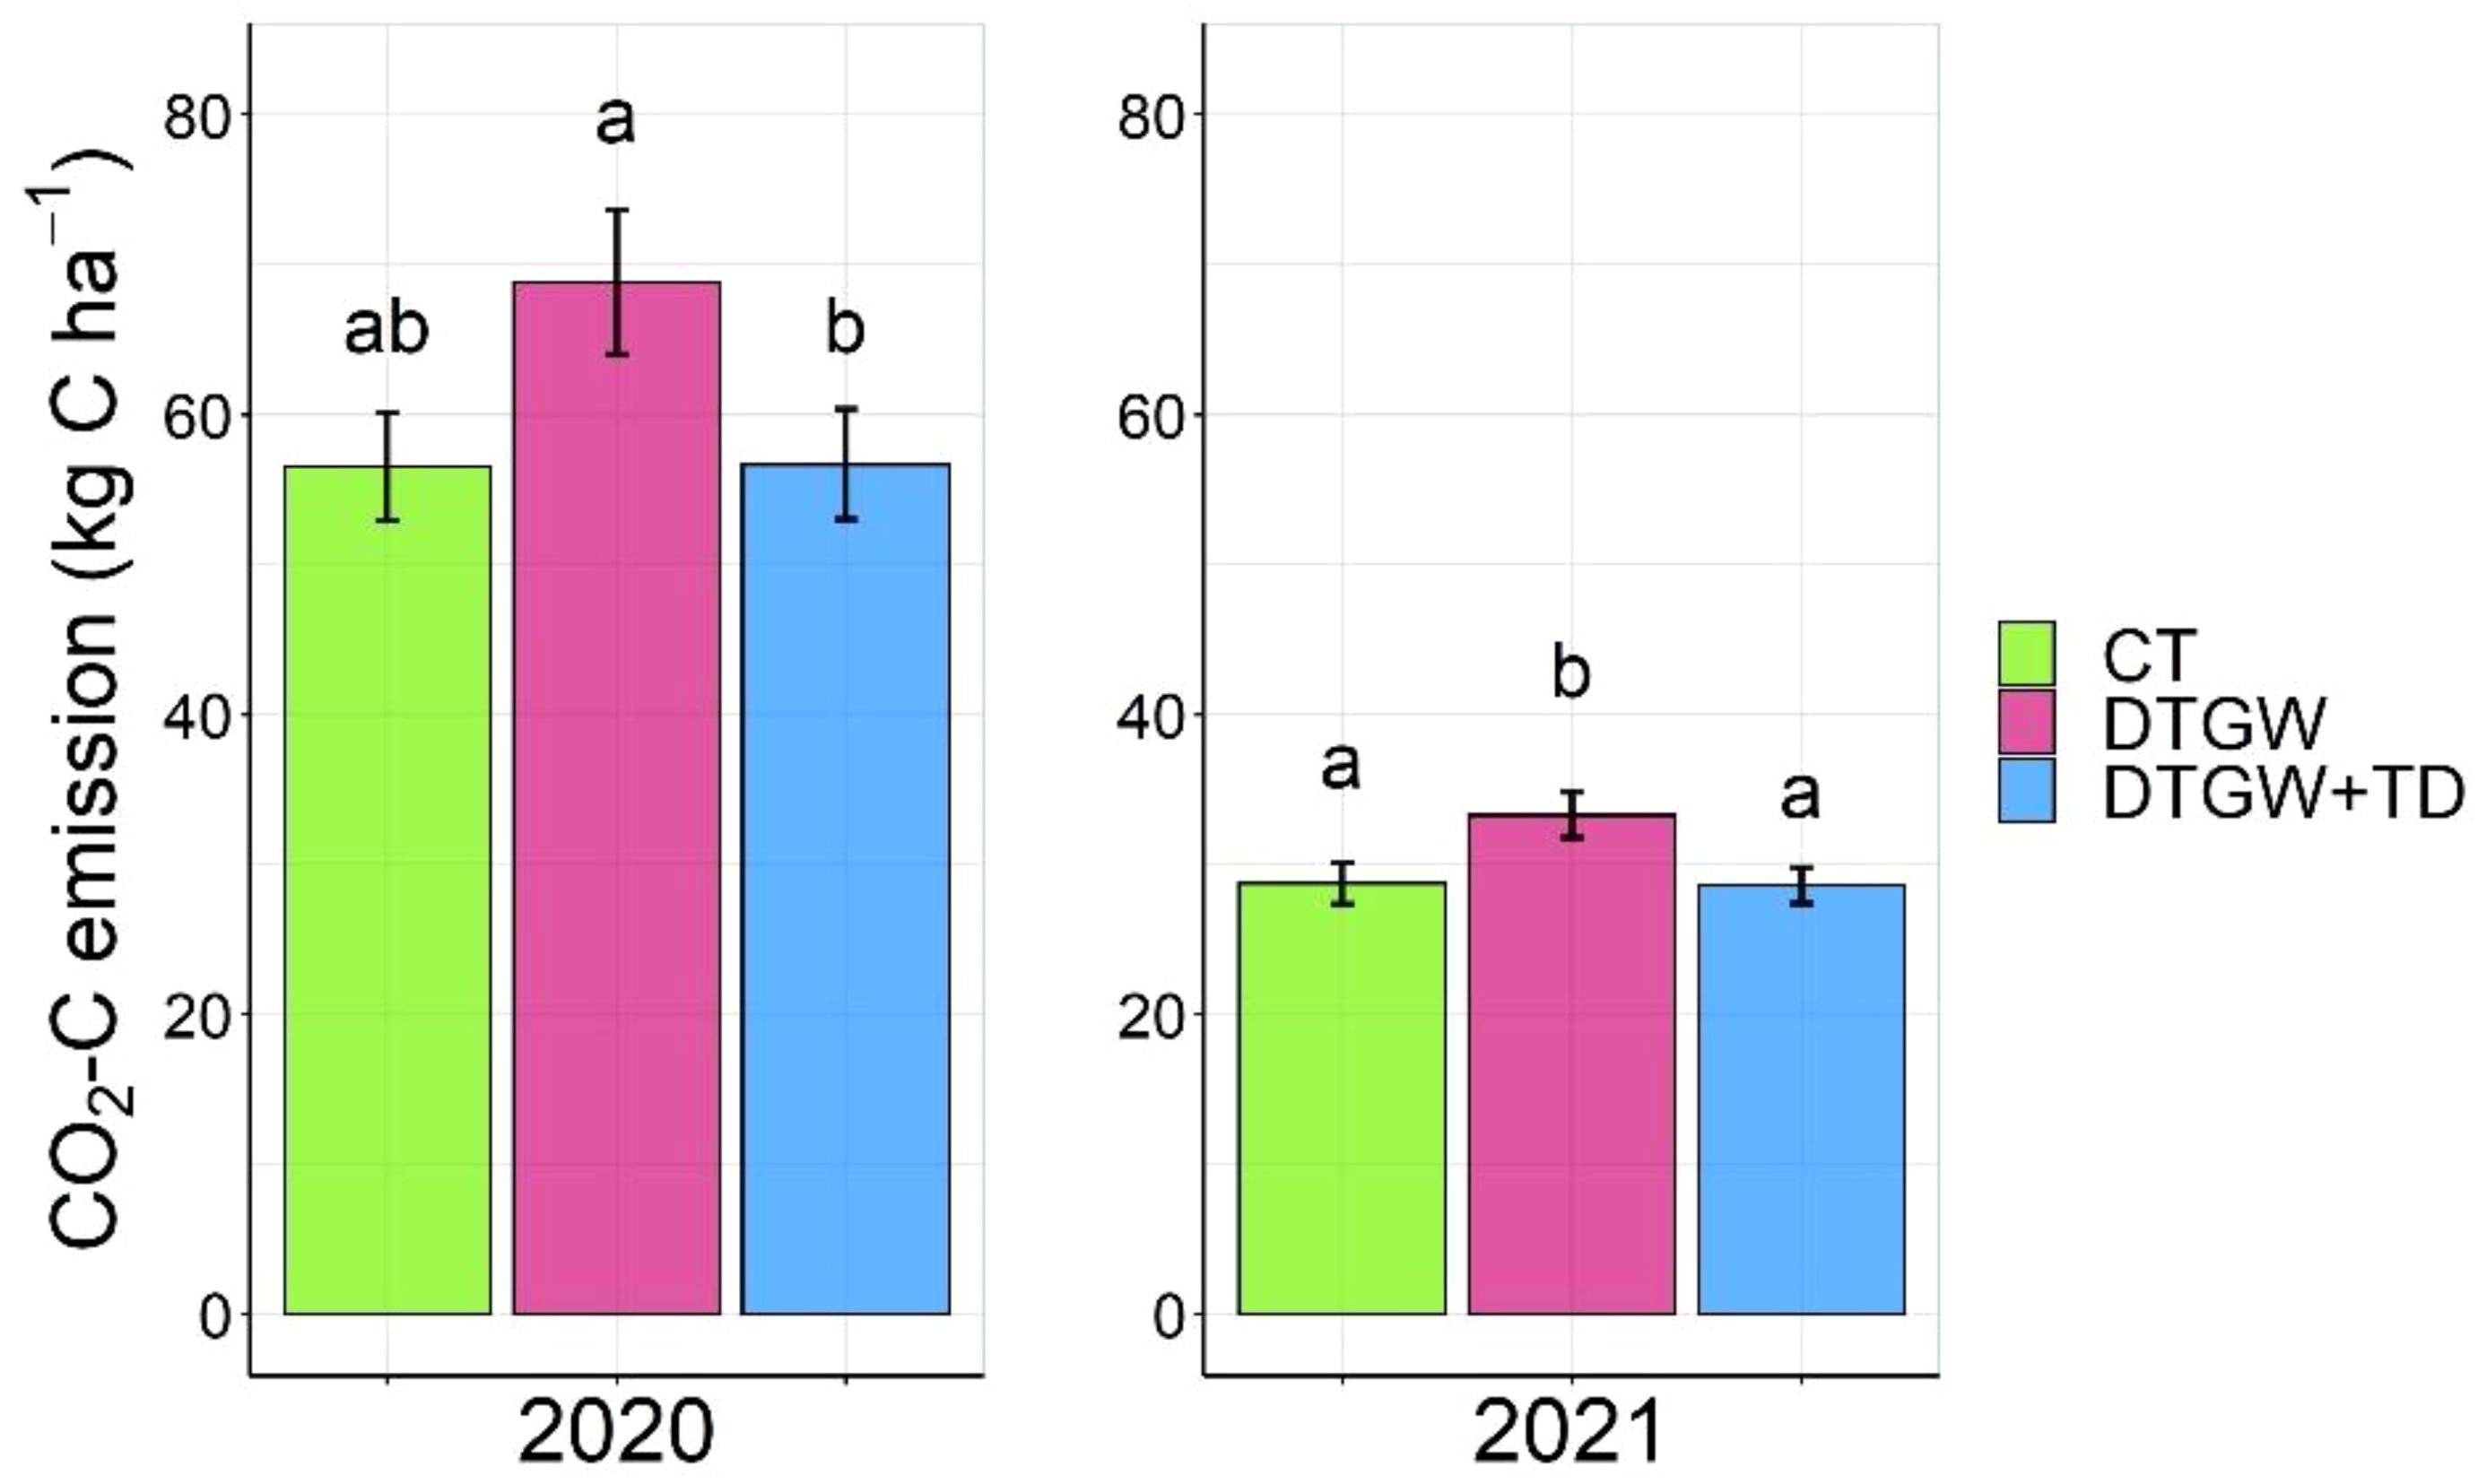
Figure 2. Mean daily fluxes (kg CO2-C ha-1) for three best management practice integration (BMPIs) systems – CT (contour tillage), DTGW (diversion terraces and grassed waterways), and DTGW+TD (diversion terraces, grassed waterways, and tile drainage) – in the 2020 and 2021 seasons. Error bars represent the standard error of the mean (n = 348). Different letters indicate a statistically significant difference between BMPIs using Tukey’s HSD (α = 0.05).
In either of the two years of this study, slope position did not have a significant effect on CO2 fluxes; similarly, the interaction between BMPI and slope position also did not have a significant effect on CO2 fluxes.
There were significant differences in total CO2 emissions among BMPI treatments in both 2020 (p = 0.018) and 2021 (p < 0.001) (Figure 3). In 2020, total C emitted from CO2 was 1640 ± 82.5, 1996 ± 112, and 1644 ± 74.7 kg C ha-1, while in 2021 total C emitted was 833 ± 27.0, 966 ± 33.8, and 830 ± 26.1 kg C ha-1 in CT, DTGW, and DTGW+TD, respectively.
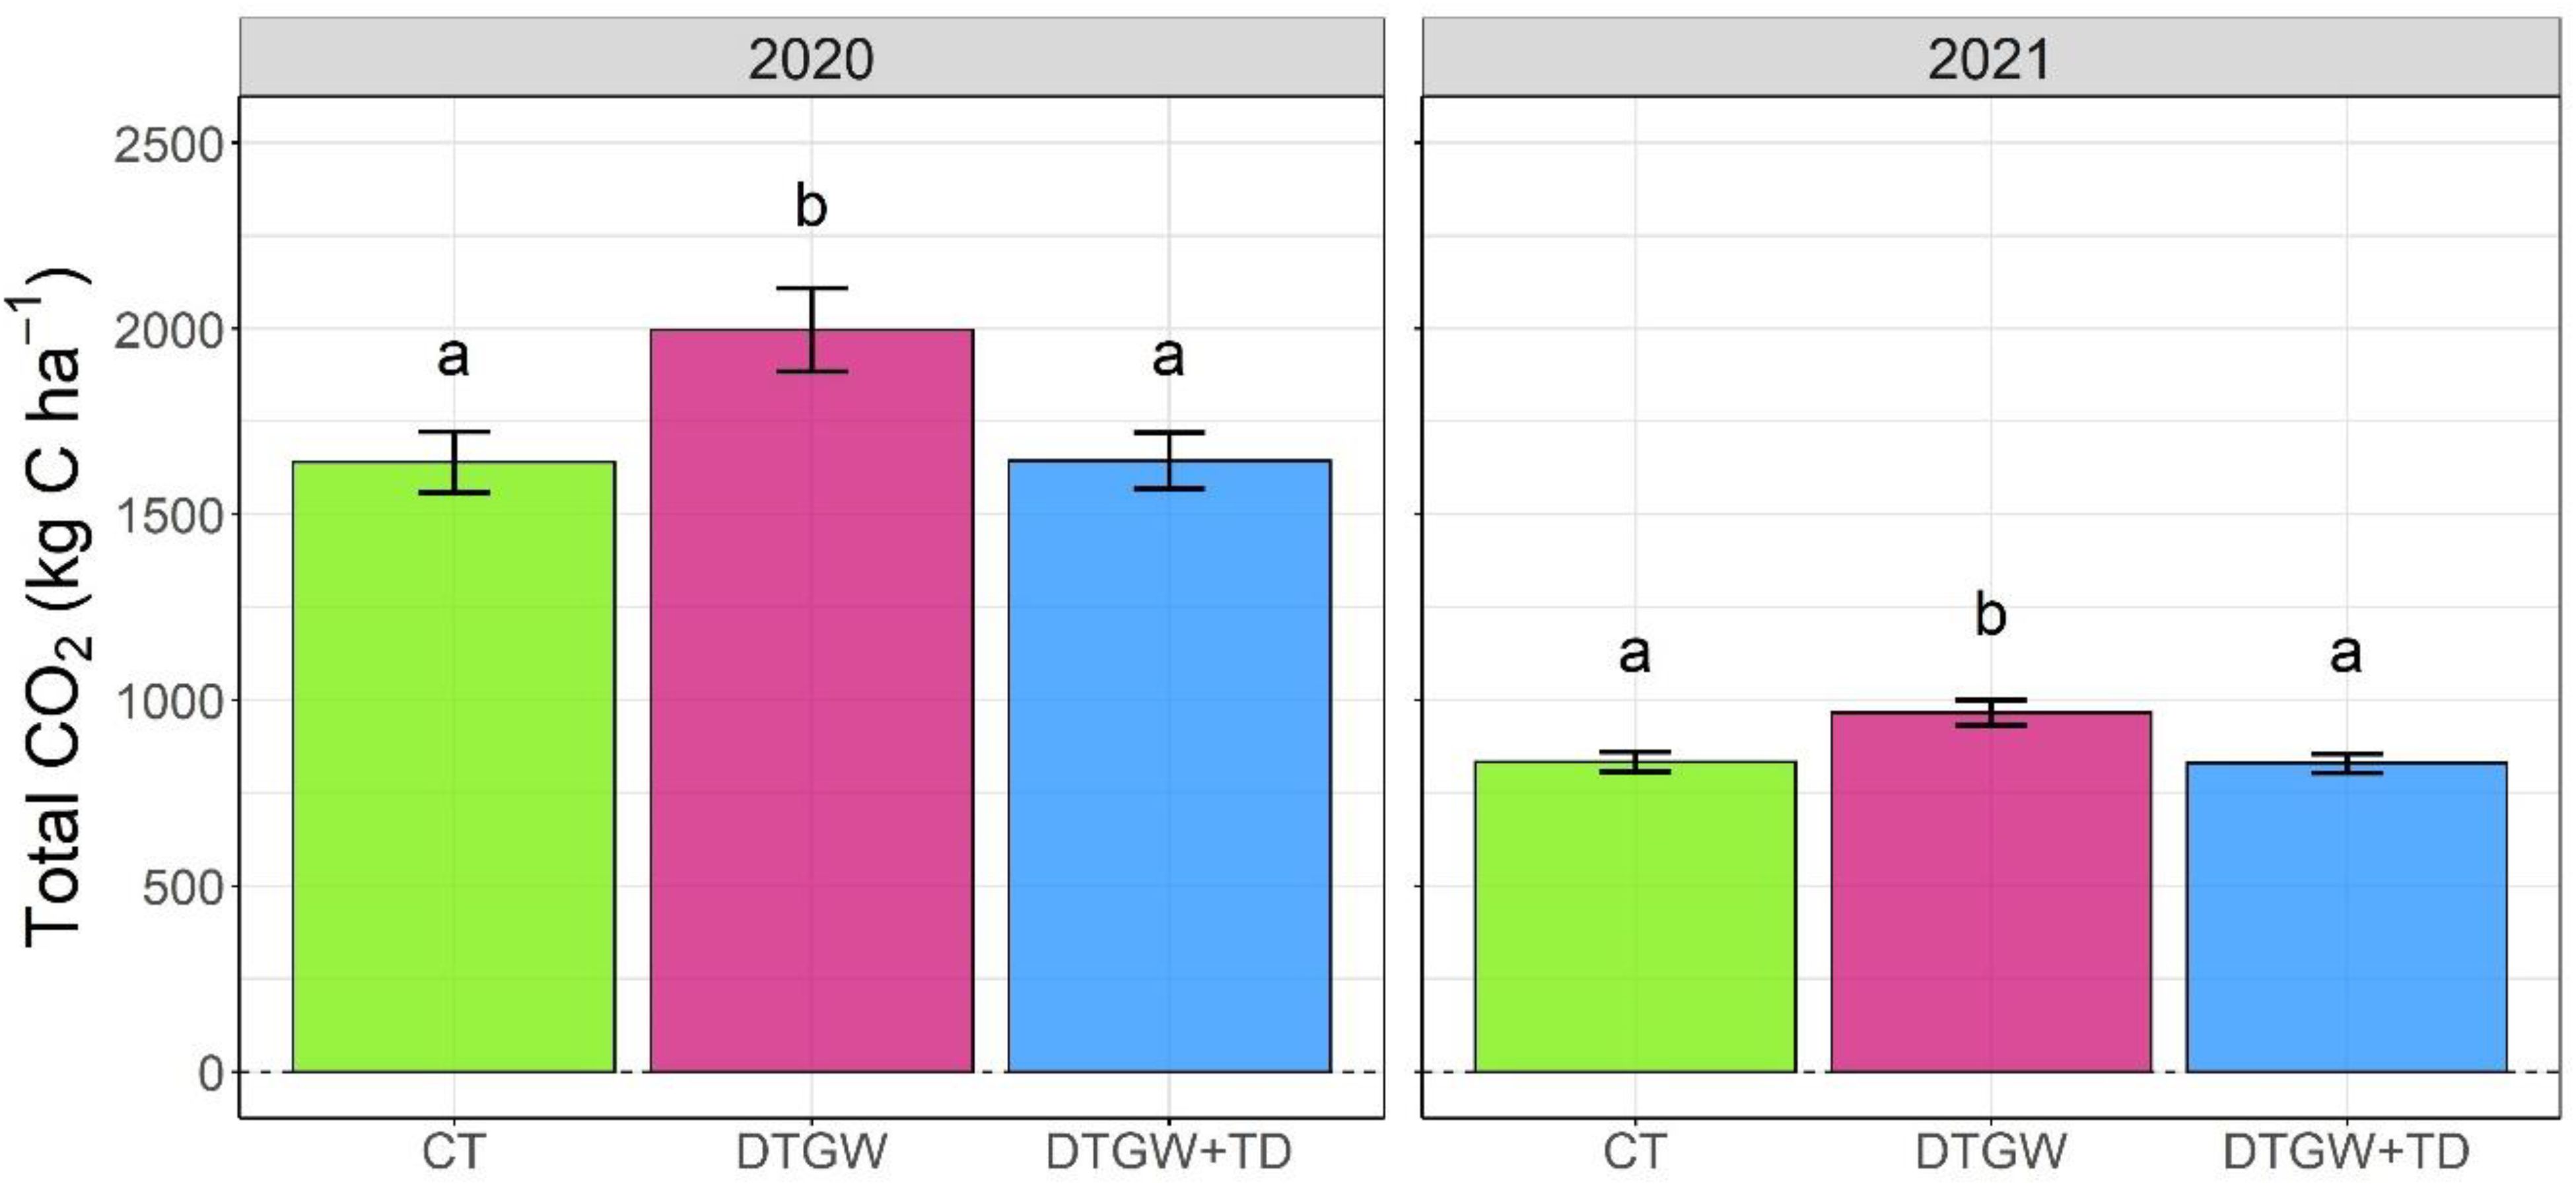
Figure 3. Total CO2 emissions (kg C ha-1) in 2020 and 2021 in three best management practice integration (BMPIs) systems – CT (contour tillage), DTGW (diversion terraces and grassed waterways), and DTGW+TD (diversion terraces, grassed waterways, and tile drainage). Error bars represent the standard error of the mean (n = 12). Different letters indicate a statistically significant difference between BMPIs (α = 0.05).
Fluxes of CO2 were only weakly correlated to soil temperature. Fluxes were positively correlated to soil temperature in 2020 (r = 0.27, p < 0.001, n = 803) and 2021 (r = 0.31, p < 0.001, n = 432). In 2020 and 2021 there was no correlation between CO2 fluxes and VWC.
In 2020, VWC averaged 0.158 ± 0.003, 0.169 ± 0.003, and 0.200 ± 0.005 m3 m-3, while in 2021, VWC averaged 0.278 ± 0.005, 0.311 ± 0.005, and 0.276 ± 0.001 m3 m-3 in CT, DTGW, and DTGW+TD, respectively. In 2020, soil temperature averaged 22.9 ± 0.3, 23.2 ± 0.3, and 24.1 ± 0.3°C, while in 2021, temperature averaged 21.5 ± 0.3, 21.2 ± 0.2, and 21.8 ± 0.3°C in CT, DTGW, and DTGW+TD, respectively. Soil temperature and VWC can be seen in Figures 4 and 5, respectively.
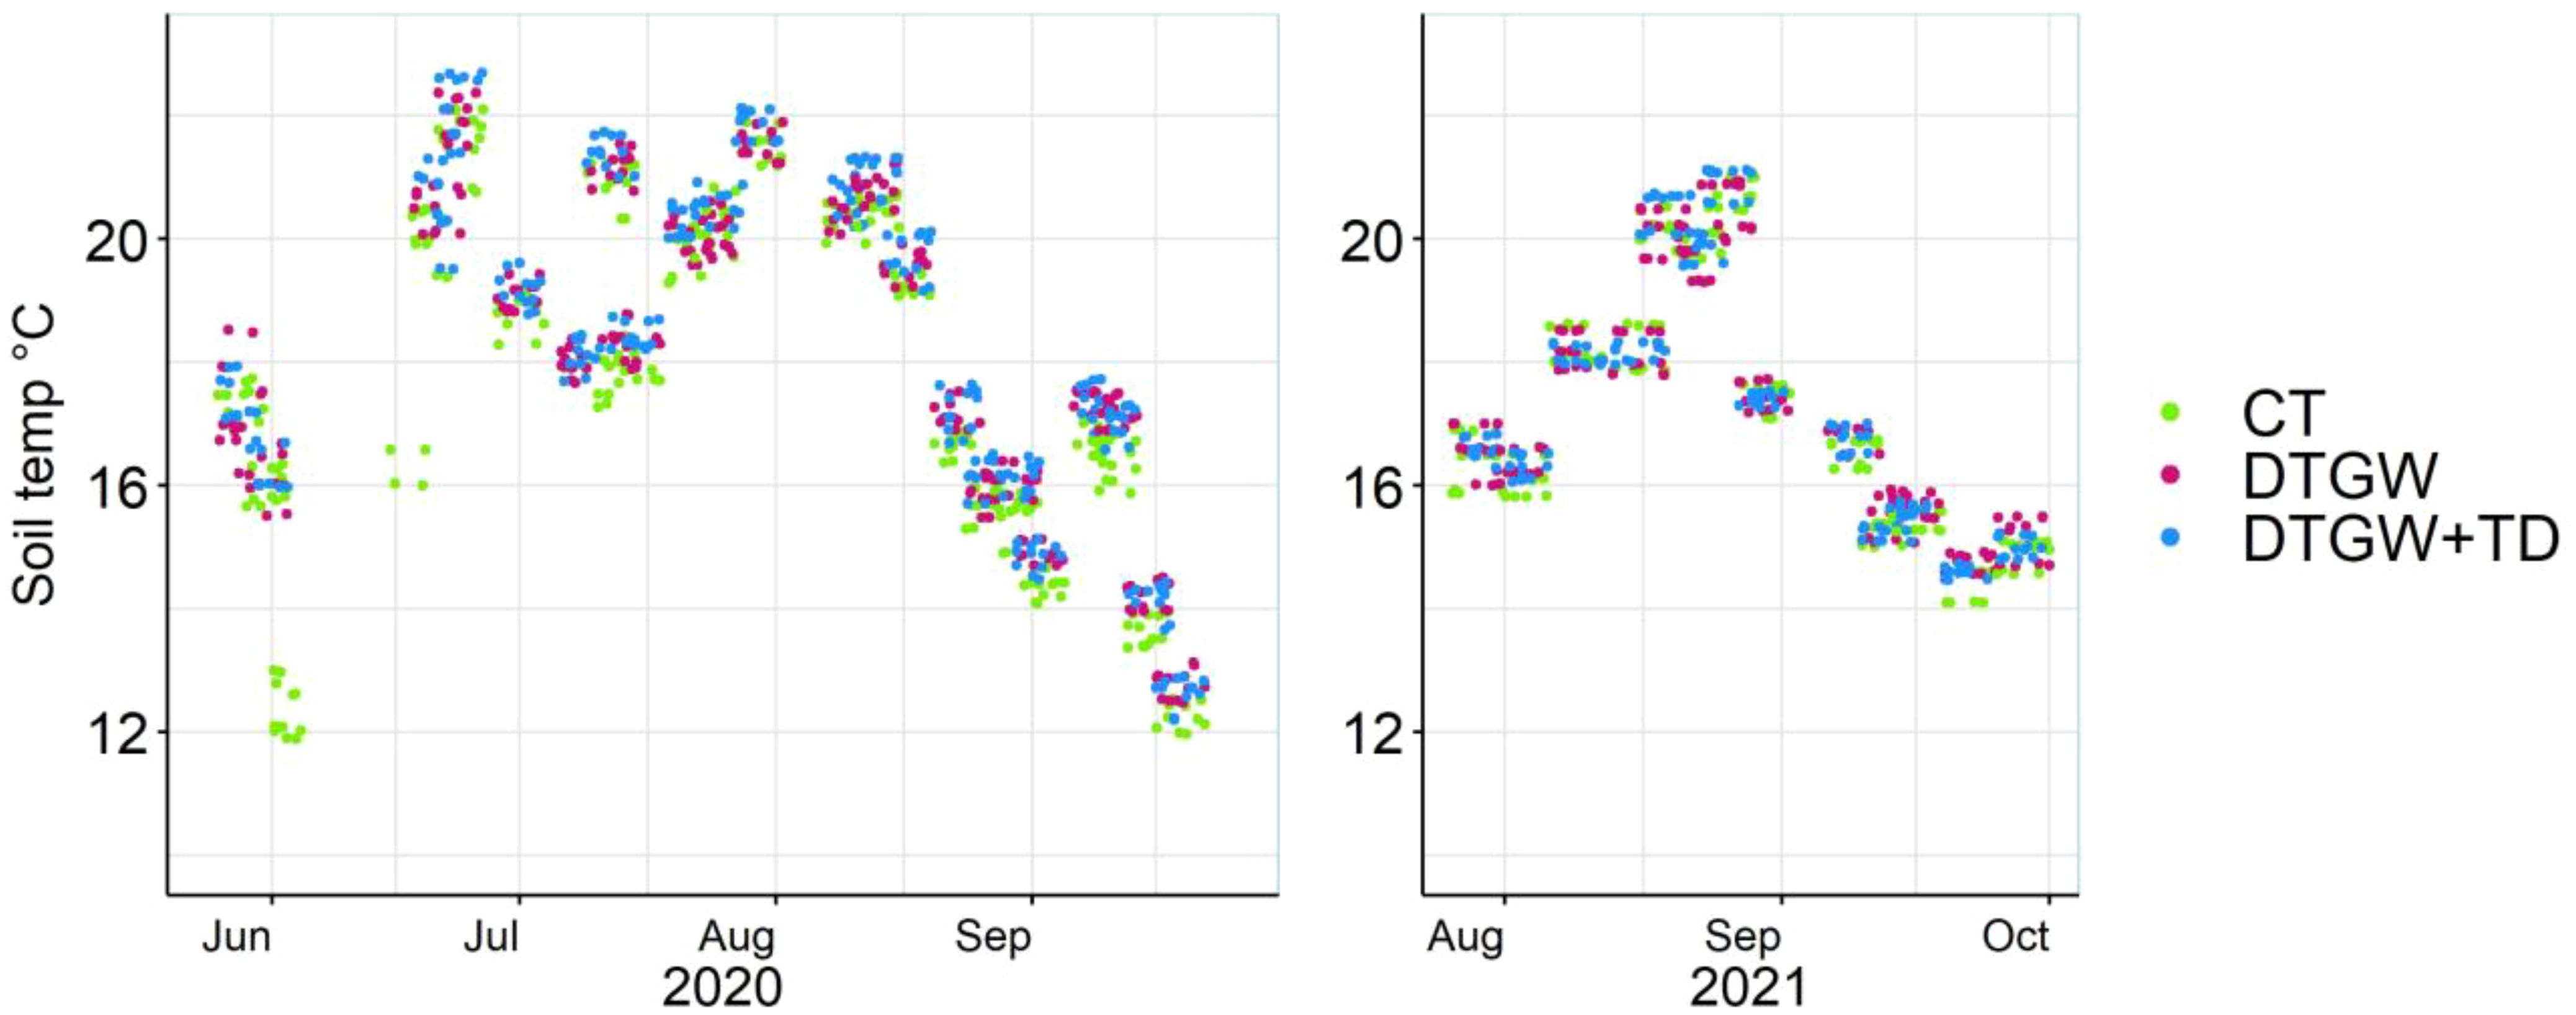
Figure 4. Soil temperatures in 2020 and 2021 for three best management practice integration (BMPIs) systems – CT (contour tillage), DTGW (diversion terraces and grassed waterways), and DTGW+TD (diversion terraces, grassed waterways, and tile drainage).
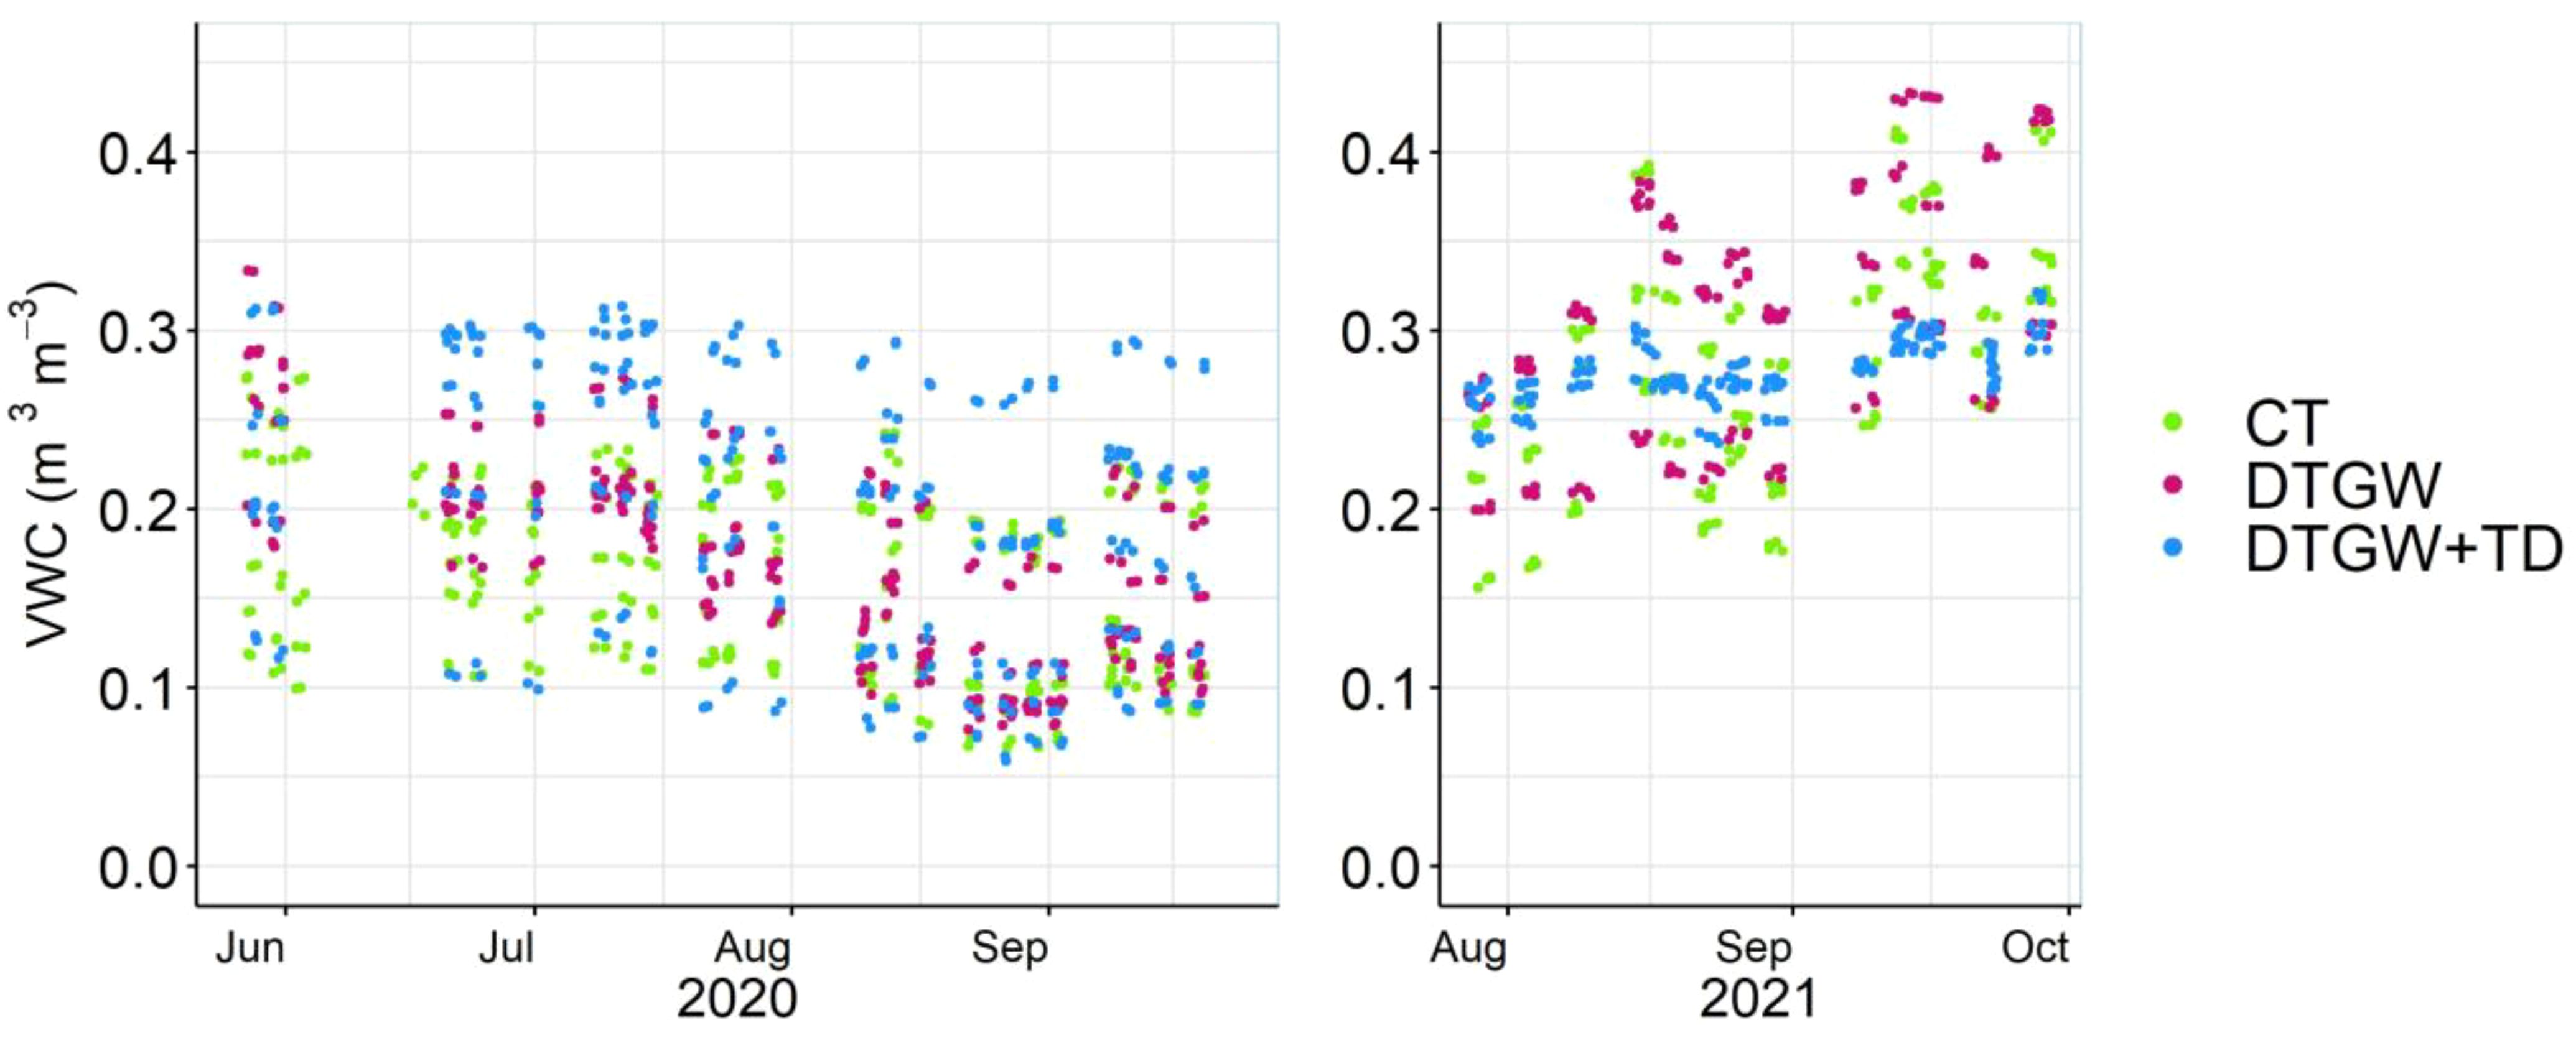
Figure 5. Soil volumetric water content in 2020 and 2021 for three best management practice integration (BMPIs) systems – CT (contour tillage), DTGW (diversion terraces and grassed waterways), and DTGW+TD (diversion terraces, grassed waterways, and tile drainage).
Nitrous oxide
Nitrous oxide was significantly affected by BMPIs (p < 0.01), slope position (p < 0.05), and soil water content (p < 0.001). There was also a significant effect of the interaction between BMPI and slope position (p <0.01) on N2O.
The N2O fluxes in DTGW were higher than in CT or DTGW+TD (Figure 6). The mean daily efflux (kg N2O-N ha-1) for CT, DTGW, and DTGW+TD across all 3 years was 0.0124 ± 0.002, 0.015 ± 0.0019, and 0.011 ± 0.0016, respectively. Mean VWC measurements (m3 m-3) in CT, DTGW, and DTGW+TD were 0.23 ± 0.01, 0.25 ± 0.01, and 0.24 ± 0.01, respectively.
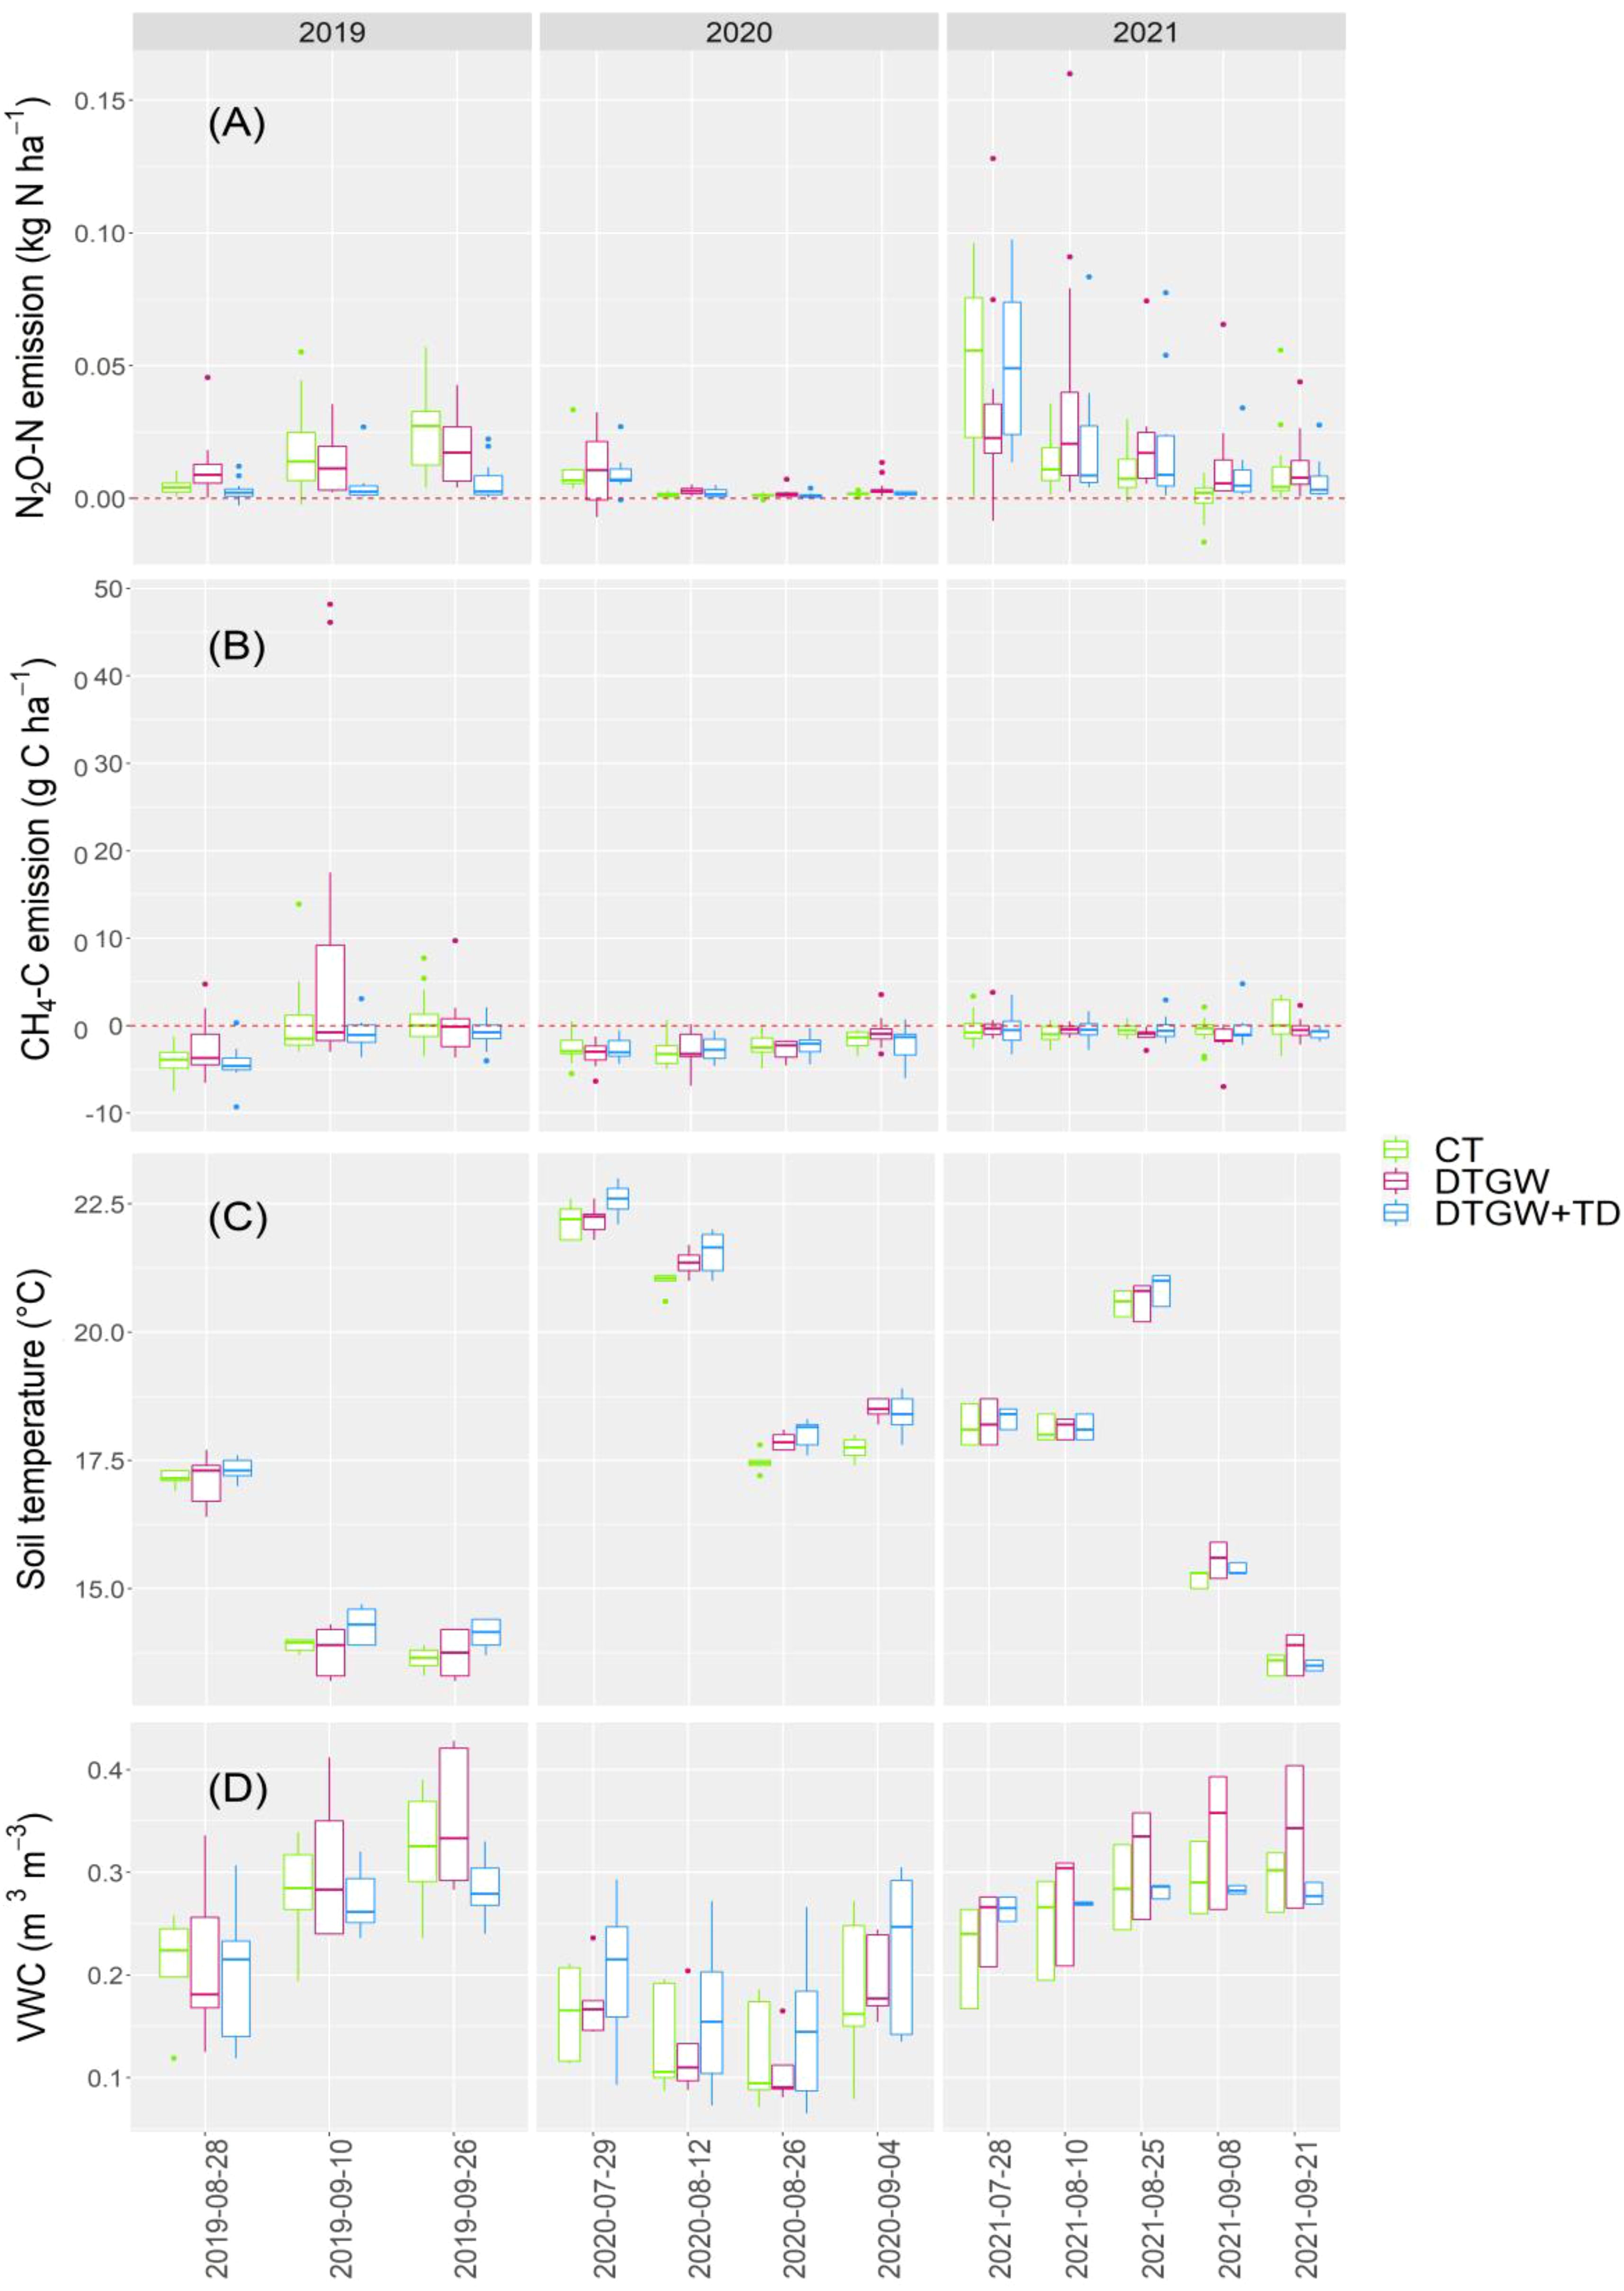
Figure 6. Mean daily fluxes of N2O (A) and CH4 (B) in 2019, 2020, and 2021, with soil temperature (C) and soil water content (D), and colored by the three best management practice integration (BMPIs) systems – CT (contour tillage), DTGW (diversion terraces and grassed waterways), and DTGW+TD (diversion terraces, grassed waterways, and tile drainage).
Mean daily effluxes from upper to lower slope positions were 0.0151 ± 0.002, 0.0130 ± 0.002, and 0.0106 ± 0.001 kg N2O-N ha-1 day-1, respectively. The upper slopes were the wettest and the lower slopes the driest. Soil VWC averaged 0.26 ± 0.01, 0.25 ± 0.01, and 0.22 ± 0.01 m3 m-3 top to bottom. The CO2 fluxes increased from top to bottom in the CT treatment. Conversely, CO2 fluxes increased from bottom to top in terraced BMPIs.
The only significant difference between BMPIs in total CO2e emission of N2O was observed in 2019 (p < 0.001) (Figure 7).
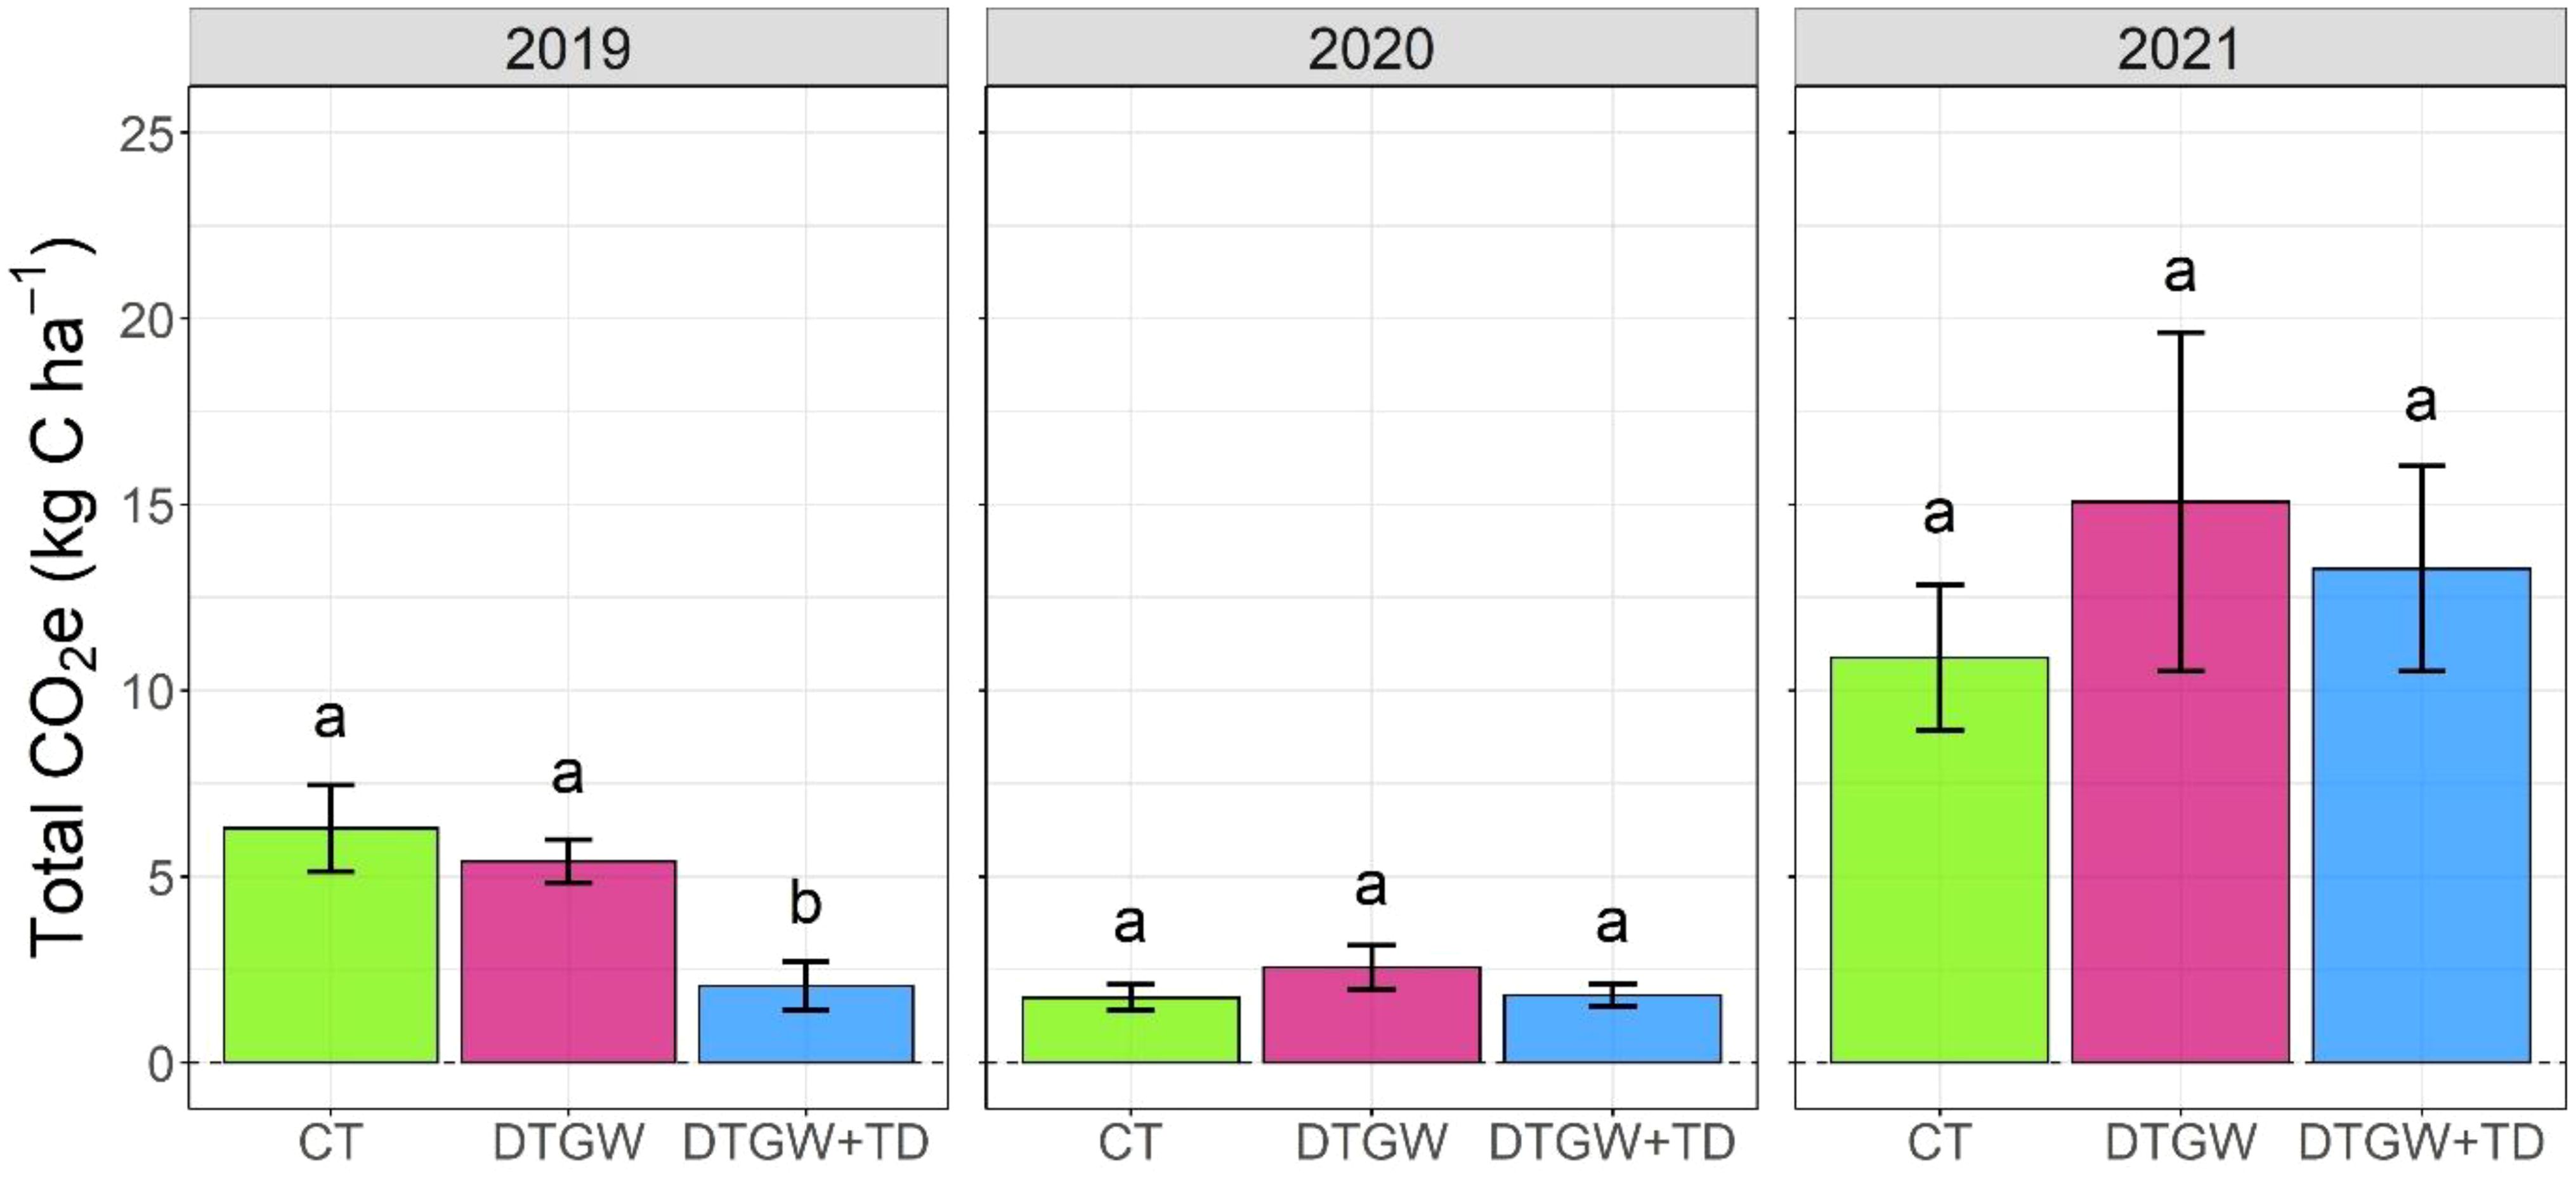
Figure 7. Total N2O emission for the 2019, 2020, and 2021 growing seasons expressed in CO2 equivalents (CO2e) (kg C ha-1) for three best management practice integration (BMPIs) systems – CT (contour tillage), DTGW (diversion terraces and grassed waterways), and DTGW+TD (diversion terraces, grassed waterways, and tile drainage). Error bars represent the standard error of the mean (n = 12). Different letters indicate a statistically significant difference between BMPIs (α = 0.05), but comparisons can only be made within year.
The VWC was not significantly affected by BMPI (p = 0.71) but was significantly affected by slope position (p < 0.01), where VWC at the lower slope position was significantly different from the mid (p < 0.01) and upper (p < 0.001) positions. N2O was positively correlated with VWC (r = 0.23, p < 0.001) across all three seasons but was not, however, significantly correlated with soil temperature (r = -0.01, p = 0.74).
Methane
Mean CH4-C fluxes across all years for CT, DTGW, and DTGW+TD were, respectively, -1.17 ± 0.2, -0.42 ± 0.5, and -1.56 ± 0.2 g ha-1 day-1. Methane fluxes were positively correlated with soil water content (r = 0.26, p < 0.001, n = 425) and negatively correlated with soil temperature (r = -0.24, p < 0.001, n = 425). There was a significant effect of BMPI and slope position on methane oxidation (p = 0.048). There were no significant differences in methane fluxes between BMPIs in 2019 (p = 0.08), 2020 (p = 0.86) or 2021 (p = 0.17) (Figure 8).
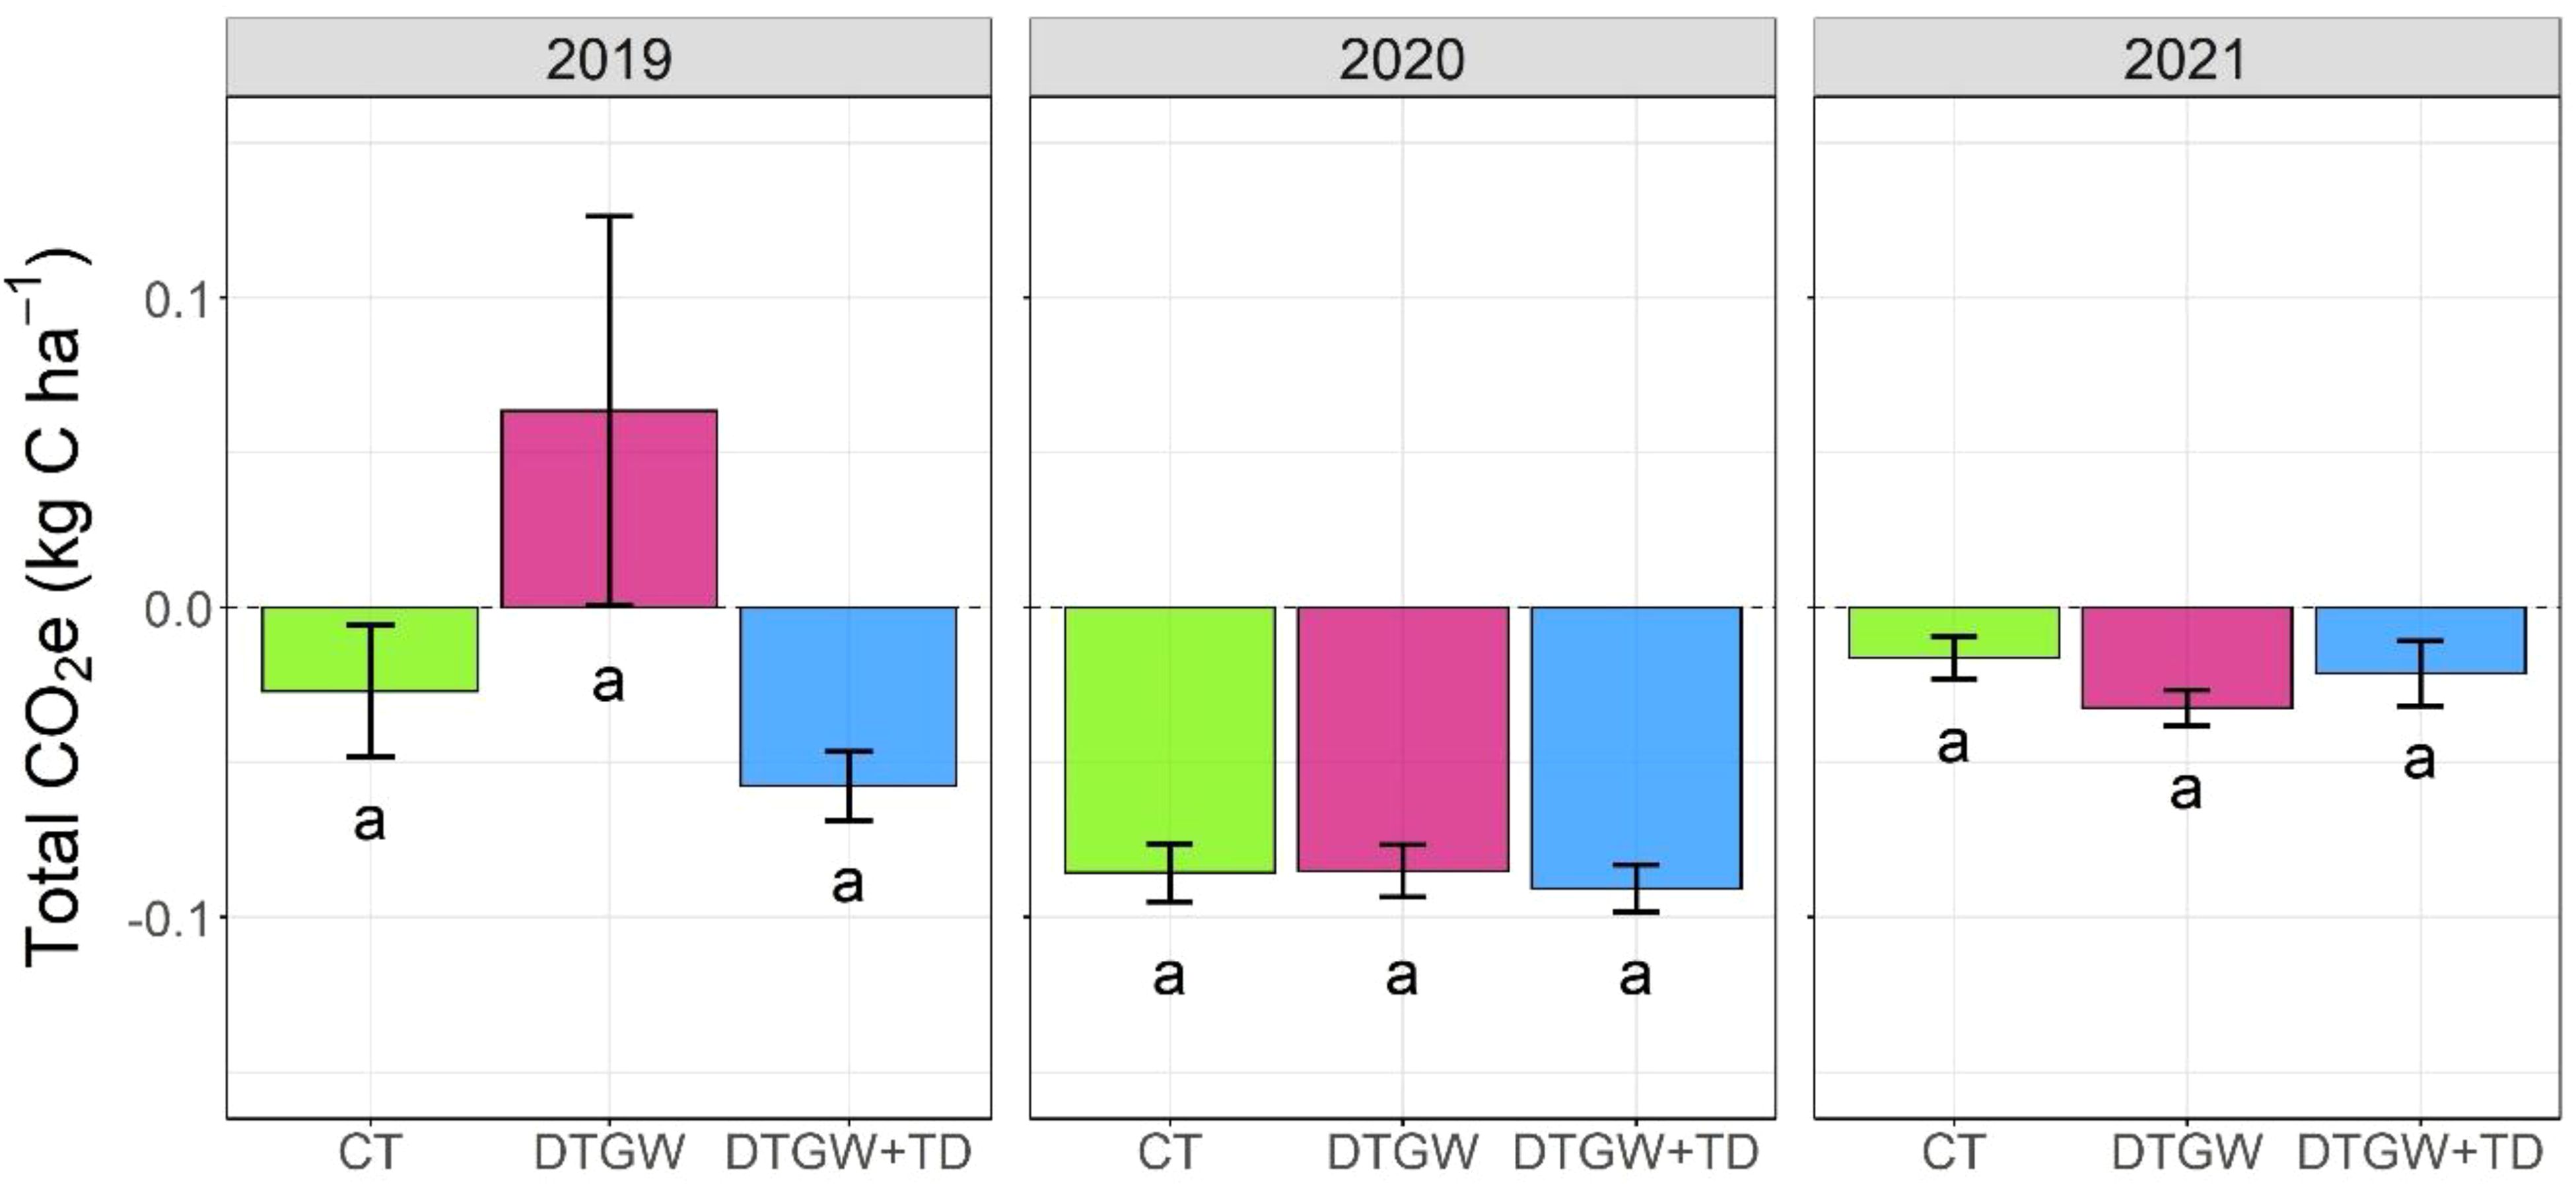
Figure 8. Total CH4 emission for the 2019, 2020, and 2021 growing seasons expressed in CO2 equivalents (CO2e) (kg C ha-1) for three best management practice integration (BMPIs) systems – CT (contour tillage), DTGW (diversion terraces and grassed waterways), and DTGW+TD (diversion terraces, grassed waterways, and tile drainage). Error bars represent the standard error of the mean (n = 12). Different letters indicate a statistically significant difference between BMPIs (α = 0.05), but comparisons can only be made within year.
The highest CH4 uptake by slope position (-1.6 ± 0.2 g ha-1 day-1) occurred in the lower slopes, which were ~16% drier than the upper slopes. This is in line with expectations for the driest soils. Upper and middle slope fluxes were -0.9 ± 0.2 and -0.7 ± 0.5 g ha-1 day-1.
Nitrate supply rate
In 2020, there was a statistically significant interaction between BMPI and slope position (p = 0.017). In 2021, not one of BMPI (0.65), slope position (0.33), or their interaction (0.41) was significant.
In 2020, the highest nitrate supply rates were observed in DTGW between July 2nd and July 28th at 404 ± 50.5 µg cm-2 (Figure 9). Nitrate supply rates in 2020 were highest in DTGW in each of the four measurement periods. In 2021, there was no clear pattern of one BMPI being consistently higher or lower than others.
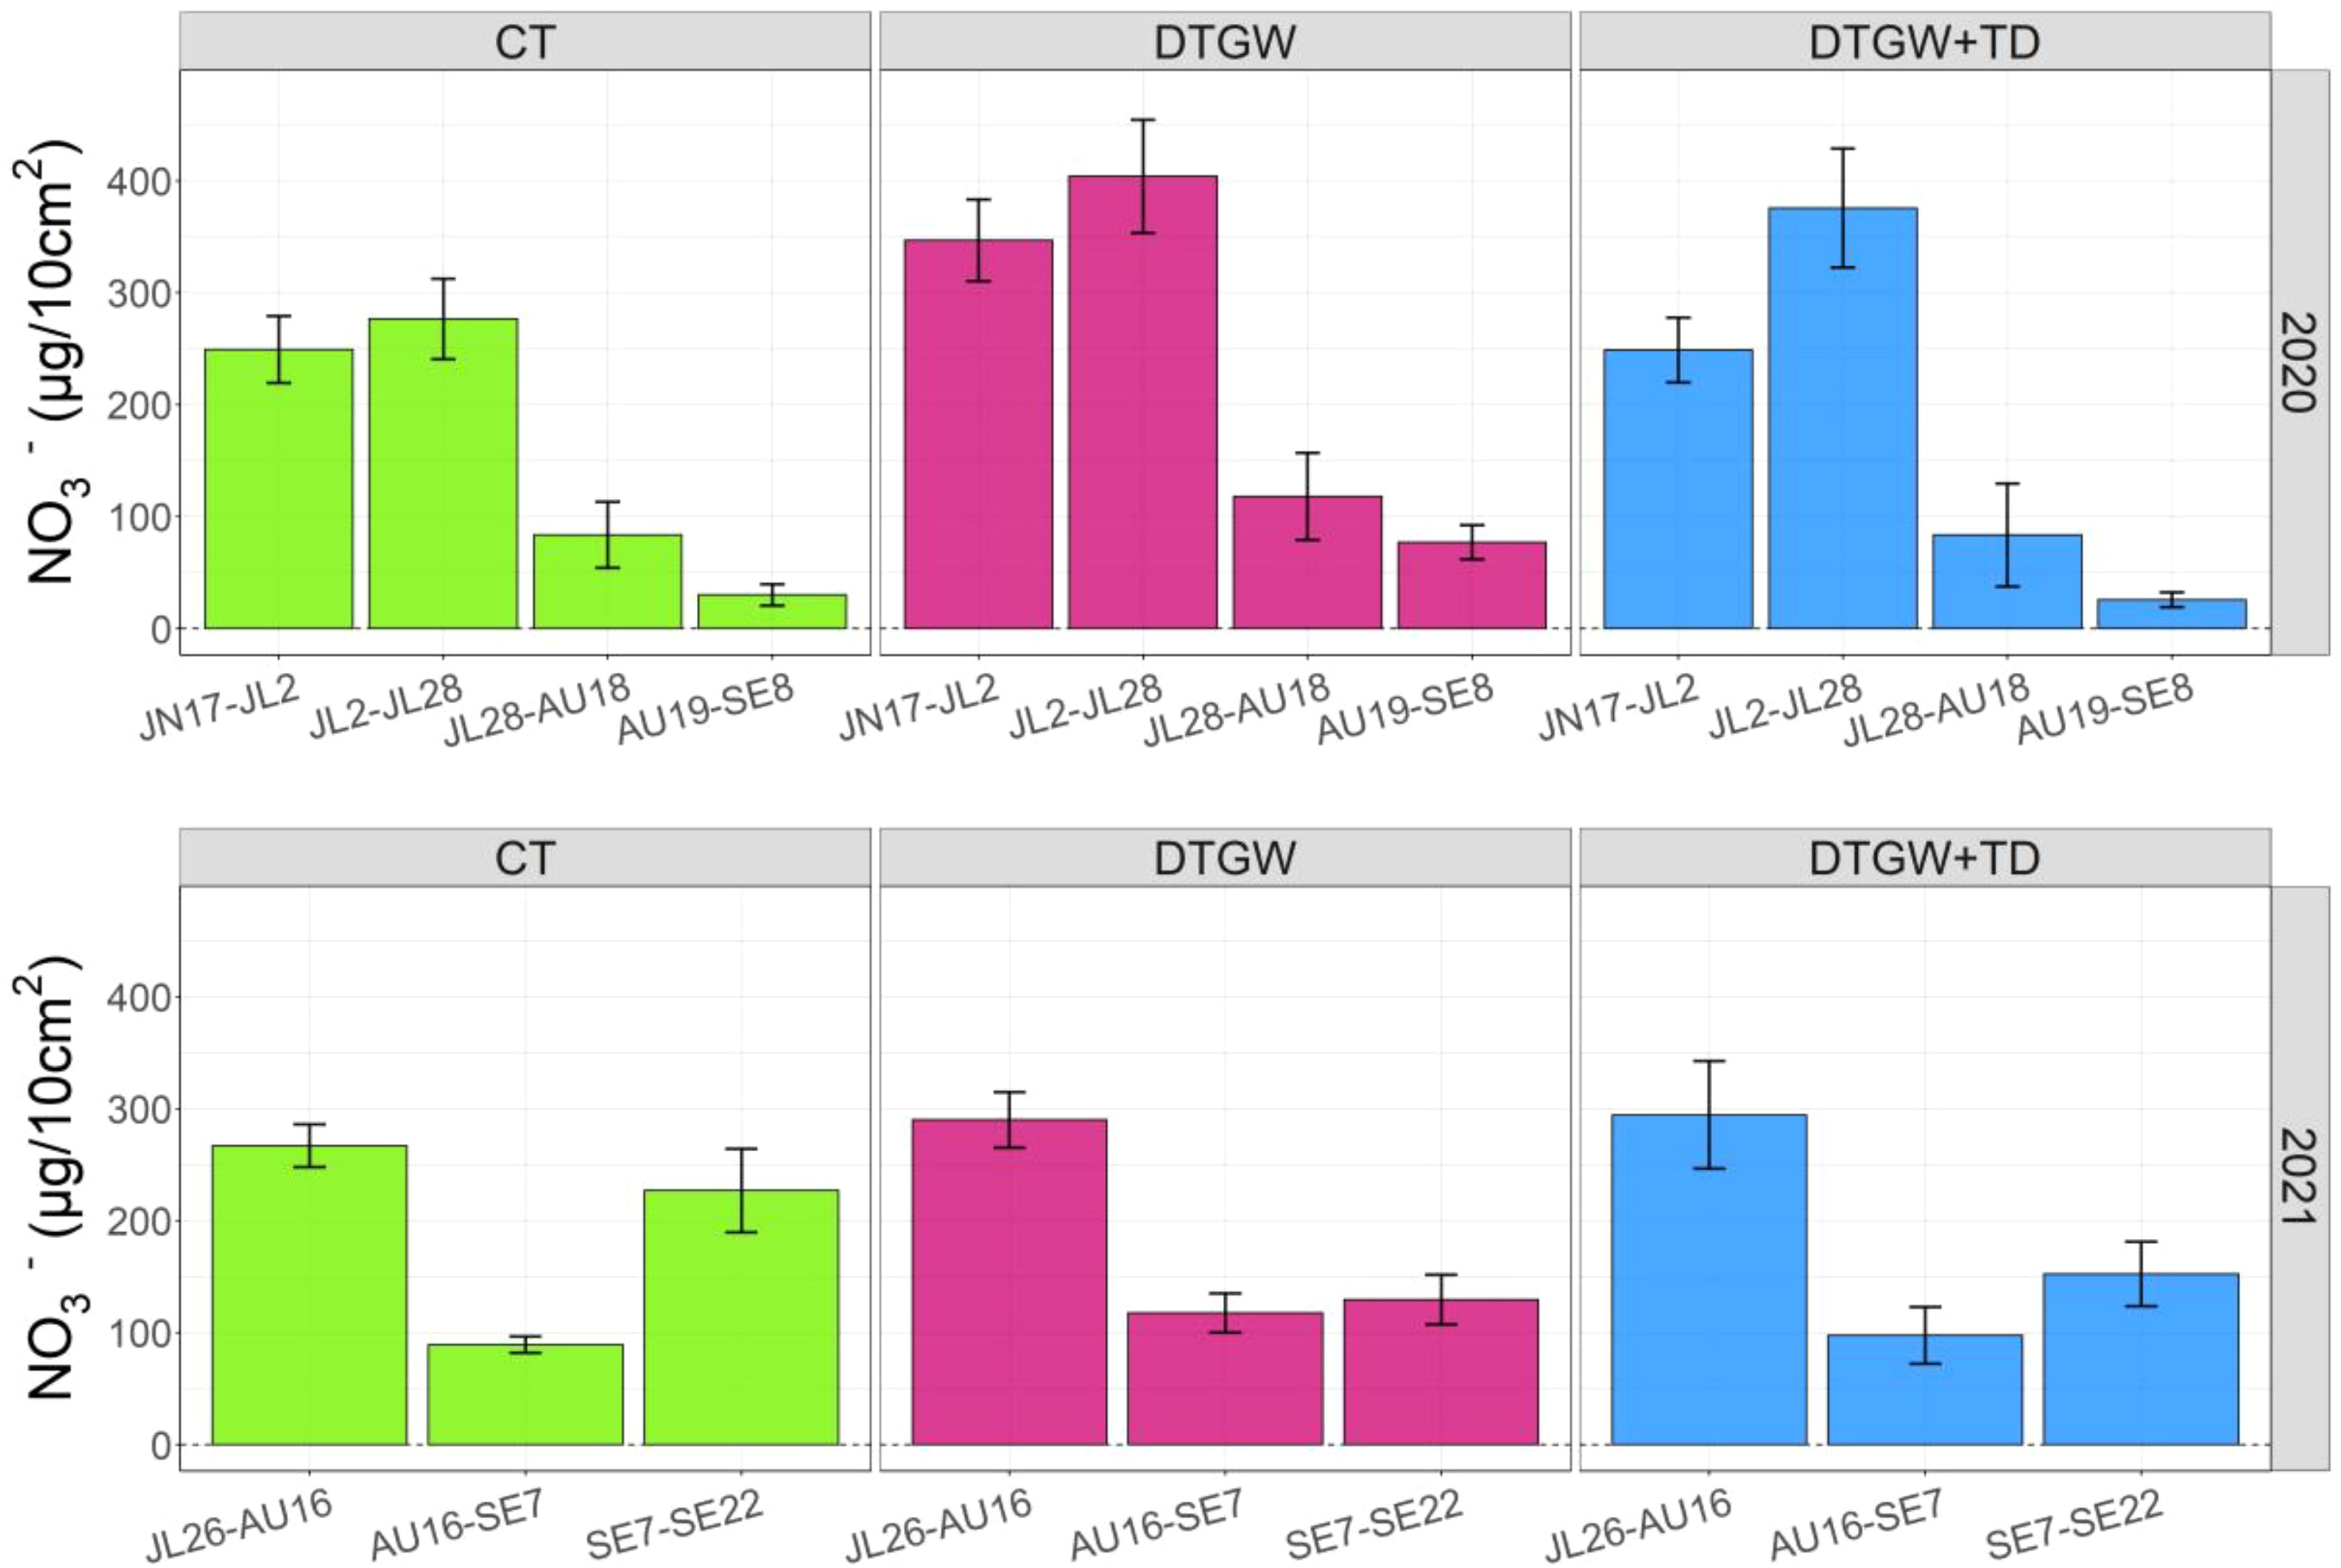
Figure 9. Effect of three best management practice integration (BMPIs) systems – CT (contour tillage), DTGW (diversion terraces and grassed waterways), and DTGW+TD (diversion terraces, grassed waterways, and tile drainage) on nitrate supply rates measured in (top) 2020 and (bottom) 2021. The four sampling periods in 2020 were: (1) June 17 – July 12; (2) July 2 – July 28; (3) July 28 – August 18; and (4) August 19 – September 8. The three sampling periods in 2021 were: (1) July 26 – August 16; (2) August 16 – September 7; and (3) September 7 – September 22. Error bars represent the standard error of the mean (n = 12).
Rates in the July 26th to August 16th period of 2021 were 198% higher than between the similar period of July 28th and August 18th of 2020. Rates in the August 16th to September 7th period of 2021 were 128% higher than between the similar period of August 19th to September 8th, 2020.
The only significant correlation in 2020 between nitrate supply rate and N2O fluxes occurred between the burial period of August 19th to September 8th and the N2O fluxes from September 4th. No nitrate supply rates significantly correlated to N2O fluxes in 2021.
Discussion
Carbon dioxide
The general CO2 flux trend between years was different than that of N2O. While N2O fluxes were minimal in 2020 and higher in 2019 and 2021, CO2 fluxes were, on average, higher in the hotter and drier 2020 than in 2021. As suggested by Larcher (42), rising temperatures most likely increased metabolic rates, leading to increased microbial respiration in 2020. Temperature rises can increase CO2 fluxes exponentially up to a certain point (43, 44). Potatoes are also associated with lower CO2 fluxes relative to other major crops (45–47) and could also help explain the lowered 2021 fluxes. For example, CO2 emissions have been demonstrated to be lower for potatoes than sweet corn (46). However, CO2 fluxes from that study represented microbial and plant root respiration, whereas in our study plant root respiration was excluded.
In each year, DTGW total emissions were significantly higher than in CT or DTGW+TD (Figure 3). The frequent soil disturbances caused by tillage in potato production often break down soil aggregates and enhance organic matter decomposition (48). At this study site, there were no significant differences in aggregate stability change among the three BMPIs between July of 2020 and October of 2021 (10). Nor were there any significant changes in total SOC. Hence, significantly higher CO2 fluxes in DTGW, relative to CT and DTGW+TD, cannot be attributed to higher organic matter decomposition rates from destruction of soil aggregates or changes in total SOC.
However, there were changes in other carbon fractions that occurred over the duration of this study (10). These fractions included permanganate-oxidizable carbon (POXC), free light particulate organic matter (fPOM), and occluded POM (oPOM). These C fractions have been shown to play an integral governing role in the emission of CO2 from soil to the atmosphere. For instance, Hassan et al. (49) showed in an incubation experiment that POXC, fPOM, and oPOM, among other labile fractions, had highly significant positive correlations with CO2 emissions. Other studies have demonstrated that fPOM and CO2 emissions are in high qualitative agreement with each other and are highly correlated (50–52). However, what was seen in the changes in labile C fractions at this study site does not reflect the CO2 fluxes observed. Driscoll et al. (10) observed a 19.8% and 50.6% increase in POXC in DTGW and DTGW+TD, respectively, between July of 2020 and October of 2021, while CT lost 11.2%. Yet the pattern of total CO2 emission in 2021 remained identical to 2020. Furthermore, CT lost the most fPOM and oPOM over the same duration, while DTGW+TD lost the least. Yet in both years CT and DTGW+TD did not emit significantly different amounts of CO2.
Soil moisture and temperature are the most important environmental controls influencing the decomposition of organic matter in soils, which leads to the release of CO2 to the atmosphere (53). While higher soil temperatures in 2020 than in 2021 may help partially explain higher 2020 total CO2 emissions, soil temperatures between BMPI in either year did not vary much (Figure 4). Soil temperatures in CT were lower than in DTGW or DTGW+TD in 2020, but the differences were only marginal. However, given the exponential relationship between soil temperature increase and CO2 fluxes, this could help explain the difference in total emissions between CT and DTGW in the first season. There were little soil temperature differences in the two terraced BMPIs in either year, suggesting that perhaps soil moisture dynamics played a larger role in the significantly larger total emission of CO2 in DTGW each year. One of the most common benefits of subsurface drainage is faster warming of soil – particularly in the spring – and increased soil temperatures (54, 55). One Minnesota study on a coarse-textured loam and a finer-textured clay loam soil found that subsurface drainage increased soil temperatures in each case by up to 4°C, primarily between May and July (56). However, we did not record such differences.
The effect of tile drainage on VWC was clear in the wetter 2021, where VWC stayed mostly flat in DTGW+TD from late July through late September (Figures 5, 6). Whereas in CT and DTGW, VWC levels rose more dramatically in the same time frame. Surprisingly, this did not seem to translate into temperature differences between BMPIs. However, corresponding temperature increases to subsurface drainage have been found to be highest at 30-60 cm depth (56) and may help explain the lack of differentiation at 15 cm depth in our study. As expected, VWC levels in DTGW were the highest in 2021 and are the most likely contributor to the higher CO2 fluxes. The VWC levels in 2019 closely resemble those of 2021.
Nitrous oxide
The N2O fluxes in 2020 were much lower than in 2019 or 2021 (Figure 7). This can be explained by two factors. First, the summer of 2020 was abnormally hot and dry, thus keeping soil moisture low and inhibiting denitrification processes that occur in saturated and anaerobic soil conditions. Furthermore, the N fertilization rate in 2020 on the oat crop was low – about 30% as much as was applied in 2021 on the potato crop. This resulted in very low 2020 N2O fluxes. Conversely, in the 2019 and 2021 growing seasons, where VWC was higher than in 2020, N2O fluxes were higher. As could be expected, fluxes were highest in 2021, when N fertilization rates were highest and soil temperature and water content were in normal ranges.
The N2O fluxes in this study are in line with fluxes from conventional New Brunswick potato farming experiments that took place at the same research station and ranged between 0 and 0.04 kg N2O-N ha-1 day-1 (57).
Fluxes of N2O by BMPI did not follow the soil water trend. While DTGW had both the highest N2O fluxes and VWC, CT had the lowest soil water content, and DTGW+TD had the lowest average N2O efflux – slightly below the conventional contour tillage and ~26% below DTGW.
The tile drainage appeared to help regulate soil water relative to its terraced counterpart (Figures 5, 6). In both 2019 and 2021, soil water in DTGW+TD trended below the other BMPIs. In 2021, there were no changes in VWC for nearly two months in DTGW+TD, while VWC consistently increased in the other BMPIs. This water regulation from tile drainage likely aided in lowering N2O fluxes. Denitrification is the dominant source of N2O in humid climates such as Atlantic Canada (15). When soil VWC approaches saturation, denitrification processes start to release more N2O to the atmosphere under anaerobic conditions (58, 59). This commonly takes place at a water-filled pore space (WFPS) of 0.7 m3 m-3 (60) – or roughly a VWC of 0.36 m3 m-3. In our study, VWC in DTGW+TD never reached this value, while on four occasions VWC in DTGW reached or exceeded 0.4 m3 m-3. We expected to observe greater VWC in both terraced BMPIs, leading to higher N2O fluxes. But while both BMPIs had higher average VWC than CT, DTGW+TD emitted the least amount of N2O.
Burton et al. (61) stated that lower landscape positions have greater water contents for greater periods of time, leading to potentially greater denitrification and N2O fluxes. This was in contrast with results from this study – overall fluxes were the highest in upper slopes and the lowest in lower slopes.
Nitrate supply rate
Research has shown that nitrate (NO3-) supply rates measured with PRS-probes often decline with declining soil water content (62). This at first seems to align with the higher supply rates seen in the wetter 2021, where VWC was much higher in all BMPIs, between comparable 3-week periods in 2020 (i.e.: JL28-AU18, 2020 to JL26-AU16, 2021). However, higher N fertilization rates may have been contributing to the higher NO3- supply rates. The N fertilization rate in 2021 after potato planting was 233% higher than after 2020 oat planting. Nitrate supply rates were initially high in 2020 and continued for six weeks, likely due to the fertilizing that took place two days prior to the first installation of probes. The hot and dry summer was likely the source of the large drop in supply rate after July 28th, 2020, when rains in August dropped substantially. Nitrate supply rates from the first burial period in 2021 were nearly as high as from the first measurement period of 2020, despite beginning 49 days after potato planting and beginning 39 days later relative to the first burial period in 2020. Potato farming in Atlantic Canada uses high N fertilization rates, and the 190.5 kg N ha-1 used on June 7th likely contributed to sustained NO3- supply through June and July of 2021.
Best management practice integration systems and slope position only had an effect on NO3- supply rates in the 2020 growing season. Relative to CT and DTGW+TD, DTGW had the highest rates in all four periods of 2020. One possible explanation for the lack of effect of BMPIs on NO3- supply rates in 2021 might be related to the position of the PRS probes, which were placed in potato ridges in 2021. The potato ridges might be more homogenous across BMPIs since they are raised above the furrow. Furthermore, the differences in soil water between BMPIs may not be as pronounced in the ridges as they are 15 cm belowground where VWC was measured. In a fertilizer study in potatoes at the Fredericton Research and Development Centre between 2008 and 2010, NO3- supply rates were typically much higher across all treatments in the ridge than in the furrow (63). Soil water content in 2021 was clearly more regulated in DTGW+TD. Yet, aside from a spike in CT in the final burial period, NO3- supply rates were nearly identical across BMPI in each burial period. This is surprising, since Qian & Schoenau (64) found no threshold of soil moisture above or below which the NO3- supply rates would stop increasing or decreasing. It is surprising that the supply rates would only be significantly affected by BMPI in the abnormally hot and dry year.
Only once in 2020 were NO3- supply rates correlated to corresponding periods of N2O fluxes. Supply rates and N2O fluxes in 2021 did not correlate at any point. Despite BMPI having an effect on NO3- supply rates in 2020, there was no significant difference in total N2O emitted in 2020 between BMPIs. Nor was there a significant difference in total N2O emitted between BMPIs in 2021. However, total emissions of N2O in DTGW tended to be higher each year. Emissions of N2O and NO3- supply rates have previously been linked. Hangs and Schoenau (65) found that a reduction in N2O emissions was principally influenced by a decrease in nitrate supply, due to the addition of biochar amendments on two different Saskatchewan soils. On similar soils at the FRDC, Zebarth et al. (63) found that there was a strong positive relationship between N2O emissions and nitrate exposure in three seasons studying controlled release fertilizer effects in potato production. Other previous studies have also reported that cumulative growing season N2O emissions increased linearly with increasing nitrate exposure in a given year in Eastern Canadian barley and potato crops (57, 66). In Zebarth et al. (63), the magnitude of emissions for a given NO3- supply rate varied among years, indicating the potential role of other factors that might influence N2O emissions (e.g., lower rainfall in a given year or larger proportion of emissions early in a growing season before soil nitrate concentrations had not yet been depleted from plant uptake). Similarly, Zebarth et al. (66) also found relationships between N2O emissions and nitrate exposure to vary among 3 years of barley production. While the N2O emissions trends in 2020 and 2021 were similar (i.e., higher in DTGW but not significantly different), the NO3- supply rates and the effects of BMPI on supply rates varied between years.
Methane
While there was slightly higher variability in 2019, CH4 fluxes remained mostly negative through all three study seasons, regardless of soil water content, resulting in all BMPIs acting as minor C sinks during the growing period. Methanotrophic organisms use CH4 as a source of energy and C in well-aerated, arable land (67). As such, Eastern Canadian soils are typically weak CH4 sinks (68).
While the mean VWC values in DTGW and DTGW+TD only differed by ~3%, mean CH4-C oxidation in DTGW+TD was about triple that of DTGW. This was, much like with N2O, perhaps due to the variation seen in the VWC values in the wetter 2019 and 2021; DTGW+TD values were less variable than in DTGW and also had lower maximum values (Figure 6). Since CH4-C uptake and soil water content were positively correlated, it could be that the tile drainage – keeping the VWC more constant – was aiding in increasing the CH4-C oxidation rates.
Methane oxidation rates in the drier 2020 were almost identical in each BMPI. Oxidation rates were on the same order of magnitude as results from a fertilizer input study on irrigated cropland in Southern Alberta (69). Similarly, their results also showed little variability in methane uptake between season or management treatment. A tillage study from Northeastern Colorado also found similar oxidation rates and a lack of influence from tillage or fertilization rate treatments (70). It is possible that the length of time these BMPIs have been established influences the activity of microbial populations responsible for CH4 uptake. Construction of the BMPIs began in 2018 and the first measurements were collected the following year. Methane oxidation rates are a useful indicator of land use and tillage change (71). Microbial populations may not have changed between 2018 and 2021, especially since the more disruptive, tillage-intensive potato crop was only seeded in 2021 for the first time. The oat crops that were seeded in 2019 and 2020 required far fewer tillage events than potatoes. However, it is most likely that CH4 oxidation on these moderately-permeable sandy loams remain aligned with the broader tendency of Eastern Canadian soils to be weak CH4 sinks.
Conclusions
The findings from this study show that in both years in which CO2 was measured, cumulative emissions between CT and DTGW+TD did not differ significantly. Cumulative CO2 emissions in DTGW were significantly higher in both years, despite different soil temperature and water regimes each year. In the first year (2019) in which N2O measurements were made, DTGW+TD emitted significantly less cumulative emissions than the other two BMPIs. In the subsequent two years there was no significant difference between the three BMPIs. In none of the three years was a significant difference found between CH4 oxidation rates in the three BMPIs.
Soil water content in DTGW+TD was more regulated than in CT or DTGW. In 2020, when the summer was abnormally hot and dry, tile drained plots (DTGW+TD) surprisingly had some of the highest VWC values. In 2019 and 2021, when the fields received more regular rainfall, DTGW+TD had the least amount of variability, and VWC did not trend upwards through the summer as much as in the other two BMPIs. In 2019, 2020, and 2021, VWC in DTGW+TD was capped at about 0.3 m3 m-3, while the other two BMPIs had values approaching 0.45 m3 m-3.
We expected that in the terraced BMPIs, wetter soil conditions would be created due to greater water infiltration of rainfall water, in turn leading to higher potential GHG fluxes. This appeared to be the case in DTGW. The addition of tile drainage in DTGW+TD regulated the soil water content, thereby keeping CO2 and N2O emissions either on par or below those of the control.
There is evidence here that demonstrates the addition of tile drainage to diversion terraces and grassed waterways reduces the emissions of CO2 and N2O, relative to non-tile drained terraces, by regulating soil water. The reduction in CO2 emissions in DTGW+TD comes despite vastly greater increases in labile C in this BMPI. There is also evidence that tile-drained terraces do not emit more CO2 or N2O than contour-tilled control fields. This has implications for both climate change and nutrient management when considering implementing the LISWC system. Many farmers currently use diversion terraces and grassed waterway systems, and the results of this study may inform decisions on the addition of tile drainage.
Data availability statement
The original contributions presented in the study are included in the article/Supplementary Material. Further inquiries can be directed to the corresponding author.
Author contributions
BD: Formal analysis, Writing – original draft. LC: Conceptualization, Funding acquisition, Methodology, Resources, Supervision, Writing – review & editing. MK: Supervision, Writing – review & editing. BE: Writing – review & editing. SL: Writing – review & editing.
Funding
The author(s) declare that financial support was received for the research and/or publication of this article. This work was supported by funding from Agriculture and Agri-Food Canada (grant J-001754.001.03 and grant J-002391.001.08).
Acknowledgments
We acknowledge that this research was conducted on the traditional and unceded territory of the Maliseet and Mi’kmaq Peoples. We appreciate the field and laboratory help from Kyle MacKinley, Yulia Kupriyanovich, and Kayli McGarrigle.
Conflict of interest
The authors declare that the research was conducted in the absence of any commercial or financial relationships that could be construed as a potential conflict of interest.
Publisher’s note
All claims expressed in this article are solely those of the authors and do not necessarily represent those of their affiliated organizations, or those of the publisher, the editors and the reviewers. Any product that may be evaluated in this article, or claim that may be made by its manufacturer, is not guaranteed or endorsed by the publisher.
Supplementary material
The Supplementary Material for this article can be found online at: https://www.frontiersin.org/articles/10.3389/fsoil.2025.1453324/full#supplementary-material
References
1. Statistics Canada. Table 32-10-0358-01 area, production and farm value of potatoes. (2021). doi: 10.25318/3210035801-eng
2. Chow L, Rees H, Xing Z. (2010). Impacts of long-term intensive potato production and conservation terraces/grassed waterway on runoff hydrology and soil quality, in: Proceedings of the 19th World Congress of Soil Science: Soil Solutions for a Changing World, Brisbane, Australia, 1–6 August. pp. 68–71.
3. Rees HW, Chow TL, Walker DF, Smith AOM. Potential use of underseeded barley to increase carbon inputs to a loam soil in the New Brunswick potato belt. Can J Soil Sci. (1999) 79:211–6. doi: 10.4141/S98-012
4. Wang C, Rees HW, Daigle J-L. Classification of podzolic soils as affected by cultivation. Can J Soil Sci. (1984) 64:229_239. doi: 10.4141/cjss84-024
5. Langmaid KK, MacMillan JK, Losier JG. Soils of northern victoria county, new brunswick. In: Seventh Report of the New Brunswick Soil Survey. Canada Department of Agriculture, Cat. No. A57-176/1976. Thorn Press Ltd., North York, ON (1976). 152 pp.
6. Hinds RP. Soil physical requirements for potato production in Atlantic Canada. In: Atlantic Advisory Committee on Soil Resource Management. Ottawa, Ontario, Canada: Atlantic Provinces Agricultural Services Co-ordinating Committee (1989). 9 pp.
7. Rees HW, Chow TL, Gregorich EG. Soil and crop responses to long-term potato production at a benchmark site in northwestern New Brunswick. Can J Soil Sci. (2008) 88:409–22. doi: 10.4141/CJSS07086
8. Marland G. Uncertainties in accounting for CO2 from fossil fuels. J Ind Eco. (2008) 12:136–9. doi: 10.1111/j.1530-9290.2008.00014.x
9. Schurgers G, Ahlström A, Arneth A, Pugh TA, Smith B. Climate sensitivity controls uncertainty in future terrestrial carbon sink. Geophys Res Lett. (2018) 45:4329–36. doi: 10.1029/2018GL077528
10. Driscoll BA, Krzic M, Comeau L, Eskelson BNI, Li S. Short-term response of soil aggregate stability and labile carbon to contour tillage, diversion terrace, grassed waterway, and tile drainage implementation. Can J Soil Sci. (2023) 103. doi: 10.1139/CJSS-2022-0094
11. Li S. Landscape integrated soil and water conservation (LISWC) system for sloping landscapes in Atlantic Canada. Agric (Basel Switz.). (2021) 11:427. doi: 10.3390/agriculture11050427
12. Oertel C, Matschullat J, Zurba K, Zimmermann F, Erasmi S. Greenhouse gas emissions from soils—A review. Chemie Der Erde. (2016) 76:327–52. doi: 10.1016/j.chemer.2016.04.002
13. Sierra CA, Malghani S, Loescher HW. Interactions among temperature, moisture, and oxygen concentrations in controlling decomposition rates in a boreal forest soil. Biogeosciences. (2017) 14:703–10. doi: 10.5194/bg-14-703-2017
14. Larcher W. Physiological plant ecology: Ecophysiology and stress physiology of functional groups. 4th ed. Berlin, Germany: Springer (2003).
15. Mosier AR. Soil processes and global change. Biol Fertil. Soils. (1998) 27:221–9. doi: 10.1007/s003740050424
16. Paustian K, Babcock B, Hatfield JL, Lal R, McCarl BA, McLaughlin S, et al. (2001). Agricultural mitigation of greenhouse gases: science and policy options, in: 2001 Conference Proceedings, First National Conference on Carbon Sequestration, Washington, DC, Conference on Carbon Sequestration.
17. Iboko MP, Dossou-Yovo ER, Obalum SE, Oraegbunam CJ, Diedhiou S, Brümmer C, et al. Paddy rice yield and greenhouse gas emissions: Any trade-off due to co-application of biochar and nitrogen fertilizer? A systematic review. Heliyon. (2023) 9(11). doi: 10.1016/j.heliyon.2023.e22132
18. Smith P, Martino D, Cai Z, Gwary D, Janzen H, Kumar P, et al. Greenhouse gas mitigation in agriculture. Philos Trans R Soc. B. (2008) 363:789–813. doi: 10.1098/rstb.2007.2184
19. Ruser R, Schilling R, Steindl H, Flessa H, Beese F. Soil compaction and fertilization effects on nitrous oxide and methane fluxes in potato fields. Soil Sci Soc Am J. (1998) 62:1587–95. doi: 10.2136/sssaj1998.03615995006200060016x
20. Ruser R, Flessa H, Schilling R, Beese F, Munch JC. Effect of crop-specific field management and N fertilization on N2O emissions from a fine-loamy soil. Nutr Cycling Agroecosyst. (2001) 59:177–91. doi: 10.1023/A:1017512205888
21. Smith KA, McTaggart IP, Dobbie KE, Conen F. Emissions of N2O from scottish agricultural soils, as a function of fertilizer N. Nutr Cycling Agroecosyst. (1998) 52:123–30. doi: 10.1023/A:1009781518738
22. Zebarth BJ, Milburn PH. Spatial and temporal distribution of soil inorganic nitrogen concentration in potato hills. Can J Soil Sci. (2003) 83:183–95. doi: 10.4141/S02-061
23. Crutzen PJ, Ehhalt DH. Effects of nitrogen fertilizers and combustion on the stratospheric ozone layer. Ambio. (1977) 6:112–7.
24. Environment and Climate Change Canada National inventory report 1990–2020: Greenhouse gas sources and sinks in Canada 2022. Canada’s submission to the United Nations Framework Convention on Climate Change. In: Environmental and Climate Change Canada. Ottawa Ontario.
25. Zelazny VE ed. Our landscape heritage: the story of ecological land classification in New Brunswick. New Brunswick, Canada: New Brunswick Department of Natural Resources. Fredericton (2007).
26. IUSS Working Group WRB. World Reference Base for Soil Resources. International soil classification system for naming soils and creating legends for soil maps. 4th edition. Vienna, Austria: International Union of Soil Sciences (IUSS (2022).
27. Krasilnikov P, Marti JI, Arnold R, Shoba S. A handbook of soil terminology, correlation and classification. In Krasilnikov P, Marti JI, Arnold R, Shoba S, editors. London, UK: Routledge (2009). doi: 10.4324/9781849774352
28. Rees HW, Fahmy SH. Soils of the Agriculture Canada Research Station, Fredericton, N.B. Ottawa, Ontario: LRRI Research Branch Agriculture Canada (1984). Available at: https://sis.agr.gc.ca/cansis/publications/surveys/nb/nb994/index.html (Accessed May 17, 2022).
29. Government of Canada. Canadian climate normals 1981-2010 station data(2019). Available online at: https://climate.weather.gc.ca/ (Accessed March 16, 2022).
30. Government of New Brunswick. Nitrogen management for potato: general fertilizer recommendations . Available online at: https://www2.gnb.ca/content/dam/gnb/Departments/10/pdf/Agriculture/potato_general_factsheet.pdf (Accessed March 16, 2022).
31. Zebarth BJ, Moreau G, Dixon T, Fillmore S, Smith A, Hann S, et al. Soil properties and topographic features influence within-field variation in potato tuber yield in New Brunswick, Canada. Soil Sci Soc Am J. (2022) 86:134–45. doi: 10.1002/saj2.20342
32. Zebarth BJ, Rosen CJ. Research perspective on nitrogen BMP development for potato. Am J Potato Res. (2007) 84:3–18. doi: 10.1007/BF02986294
33. Government of Canada. Historical data(2021). Available online at: https://climate.weather.gc.ca/historical_data/search_historic_data_e.html (Accessed May 22, 2022).
34. Comeau L-P, Lai DYF, Cui JJ, Farmer J. Separation of soil respiration: A site-specific comparison of partition methods. Soil. (2018) 4:141–52. doi: 10.5194/soil-4-141-2018
35. PP Systems. EGM-5 portable CO2 gas analyzer operation manual(2018). Available online at: http://ppsystems.com/download/technical_manuals/80109-1-EGM-5_Operation_V103.pdf (Accessed May 6, 2022).
36. R Core Team. R: A language and environment for statistical computing. Vienna, Austria: R Foundation for Statistical Computing (2020). Available at: https://www.R-project.org/ (Accessed May 6, 2022).
37. Fuss R, Hueppi R, Pedersen AR. gasfluxes: greenhouse gas flux calculation from chamber measurements. R Package. (2020). https://cran.r-project.org/web/packages/gasfluxes/index.html (Accessed May 5, 2022).
38. Comeau L-P, Hergoualc'h K, Hartill J, Smith J, Verchot LV, Peak D, et al. How do the heterotrophic and the total soil respiration of an oil palm plantation on peat respond to nitrogen fertilizer application? Geoderma. (2016) 268:41–51. doi: 10.1016/j.geoderma.2016.01.016
39. Wagg C, van Erk A, Fava E, Comeau L, Mitterboeck TF, Goyer C, et al. Full-season cover crops and their traits that promote agroecosystem services. Agric (Basel Switz). (2021) 11:830. doi: 10.3390/agriculture11090830
40. IPCC. Climate Change 2021: The Physical Science Basis. Contribution of Working Group I to the Sixth Assessment Report of the Intergovernmental Panel on Climate Change. Masson-Delmotte V, Zhai P, Pirani A, Connors SL, Péan C, Berger S, et al, editors. United Kingdom and New York, NY, USA: Cambridge University Press, Cambridge (2021). In press. doi: 10.1017/9781009157896
41. Lenth R. [amp]]lsquo;emmeans’: Estimated marginal means, aka least-squares means(2022). Available online at: https://cran.r-project.org/package=emmeans (Accessed June 1, 2022).
42. Larcher W. Physiological plant ecology: ecophysiology and stress physiology of functional groups. Berlin, Germany: Springer Science & Business Media (2003).
43. Fang C, Moncrieff JB. The dependence of soil CO2 efflux on temperature. Soil Biol Biochem. (2001) 33:155–65. doi: 10.1016/S0038-0717(00)00125-5
44. Schipper LA, Hobbs JK, Rutledge S, Arcus VL. Thermodynamic theory explains the temperature optima of soil microbial processes and high Q10 values at low temperatures. Global Change Biol. (2014) 20:3578–86. doi: 10.1111/gcb.12596
45. Clune S, Crossin E, Verghese K. Systematic review of greenhouse gas emissions for different fresh food categories. J Cleaner Prod. (2017) 140:766–83. doi: 10.1016/j.jclepro.2016.04.082
46. Haile-Mariam S, Collins HP, Higgins SS. Greenhouse gas fluxes from an irrigated sweet corn (Zea mays L.)-potato (Solanum tuberosum L.) rotation. J Environ Qual. (2008) 37:759–71. doi: 10.2134/jeq2007.0400
47. Jennings SA, Koehler AK, Nicklin KJ, Deva C, Sait SM, Challinor AJ. Global potato yields increase under climate change with adaptation and CO2 fertilisation. Front Sustain Food Syst. (2020) 4:519324. doi: 10.3389/fsufs.2020.519324
48. Grandy AS, Porter GA, Erich MS. Organic amendment and rotation crop effects on the recovery of soil organic matter and aggregation in potato cropping systems. Soil Sci Soc Am J. (2002) 66:1311–9. doi: 10.2136/sssaj2002.1311
49. Hassan W, Bashir S, Ahmed N, Tanveer M, Shah AN, Bano R, et al. Labile organic carbon fractions, regulator of CO2 emission: Effect of plant residues and water regimes. Clean: Soil Air Water. (2016) 44:1358–67. doi: 10.1002/clen.201400405
50. Janzen HH, Campbell CA, Brandt SA, Lafond GP, Townley-Smith L. Light-fraction organic matter in soils from long-term crop rotations. Soil Sci Soc Am J. (1992) 56:1799–806. doi: 10.2136/sssaj1992.03615995005600060025x
51. Magid J, Jensen LS, Mueller T, Nielsen NE. Size-density fractionation for in situ measurements of rape straw decomposition — an alternative to the litterbag approach? Soil Biol. Biochem. (1997) 29:1125–33. doi: 10.1016/S0038-0717(96)00306-9
52. Schrumpf M, Kaiser K, Guggenberger G, Persson T, Koegel-Knabner I, Schulze ED. Storage and stability of organic carbon in soils as related to depth, occlusion within aggregates, and attachment to minerals. Biogeosciences. (2013) 10:1675–91. doi: 10.5194/bg-10-1675-2013
53. Paustian K, Andrén O, Janzen HH, Lal R, Smith P, Tian G, et al. Agricultural soils as a sink to mitigate CO2 emissions. Soil Use Manage. (1997) 13:230–44. doi: 10.1111/j.1475-2743.1997.tb00594.x
54. Fraser H, Fleming R. Environmental benefits of tile drainage—Literature review: land improvement contractors of ontario (2001). Available online at: https://www.ridgetownc.com/research/documents/fleming_drainage.pdf (Accessed 27 February 2023).
55. Van Schilfgaarde J ed. Drainage for agriculture Vol. 17. Madison, WI, USA: American Society of Agronomy (1974).
56. Jin CX, Sands GR, Kandel HJ, Wiersma JH, Hansen BJ. Influence of subsurface drainage on soil temperature in a cold climate. J Irrig. Drain. Eng. (2008) 134:83–8. doi: 10.1061/(ASCE)0733-9437(2008)134:1(83
57. Burton D, Zebarth B, Gillam K, MacLeod J. Effect of split application of fertilizer nitrogen on N2O emissions from potatoes. Can J Soil Sci. (2008) 88:229–9. doi: 10.4141/CJSS06007
58. Ball BC, Crichton I, Horgan GW. Dynamics of upward and downward N2O and CO2 fluxes in ploughed or no-tilled soils in relation to water-filled pore space, compaction and crop presence. Soil Tillage Res. (2008) 101:20. doi: 10.1016/j.still.2008.05.012
59. Ruser R, Flessa H, Russow R, Schmidt G, Buegger F, Munch JC. Emission of N2O, N2 and CO2 from soil fertilized with nitrate: Effect of compaction, soil moisture and rewetting. Soil Biol Biochem. (2006) 38:263–74. doi: 10.1016/j.soilbio.2005.05.005
60. Bateman EJ, Baggs EM. Contributions of nitrification and denitrification to N2O emissions from soils at different water-filled pore space. Biol Fertil. Soils. (2005) 41:379–88. doi: 10.1007/s00374-005-0858-3
61. Burton DL, Zebarth BJ, McLeod JA, Goyer C. Nitrous oxide emissions from potato production and strategies to reduce them. In: Sustainable potato production: Global case studies. Dordrecht, Netherlands: Springer Netherlands (2012). p. 251–71. doi: 10.1007/978-94-007-4104-1_14
62. Qian P, Schoenau JJ. Practical applications of ion exchange resins in agricultural and environmental soil research. Can J Soil Sci. (2002) 82:9–21. doi: 10.4141/S00-091
63. Zebarth BJ, Snowdon E, Burton DL, Goyer C, Dowbenko R. Controlled release fertilizer product effects on potato crop response and nitrous oxide emissions under rain-fed production on a medium-textured soil. Can J Soil Sci. (2012) 92:759–69. doi: 10.4141/cjss2012-008
64. Qian P, Schoenau JJ. Ion exchange resin membrane (IERM): a new approach for in situ measurement of nutrient availability in soil. Plant Nutr Fert. Sci. (1996) 2:322–30. doi: 10.11674/zwyf.1996.0405
65. Hangs RD, Schoenau JJ. Impact of amendment with hog, cattle manure, and biochar on N2O, CO2, and CH4 fluxes of two contrasting temperate prairie agricultural soils. Bioenergy Res. (2022). doi: 10.1007/s12155-022-10485-3
66. Zebarth BJ, Rochette P, Burton DL. N2O emissions from spring barley production as influenced by fertilizer nitrogen rate. Can J Soil Sci. (2008) 88:197–7. doi: 10.4141/CJSS06006
67. Topp E, Pattey E. Soils as sources and sinks for atmospheric methane. Can J Soil Sci. (1997) 77:167–77. doi: 10.4141/S96-107
68. Gregorich EG, Rochette P, Vandenbygaart AJ, Angers DA. Greenhouse gas contributions of agricultural soils and potential mitigation practices in eastern Canada: Greenhouse gas contributions and mitigation potential in agricultural regions of North America. Soil Tillage Res. (2005) 83:53–72. doi: 10.1016/j.still.2005.02.009
69. Ellert BH, Janzen HH. Nitrous oxide, carbon dioxide and methane emissions from irrigated cropping systems as influenced by legumes, manure and fertilizer. Can J Soil Sci. (2008) 88:207–17. doi: 10.4141/CJSS06036
70. Mosier AR, Halvorson AD, Reule CA, Liu XJ. Net global warming potential and greenhouse gas intensity in irrigated cropping systems in Northeastern Colorado. J Environ Qual. (2006) 35:1584–98. doi: 10.2134/jeq2005.0232
Keywords: potato production, beneficial management practices, greenhouse gas, Atlantic Canada, soil carbon, soil health
Citation: Driscoll BA, Krzic M, Comeau L-P, Eskelson BNI and Li S (2025) Response of CO2, N2O, and CH4 fluxes to contour tillage, diversion terrace, grassed waterway, and tile drainage implementation. Front. Soil Sci. 5:1453324. doi: 10.3389/fsoil.2025.1453324
Received: 22 June 2024; Accepted: 03 March 2025;
Published: 11 April 2025.
Edited by:
Ngonidzashe Chirinda, Mohammed VI Polytechnic University, MoroccoReviewed by:
Sunday Ewele Obalum, University of Nigeria, NigeriaSamuel Anuga, European University Institute (EUI), Italy
Copyright © 2025 Driscoll, Krzic, Comeau, Eskelson and Li. This is an open-access article distributed under the terms of the Creative Commons Attribution License (CC BY). The use, distribution or reproduction in other forums is permitted, provided the original author(s) and the copyright owner(s) are credited and that the original publication in this journal is cited, in accordance with accepted academic practice. No use, distribution or reproduction is permitted which does not comply with these terms.
*Correspondence: Louis-Pierre Comeau, bG91aXMtcGllcnJlLmNvbWVhdUBBR1IuR0MuQ0E=