 Yussif Baba Kassim1,2,3*
 Francisco Pinto1
 Dilys S. MacCarthy4
 Prem Bindraban5†
 Ngonidzashe Chirinda2
 TjeerdJan Stomph1
 Paul C. Struik1
- 1Centre for Crop Systems Analysis, Wageningen University and Research, Wageningen, Netherlands
- 2Agricultural Innovation and Technology Transfer Centre, University Mohammed VI Polytechnic, Benguerir, Morocco
- 3Council for Scientific and Industrial Research (CSIR)-Savanna Agricultural Research Institute, Tamale, Ghana
- 4Soil and Irrigation Research Centre, University of Ghana, Accra, Ghana
- 5International Fertilizer Development Center (IFDC), Muscle Shoals, AL, United States
Background: Soil fertility varies within fields of smallholder farmers in Africa. Drone-based field mapping may quantify this within-field variability with high resolution. This study analyzed if variation in spectral vegetation indices from early season weed cover could offer criteria to quickly assess heterogeneity in soil fertility. We tested (i) whether within field spatial patterns in early season weed cover and soil organic matter could be correlated and (ii) whether predicted soil organic matter could indicate within-field heterogeneity in crop yields.
Methods: We collected images of early season weed cover using a DJI Phantom 4 proV2 drone and data on maize and soybean final above-ground biomass from on-farm experiments, conducted in Bognaayili and Gauwogo (northern Ghana), during 2022 and 2023 cropping seasons. There were eight experiments in total, i.e., two of each crop at each site and in each year. In these experiments, we varied planting density, variety, mulching, ridging, and fertilizer application, as management options to increase productivity. Spectral vegetation indices extracted from early season weed cover were used to predict soil organic matter.
Results: Variation in spectral vegetation indices from early season weed cover was higher in Bognaayili than in Gauwogo. Predicted soil organic matter from a model built with spectral vegetation indices had a significant relationship (Radj2 = 0.54) with measured soil organic matter in Bognaayili, but not in Gauwogo. In Bognaayili, predicted soil organic matter was significantly and positively correlated with soybean above-ground biomass in 2022 (r = 0.53) and 2023 (r = 0.65). There was no relationship observed between predicted soil organic matter and maize above-ground biomass.
Conclusions: The use of spectral vegetation indices from early season weed cover images as proxy for within-field variation in soil organic matter is a promising option although it still requires some soil sampling for organic matter analysis. Incorporating drone-based early season weed cover assessment into field crop experimentation by researchers, to explore inherent soil organic matter variations would lead to detailed understanding of the characteristics and delineation of areas with lower or higher productivity in regions where soil organic matter is limiting crop productivity.
1 Introduction
The variation in crop yields within fields of smallholder farmers in sub-Saharan Africa (SSA) has been extensively reported in the literature. It has been suggested that within-field variation (localized soil heterogeneity) and its interaction with erratic rainfall are the primary causes of variable crop yields (1–3). Soil fertility is among the within-field factors responsible for localized soil heterogeneity in the fields of smallholder farmers in SSA (4).
Soil fertility refers to soil qualities that allow crops to grow and produce good yields (5) and includes physical, chemical and biological aspects. Low soil fertility is one of the biggest hurdles to attain food and nutrition security in Africa (6). All major plant nutrients and soil organic matter required by the crops to produce good crop yields, are limited in many agricultural soils in Africa (7, 8). The recognition that low soil fertility is a major yield-limiting factor has led the majority of African governments and international organizations to take measures to make fertilizers more available to farmers as a means to bridge the yield gap caused by low soil fertility (9). Despite the efforts that have been made over the past decades, crop yields in smallholder farmer’s fields remain low due to soil nutrient mining, and variability in crop yield response to fertilization (1, 3, 10, 11).
Understanding the causes for soil heterogeneity in farmer’s fields and the relationship with soil fertility management practices could help determine fields in which such management strategies may be effective, and thus help identify fields where crop intensification could be remunerative. Several studies have identified variability in secondary- and micro-nutrients to be the cause of soil heterogeneity among different fields of smallholder farmers in northern Ghana, using composite soil sampling (3, 12). However, using this technique to diagnose localized soil heterogeneity appears to be expensive, laborious and time consuming as multiple nutrients could be responsible for the localized soil heterogeneity, and the methods employed for analysis of different essential nutrients often differ (8, 12). Using drone imagery which is cheap (in the long-term), less laborious and quick to diagnose localized soil heterogeneity could be a win-win solution to stakeholders, offering insights applicable to identify productive portions of fields (13–15).
Compared to satellite images, drone images have a higher spatial resolution and are not hindered by cloud cover and visiting time (16). Drone-based digital imaging sensors that capture vegetation cover information in the visible range of the electromagnetic spectrum (i.e., red (R), green (G) and blue (B) spectral bands; RGB) have the highest spatial resolution and are the cheapest (14, 17, 18). Assessment of variation in vegetation cover from drone-based RGB images is done using transformed spectral bands (spectral vegetation indices) or the intensity values for multiple spectral bands (19). Hence, spectral vegetation indices from drone-based RGB images could be useful to assess localized soil heterogeneity.
Soil organic matter (SOM) content is one of the key components of soil fertility (20). SOM provides multiple ecosystem services including storing and releasing plant nutrients (21, 22). SOM affects the efficiency of crop nutrient uptake and utilization through its influence on soil structure, soil moisture holding capacity, and diversity and activity of soil organisms (23). Soil laboratories in Ghana have the capacity to quantify the amounts of SOM in soil samples (8, 12). In fields with low and variable SOM, naturally occurring vegetation cover and spectral vegetation indices have significant relationships with soil organic matter (24, 25). Hence, complementing spectral vegetation indices from drone-based RGB mapping for natural vegetation cover in a field, with manual detailed soil sampling and SOM analysis, could provide proof of any correlation between natural vegetation cover and SOM.
Northern Ghana is one of the areas in SSA experiencing crop yield variability within the fields of smallholder farmers (1) and hence, smallholder farmers’ fields in this region could be used as case study for possible correlation between spectral cover data, soil organic matter and within-field variability in crop performance. Maize and soybean grown as sole crops are the two most important crops in northern Ghana in terms of number of households that cultivate them and land area allocated to them; they serve as primary sources of household food, feed and income (26). The harvested grains are used for household food and the excess is sold for income (26), while the stover is used for livestock feeding, mulching, or sold for income (27, 28).
To enhance production per unit area of land, several interventions are used and tested by farmers as well as the actors supporting these farmers (29, 30). These interventions include the use of compound NPK fertilizer to supply the main nutrients nitrogen (N), phosphorus (P) and potassium (K) (31). Any other added nutrients applied, are meant to enhance the uptake and utilization efficiency of N, P and K (26, 32). Ploughing with or without NPK fertilization are the commonly used management practices in maize and soybean cropping systems (33). Some farmers implement mulching and ridging as strategies for water retention to adapt to the increasing in-season rainfall variability (26, 30, 33). The common sowing pattern for maize is two seeds per hill with 75 cm inter-row and 40 cm intra-row spacing; for soybean, it is one seed per hill with 75 cm inter-row and 5 cm intra-row spacing (31, 34). Single seed planting with reduced intra-row spacing (plant arrangement), NPK fertilizers containing sulfur (sulfur fertilization), and increased planting density through reduced row spacing are some other management practices being promoted by intervention projects and the government of Ghana with the aim to enhance maize and soybean productivity (26, 35).
Given the potential of drone-based field mapping in enabling high spatial resolution assessment of within-field variability, understanding how variations in spectral vegetation indices from early season weed cover relate to variation in SOM, could offer criteria to quickly assess localized soil heterogeneity. The objectives of the study were to assess (i) whether within field spatial patterns in early season weed cover and soil organic matter could be correlated and (ii) whether predicted soil organic matter could indicate within-field heterogeneity in crop yields.
2 Materials and methods
2.1 The study area and characteristics of the sites at the start of the experiments
The study was conducted in the Tolon and Sagnerigu districts, both located in the northern part of Ghana, West Africa (Figure 1). The study area has a unimodal rainfall which starts in May and ends in October, followed by a long dry season that lasts from October to May (36, 37). Climatic data for the study area shows seasonal rainfall ranges between 700 and 1250 mm (38). Field experiments were conducted in farmers’ fields in two villages [Bognaayili, (9° 27’ 47.4228’’ N; 0° 55’ 48.7596’’ W) and Gauwogo (9° 23’ 15.8604’’ N; 1° 1’ 43.3956’’ W)] for two years (2022 and 2023), both for maize (Zea mays L.) and soybean (Glycine max (L.) Merr.), resulting in eight unique experiments in total across years, villages and crops.
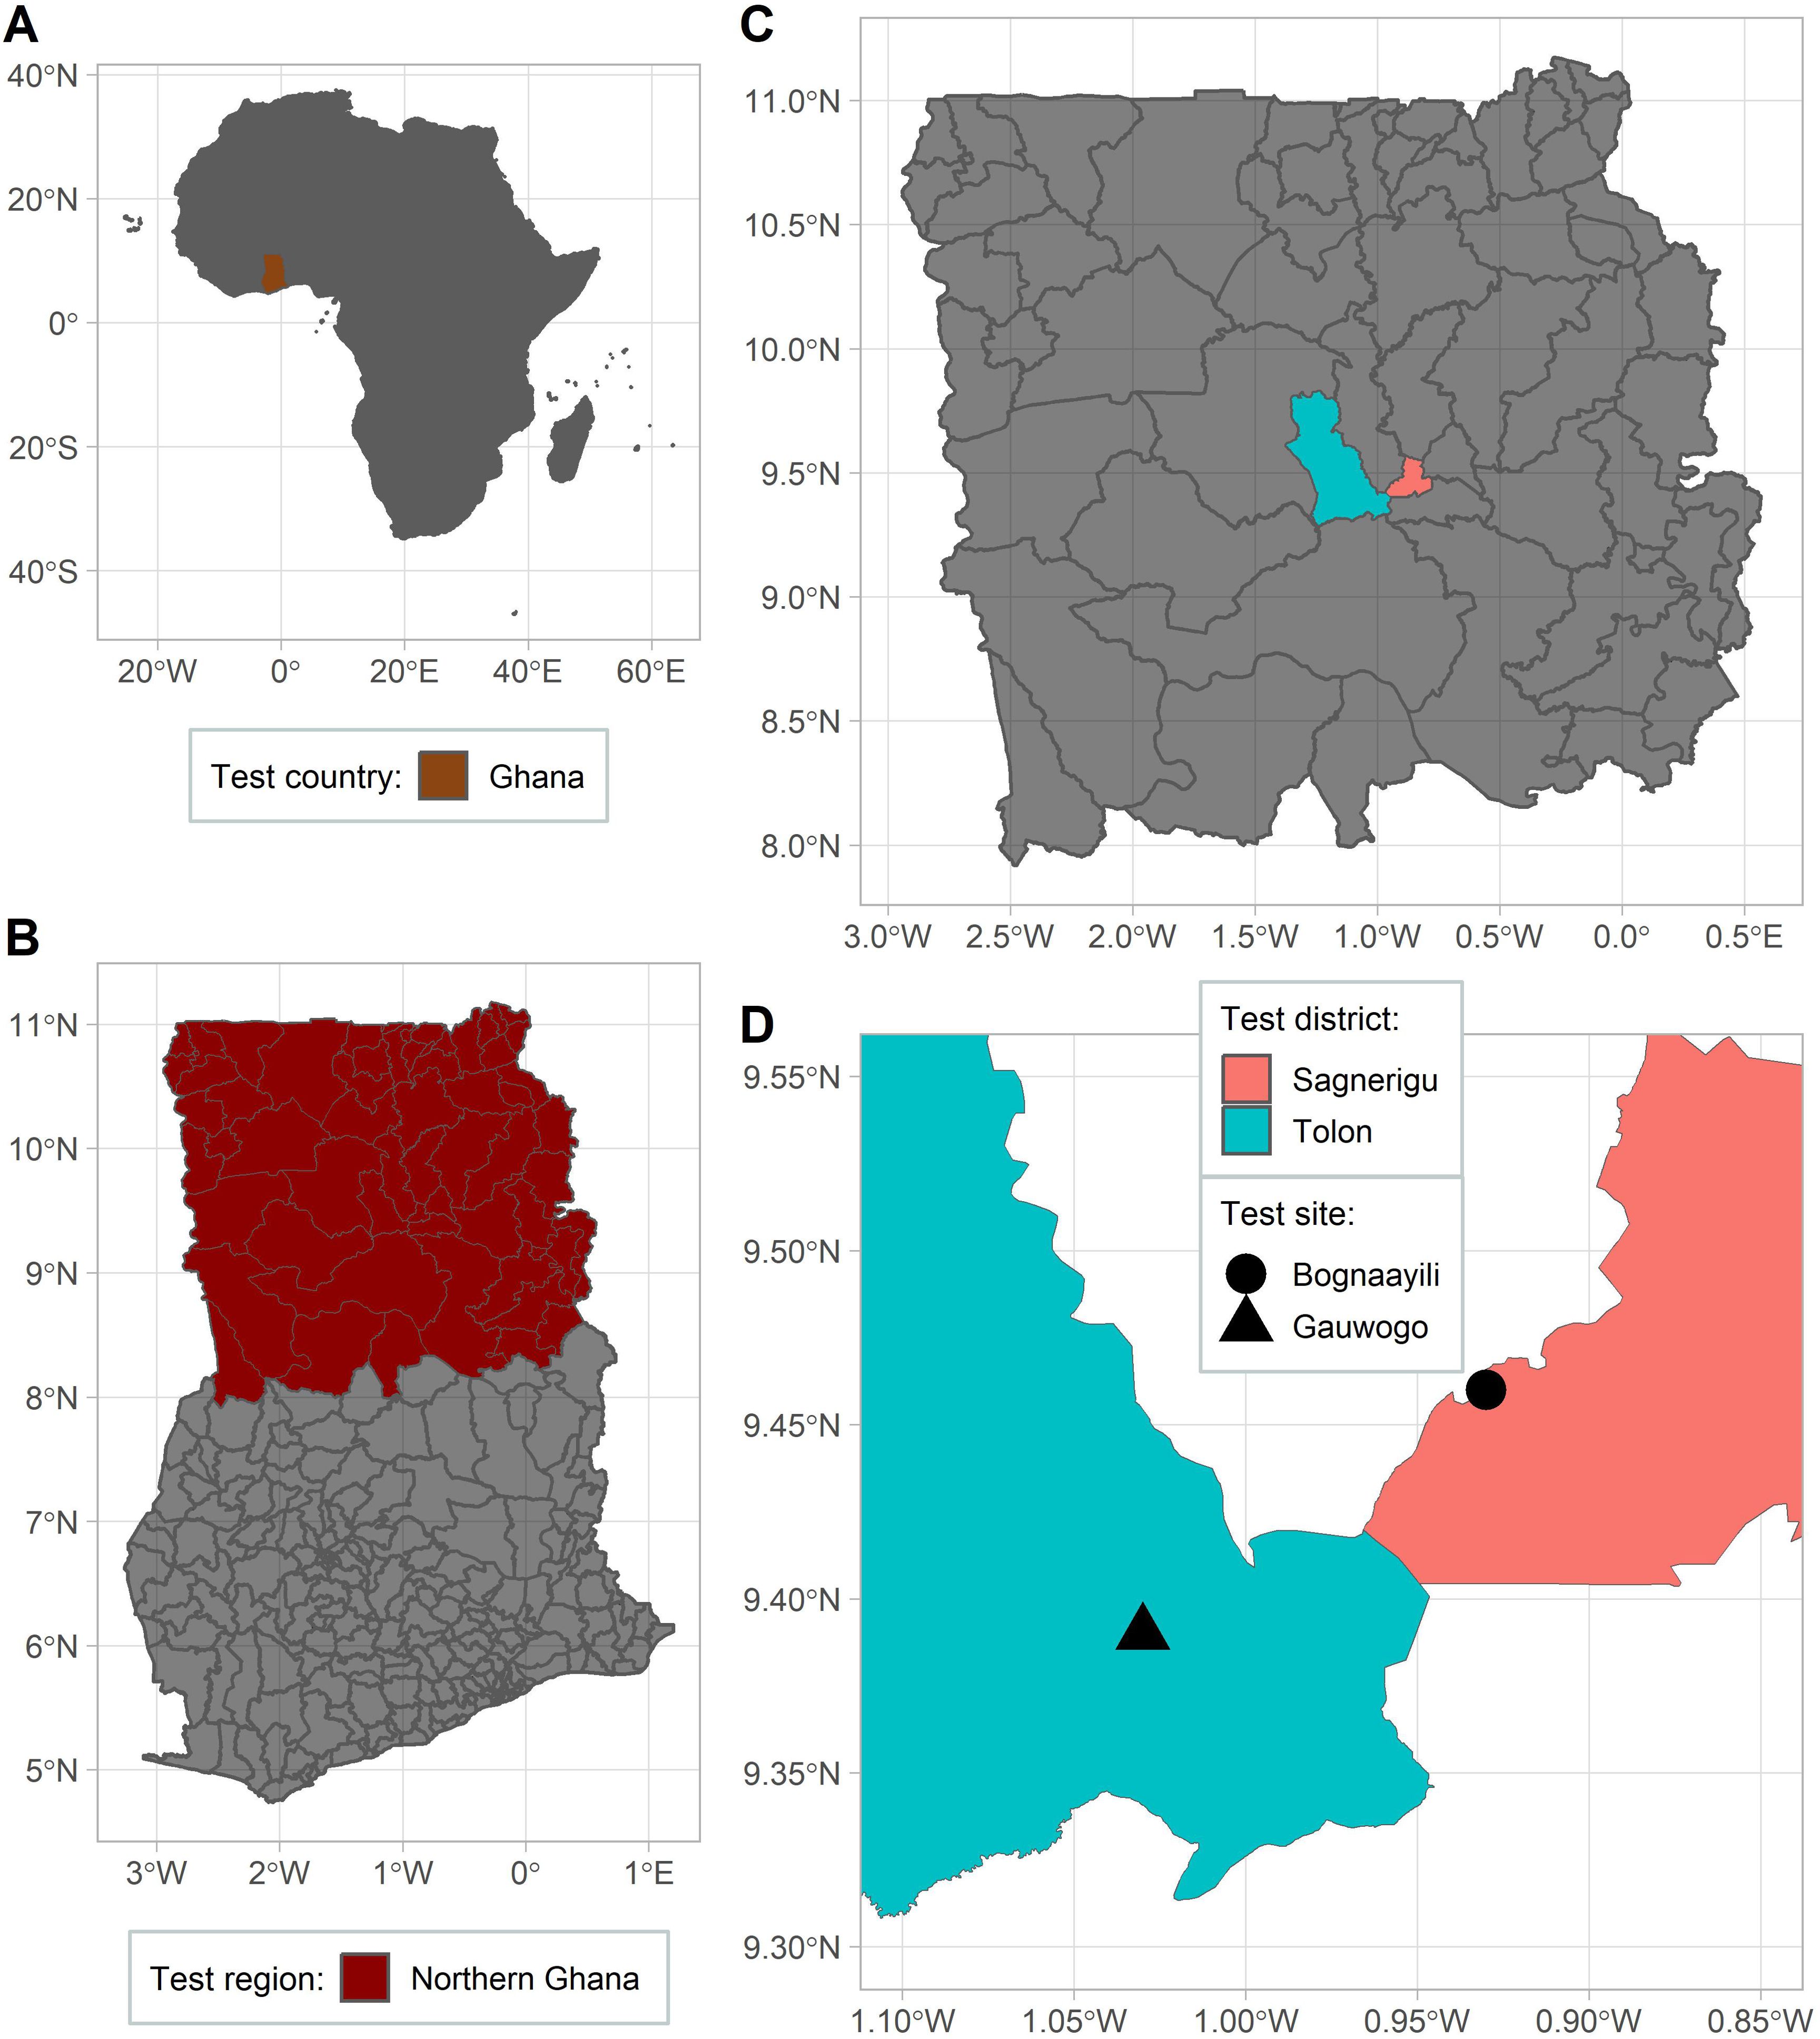
Figure 1. Maps showing the country (A), region within country (B), districts within region (C), and villages within districts (D) where the study was conducted.
Soil organic matter (SOM) and pH at the start of the study, which were measured on a composite sample from 20 soil cores per site were 0.55% and 5.95 in Bognaayili, and 0.62% and 6.10 in Gauwogo. The clay content in both sites was 4%, and the sand content was higher than 90%. The soil properties of the study sites are within the ranges of values reported for the area (8).
The same farmers’ fields were used in both years and the crop management treatments in 2023 were repeated on exactly the same plots where they were conducted in 2022, on purpose using the same randomization. The fields in both locations were prepared in 2022 by ploughing followed by manual levelling using a hoe. Ploughing was not done in 2023, to avoid possible soil movement from one plot to another. Weeds were manually cleared using a hoe during the experiment. To avoid unintended addition of fresh organic matter to the experimental plots, all weed biomass and crop above-ground biomass was removed after weeding and harvest, respectively.
2.2 Crop data
A randomized complete block design with four replications was used in each of the experiments. The design, establishment and management of the experiments were entirely done by the researchers. The crops were sown on the 2nd and 3rd July in 2022, and on the 22nd and 23rd June in 2023. The plots in the experiments were subjected to various treatment combinations of plant arrangement, planting density, mulching, NPK, ridging, sulfur, and variety (Table 1). Plant arrangement in maize involved planting one seed per hill at 20 cm intra-row spacing (P1) or the common farmer practice of two seeds per hill at 40 cm intra-row spacing (P2). Soybean was sown at one seed per hill at 5 cm intra-row spacing. Standard and increased planting density (D1 and D2) were achieved in maize and soybean respectively by planting at 75 cm inter-row spacing (D1) or 60 cm inter-row spacing (D2). There were 5 or 6 plant rows for D1 and D2 plots, respectively. Some of the D1 plots were made up of 4 5-plant row subplots that were adjacent to each other and were treated as one main plot. The N, P and K applied in maize were equivalent to 120 kg N, 40 kg P and 40 kg K per hectare for the full dosage in the treatments, and in the soybean experiments, equivalent to 15 kg N, 30 kg P and 30 kg K per hectare. While half of this dosage (½NPK) was imposed as one of the treatments next to no fertilizer (0NPK). N application in maize was done in two splits of 60 (NPK) or 30 (½NPK) kg N per hectare, at two and four weeks after planting, respectively. The first N split was applied with P and K in the form of compound fertilizer and the second split was applied in the form of urea. The N, P and K application in soybean was done once at two weeks after planting in the form of compound fertilizer. When applied, the rates of sulfur (as a component of NPKS compound fertilizer) and mulch were 12 kg S per hectare and 4000 kg air dry grass per hectare, respectively, in both crops. At the start of the seasons, some plots were ridged. Then the vertical distance between ridge tops and the furrow base was 30 cm. Open pollinated maize varieties CSIR-Sanzal Sima and Obatanpa, and soybean varieties CSIR-Favour and Jenguma were used in the experiments. The maize variety, CSIR-Sanzal Sima, and the soybean variety, Jenguma, adopted in the study were reported to be relatively tolerant to drought conditions (34, 39).
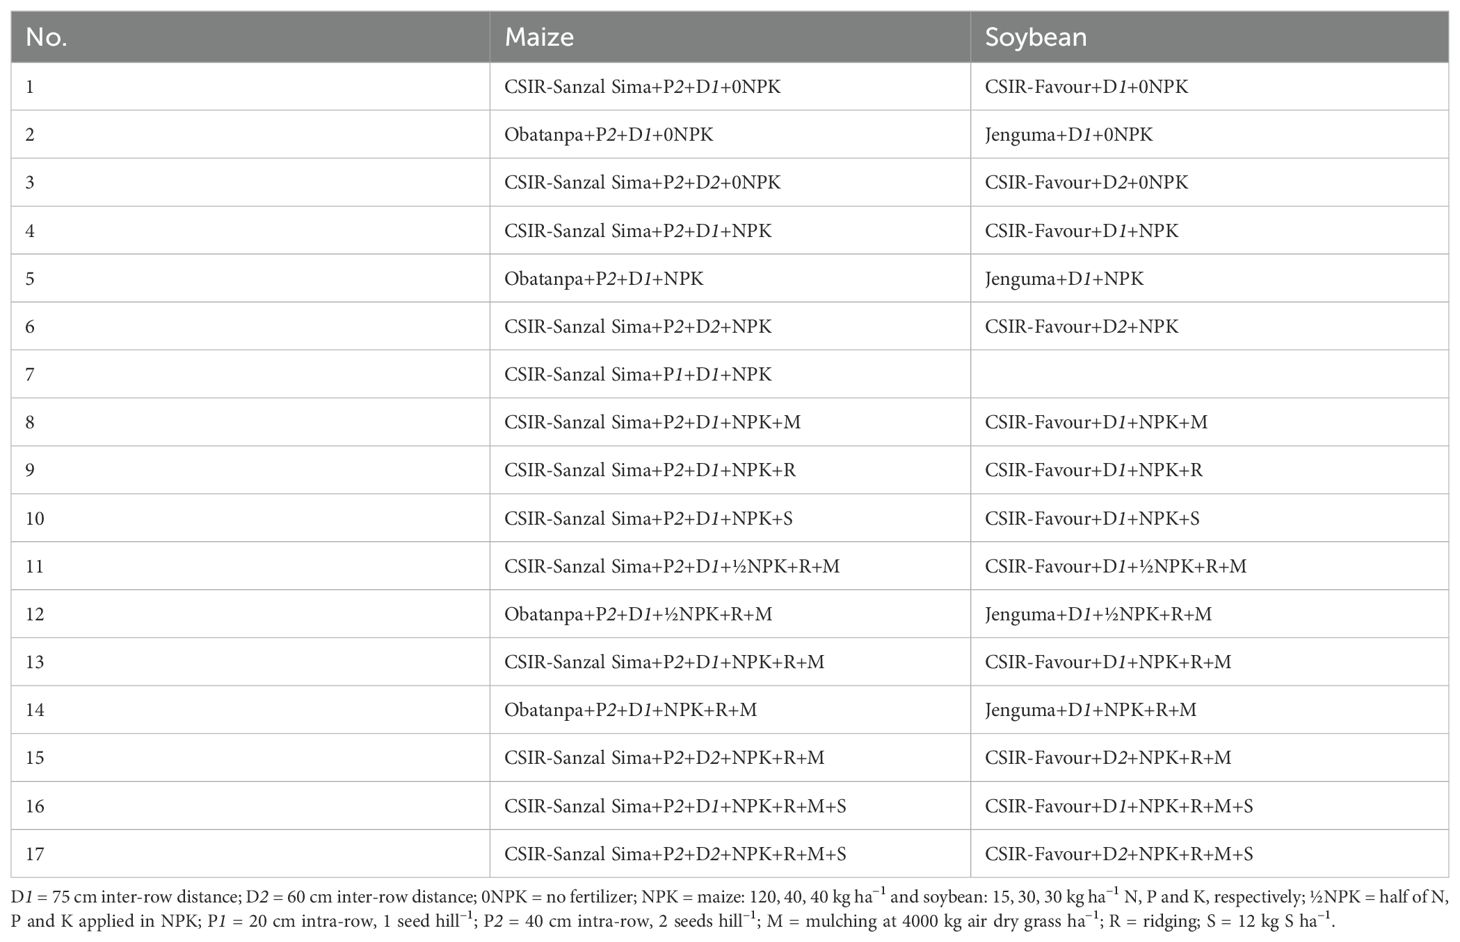
Table 1. Crop management treatment combinations used in the experiments in the northern region of Ghana from which the crop yield data were obtained.
At the end of both cropping seasons, 3 (D1) or 4 (D2) inner plant rows were cut at soil level, leaving a 0.75-cm border at each end of the plant rows. The cut plants were sundried to 12% moisture (moisture determined using GM-103 moisture meter), and hand-threshed to extract the grains. The parts of the plants remaining after removing the grains constituted the stover. Above-ground biomass of the two crops was obtained by summing the separate grain and stover weights.
2.3 Early season weed cover and soil organic matter data
Prior to the start of the experiments in 2022, images of early season weed cover of all the fields were taken using a DJI Phantom 4 proV2 drone carrying the manufacturer’s fitted RGB camera (Phantom 4 Pro V2.0 - DJI). The images were captured from an altitude of 30 m and had 80% front and side overlap. The images were stitched using the approach described in (40) to derive vegetation cover maps of the fields. Seventeen spectral vegetation indices (Supplementary Table S1) were extracted from the field maps using the approaches described in (41–49).
Images of crop cover in the experimental fields were taken at mid-grain filling (77 days after planting) in 2023 and stitched, using the same tools and approach described above, to derive crop cover maps. Five experts were invited to select from the crop cover maps, the experimental field(s) they considered to be variable, when the plots in the experimental fields were assessed crop management treatment-wise. This exercise was followed by a field visit during which a sixth expert and local farmers whose fields were used for the experiments were asked to select crop management treatment-wise, which of the experimental field(s) they considered crop growth to be variable.
The soybean experimental field in Bognaayili was identified by the experts and local farmers to exhibit largest within-field variability, and hence, that field and the soybean experimental field in Gauwogo were sampled at the end of season in 2023 for SOM analysis. During soil sampling, five soil samples were collected in each plot or subplot from the 0–30 cm soil depth, bulked on plot basis for Bognaayili and for Gauwogo, and analyzed for organic carbon using the Walkley-Black wet combustion method (50). The organic carbon values were converted to organic matter values using a conversion factor of 1.724 (51).
Correlation analyses were conducted between the spectral vegetation indices and SOM separately for both Bognaayili and Gauwogo. The indices that did not have significant correlation with SOM in either of the villages were removed (Figure 2), and the retained indices were combined with the SOM data. Seventy percent of the data was used to build a random forest model for respectively Bognaayili and Gauwogo to predict SOM from the retained spectral vegetation indices, and the remaining 30% data was used to evaluate the model’s performance. The built random forest models were applied to predict SOM using the spectral vegetation indices from early season weed cover of the maize fields that were not sampled for SOM analysis. Making SOM predictions for the fields that were not sampled was considered possible since the crops were grown on adjacent fields in each village and the weed vegetation cover from which the spectral vegetation indices were extracted was the same in terms of species composition and magnitude of percentage cover.
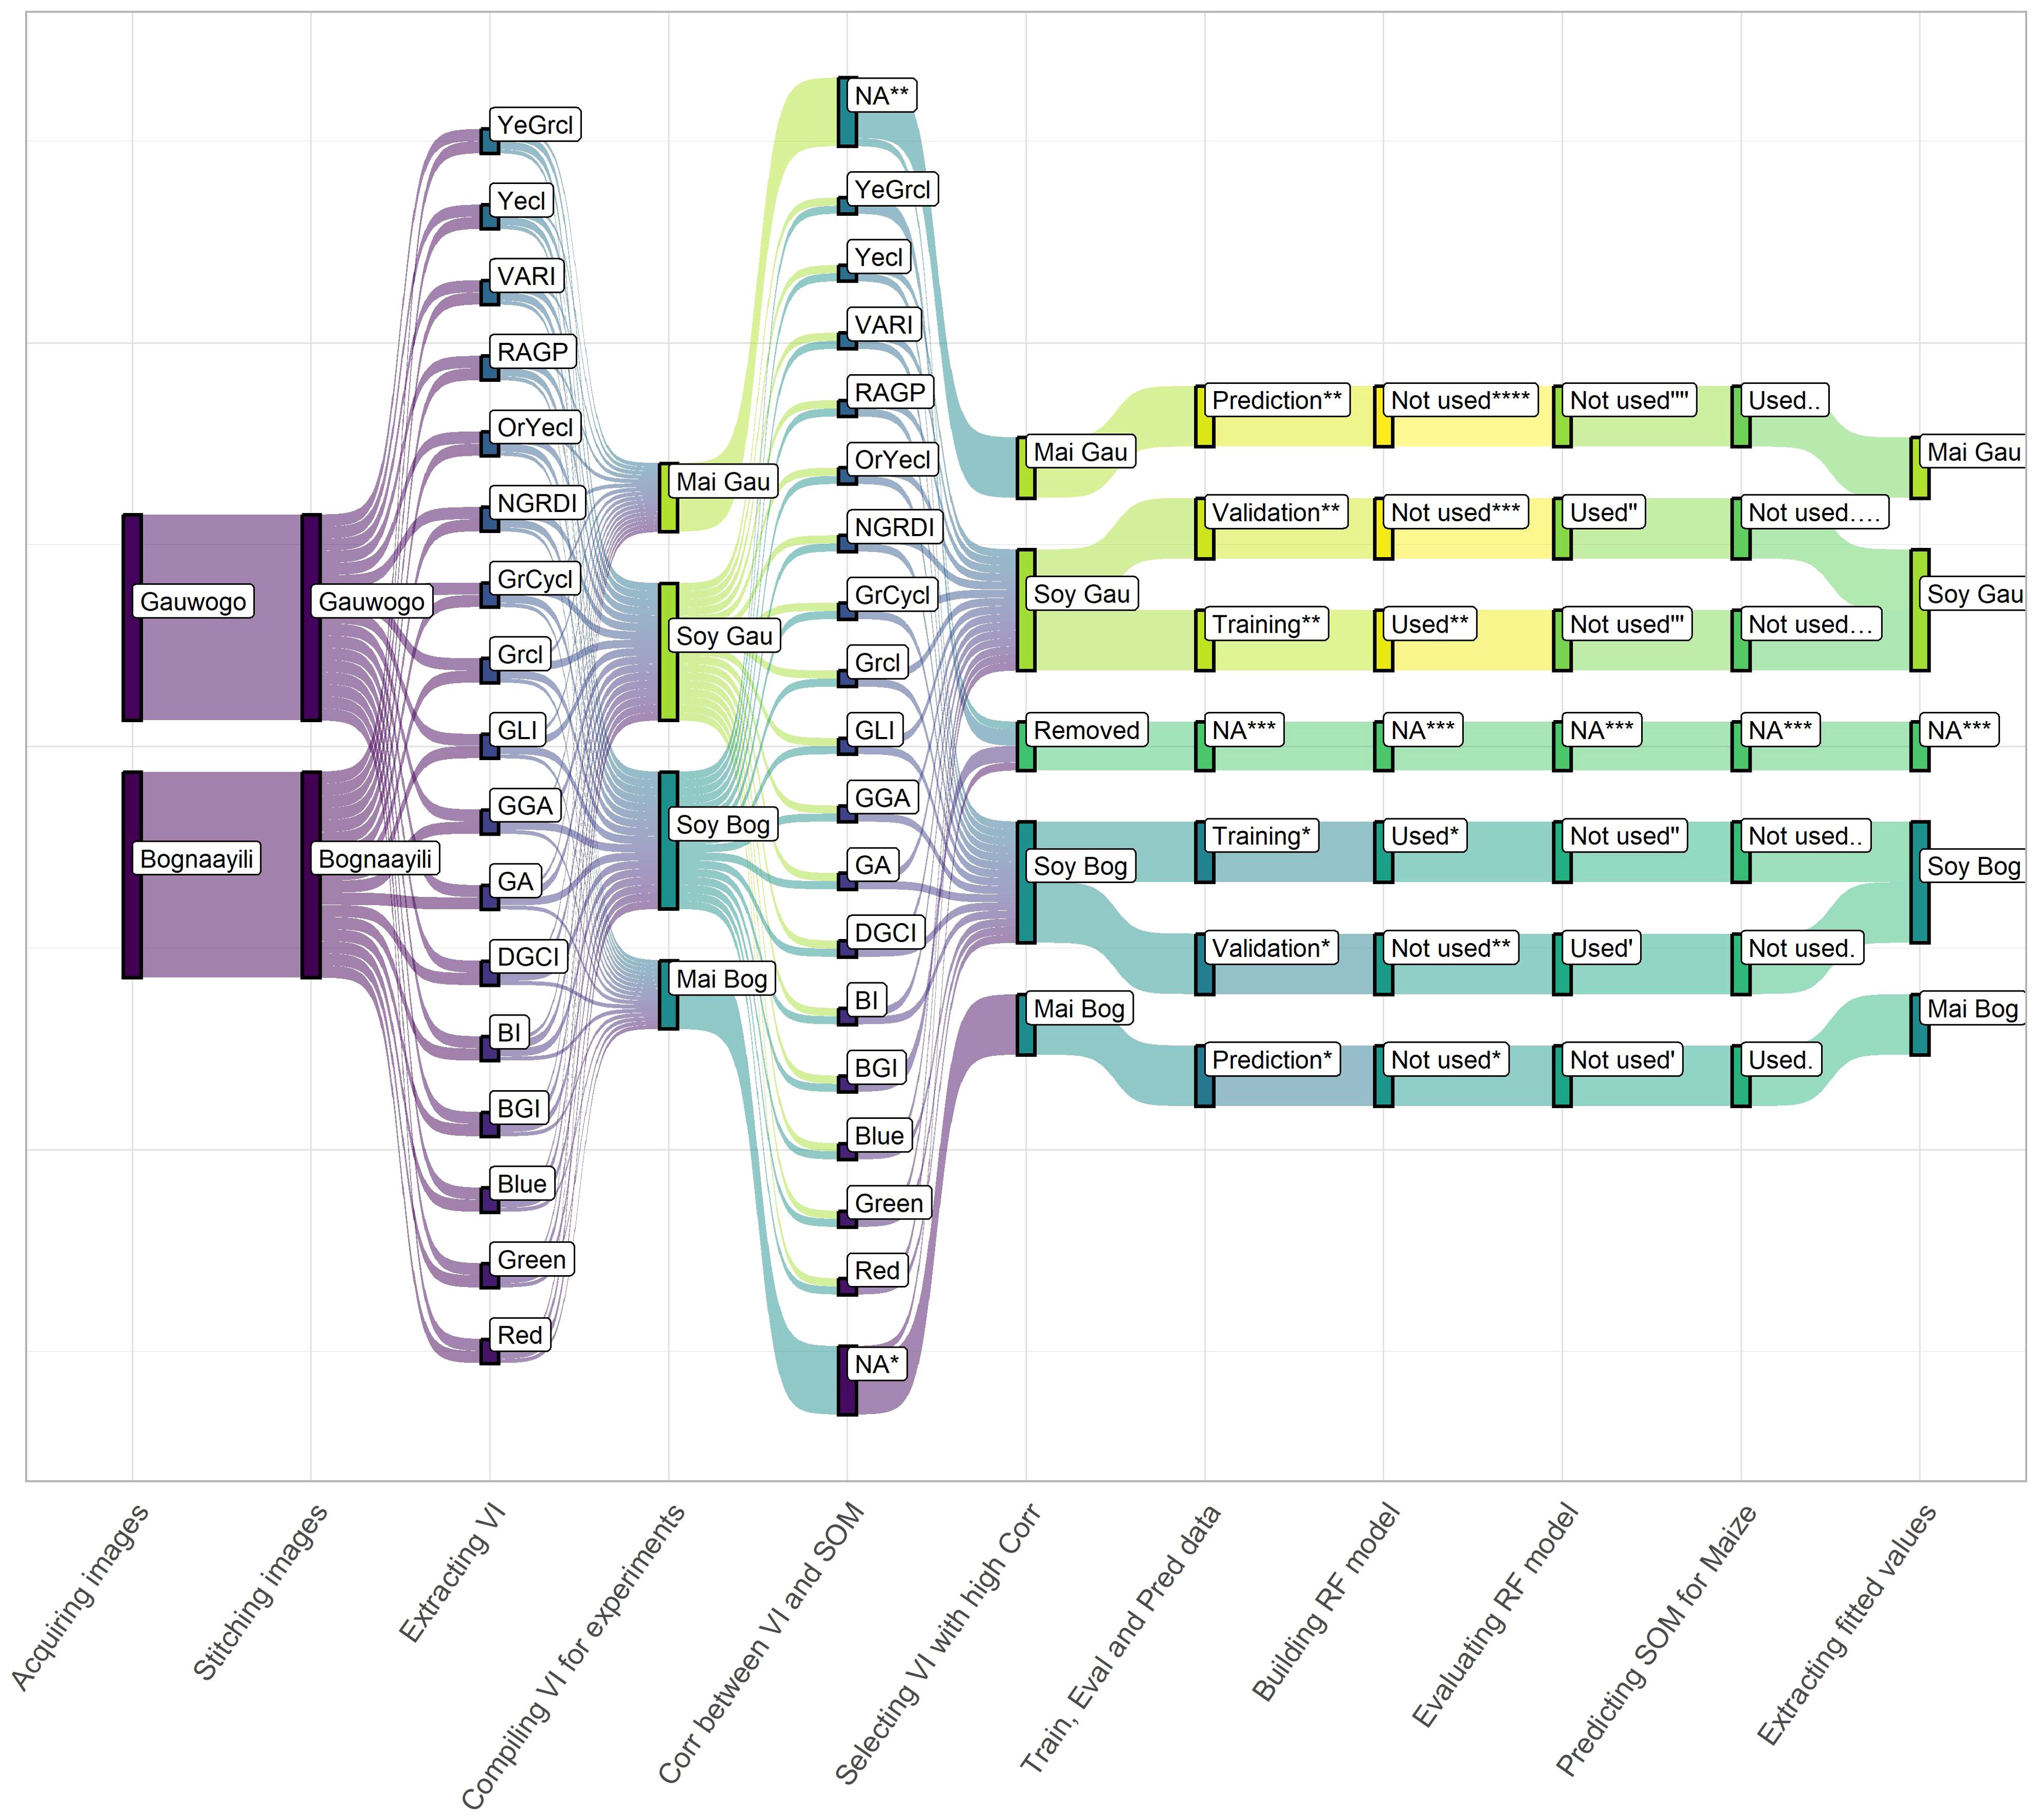
Figure 2. Summary of the key steps used in the approach to predict soil organic matter from spectral vegetation indices. YeGrcl, yellow-green class; Yecl, yellow class; VARI, variable atmospherically resistance index; RAGP, relative amount of green pixels; OrYecl, orange-yellow class; NGRDI, normalized green-red difference index; GrCycl, green-cyan class; Grcl, green class; GLI, green leaf index; GGA, greener area; GA, green area; DGCI, dark green color index BI, brightness index; BGI, blue-green pigment index; Blue, intensity in blue color band; Green, intensity in green color band; Red, intensity in red color band; Soy, soybean; Gau, Gauwogo; Bog, Bognaayili; Mai, maize; NA, data that was not used in a step; VI, spectral vegetation indices; Train, training; Eval, evaluation; Pred, prediction; Corr, correlation; SOM, soil organic matter and RF, random forest. *, **, ***, ****, ′, ′′, ′′′, ′′′′,.,.., …, and …. refer to classes of the partitioned data at various steps.
2.4 Statistical analysis
Levene’s test for equality of variances and Welch’s T-test for comparing means were used to assess the differences in the spectral vegetation indices from both Bognaayili and Gauwogo sites. Correlation analysis was done between above-ground biomass and predicted SOM values, separately for each combination of crop, location, and year. All data analyses and the plotting of figures were done using the “R” statistical software (version 4.4.2) and the tidyverse suite, ggpubr package and tidyterra suite of R (52–55).
3 Results
3.1 Within-field variation in spectral vegetation indices from early season weed cover, mid-season crop cover density, and measured soil organic matter
Spectral vegetation indices extracted from the early season weed cover from Bognaayili had numerically higher variances (except intensity values for Green band) compared to Gauwogo, and were statistically significant for Blue, GrCycl, Grcl, GA, GGA, DGCI, GLI, BGI and RAGP (Table 2). The means of Blue, GrCycl, Grcl, GGA, BI and BGI were significantly (p < 0.05) higher in Bognaayili. On the other hand, the mean values of YeGrcl, Yecl, GLI and RAGP were significantly higher in Gauwogo (Table 2).
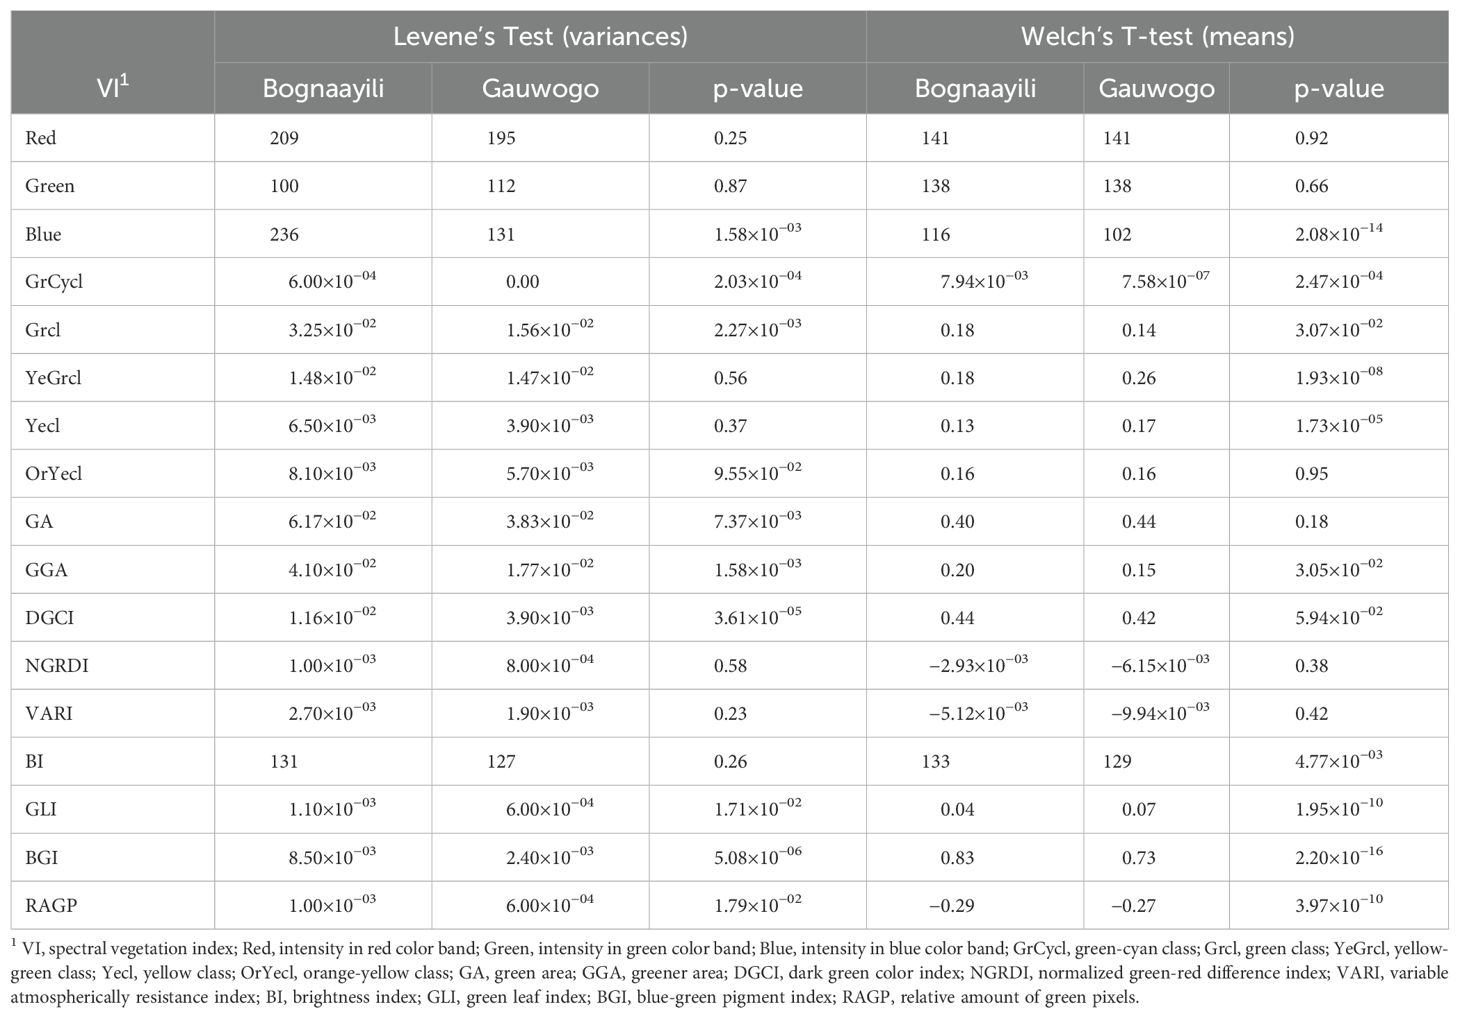
Table 2. Test of variances and means of natural vegetation cover indices.
The soybean field in Bognaayili was identified by experts and local farmers to exhibit largest within-field variability compared to the other fields (Figures 3A, B). The soybean field at Bognaayili had extensive patchiness in crop cover that could not be attributed to differences in crop management treatments that were being tested (Figures 3B, C). For instance, at 77 days after planting, crop canopy in most soybean plots in Bognaayili had not closed whereas other plots had closed or near-closed crop canopy (Figures 3B, C).
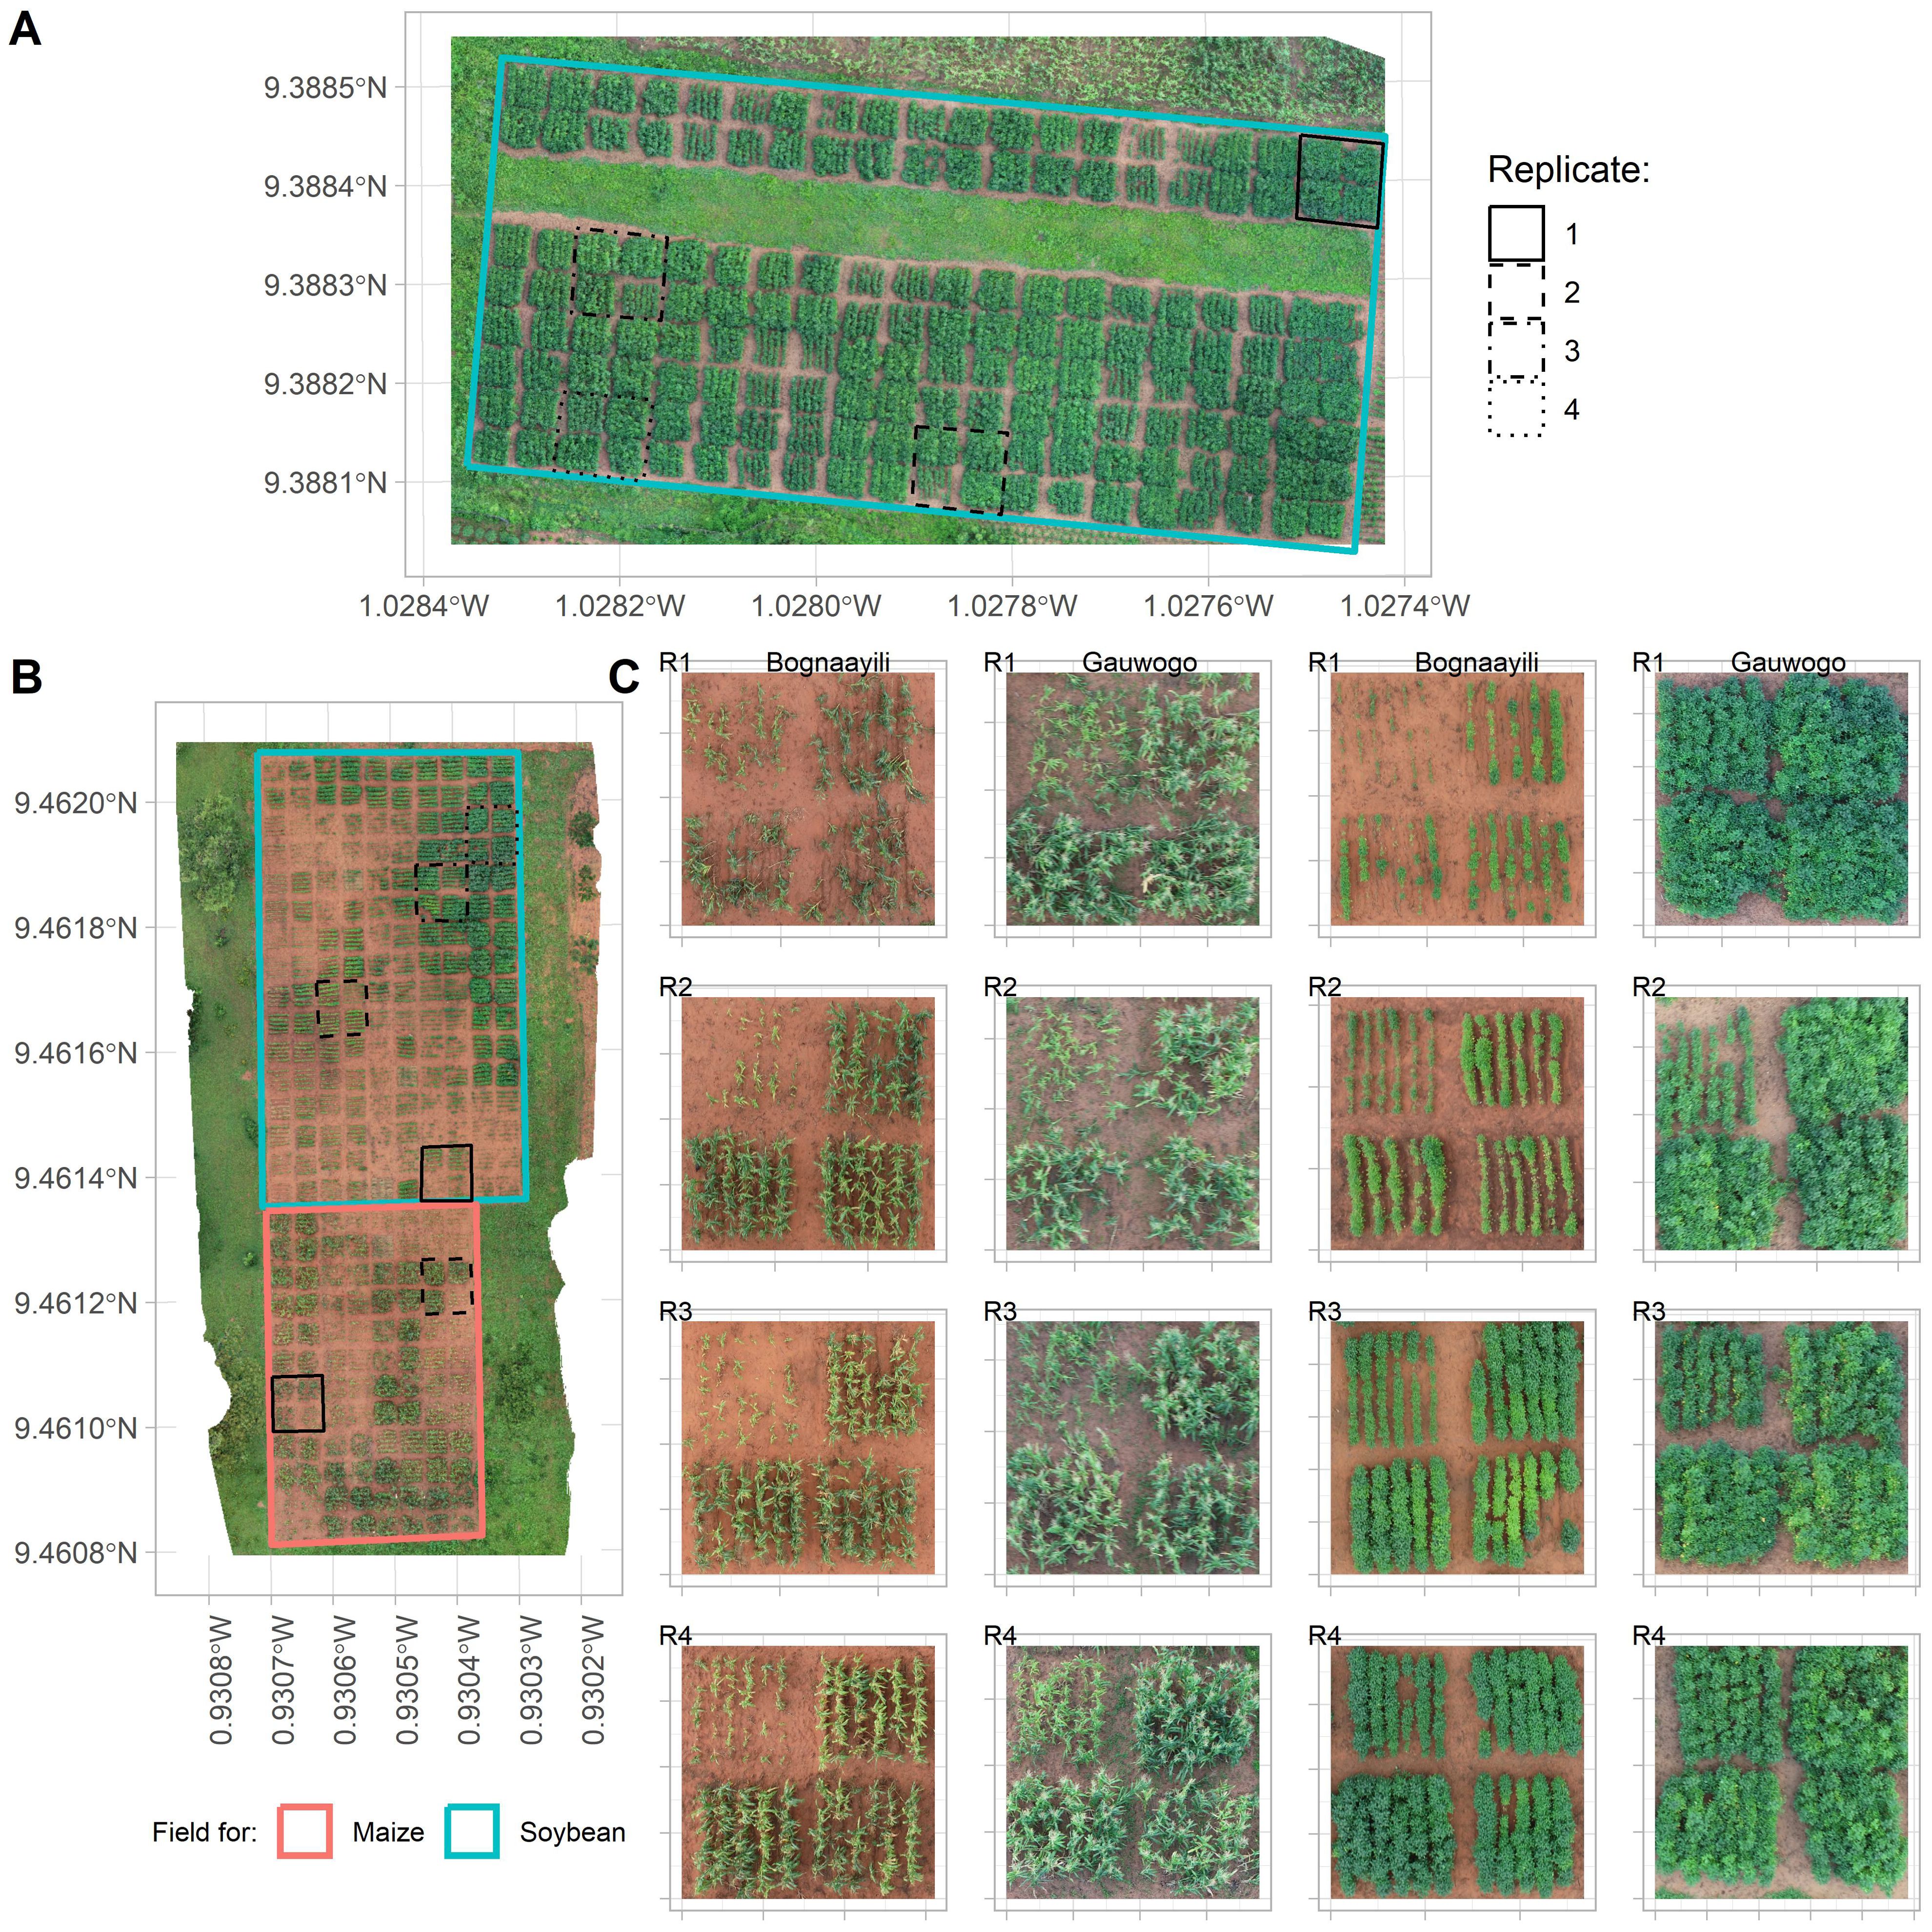
Figure 3. Variation in crop canopy cover at 77 days after planting. (A) is the soybean field at Gauwogo, (B) is the soybean and half of maize fields at Bognaayili, and (C) represents four selected crop management treatments to show variation in more detail. R1 to R4 in (C) are replicate one to four. Crop varieties captured in (C) were CSIR-Sanzal Sima (maize; first and second columns from the left) and CSIR-Favour (soybean; third and fourth columns from the left). In each location and replicate in (C), the image has been purposefully rotated so that P2+D2 + 0NPK (maize) or D2 + 0NPK (soybean) plot is in the upper left plot, and each of the other three plots is one of P2+D2+NPK+R+M, P2+D1+NPK+R+M+S or P2+D2+NPK+R+M+S (maize), or D2+NPK+R+M, D1+NPK+R+M+S or D2+NPK+R+M+S (soybean).
Within-field variability in the maize field at Bognaayili and at Gauwogo and soybean field at Gauwogo was more related to the crop management treatments that were being tested. For instance, all plots in the maize fields in Bognaayili and Gauwogo and soybean field in Gauwogo with low crop cover belonged to crop management treatments that did not have fertilizer (Figures 3A–C).
Because of the visually assessed higher within-field variability in soybean crop cover at Bognaayili, all plots in soybean fields in Bognaayili and Gauwogo were individually sampled at the end of season in 2023 for soil organic matter (SOM) analysis.
Variation in the measured SOM was higher in the soybean field in Bognaayili than in the soybean field in Gauwogo (Figure 4). For instance, the standard deviation of the measured SOM in Bognaayili (0.12%) was almost twice what was observed in Gauwogo (0.07%). The mean of the measured SOM in the soybean field in Bognaayili (0.33%) was lower, reaching only half of the mean of measured SOM in the soybean field in Gauwogo (0.65%).
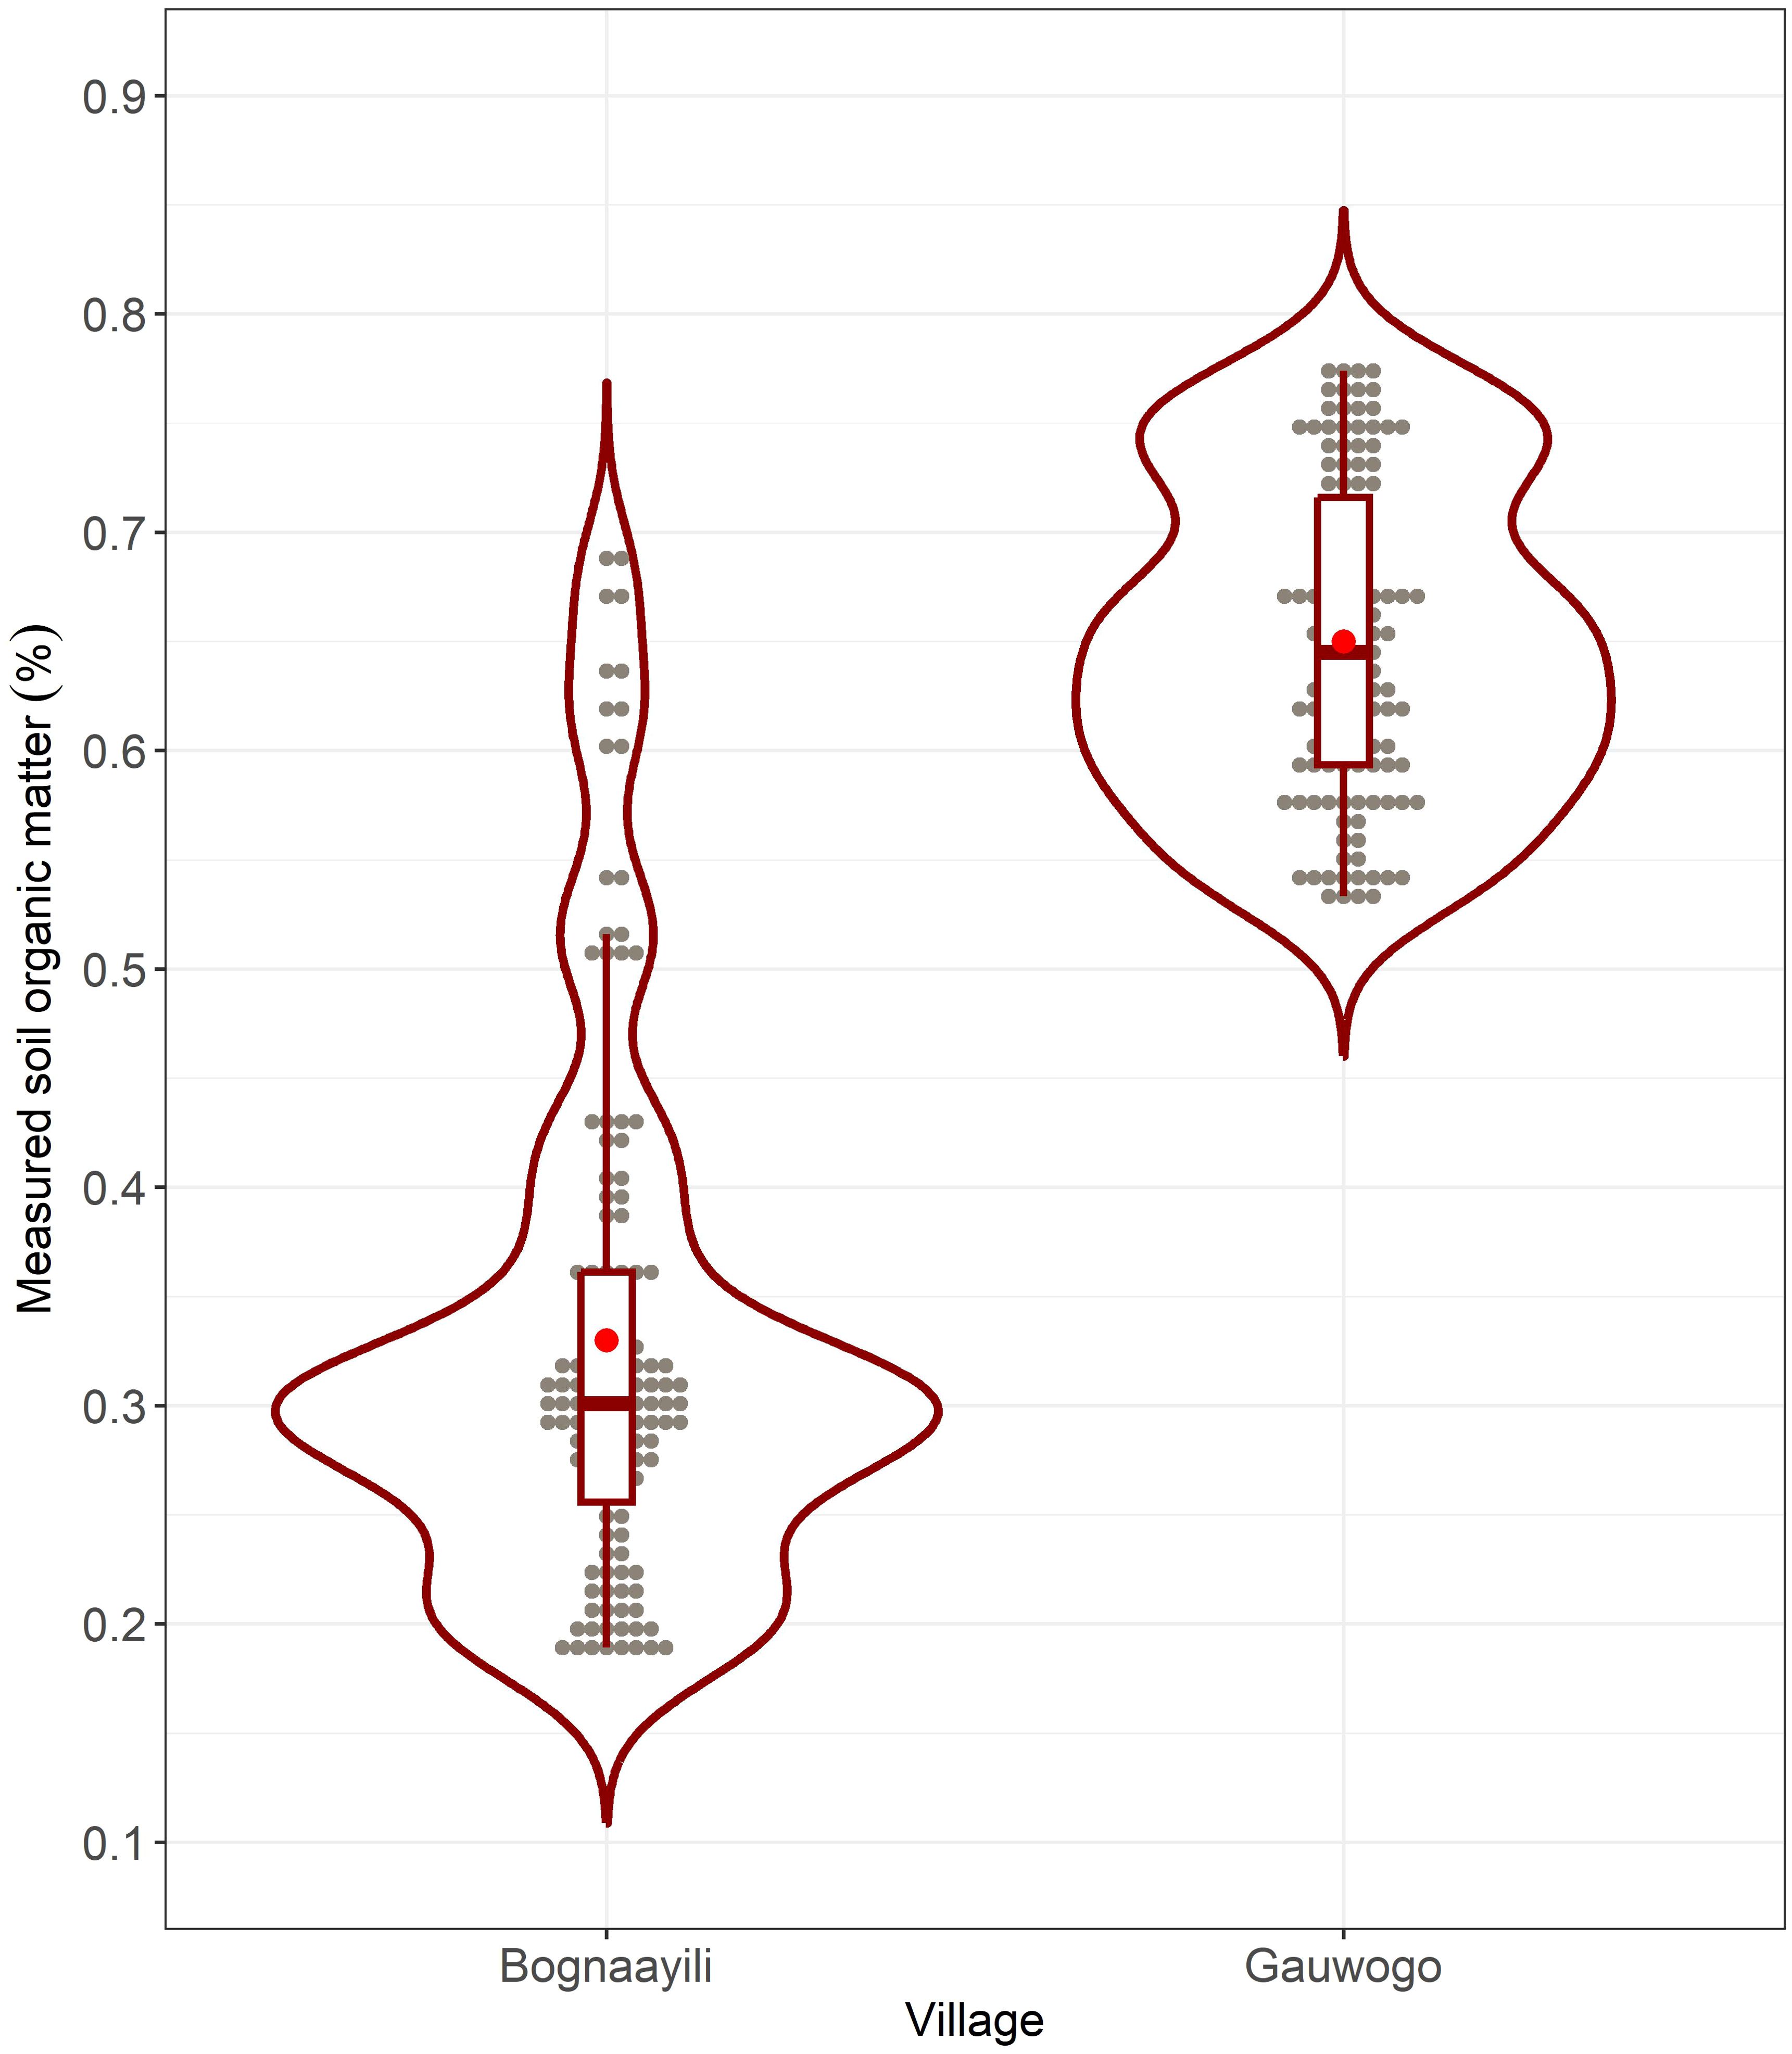
Figure 4. Distribution of the measured soil organic matter in the soybean fields in Bognaayili and Gauwogo. The box and whisker plots within the violin plots show the quartiles, and the red dots show the means.
3.2 Correlation between spectral vegetation indices from early season weed cover, soil organic matter and crop above-ground biomass
In the soybean field in Bognaayili, all spectral vegetation indices except YeGrcl and BGI had significant (p < 0.05) correlations with measured SOM (Table 3). The correlation coefficients for Red, Green, Blue, Yecl, OrYecl and BI were negative, whereas correlation coefficients for GrCycl, Grcl, GA, GGA, DGCI, NGRDI, VARI, GLI and RAGP were positive. In the soybean field in Gauwogo, the spectral vegetation indices had no significant correlation (p > 0.05) with measured SOM.
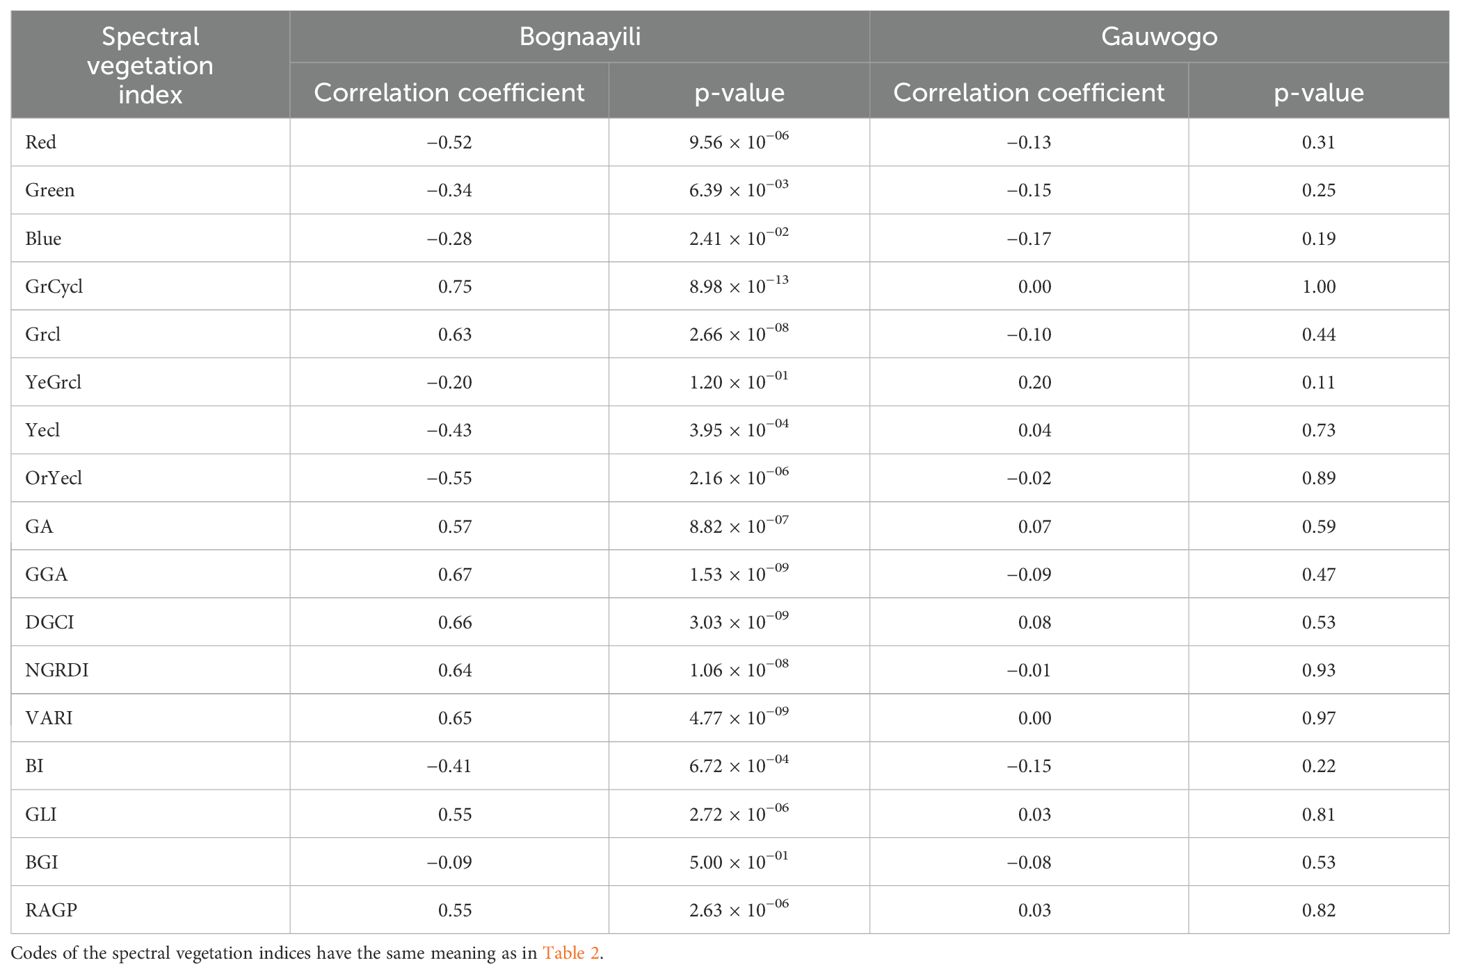
Table 3. Correlation between natural vegetation cover indices and measured soil organic matter.
Statistically significant (p < 0.05) correlations were observed between soybean above-ground biomass and measured SOM in Bognaayili, for 2022 and 2023 biomass data (Figure 5). In Gauwogo, no significant correlations (p > 0.05) were observed between the 2022 and 2023 soybean above-ground biomass and measured SOM (Figure 5).
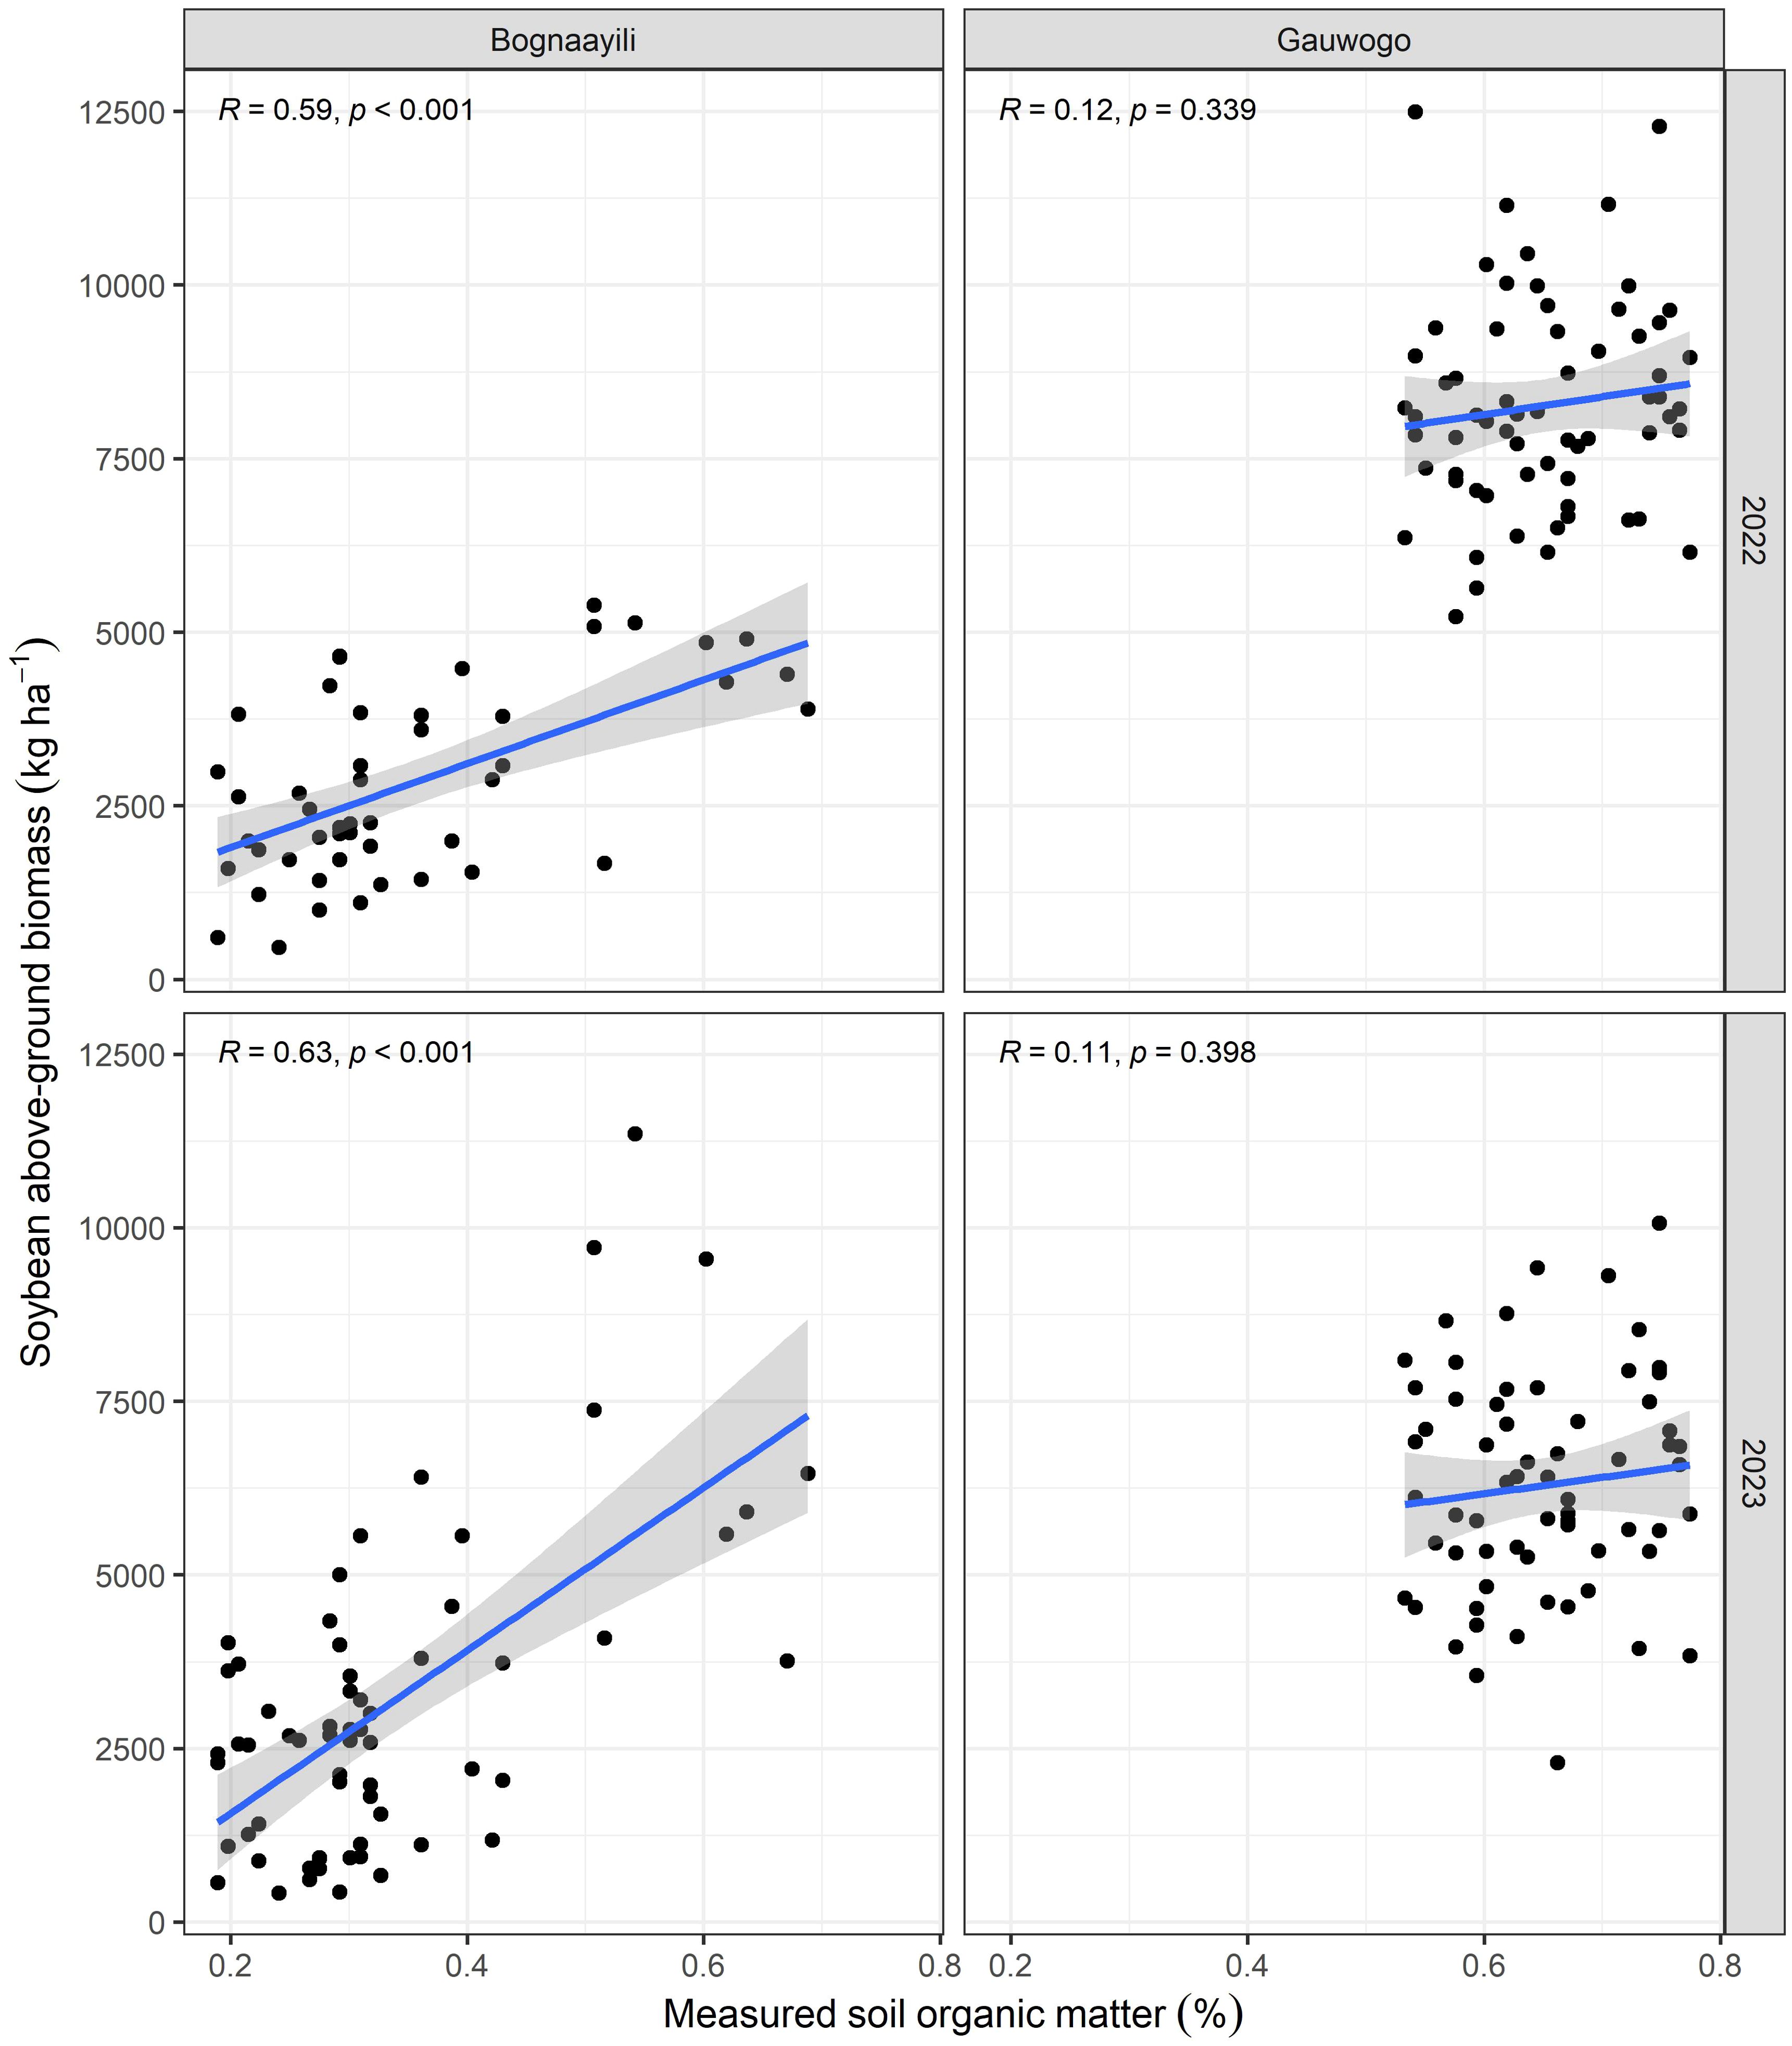
Figure 5. Scatter plots showing the correlations between soybean above-ground biomass and measured soil organic matter. Texts in the upper-left conner of each panel show the correlation coefficient and p-value.
The spectral vegetation indices had no correlation (p > 0.05) with maize above-ground biomass in both villages and years, and with soybean above-ground biomass in Gauwogo, in 2022 and 2023 (Table 4). In contrast, all the spectral vegetation indices except YeGrcl and BGI had significant correlations with soybean above-ground biomass in Bognaayili in 2022 and 2023 (Table 4). Among the spectral vegetation indices which had significant correlations with soybean above-ground biomass in Bognaayili, Blue had the lowest correlation coefficients followed by Green, in both years.

Table 4. Correlation coefficients between crop above-ground biomass and spectral vegetation indices extracted from early season weed cover images.
3.3 Predicting soil organic matter using spectral vegetation indices from early season weed cover
The 15 spectral vegetation indices that had significant correlations with measured SOM in Bognaayili (Table 3) were the ones used to build random forest models for respectively Bognaayili and Gauwogo to predict SOM. After model building, the random forest model in Bognaayili performed reasonably well as predicted SOM from the spectral vegetation indices explained 42% of variation in measured SOM. The performance of the random forest model in Gauwogo was considered not good because predicted SOM values from the spectral vegetation indices had no relationship (Radj2 = 0.00) with measured SOM. The distribution of the minimal depth of predictor variables (Figures 6A, B) revealed that some spectral vegetation indices used to build the random forest model in Bognaayili were never used to split the root node, i.e., minimal depth at root node was zero (Figure 6A). Indices OrYecl and GrCycl contributed most to the random forest model’s overall predictiveness in Bognaayili; they each had minimal depths of 2.8. During model evaluation, predicted SOM from the spectral vegetation indices explained 54% and 0% of variation in measured SOM in Bognaayili (Figure 6C) and Gauwogo (Figure 6D), respectively. The built random forest model for each village was used to predict SOM for the maize fields. The relationship between maize and soybean above-ground biomass and the predicted values (from prediction for maize, and from training and evaluation for soybean) were assessed.
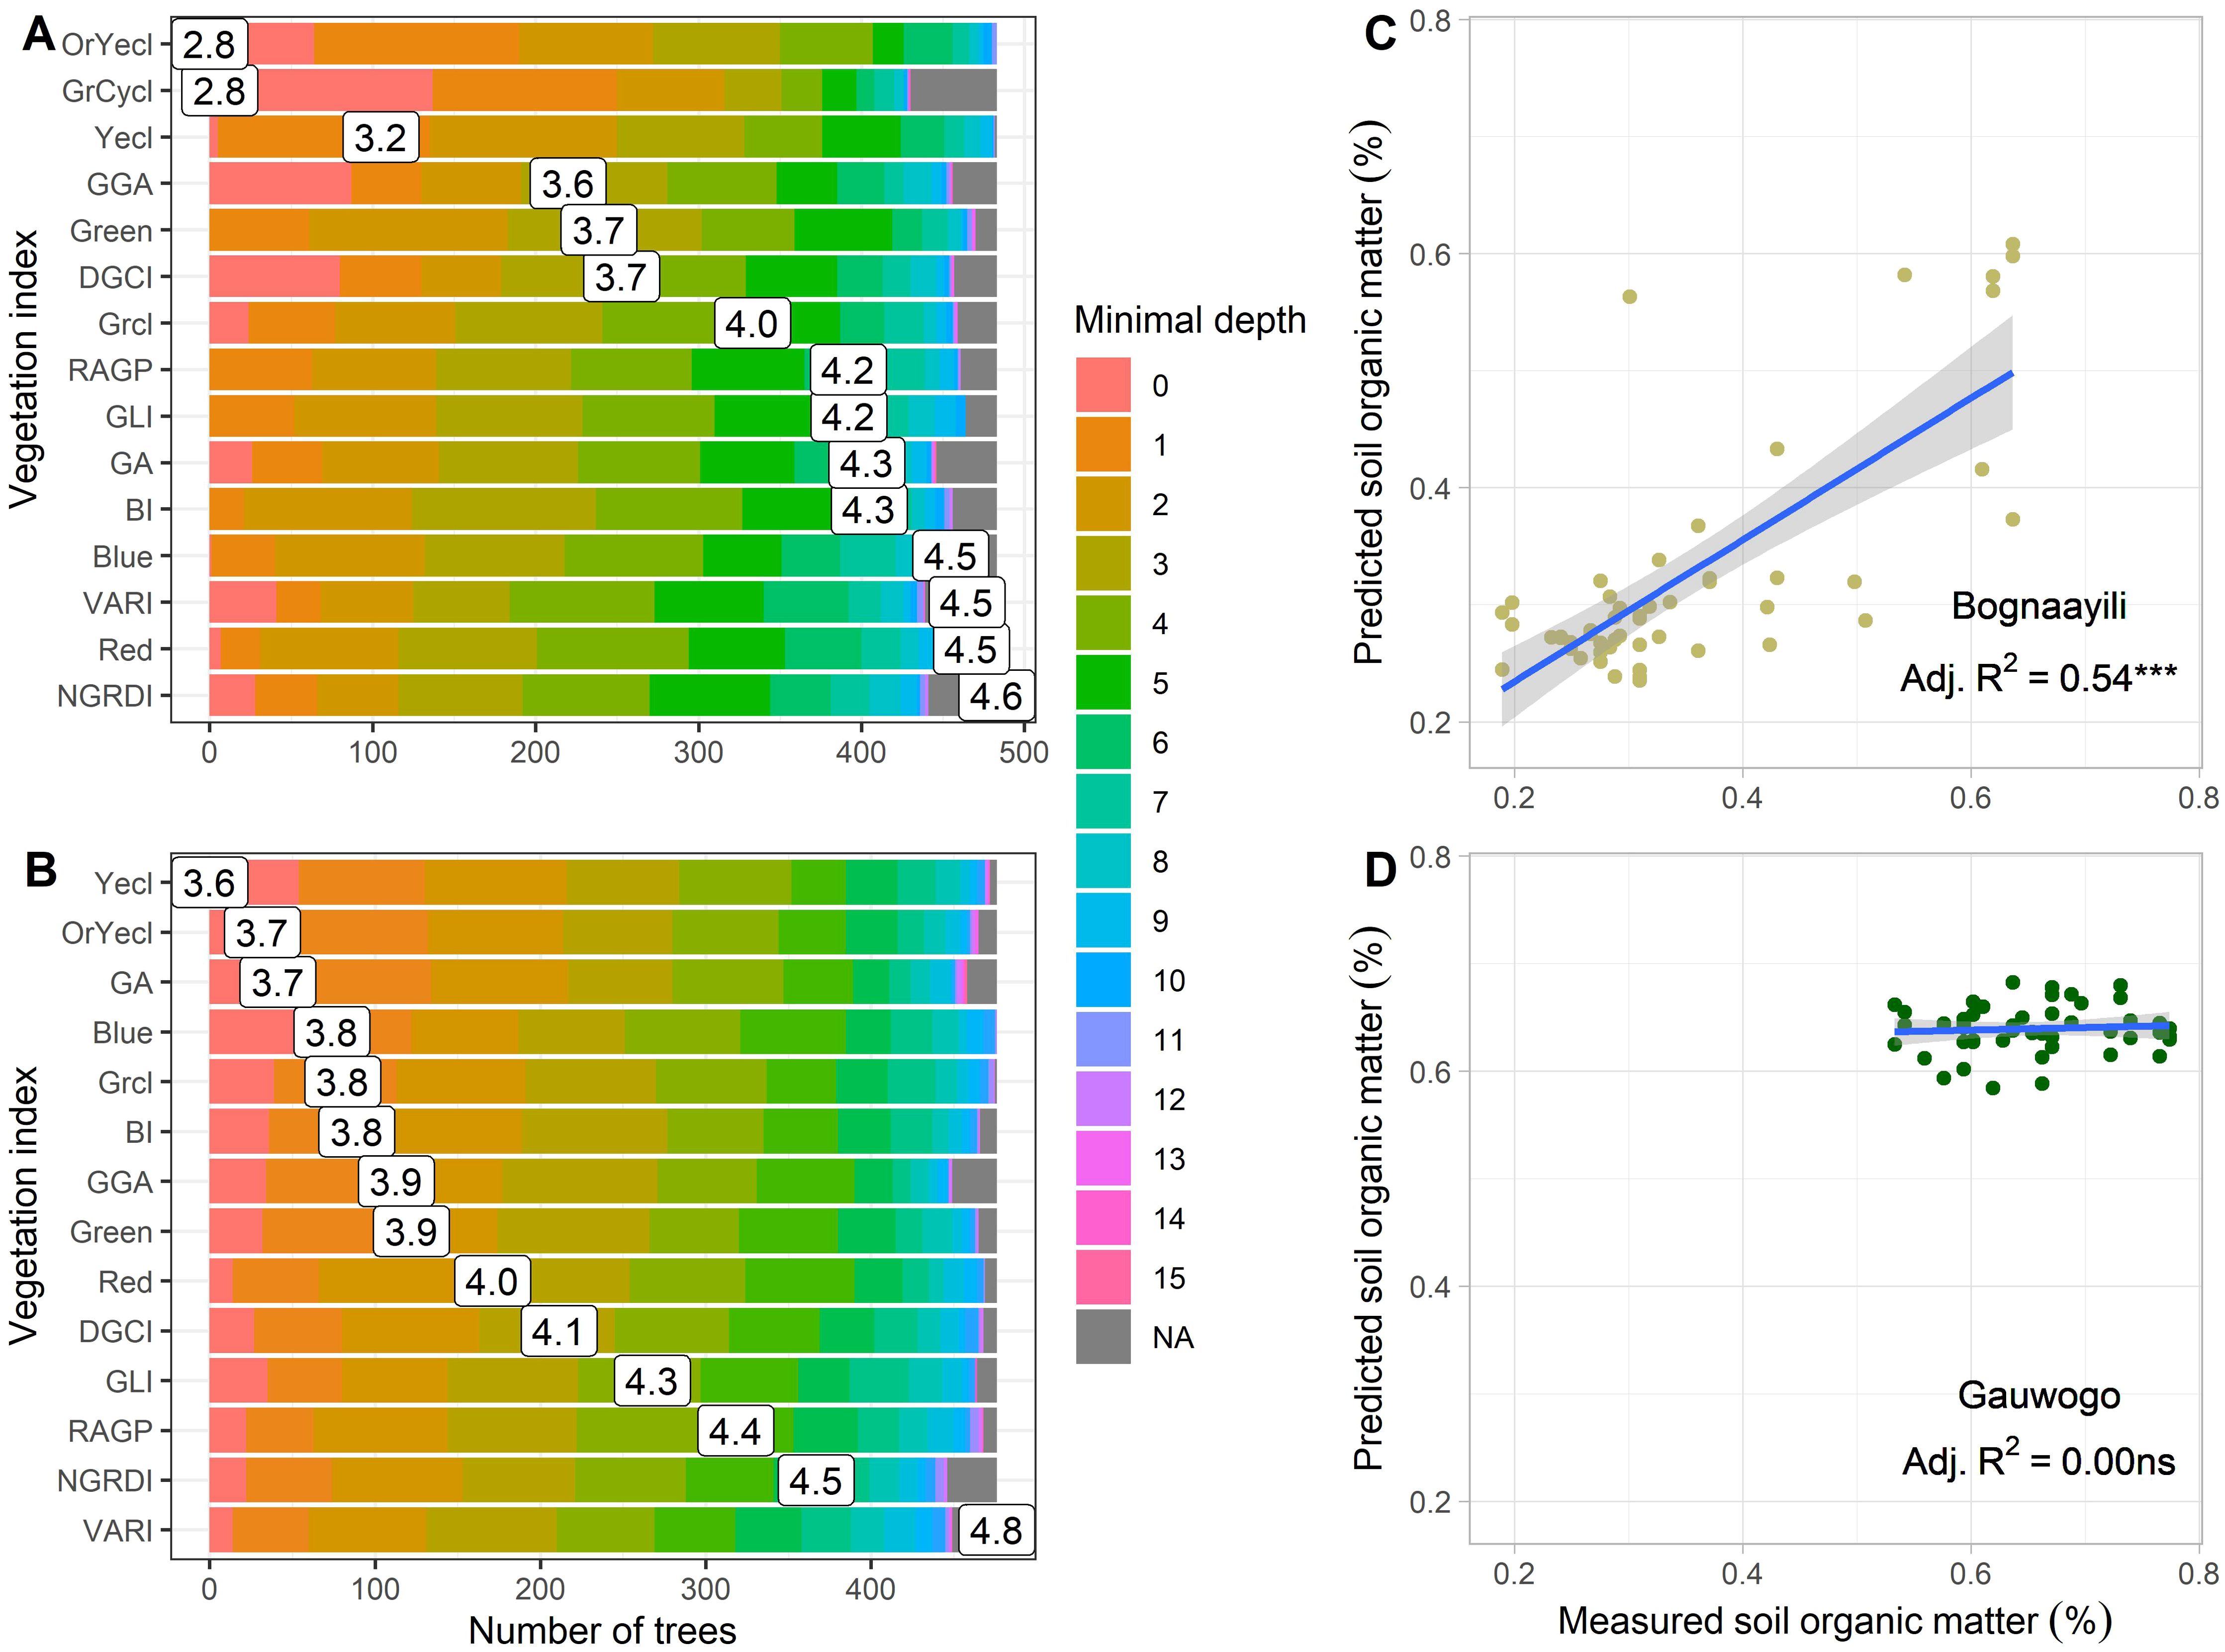
Figure 6. Summaries from the random forest after model building (A, B) and evaluation (C, D). (A, B) show the distribution (colors) and mean (number) of the minimal depth of predictor variables across trees at respectively Bognaayili and Gauwogo. A smaller minimal depth value for a predictor variable indicates that the predictor variable’s contribution to overall predictiveness of the model is higher. (C, D) show the linear relationship between predicted soil organic matter from spectral indices and measured soil organic matter during model evaluation at respectively Bognaayili and Gauwogo. The Radj2 indicates the coefficient of determination. Codes of spectral variables in (A, B) have the same meaning as in Table 2.
Predicted SOM values were more variable in the soybean field in Bognaayili compared to the maize field in that same village (Figures 7C, D) and maize and soybean fields in Gauwogo (Figures 7B, D). Predicted SOM contents in maize and soybean plots and subplots in Gauwogo were higher than 0.55% (Figures 7B, D).
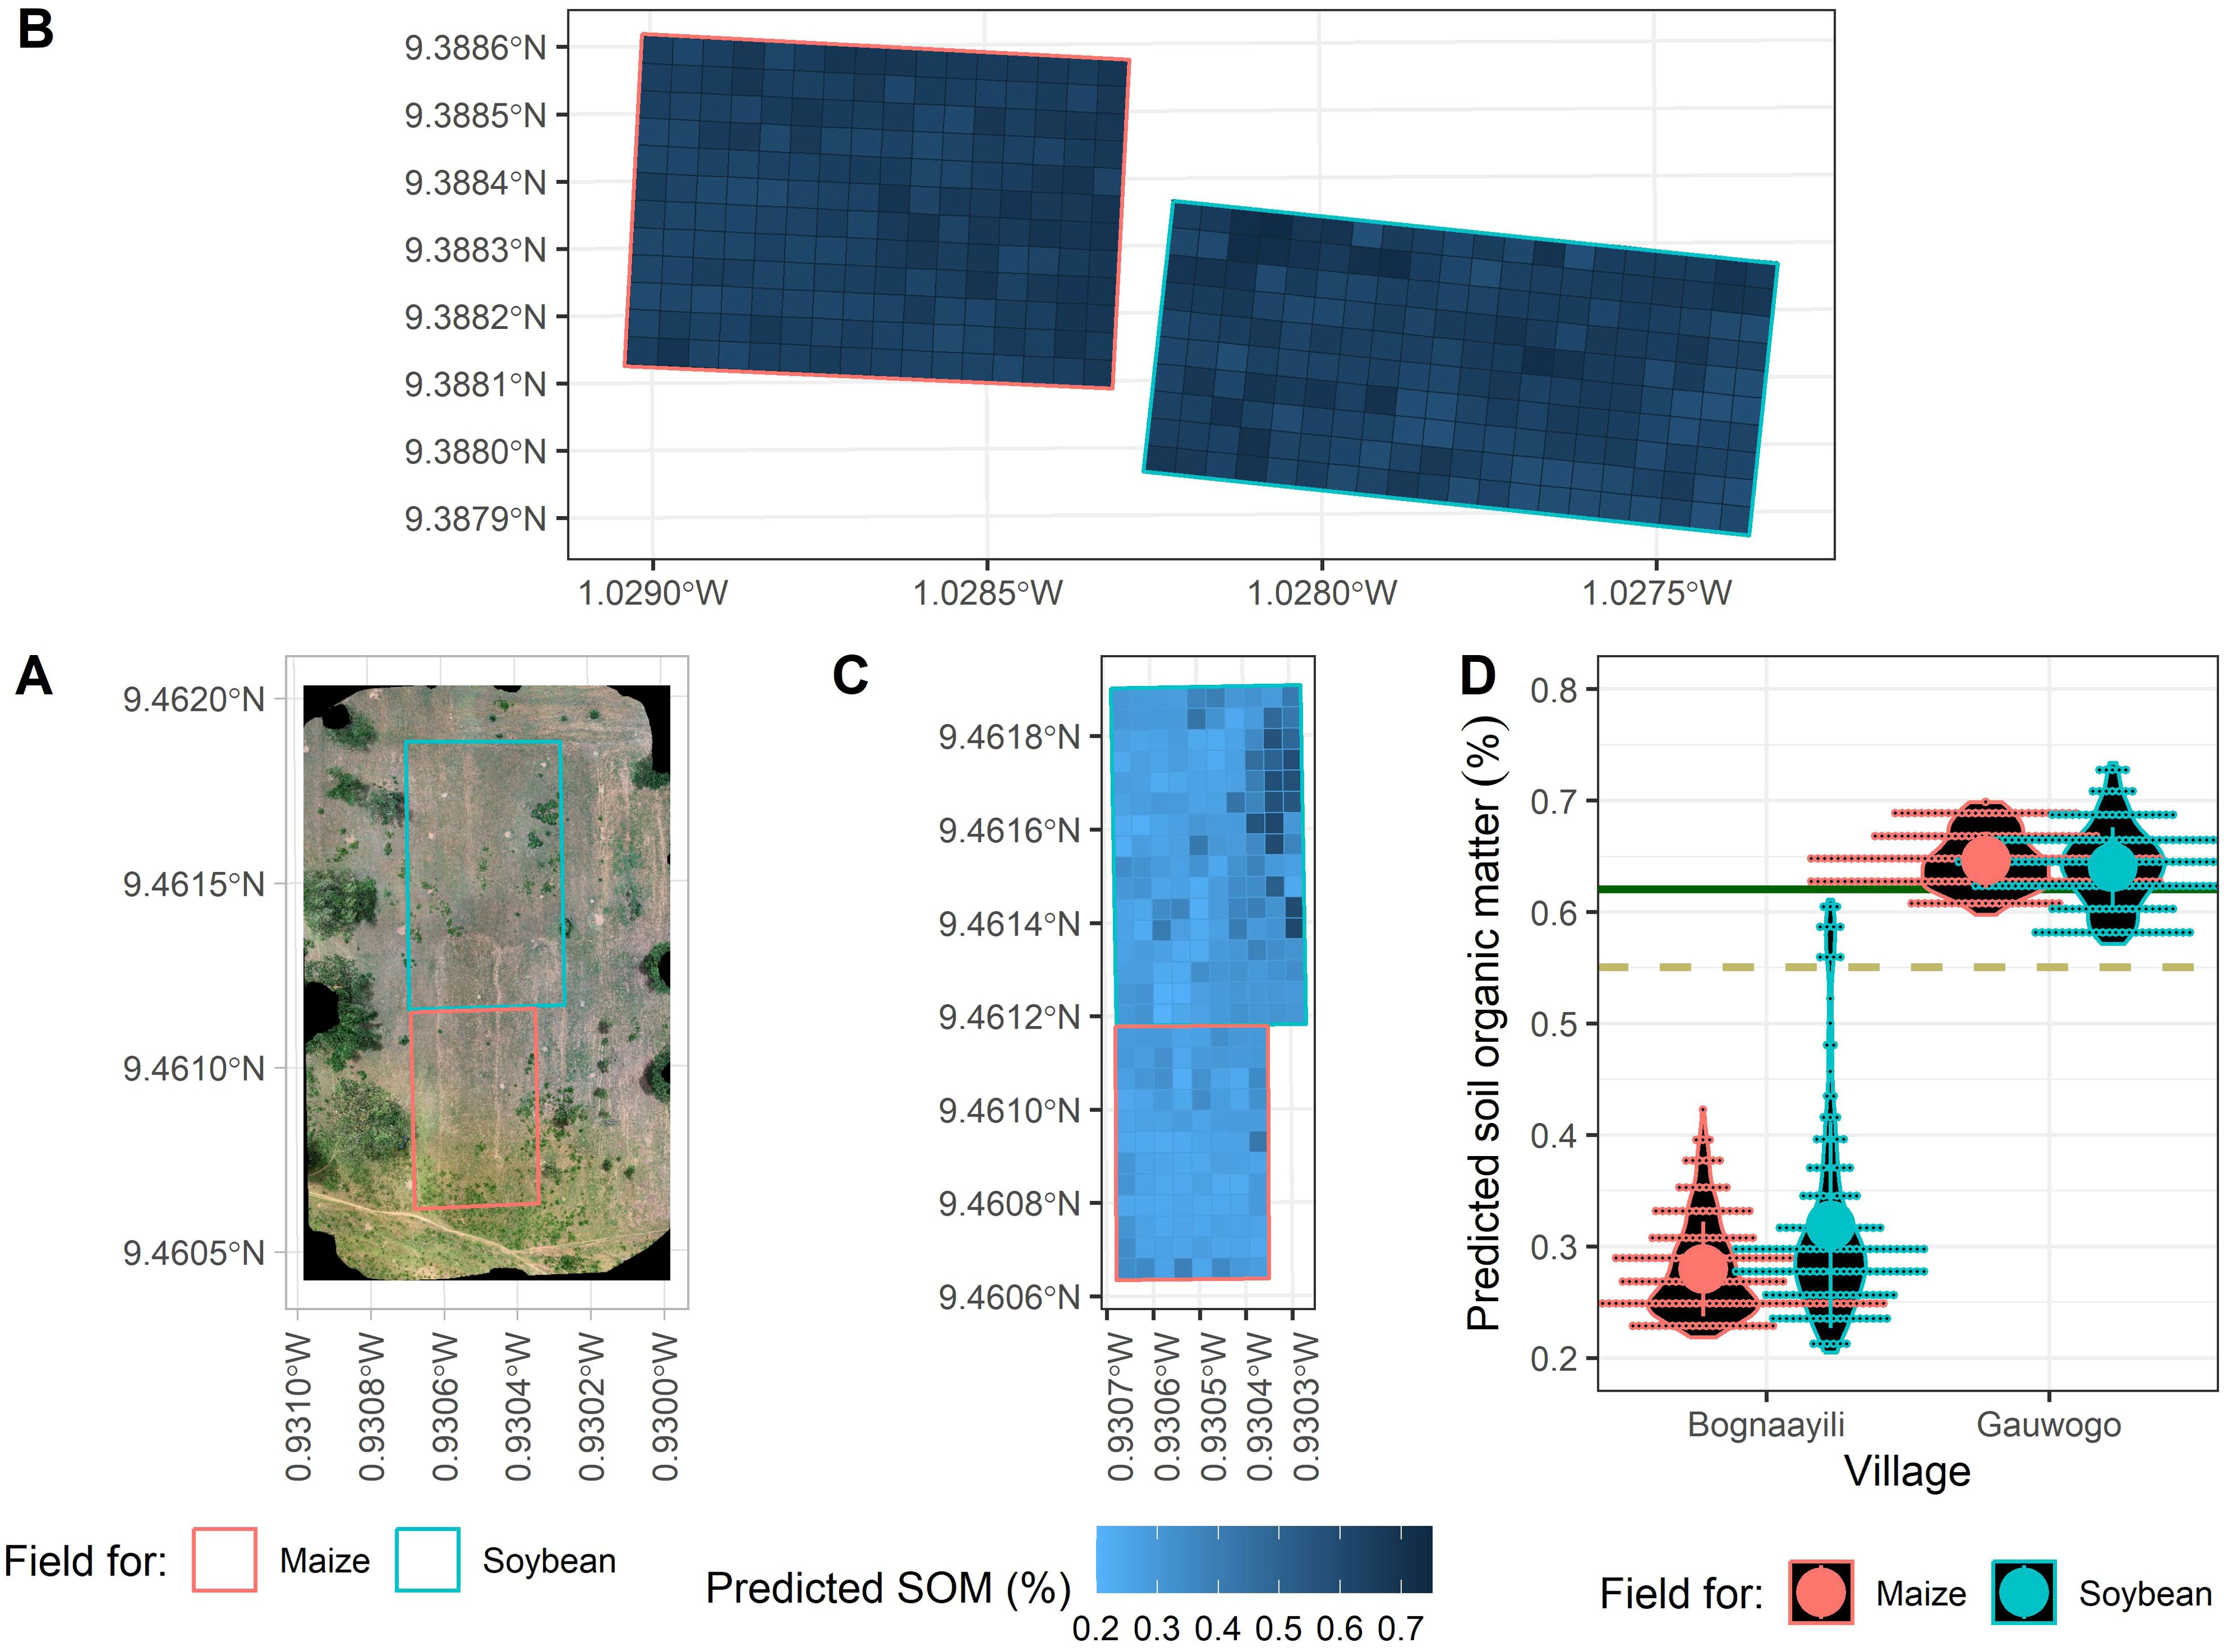
Figure 7. The natural vegetation cover in visible (RGB) color space in Bognaayili (A) and map of model predicted soil organic matter (SOM) content within the field in Bognaayili (C) and Gauwogo (B). Violin plots of model predicted soil organic matter within the fields in Bognaayili and Gauwogo (D). In Pane (D), the large dots and error bars represent means and standard deviations, the dashed dark khaki and solid dark green lines represent measured soil organic matter from composite soil samples taken immediately after the drone flight in Bognaayili and Gauwogo, respectively.
The mean model predicted SOM content in the maize field in Bognaayili was 0.28% and in Gauwogo it was 0.65% (Figure 7D). Standard deviations of the model predicted SOM values in the maize fields were 0.04% in Bognaayili and 0.03% in Gauwogo (Figure 7D).
In Bognaayili, predicted SOM values were higher in portions of the maize and soybean fields where the cover density of Icacina oliviformis (Poir.) J.Raynal weed was higher. For instance, model predicted SOM in the north-easternmost section of the soybean field in Bognaayili where Icacina oliviformis (Poir.) J.Raynal weed was present was 0.50%, while model predicted SOM in the north-westernmost section in the same field, where the weed was absent, was 0.30% (Figures 7A, C). The maize and soybean fields in Gauwogo had higher cover density of Icacina oliviformis (Poir.) J.Raynal weed in all portions of the fields, and the measured and predicted SOM in all portions of the fields were higher also (Figure 7B; Supplementary Figure 1).
3.4 Correlation between predicted soil organic matter and maize and soybean yield
The 2022 and 2023 above-ground biomass of maize in Bognaayili and Gauwogo and soybean in Gauwogo had no relationship (p > 0.05) with predicted SOM (Figure 8). However, a strong positive relationship was observed between the 2022 and 2023 above-ground biomass of soybean in Bognaayili and predicted SOM. The correlation coefficient between soybean above-ground biomass and predicted SOM in Bognaayili was 0.53 (p = 1.08 × 10⁻⁴) in 2022 and 0.65 (p = 5.66 × 10⁻⁹) in 2023 (Figure 8).
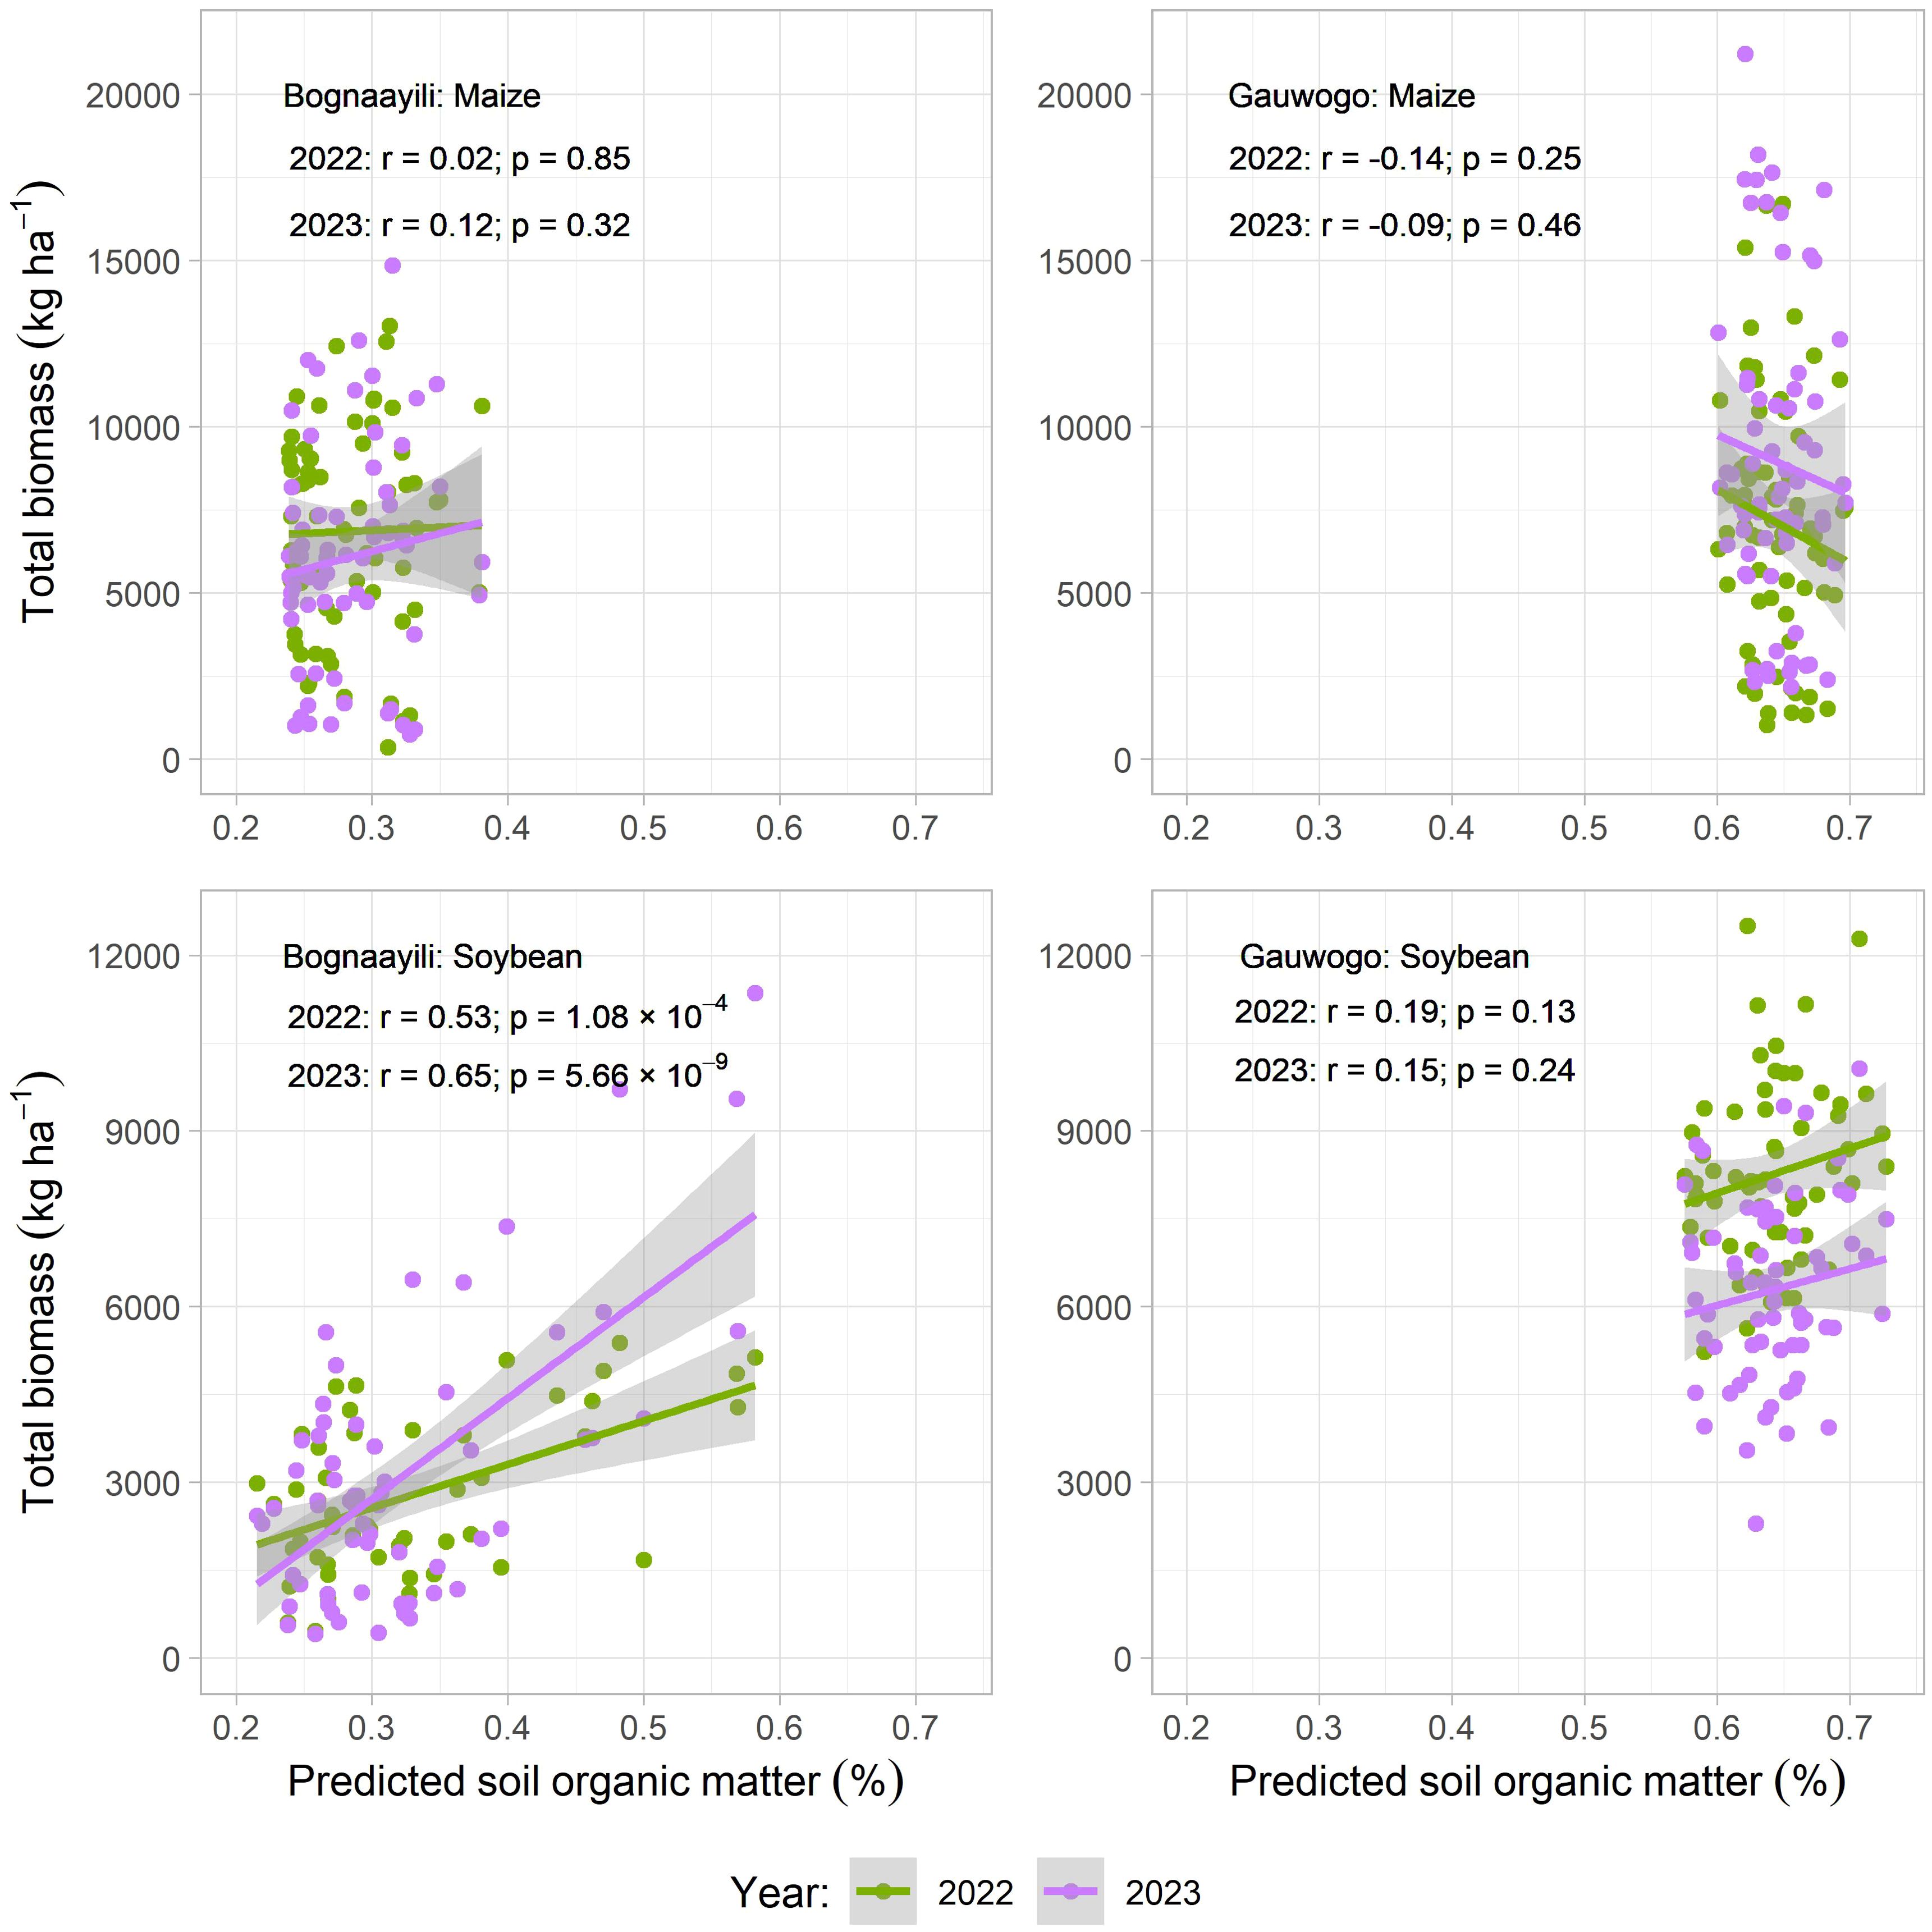
Figure 8. Correlation between crop above-ground biomass and predicted soil organic matter.
4 Discussion
Variation in crop yield within the fields of smallholder farmers in sub-Saharan Africa is high, and it has been associated with high within-field (localized) heterogeneity in soil organic matter (SOM) (4). We assessed the relationship between spectral vegetation indices and SOM, and the relationship between crop yield and predicted SOM in northern Ghana. We found that the relationship between spectral vegetation indices from early season weed cover and measured SOM was site dependent (Table 3), and the relationship between crop productivity and predicted SOM was site and crop dependent (Figure 8).
4.1 Within-field variation in early season weed cover, soil organic matter and crop yield, and their relationships
Within-field variation in spectral vegetation indices from early season weed cover was higher for the maize and soybean fields in Bognaayili than in Gauwogo (Table 2). Variation in crop cover density was higher in soybean in Bognaayili, compared to maize in Bognaayili and maize and soybean in Gauwogo (Figure 3). The values of measured SOM in the soybean field in Bognaayili were almost twice as variable as in Gauwogo (Figure 4). From these results, it can be observed that there were consistent patterns of high variability in the soybean field in Bognaayili.
The mean of the measured SOM was 0.33% in Bognaayili and 0.65% in Gauwogo (Figure 4), which are at the very low end of SOM values reported in other parts of sub-Saharan Africa (10, 56). The spectral vegetation indices from early season weed cover had significant correlations with measured SOM and soybean above-ground biomass in Bognaayili, but not in Gauwogo (Figure 5; Tables 3, 4). As such, it could be inferred that in areas where the soils have low organic matter, such as the sites used in this study, strong correlations between spectral vegetation indices from early season weed cover and measured SOM could signal high likelihood of within-field variation in crop productivity occurring.
4.2 Variation in early season weed cover as indicator of variation in soil organic matter
In Bognaayili, the trained random forest model using spectral vegetation indices from early season weed cover and measured SOM performed reasonably well in predicting SOM (Figure 6). However, in Gauwogo, the performance of the trained random forest model using spectral vegetation indices and measured SOM was poor in predicting SOM (Figure 6). The poor model performance in Gauwogo (Figure 6), which was likely due to the lack of relationship between spectral vegetation indices from early season weed cover and measured SOM in that field (Table 3), suggests that variation in spectral vegetation indices from early season weed cover may not always be a good indicator of localized heterogeneity in SOM. This is because in fields in which inherent SOM is not low enough to limit weed growth, variation in SOM does not translate into variation in weed biomass, resulting in saturation of spectral vegetation indices when the field is imaged (57, 58). Our results showed that the mean of measured SOM in Gauwogo was twice the mean of measured SOM in Bognaayili, and the standard deviation in Gauwogo was half what we observed in Bognaayili (Figure 4), indicating higher and more homogenous SOM in Gauwogo than in Bognaayili. The variances of the spectral vegetation indices were also lower in Gauwogo than in Bognaayili (Table 2) suggesting a more homogeneous weed cover density in Gauwogo.
In Gauwogo, not only was the early season weed cover density higher than in Bognaayili, the prevalence of Icacina oliviformis (Poir.) J.Raynal weed was also much higher in Gauwogo (Supplementary Figure 1). Meanwhile, portions of the maize and soybean fields in Bognaayili with high cover density of this weed also had high SOM, reaching SOM levels similar to what was observed in Gauwogo (Figure 7). Hence, including texture-based spectral vegetation indices (59) from early season weed cover images in a model for predicting SOM could make the model more effective. On the other hand, simply visually checking the types of weeds present in a field could give useful information about the levels of SOM in the field. It must be emphasized that visually assessing the types of weeds present and their indication of the levels of SOM may be very subjective, and in large fields or when the fields to be visited are many, manually assessing the types of weeds would be laborious, time consuming, and therefore more expensive.
4.3 Relationship between crop yield and predicted soil organic matter
In Bognaayili, predicted SOM had no relationship with maize above-ground biomass, but had strong positive relationship with soybean above-ground biomass (Figure 8). There could be several reasons why, unlike the maize, the soybean above-ground biomass was highly correlated with SOM in that village. For instance, both crops belong to different species, and their biological differences cause them to react differently to soil conditions (60). The maize was fertilized with the amount of nitrogen it requires in northern Ghana. Meanwhile, the soybean crop relied on nitrogen from biological nitrogen fixation to meet its nitrogen needs, and SOM enhances the abundance and diversity of soil microbiota (including nitrogen fixing bacteria) by serving as a source of energy and nutrients (61–64). Intra-aggregate particulate SOM has been reported to influence nitrogen fixation (61). The impact of SOM on nitrogen-fixing bacteria and hence nitrogen fixation could be enough a factor to trigger a relationship between soybean above-ground biomass and SOM, since nitrogen is the most important nutrient in plants (65). Further research is needed to establish the role of SOM in soybean growth at the observed levels in the soil.
The range of predicted SOM in the soybean field in Bognaayili was larger than the range of predicted SOM in the maize field in that same village (Figure 7). The smaller range of values for predicted SOM in the maize field in Bognaayili could have contributed to the lack of relationship between maize above-ground biomass and predicted SOM in that village (66).
4.4 Limitations and implications of our study
This study has some limitations. For instance, soil sampling was done at the end of season in 2023. Ideally, soil sampling for organic matter analysis should have been done immediately at the start of season in 2022, before organic matter additions were made. Despite this limitation, we think that our results are valid because yearly changes in SOM in continuously cultivated fields are minor even when large amounts of organic matter are added for one or two years (67), hence, the SOM values obtained from the soil samples collected in 2023 were considered valid for 2022 also.
The contrasting findings between Bognaayili and Gauwogo on relationships between spectral vegetation indices from early season weed cover and measured SOM, and the performance of random forest models, suggest that to apply the method presented in this study in another site, local calibration is required. Further research steps are needed to extend the database.
5 Conclusion
Spectral vegetation indices from the early season weed cover strongly correlated with soil organic matter (SOM) in the field where levels ranged between 0.19 and 0.65%, but not when SOM ranged between 0.45 and 0.65%. In the field with the lower and more variable SOM, soybean growth was also variable and there was a strong positive relationship between soybean above-ground biomass and both observed and predicted SOM. The use of spectral vegetation indices from early season weed cover images as proxy for within-field variation in SOM is a promising option that still requires some soil sampling for organic matter analysis.
Integrating drone-based early season weed cover assessment with field crop experimentation to predict variation in SOM or in fact crop performance would allow delineation of productive and unproductive plots within envisioned experimental fields, especially in regions where SOM is limiting crop performance.
Data availability statement
The original contributions presented in the study are included in the article/Supplementary Material. Further inquiries can be directed to the corresponding author.
Author contributions
YK: Conceptualization, Data curation, Methodology, Software, Writing – original draft, Writing – review & editing. FP: Methodology, Software, Writing – review & editing. DM: Conceptualization, Supervision, Writing – review & editing. PB: Conceptualization, Resources, Supervision, Writing – review & editing. NC: Conceptualization, Supervision, Writing – review & editing. TS: Conceptualization, Methodology, Resources, Supervision, Writing – review & editing. PS: Conceptualization, Methodology, Resources, Supervision, Writing – review & editing.
Funding
The author(s) declare that financial support was received for the research and/or publication of this article. This study was funded by University Mohammed VI Polytechnic (UM6P) and the OCP group through the Fertilizer Research and Responsible Implementation (FERARI) project, led by the International Fertilizer Development Center (IFDC).
Acknowledgments
The authors are grateful to the Groundnut Improvement Program at CSIR-Savanna Agricultural Research Institute (CSIR-SARI), for making their drone available to be used in this study. We would like to thank Hassanatu Mohammed (an intern at CSIR-SARI) for the assistance in getting the fields for the fieldwork, and the six farmers who co-owned the fields.
Conflict of interest
NC is a Guest Editor for Frontiers in Soil Science.
The author(s) declared that they were an editorial board member of Frontiers, at the time of submission. This had no impact on the peer review process and the final decision.
Generative AI statement
The author(s) declare that no Generative AI was used in the creation of this manuscript.
Publisher’s note
All claims expressed in this article are solely those of the authors and do not necessarily represent those of their affiliated organizations, or those of the publisher, the editors and the reviewers. Any product that may be evaluated in this article, or claim that may be made by its manufacturer, is not guaranteed or endorsed by the publisher.
Supplementary material
The Supplementary Material for this article can be found online at: https://www.frontiersin.org/articles/10.3389/fsoil.2025.1548645/full#supplementary-material
References
1. Gómez-Dans JL, Lewis PE, Yin F, Asare K, Lamptey P, Aidoo KKY, et al. Location, biophysical and agronomic parameters for croplands in northern Ghana. Earth Syst Sci Data. (2022) 14:5387–410. doi: 10.5194/essd-14-5387-2022
2. Tittonell P, van Dis R, Vanlauwe B, and Shepherd K. Managing soil heterogeneity in smallholder African landscapes requires a new form of precision agriculture. In: Soil-specific Farming Precision Agriculture. CRC Press, Boston, London, New York (2015). p. 199–224.
3. Ulzen J, Abaidoo RC, Ewusi-Mensah N, and Masso C. On-farm evaluation and determination of sources of variability of soybean response to Bradyrhizobium inoculation and phosphorus fertilizer in northern Ghana. Agricult Ecosyst Environ. (2018) 267:23–32. doi: 10.1016/j.agee.2018.08.007
4. Tittonell P and Giller KE. When yield gaps are poverty traps: The paradigm of ecological intensification in African smallholder agriculture. Field Crops Res Crop Yield Gap Anal – Rationale Methods Appl. (2013) 143:76–90. doi: 10.1016/j.fcr.2012.10.007
5. Kihara J, Bolo P, Kinyua M, Nyawira SS, and Sommer R. Soil health and ecosystem services: Lessons from sub-Sahara Africa (SSA). Geoderma. (2020) 370:114342. doi: 10.1016/j.geoderma.2020.114342
6. Jayne T, Kolavalli S, Debrah K, Ariga J, Brunache P, Kabaghe C, et al. Towards a sustainable soil fertility strategy in Ghana (No. Research Paper 3.). (2015).
7. Antwi M, Duker AA, Fosu M, and Abaidoo RC. Geospatial approach to study the spatial distribution of major soil nutrients in the Northern region of Ghana. Cogent Geosci. (2016) 2:1–13. doi: 10.1080/23312041.2016.1201906
8. Tetteh F, Larbi A, Nketia KA, Senayah JK, Hoeschle-Zeledon I, and Abdulrahman N. Suitability of soils for cereal cropping in northern Ghana (Report). International Institute of Tropical Agriculture (2016).
9. African Union. Soil Initiative for Africa: Framework Document. Africa Fertilizer and Soil Health Summit, 7-9th May 2024. Nairobi, Kenya (2024).
10. Diarisso T, Corbeels M, Andrieu N, Djamen P, Douzet J-M, and Tittonell P. Soil variability and crop yield gaps in two village landscapes of Burkina Faso. Nutr Cycl Agroecosyst. (2016) 105:199–216. doi: 10.1007/s10705-015-9705-6
11. Wollburg P, Bentze T, Lu Y, Udry C, and Gollin D. Crop yields fail to rise in smallholder farming systems in sub-Saharan Africa. Proc Natl Acad Sci. (2024) 121:e2312519121. doi: 10.1073/pnas.2312519121
12. Asei R, Abaidoo RC, Opoku A, Adjei-Nsiah S, and Antwi-Agyei P. Use of limiting nutrients for reclamation of non-responsive soils in Northern Ghana. Front Soil Sci. (2021) 1:4. doi: 10.3389/fsoil.2021.674320
13. Brummel DP. Delineation of NDVI-Based Soil Management Zones: Applications of UAS Technology. Iowa State University (2019).
14. Cudjoe DK, Virlet N, Castle M, Riche AB, Mhada M, Waine TW, et al. Field phenotyping for African crops: overview and perspectives. Front Plant Sci. (2023) 14. doi: 10.3389/fpls.2023.1219673
15. Zhang H, Shi P, Crucil G, van Wesemael B, Limbourg Q, and Van Oost K. Evaluating the capability of a UAV-borne spectrometer for soil organic carbon mapping in bare croplands. Land Degrad Dev. (2021) 32:4375–89. doi: 10.1002/ldr.4043
16. Inoue Y. Satellite- and drone-based remote sensing of crops and soils for smart farming – a review. Soil Sci Plant Nutr. (2020) 66:798–810. doi: 10.1080/00380768.2020.1738899
17. Araus JL, Kefauver SC, Vergara-Díaz O, Gracia-Romero A, Rezzouk FZ, Segarra J, et al. Crop phenotyping in a context of global change: What to measure and how to do it. J Integr Plant Biol. (2022) 64:592–618. doi: 10.1111/jipb.13191
18. Gano B, Bhadra S, Vilbig JM, Ahmed N, Sagan V, and Shakoor N. Drone-based imaging sensors, techniques, and applications in plant phenotyping for crop breeding: A comprehensive review. Plant Phenome J. (2024) 7:e20100. doi: 10.1002/ppj2.20100
19. Ye Y, Jin L, Bian C, Xian G, Lin Y, Liu J, et al. Estimating potato aboveground biomass using unmanned aerial vehicle RGB imagery and analyzing its relationship with tuber biomass. Field Crops Res. (2024) 319:109657. doi: 10.1016/j.fcr.2024.109657
20. Jangir C, Sihag S, and Meena RS. Significance of soil organic matter to soil quality and evaluation of sustainability. In: Meena RS, editor. Sustainable Agriculture. India: Scientific (2019). p. 357–81.
21. FAO. Global Soil Organic Carbon Sequestration Potential Map – GSOCseq v.1.1. FAO (2022). doi: 10.4060/cb9002en
22. Murphy BW. Impact of soil organic matter on soil properties—a review with emphasis on Australian soils. Soil Res. (2015) 53:605–35. doi: 10.1071/SR14246
23. Lal R. Soil organic matter and water retention. Agron J. (2020) 112:3265–77. doi: 10.1002/agj2.20282
24. Bae J and Ryu Y. Land use and land cover changes explain spatial and temporal variations of the soil organic carbon stocks in a constructed urban park. Landscape Urban Plann. (2015) 136:57–67. doi: 10.1016/j.landurbplan.2014.11.015
25. Ibrahim M, Ghanem F, Al-Salameen A, and Al-Fawwaz A. The estimation of soil organic matter variation in arid and semi-arid lands using remote sensing data. Int J Geosci. (2019) 10:576. doi: 10.4236/ijg.2019.105033
26. Adzawla W, Kissiedu IN, Martey E, Etwire PM, Atakora WK, Gouzaye A, et al. Baseline Study on Fertilizer Use and Food Nutrition Security in the SUDAN Savannah, Guinea Savannah, and trasitional zones of Ghana (IFDC FERARI Research Report No. 5). Ghana: IFDC (2021).
27. Seglah PA, Wang Y, Wang H, Bi Y, Zhou K, Wang Y, et al. Crop straw utilization and field burning in Northern region of Ghana. J Cleaner Product. (2020) 261:121191. doi: 10.1016/j.jclepro.2020.121191
28. Seglah PA, Wang Y, Wang H, and Bi Y. Estimation and efficient utilization of straw resources in Ghana. Sustainability. (2019) 11:4172. doi: 10.3390/su11154172
29. Agyin-Birikorang S, Tindjina I, Adu-Gyamfi R, Dauda HW, Fugice J, and Sanabria J. Managing essential plant nutrients to improve maize productivity in the savanna agroecological zones of Northern Ghana: the role of secondary and micronutrients. J Plant Nutr. (2022) 46:38–57. doi: 10.1080/01904167.2022.2027984
30. Martey E and Kuwornu JKM. Perceptions of climate variability and soil fertility management choices among smallholder farmers in Northern Ghana. Ecol Econ. (2021) 180:106870. doi: 10.1016/j.ecolecon.2020.106870
31. Adu GB, Alidu H, Amegbor IK, Nutsugah SK, Oppong A, Ewool M, et al. Hybrid maize seed production. (2019). doi: 10.13140/RG.2.2.26343.39844
32. Kugbe JX, Kombat R, and Atakora W. Secondary and micronutrient inclusion in fertilizer formulation impact on maize growth and yield across northern Ghana. Cogent Food Agric. (2019) 5:1700030. doi: 10.1080/23311932.2019.1700030
33. Addae-Frimpomaah F, Amenorpe G, Denwar NN, Amiteye S, Adazebra GA, Sossah FL, et al. Participatory approach of preferred traits, production constraints and mitigation strategies: implications for soybean breeding in Guinea Savannah zone of Ghana. Heliyon. (2022) 8:1–14. doi: 10.1016/j.heliyon.2022.e09497
34. Buah SSJ, Denwar NN, Kanton R, and Kombiok JM. Participatory approach to variety selection using soybean production in Ghana as a model. West Afr J Appl Ecol. (2020) 28:14–30.
35. Abdul Rahman N, Larbi A, Opoku A, Tetteh FM, and Hoeschle-Zeledon I. Corralling, planting density, and N fertilizer rate effect on soil properties, weed diversity, and maize yield. Agroecol Sustain Food Syst. (2019) 43:243–60. doi: 10.1080/21683565.2018.1516264
36. Bessah E, Amponsah W, Ansah SO, Afrifa A, Yahaya B, Wemegah CS, et al. Climatic zoning of Ghana using selected meteorological variables for the period 1976–2018. Meteorol Appl. (2022) 29:e2049. doi: 10.1002/met.2049
37. Yamba EI, Aryee JNA, Quansah E, Davies P, Wemegah CS, Osei MA, et al. Revisiting the agro-climatic zones of Ghana: A re-classification in conformity with climate change and variability. PloS Climate. (2023) 2:e0000023. doi: 10.1371/journal.pclm.0000023
38. Adu-Prah S, Appiah-Opoku S, and Aboagye D. Spatiotemporal evidence of recent climate variability in Ghana. Afr Geograph Rev. (2019) 38:172–90. doi: 10.1080/19376812.2017.1404923
39. National Variety Release Catalogue. Catalogue of Crop Varieties Released and Registered in Ghana. (2019).
40. Kassim YB, Oteng-Frimpong R, Puozaa DK, Sie EK, Abdul Rasheed M, Abdul Rashid I, et al. High-throughput plant phenotyping (HTPP) in resource-constrained research programs: A working example in Ghana. Agronomy. (2022) 12:2733. doi: 10.3390/agronomy12112733
41. Bai G, Jenkins S, Yuan W, Graef GL, and Ge Y. Field-based scoring of soybean iron deficiency chlorosis using RGB imaging and statistical learning. Front Plant Sci. (2018) 9:1002. doi: 10.3389/fpls.2018.01002
42. Casadesús J, Kaya Y, Bort J, Nachit MM, Araus JL, Amor S, et al. Using vegetation indices derived from conventional digital cameras as selection criteria for wheat breeding in water-limited environments. Ann Appl Biol. (2007) 150:227–36. doi: 10.1111/j.1744-7348.2007.00116.x
43. Gitelson AA, Kaufman YJ, Stark R, and Rundquist D. Novel algorithms for remote estimation of vegetation fraction. Remote Sens Environ. (2002) 80:76–87. doi: 10.1016/S0034-4257(01)00289-9
44. Karcher DE and Richardson MD. Quantifying turfgrass color using digital image analysis. Crop Sci. (2003) 43:943–51. doi: 10.2135/cropsci2003.9430
45. Kipp S, Mistele B, Baresel J, and Schmidhalter U. High-throughput phenotyping early plant vigour of winter wheat. Eur J Agron. (2013) 52:271–8. doi: 10.1016/j.eja.2013.08.009
46. Louhaichi M, Borman MM, and Johnson DE. Spatially located platform and aerial photography for documentation of grazing impacts on wheat. Geocarto Int. (2001) 16:65–70. doi: 10.1080/10106040108542184
47. Richardson AJ and Wiegand CL. Distinguishing vegetation from soil background information. Photogramm Eng Remote Sens. (1977) 43:1541–52.
48. Tucker CJ. Red and photographic infrared linear combinations for monitoring vegetation. Remote Sens Environ. (1979) 8:127–50. doi: 10.1016/0034-4257(79)90013-0
49. Zarco-Tejada P, Berjon A, Lopezlozano R, Miller J, Martin P, Cachorro V, et al. Assessing vineyard condition with hyperspectral indices: Leaf and canopy reflectance simulation in a row-structured discontinuous canopy. Remote Sens Environ. (2005) 99:271–87. doi: 10.1016/j.rse.2005.09.002
50. Walkley A and Black IA. An examination of the degtjareff method for determining soil organic matter, and A proposed modification of the chromic acid titration method. Soil Sci. (1934) 37:29. doi: 10.1097/00010694-193401000-00003
51. Van Bemmelen JM. Über die Bestimmung des Wassers, des Humus, des Schwefels, der in den colloïdalen Silikaten gebundenen Kieselsäure, des Mangans u. s. w. im Ackerboden. Die Landwirthschaftlichen Versuchs-Stationen. (1890) 37:279–90.
52. Hernangómez D. Using the tidyverse with terra objects: the tidyterrapackage. JOSS. (2023) 8:5751. doi: 10.21105/joss.05751
55. Wickham H, Averick M, Bryan J, Chang W, McGowan LD, François R, et al. Welcome to the tidyverse. J Open Source Software. (2019) 4:1686. doi: 10.21105/joss.01686
56. Maman G, Idriss S, and Wortmann C. Crop yield response to fertilizer relative to soil properties in sub-saharan Africa. Soil Sci Soc America J. (2018) 82:862–70. doi: 10.2136/sssaj2018.02.0066
57. Mutanga O, Masenyama A, and Sibanda M. Spectral saturation in the remote sensing of high-density vegetation traits: A systematic review of progress, challenges, and prospects. ISPRS J Photogramm Remote Sens. (2023) 198:297–309. doi: 10.1016/j.isprsjprs.2023.03.010
58. Wang W, Yao X, Yao X, Tian Y, Liu X, Ni J, et al. Estimating leaf nitrogen concentration with three-band vegetation indices in rice and wheat. Field Crops Res. (2012) 129:90–8. doi: 10.1016/j.fcr.2012.01.014
59. Wulder MA, LeDrew EF, Franklin SE, and Lavigne MB. Aerial image texture information in the estimation of northern deciduous and mixed wood forest leaf area index (LAI). Remote Sens Environ. (1998) 64:64–76. doi: 10.1016/S0034-4257(97)00169-7
60. Roobroeck D, Palm CA, Nziguheba G, Weil R, and Vanlauwe B. Assessing and understanding non-responsiveness of maize and soybean to fertilizer applications in African smallholder farms. Agricult Ecosyst Environ. (2021) 305:107165. doi: 10.1016/j.agee.2020.107165
61. Blesh J. Feedbacks between nitrogen fixation and soil organic matter increase ecosystem functions in diversified agroecosystems. Ecol Appl. (2019) 29:e01986. doi: 10.1002/eap.1986
62. Ciampitti IA and Salvagiotti F. New insights into soybean biological nitrogen fixation. Agron J. (2018) 110:1185–96. doi: 10.2134/agronj2017.06.0348
63. Fan H, Jia S, Yu M, Chen X, Shen A, and Su Y. Long-term straw return increases biological nitrogen fixation by increasing soil organic carbon and decreasing available nitrogen in rice–rape rotation. Plant Soil. (2022) 479:267–79. doi: 10.1007/s11104-022-05515-0
64. Jaiswal SK, Naamala J, and Dakora FD. Nature and mechanisms of aluminium toxicity, tolerance and amelioration in symbiotic legumes and rhizobia. Biol Fertil Soils. (2018) 54:309–18. doi: 10.1007/s00374-018-1262-0
65. Hawkesford MJ, Cakmak I, Coskun D, De Kok LJ, Lambers H, Schjoerring JK, et al. Chapter 6 - functions of macronutrients. In: Rengel Z, Cakmak I, and White PJ, editors. Marschner’s mineral Nutrition of Plants, 4th ed. Academic Press, San Diego (2023). p. 201–81. doi: 10.1016/B978-0-12-819773-8.00019-8
66. da Silva MAS and Seixas TM. The role of data range in linear regression. Phys Teacher. (2017) 55:371–2. doi: 10.1119/1.4999736
Keywords: soil organic matter, yield variability, smallholder farmers, maize, soybean, spectral vegetation indices
Citation: Kassim YB, Pinto F, MacCarthy DS, Bindraban P, Chirinda N, Stomph T and Struik PC (2025) Can drone images predict within-field variability in soil fertility? A case study in the Northern Region of Ghana. Front. Soil Sci. 5:1548645. doi: 10.3389/fsoil.2025.1548645
Received: 20 December 2024; Accepted: 24 April 2025;
Published: 04 June 2025.
Edited by:
Jose Navarro Pedreño, Miguel Hernández University of Elche, SpainReviewed by:
Samuel Anuga, European University Institute (EUI), ItalyKnight Nthebere, National University of Lesotho, Lesotho
Copyright © 2025 Kassim, Pinto, MacCarthy, Bindraban, Chirinda, Stomph and Struik. This is an open-access article distributed under the terms of the Creative Commons Attribution License (CC BY). The use, distribution or reproduction in other forums is permitted, provided the original author(s) and the copyright owner(s) are credited and that the original publication in this journal is cited, in accordance with accepted academic practice. No use, distribution or reproduction is permitted which does not comply with these terms.
*Correspondence: Yussif Baba Kassim, eXVzc2lmYmFiYS5rYXNzaW1Ad3VyLm5s
†Present address: Prem Bindraban, Africa Rice Center (AfricaRice), Abidjan, Côte d’Ivoire