 Jun-Ming Yin†
 Guo-Cheng Du
- Mastothyroid Vascular Surgery, The Second Clinical Medical College of North Sichuan Medical College Nanchong Central Hospital, Nanchong, China
Purpose: The current study aimed to investigate whether red blood cell distribution width (RDW) can predict the prognosis of patients with breast cancer (BC).
Methods: We searched four databases, including PubMed, Embase, Cochrane Library databases, and CNKI, from inception to Jun 13, 2022. The primary outcome was overall survival (OS), and the secondary outcome was disease-free survival (DFS). A subgroup analysis was conducted based on different treatments. This meta-analysis was performed with RevMan 5.3 (The Cochrane Collaboration, London, United Kingdom).
Results: A total of seven studies including 4,884 BC patients were identified. The high RDW group had a larger tumor size (OR = 2.12, 95% CI = 1.67 to 2.68, P < 0.01), higher proportions of advanced stage tumors (OR = 1.77, 95% CI = 1.38 to 2.27, P < 0.01), more lymph node metastases (OR = 2.00, 95% CI = 1.58 to 2.51, P < 0.01) and lower HER-2 expression (OR = 0.76, 95% CI = 0.61 to 0.95, P = 0.02). For prognosis, after pooling all the data, we found that the high RDW group was associated with worse OS (HR = 2.12, 95% CI = 1.47 to 3.08, P < 0.01) and DFS (HR = 1.77, 95% CI = 1.32 to 2.37, P < 0.01). The subgroup analysis found that RDW had prognostic significance but only for surgery-only patients (HR = 2.41, 95% CI = 1.67 to 3.49, P < 0.01).
Conclusion: High RDW was associated with worse OS and DFS. Therefore, RDW was a simple predictive factor for the prognosis of BC patients.
Introduction
Breast cancer (BC) is one of the most common cancers and the second leading cause of cancer-related death in women worldwide (1, 2). Approximately 1.5 million women are diagnosed with BC each year, and this number is expected to increase to 2.2 million annually by 2025 (3). There are different treatments, including systemic therapy, surgery, and radiotherapy, depending on the stage of BC (4–6). Therefore, convenient preoperative predictive values for BC prognosis could help surgeons develop treatment strategies and improve surgical outcomes.
Red blood cell distribution width (RDW) is a simple and readily available parameter that represents the heterogeneity of red blood cell volume and is traditionally used in the differential diagnosis of anemia (7). Elevated RDW can predict mortality and morbidity in patients with benign diseases, including cerebral infarction (8), acute myocardial infarction (9), pancreatitis (10), pulmonary embolism (11), acute renal failure (12), coronary artery disease, and heart failure (13, 14). It is also a marker for predicting the prognosis of tumors such as gastric cancer (15), esophageal cancer (16), hepatocellular carcinoma, and colorectal cancer (17, 18).
However, for BC, the effect of RDW on prognosis is controversial (19–25). Wang C et al. analyzed 443 BC patients and found that RDW was not a prognostic factor for OS (19). Similarly, Takeuchi H et al. analyzed 299 BC patients and found that RDW was not a predictor for DFS (20). However, Yoo YC et al. demonstrated that high RDW had high predictive power for OS and DFS (21). In another study reported by Yao D et al. high pretreatment RDW levels in BC patients were associated with poor OS and DFS; thus, RDW could be a potential predictive factor in determining poor prognosis in all from all patients (23). Therefore, it is necessary to identify the exact role of RDW in the prognosis of BC patients.
Materials and methods
This meta-analysis was conducted following the Preferred Reporting Items for Systematic Reviews and Meta-Analyses (PRISMA) statement (26).
Literature search strategy
We searched four databases, including PubMed, Embase, Cochrane Library databases, and CNKI, from inception to Jun 13, 2022. The search strategy included two keywords: RDW and BC. For RDW, the search strategy was as follows: “red blood cell distribution width” OR “red cell distribution width” OR “RDW”. In terms of BC, the search strategy was as follows: “Breast Neoplasms” OR “Breast Cancer” OR “Breast Tumor” OR “Breast Tumors” OR “Breast Carcinoma” OR “Breast Carcinomas”. Then, we use “AND” to combine the two keywords. The languages were limited to English and Chinese.
Inclusion and exclusion criteria
Our meta-analysis aimed to analyze the effect of RDW on the prognosis of BC, therefore, the inclusion criteria for studies were as follows: (1) the patients included were diagnosed with primary BC; (2) the study included both a control group (the low RDW group) and an exercise group (the high RDW group); (3) the study reported the prognosis including overall survival (OS) or disease-free survival (DFS); and (4) the study was published in English or Chinese. The exclusion criteria for studies were as follows: (1) the article type was a case report, a review, a letter to the editor, comments, or conference literature; and (2) there was an absence of the full text. Two reviewers conducted the inclusion and exclusion criteria, separately. Disagreement was settled by group discussion.
Study selection
Two reviewers searched the four databases. The duplicated studies were eliminated first. Then, the titles and abstracts were screened to find eligible studies. After that, the full texts were checked to determine whether the studies were suitable for the final analysis. Two reviewers conducted the study selection, and the final judgment was made after a group discussion.
Data extraction
The data included the study information, baseline information, and prognostic information. The study information included the first author, publishing year, publishing country, and Newcastle-Ottawa Scale (NOS) score. The baseline information included the study data, patient information, sample size, and cutoff value of RDW. The prognostic information included OS and DFS. These data were extracted independently and cross-checked by two reviewers.
Definitions and outcomes
OS was defined as the time from diagnosis to death due to any cause. DFS was defined as the time from diagnosis to the time of recurrence, death, or last follow-up. The primary outcome was OS, and the secondary outcome was DFS.
Quality assessment
The NOS score was used to evaluate the quality of the included studies (27). A score of nine points represented high quality; a score of seven to eight points represented medium quality; and low-quality studies scored less than seven points.
Statistical analysis
In the current meta-analysis, dichotomous variables including tumor diameter, tumor stage, type of surgery, chemotherapy, lymph node metastases, peritumoral vascular invasion, and estrogen receptor (ER)/progesterone receptor (PR) positivity, were collected, and odds ratios (ORs) plus 95% confidence intervals (CIs) were calculated. For OS and DFS, hazard ratios (HRs) plus 95% CIs were calculated. A subgroup analysis was conducted according to the different treatments for patients. The I2 value and the chi-squared test were used to assess the statistical heterogeneity (28, 29). When I2 > 50%, the random effects model was used, and p < 0.1 was considered statistically significant. The fixed effects model was used when I2 ≤ 50%, and p < 0.05 was considered statistically significant. This meta-analysis was performed with RevMan 5.3 (The Cochrane Collaboration, London, United Kingdom).
Results
Study selection
A total of 71 studies were identified in the four databases (21 studies in PubMed, 32 studies in Embase, 0 studies in the Cochrane Library, and 18 studies in CNKI). There were 52 studies after removing the duplicated studies. Finally, seven studies were left for the final analysis (Figure 1).
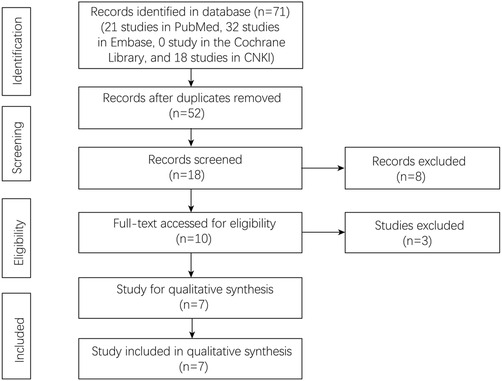
Figure 1. Flowchart of study selection.
Patient characteristics and quality assessment of the included studies
A total of seven studies including 4,884 BC patients were identified (19–25). The publishing year was from 2014 to 2021. Five studies were published in China, one study was published in Korea and one study was published in Japan. The study period was from 1996 to 2017. For the prognosis, six studies reported OS, and five studies reported DFS. The sample size, treatment, cutoff value, and NOS score of each included study are shown in Table 1.
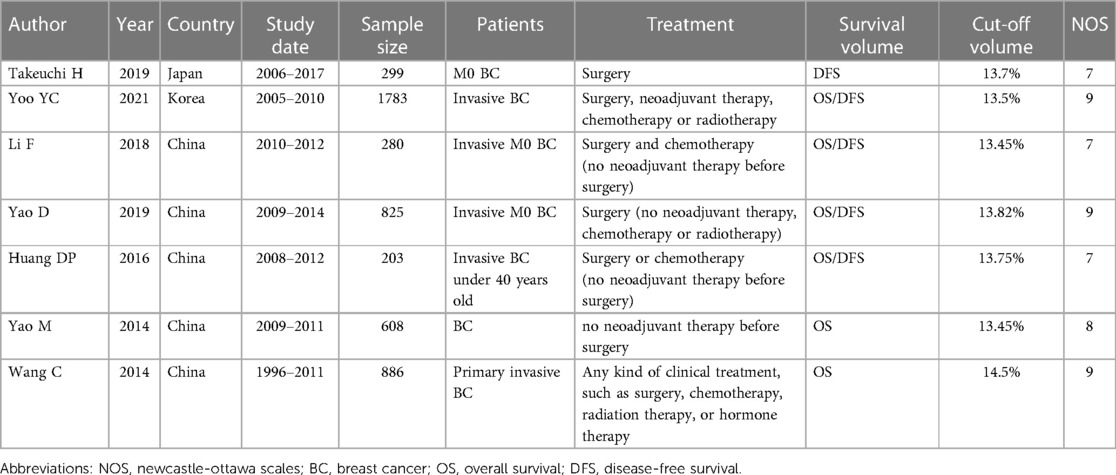
Table 1. Baseline characteristics of included studies.
Baseline information
The baseline information including tumor diameter, tumor stage, type of surgery, chemotherapy, lymph node metastases, peritumoral vascular invasion, ER/PR positivity, HER-2, and Ki-67, was compared between the high RDW group and the low RDW group. The high RDW group had a larger tumor size (OR = 2.12, 95% CI = 1.67 to 2.68, P < 0.01), a higher proportion of advanced stage tumors (OR = 1.77, 95% CI = 1.38 to 2.27, P < 0.01), more lymph node metastases (OR = 2.00, 95% CI = 1.58 to 2.51, P < 0.01) and lower HER-2 expression (OR = 0.76, 95% CI = 0.61 to 0.95, P = 0.02) (Table 2).
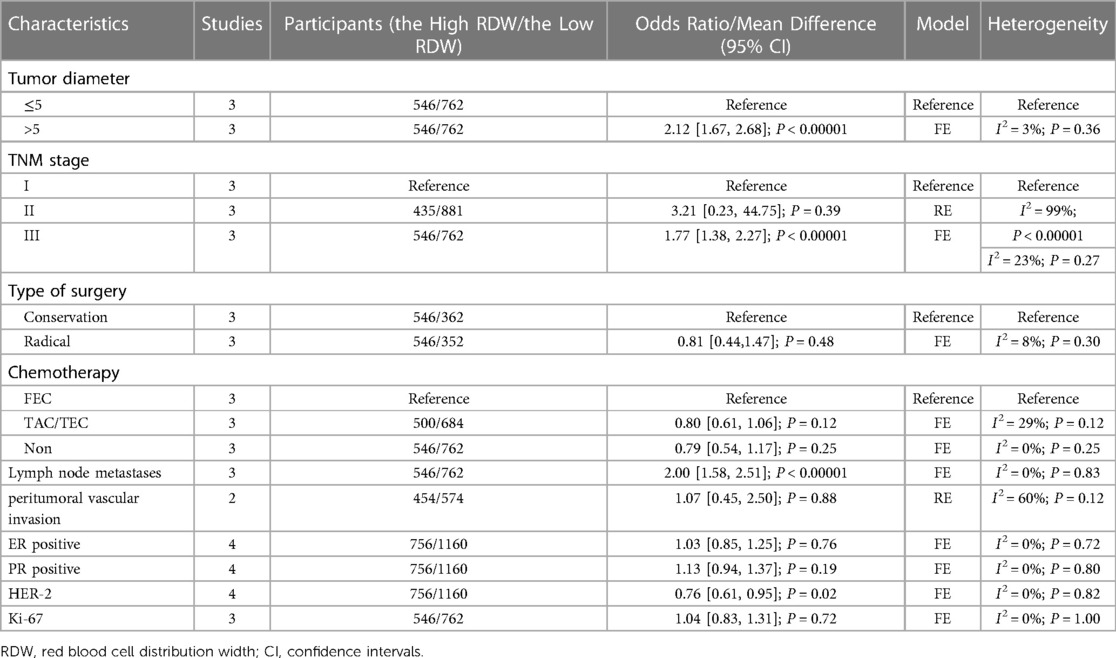
Table 2. Summary of characteristics between the high RDW group and the Low RDW group.
OS
Six studies with 4,585 patients reported OS data on BC patients. After pooling all the data, we found that the high RDW group was associated with worse OS than the low RDW group (HR = 2.12, 95% CI = 1.47 to 3.08, P < 0.01) (Figure 2).
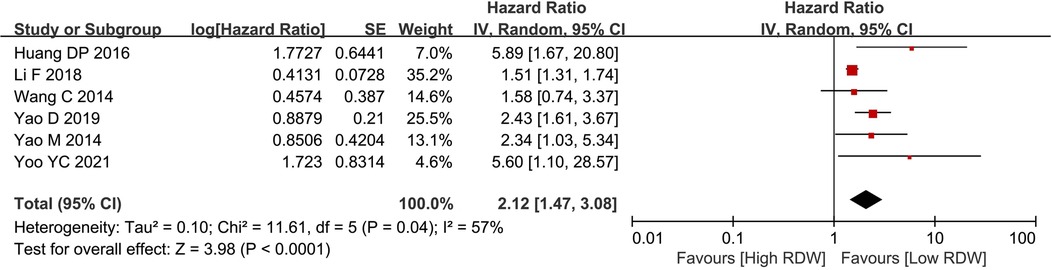
Figure 2. Os between the high RDW group and the low RDW group. Abbreviation: OS, overall survival; RDW, red blood cell distribution width.
DFS
Five studies with 3,390 patients reported data on DFS in BC patients. After pooling all the data, we found that the high RDW group was associated with worse DFS than the low RDW group (HR = 1.77, 95% CI = 1.32 to 2.37, P < 0.01) (Figure 3).
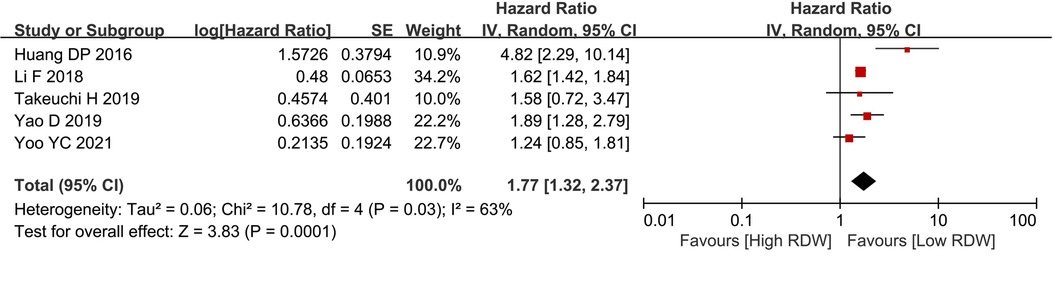
Figure 3. DFS between the high RDW group and the low RDW group. Abbreviation: DFS, disease-free survival; RDW, red blood cell distribution width.
Subgroup analysis for Os
According to the different treatments, the BC patients were divided into three groups. Two studies included patients who received surgery, neoadjuvant treatment or adjuvant treatment, two studies included patients who received surgery or adjuvant treatment, and two studies included patients who only underwent surgery. After subgroup analysis, RDW had prognostic significance only for the surgery-only patients (HR = 2.41, 95% CI = 1.67 to 3.49, P < 0.01) but not for the all-treatment groups (HR = 2.40, 95% CI = 0.75 to 7.72, P = 0.14) and the neoadjuvant treatment groups (HR = 2.57, 95% CI = 0.70 to 9.41, P = 0.16) (Figure 4).
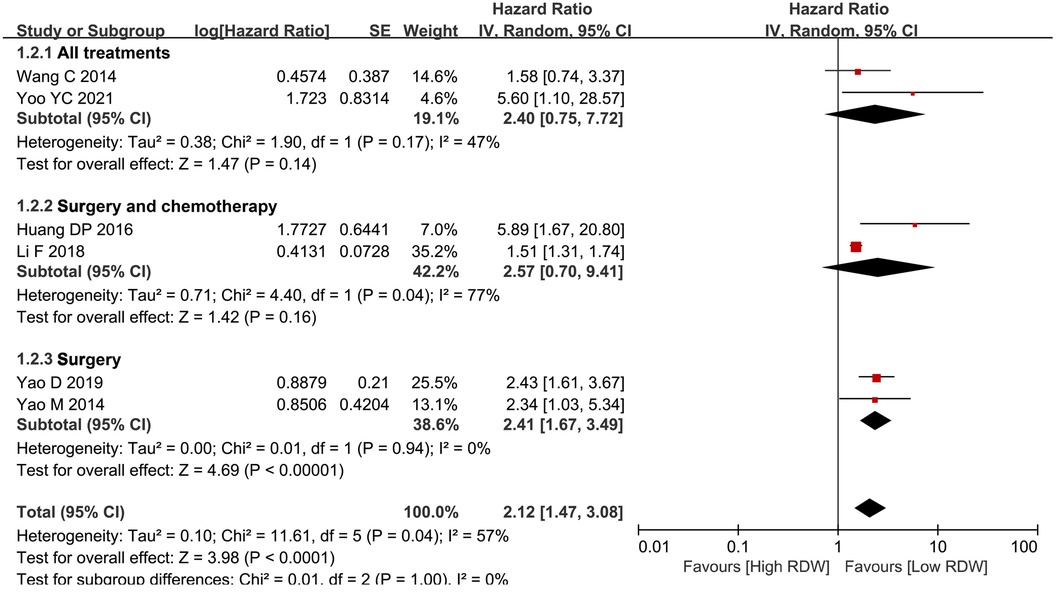
Figure 4. Subgroup analysis for OS based on treatment. Abbreviation: RDW, red blood cell distribution width.
Sensitivity analysis
A sensitivity analysis was conducted by excluding one study at a time to examine its impact on the result. In the current meta-analysis, the sensitivity analysis was performed based on the outcomes of OS and DFS, and the subgroup analyses of OS. After each study was successively removed, the omission of any of the studies did not change the conclusion. This suggested that the outcomes had a low level of sensitivity and produced reliable results.
Discussion
A total of seven studies including 4,884 BC patients were included in the current meta-analysis. For prognosis, after pooling all the data, we found that the high RDW group was associated with worse OS and DFS than the low RDW group, especially for BC patients who underwent only radical surgery. Therefore, we concluded that RDW could be widely used in the clinic as an easy preoperative prognostic predictor. Surgeons should pay more attention to patients with high preoperative RDW levels and take action in advance to prolong the survival time of BC patients.
Although many new prognostic markers have been explored and identified, the major problem with these biomarkers is that they heavily rely on complex molecular or genetic tests (30–32). Hematological parameters, including albumin, C-reactive protein (CRP), neutrophils, and lymphocytes, are readily available and inexpensive parameters for BC patients that could predict the prognosis (33–35). As a routinely available marker of the systemic inflammatory response, RDW predicts negative clinical outcomes in various tumors. However, there is a controversy regarding whether RDW has an impact on BC (19–25).
Of the seven included studies, two reported that RDW was a prognostic indicator (19, 20), but the other five studies reported that RDW did not affect BC (21–25). Therefore, the current study aims to investigate whether RDW can predict the prognosis of BC. If RDW could be used as an easy prognostic indicator, it would be a convenient clinical reference value. To our knowledge, our study is the first to pool all the prognostic data of RDW in BC. In our study, we found that high RDW was associated with worse OS and DFS than low RDW, which indicated that RDW was an important biomarker for BC.
The mechanisms for the relationship between RDW and poor prognosis remain complex and unclear. However, some hypotheses accounted for the mechanisms. One hypothesis was that oxidative stress (23, 36) might reduce the survival of red blood cells and lead to elevated RDW. Both endogenous and exogenous sources of reactive oxygen species (ROS) can lead to increased oxidative stress in cells (37). Moreover, excessive ROS can cause damage and modification of cellular macromolecules, thus mutating genomic DNA. Another hypothesis was that chronic inflammation (38) could induce an increase in RDW by disrupting the erythrocyte membrane, leading to changes in erythrocyte maturation. Inflammation in the microenvironment could promote tumor growth, invasion, angiogenesis, and ultimately metastasis of BC (39, 40). This was corroborated by our finding that patients with high RDW had larger tumor sizes, more advanced tumor stages, and were more likely to have lymph node metastases.
Thus, for clinicians, it is critical to pay more attention to monitoring patients with high preoperative RDW. Minimizing RDW before surgery and providing interventions such as nutritional support or anti-inflammatory drugs are necessary treatment strategies (21, 41).
There were some limitations in our meta-analysis. First, the seven included studies were relatively small with a small number of BC patients, which might cause bias; Second, the cut-off of RDW was inconsistent, which might cause heterogeneity; Third, all the included studies were from Asia, the lack of other regions might also lead to selection bias. Therefore, multicenter, multiregional, prospective, and high-quality RCTs should be carried out in the future.
In conclusion, high RDW was associated with worse OS and DFS. Therefore, RDW was a simple predictive factor for the prognosis of BC patients.
Data availability statement
The raw data supporting the conclusions of this article will be made available by the authors, without undue reservation.
Author contributions
GD and JY contributed to the conception and design of the study. JY organized the database. GD performed the statistical analysis. GD and JY wrote the first draft of the manuscript. KZ, ZG, WY, and YH wrote sections of the manuscript. All authors contributed to the article and approved the submitted version.
Funding
This study was supported by therapeutic effect and mechanism of ultrasound combined with neoadjuvant chemotherapy for breast cancer. (2022KFKT007)
Conflict of interest
The authors declare that the research was conducted in the absence of any commercial or financial relationships that could be construed as a potential conflict of interest.
Publisher's note
All claims expressed in this article are solely those of the authors and do not necessarily represent those of their affiliated organizations, or those of the publisher, the editors and the reviewers. Any product that may be evaluated in this article, or claim that may be made by its manufacturer, is not guaranteed or endorsed by the publisher.
Supplementary material
The Supplementary Material for this article can be found online at: https://www.frontiersin.org/articles/10.3389/fsurg.2023.1000522/full#supplementary-material.
References
1. Sung H, Ferlay J, Siegel RL, Laversanne M, Soerjomataram I, Jemal A, et al. Global cancer statistics 2020: gLOBOCAN estimates of incidence and mortality worldwide for 36 cancers in 185 countries. CA Cancer J Clin. (2021) 71(3):209–49. doi: 10.3322/caac.21660
2. Zujewski JA, Dvaladze AL, Ilbawi A, Anderson BO, Luciani S, Stevens L, et al. Knowledge summaries for comprehensive breast cancer control. J Glob Oncol. (2018) 4:1–7. doi: 10.1200/JGO.17.00141
3. Niu Y, Zhang F, Chen D, Ye G, Li Y, Zha Y, et al. A comparison of Chinese multicenter breast cancer database and SEER database. Sci Rep. (2022) 12(1):10395. doi: 10.1038/s41598-022-14573-4
4. Reis J, Boavida J, Tran HT, Lyngra M, Reitsma LC, Schandiz H, et al. Assessment of preoperative axillary nodal disease burden: breast MRI in locally advanced breast cancer before, during and after neoadjuvant endocrine therapy. BMC Cancer. (2022) 22(1):702. doi: 10.1186/s12885-022-09813-9
5. Curigliano G, Cardoso MJ, Poortmans P, Gentilini O, Pravettoni G, Mazzocco K, et al. Recommendations for triage, prioritization and treatment of breast cancer patients during the COVID-19 pandemic. Breast. (2020) 52:8–16. doi: 10.1016/j.breast.2020.04.006
6. Bel'skaya LV, Sarf EA. Prognostic value of salivary biochemical indicators in primary resectable breast cancer. Metabolites. (2022) 12(6):552. doi: 10.3390/metabo12060552
7. Ferrucci L, Guralnik JM, Woodman RC, Bandinelli S, Lauretani F, Corsi AM, et al. Proinflammatory state and circulating erythropoietin in persons with and without anemia. Am J Med. (2005) 118(11):1288. doi: 10.1016/j.amjmed.2005.06.039
8. Xie KH, Liu LL, Liang YR, Su CY, Li H, Liu RN, et al. Red cell distribution width: a novel predictive biomarker for stroke risk after transient ischaemic attack. Ann Med. (2022) 54(1):1167–77. doi: 10.1080/07853890.2022.2059558
9. Isik T, Uyarel H, Tanboga IH, Kurt M, Ekinci M, Kaya A, et al. Relation of red cell distribution width with the presence, severity, and complexity of coronary artery disease. Coron Artery Dis. (2012) 23(1):51–6. doi: 10.1097/MCA.0b013e32834e4f5c
10. O'Connell RM, Boland MR, O'Driscoll J, Salih A, Arumugasamy M, Walsh TN, et al. Red cell distribution width and neutrophil to lymphocyte ratio as predictors of outcomes in acute pancreatitis: a retrospective cohort study. Int J Surg. (2018) 55:124–7. doi: 10.1016/j.ijsu.2018.05.028
11. Xing X, Deng Y, Zhu Y, Xu S, Liu J, Zhang C, et al. Red cell distribution width for prognosis in patients with pulmonary embolism: a systematic review and meta-analysis. Clin Respir J. (2020) 14(10):901–7. doi: 10.1111/crj.13227
12. Yonemoto S, Hamano T, Fujii N, Shimada K, Yamaguchi S, Matsumoto A, et al. Red cell distribution width and renal outcome in patients with non-dialysis-dependent chronic kidney disease. PLoS One. (2018) 13(6):e0198825. doi: 10.1371/journal.pone.0198825
13. Latif A, Ahsan MJ, Lateef N, Kapoor V, Fazeel HM, Razzaq F, et al. Prognostic impact of red cell distribution width on the development of contrast-induced nephropathy, Major adverse cardiac events, and mortality in coronary artery disease patients undergoing percutaneous coronary intervention. Curr Cardiol Rev. (2021) 17(6):e051121191160. doi: 10.2174/1573403X17666210204154812
14. Hullin R, Barras N, Abdurashidova T, Monney P, Regamey J. Red cell distribution width and prognosis in acute heart failure: ready for prime time!. Intern Emerg Med. (2019) 14(2):195–7. doi: 10.1007/s11739-018-1995-7
15. Fu L, Li Q, Fan Q. Combination of preoperative red cell distribution width and neutrophil to lymphocyte ratio as a prognostic marker for gastric cancer patients. J Gastrointest Oncol. (2021) 12(3):1049–57. doi: 10.21037/jgo-21-271
16. Xu WY, Yang XB, Wang WQ, Bai Y, Long JY, Lin JZ, et al. Prognostic impact of the red cell distribution width in esophageal cancer patients: a systematic review and meta-analysis. World J Gastroenterol. (2018) 24(19):2120–9. doi: 10.3748/wjg.v24.i19.2120
17. Jing JS, Fu XL, Zhao W, Kong LB. Red cell distribution width as a prognostic factor in patients with hepatocellular carcinoma. Clin Lab. (2020) 66(7). doi: 10.7754/Clin.Lab.2019.191027
18. Song Y, Huang Z, Kang Y, Lin Z, Lu P, Lin Q, et al. Clinical usefulness and prognostic value of red cell distribution width in colorectal cancer. Biomed Res Int. (2018) 2018:9858943. doi: 10.1155/2018/9858943
19. Wang C, Civan J, Lai Y, Cristofanilli M, Hyslop T, Palazzo JP, et al. Racial disparity in breast cancer survival: the impact of pre-treatment hematologic variables. Cancer Causes Control. (2015) 26(1):45–56. doi: 10.1007/s10552-014-0481-4
20. Takeuchi H, Abe M, Takumi Y, Hashimoto T, Miyawaki M, Okamoto T, et al. Elevated red cell distribution width to platelet count ratio predicts poor prognosis in patients with breast cancer. Sci Rep. (2019) 9(1):3033. doi: 10.1038/s41598-019-40024-8
21. Yoo YC, Park S, Kim HJ, Jung HE, Kim JY, Kim MH. Preoperative routine laboratory markers for predicting postoperative recurrence and death in patients with breast cancer. J Clin Med. (2021) 10(12):2610. doi: 10.3390/jcm10122610
22. Li F, Zhong Y, Mo W, Zhang B. Predictive value of red blood cell distribution width on overall survival in breast cancer patients. Guangdong Medical Journal. (2018) 39(13):2034–9. doi: 10.13820/j.cnki.gdyx.2018.13.013
23. Yao D, Wang Z, Cai H, Li Y, Li B. Relationship between red cell distribution width and prognosis in patients with breast cancer after operation: a retrospective cohort study. Biosci Rep. (2019) 39(7):BSR20190740. doi: 10.1042/BSR20190740
24. Huang DP, Ma RM, Xiang YQ. Utility of red cell distribution width as a prognostic factor in young breast cancer patients. Medicine (Baltimore). (2016) 95(17):e3430. doi: 10.1097/MD.0000000000003430
25. Yao M, Liu Y, Jin H, Liu X, Lv K, Wei H, et al. Prognostic value of preoperative inflammatory markers in Chinese patients with breast cancer. Onco Targets Ther. (2014) 7:1743–52. doi: 10.2147/OTT.S69657
26. Moher D, Liberati A, Tetzlaff J, Altman DG. PRISMA Group. Preferred reporting items for systematic reviews and meta-analyses: the PRISMA statement. PLoS Med. (2009) 6(7):e1000097. doi: 10.1371/journal.pmed.1000097
27. Stang A. Critical evaluation of the Newcastle-Ottawa scale for the assessment of the quality of nonrandomized studies in meta-analyses. Eur J Epidemiol. (2010) 25(9):603–5. doi: 10.1007/s10654-010-9491-z
28. Ioannidis JP. Interpretation of tests of heterogeneity and bias in meta-analysis. J Eval Clin Pract. (2008) 14(5):951–7. doi: 10.1111/j.1365-2753.2008.00986.x
29. Higgins JP, Thompson SG, Deeks JJ, Altman DG. Measuring inconsistency in meta-analyses. Br Med J. (2003) 327(7414):557–60. doi: 10.1136/bmj.327.7414.557
30. Chen B, Tang H, Liu X, Liu P, Yang L, Xie X, et al. miR-22 as a prognostic factor targets glucose transporter protein type 1 in breast cancer. Cancer Lett. (2015) 356(2 Pt B):410–7. doi: 10.1016/j.canlet.2014.09.028
31. Zwart W, Flach KD, Rudraraju B, Abdel-Fatah TM, Gojis O, Canisius S, et al. SRC3 Phosphorylation at serine 543 is a positive independent prognostic factor in ER-positive breast cancer. Clin Cancer Res. (2016) 22(2):479–91. doi: 10.1158/1078-0432.CCR-14-3277
32. Luo P, Lu G, Fan LL, Zhong X, Yang H, Xie R, et al. Dysregulation of TMPRSS3 and TNFRSF11B correlates with tumorigenesis and poor prognosis in patients with breast cancer. Oncol Rep. (2017) 37(4):2057–62. doi: 10.3892/or.2017.5449
33. Zhou L, Ma S, Balde AI, Han S, Cai Z, Li Z. A retrospective propensity score matched study of the preoperative C-reactive protein to albumin ratio and prognosis in patients with resectable non-metastatic breast cancer. Med Sci Monit. (2019) 25:4342–52. doi: 10.12659/MSM.913684
34. Zeindler J, Angehrn F, Droeser R, Däster S, Piscuoglio S, Ng CKY, et al. Infiltration by myeloperoxidase-positive neutrophils is an independent prognostic factor in breast cancer. Breast Cancer Res Treat. (2019) 177(3):581–9. doi: 10.1007/s10549-019-05336-3
35. Al Jarroudi O, El Bairi K, Abda N, Zaimi A, Jaouani L, Chibani H, et al. Neutrophil-to-lymphocyte and platelet-to-lymphocyte ratios as predictors of outcomes in inflammatory breast cancer. Biomark Med. (2021) 15(14):1289–98. doi: 10.2217/bmm-2020-0717
36. Ma YS, Wu SB, Lee WY, Cheng JS, Wei YH. Response to the increase of oxidative stress and mutation of mitochondrial DNA in aging. Biochim Biophys Acta. (2009) 1790(10):1021–9. doi: 10.1016/j.bbagen.2009.04.012
37. Klaunig JE. Oxidative stress and cancer. Curr Pharm Des. (2018) 24(40):4771–8. doi: 10.2174/1381612825666190215121712
38. Maurya PK, Kumar P, Chandra P. Biomarkers of oxidative stress in erythrocytes as a function of human age. World J Methodol. (2015) 5(4):216–22. doi: 10.5662/wjm.v5.i4.216
39. Sousa R, Gonçalves C, Guerra IC, Costa E, Fernandes A, do Bom Sucesso M, et al. Increased red cell distribution width in fanconi anemia: a novel marker of stress erythropoiesis. Orphanet J Rare Dis. (2016) 11(1):102. doi: 10.1186/s13023-016-0485-0
40. Förhécz Z, Gombos T, Borgulya G, Pozsonyi Z, Prohászka Z, Jánoskuti L. Red cell distribution width in heart failure: prediction of clinical events and relationship with markers of ineffective erythropoiesis, inflammation, renal function, and nutritional state. Am Heart J. (2009) 158(4):659–66. doi: 10.1016/j.ahj.2009.07.024
41. Olafsson HB, Sigurdarson GA, Christopher KB, Karason S, Sigurdsson GH, Sigurdsson MI. A retrospective cohort study on the association between elevated preoperative red cell distribution width and all-cause mortality after noncardiac surgery. Br J Anaesth. (2020) 124(6):718–25. doi: 10.1016/j.bja.2020.02.009
Keywords: breast cancer, red blood cell distribution width, overall survival, disease-free survival, meta-analysis
Citation: Yin J-M, Zhu K-P, Guo Z-W, Yi W, He Y and Du G-C (2023) Is red cell distribution width a prognostic factor in patients with breast cancer? A meta-analysis. Front. Surg. 10:1000522. doi: 10.3389/fsurg.2023.1000522
Received: 22 July 2022; Accepted: 14 February 2023;
Published: 24 March 2023.
Edited by:
Cesare Ruffolo, University Hospital of Padua, ItalyReviewed by:
Linhui Hu, The Second Hospital of Anhui Medical University, ChinaSimona Ascanelli, University Hospital of Ferrara, Italy
© 2023 Yin, Zhu, Guo, Yi, He and Du. This is an open-access article distributed under the terms of the Creative Commons Attribution License (CC BY). The use, distribution or reproduction in other forums is permitted, provided the original author(s) and the copyright owner(s) are credited and that the original publication in this journal is cited, in accordance with accepted academic practice. No use, distribution or reproduction is permitted which does not comply with these terms.
*Correspondence: Guo-Cheng Du Z3VvY2hlbmdkdTAwMTFAMTYzLmNvbQ==
†These authors share first authorship
Specialty Section: This article was submitted to Surgical Oncology, a section of the journal Frontiers in Surgery