 Sheng-zhong Li1,†
 Shao-hua Liu
 Li Liu
 Zhe-long Liu
- 1Department of Surgery, Wuhan Jinyintan Hospital, Tongji Medical College, Huazhong University of Science and Technology, Wuhan, China
- 2Department of Endocrinology, Tongji Hospital, Tongji Medical College, Huazhong University of Science and Technology, Wuhan, China
- 3Branch of National Clinical Research Center for Metabolic Diseases, Wuhan, China
- 4Department of Gastroenterology, Zigui County People’s Hospital, Yichang, China
- 5Department of Gastroenterology, Tongji Hospital, Tongji Medical College, Huazhong University of Science and Technology, Wuhan, China
Background: Thrombocytopenia and poor prognosis in severe conditions are associated. However, the clinical significance of thrombocytopenia in pyogenic liver abscess (PLA) has not been evaluated.
Objective: To evaluate the association between thrombocytopenia and the prognosis of patients with PLA.
Methods: A consecutive case series of 458 adult patients with PLA hospitalized at Tongji Hospital (Wuhan, China) between October 2011 and June 2021 was included in this cross-sectional analysis. Patient data were compared between the thrombocytopenia and non-thrombocytopenia groups. Multivariate logistic regression, receiver operating characteristic (ROC) curve and propensity score -matched analyses (PSM) were performed.
Results: Of the 458 patients with PLA, 94 (20.5%) developed thrombocytopenia, 19 (4.1%) developed septic shock, 14 (3.1%) were admitted to the ICU, and 15 (3.3%) died during hospitalization. Thrombocytopenia was independently associated with shock (95%CI = 3.529–57.944, P < 0.001), ICU admission (95%CI = 1.286–25.733, P = 0.022), and mortality (95%CI = 1.947–34.223, P = 0.004) in multivariate regression analysis. ROC analysis showed that thrombocytopenia may be an identified marker of shock [area under the ROC curve (AUC), 0.8119; cut-off, 92.50; P < 0.0001], ICU admission (AUC, 0.7484; cut-off, 82.50; P < 0.0015), and mortality (AUC, 0.7827; cut-off, 122.50; P < 0.002). These findings remained consistent across 86 pairs of patients analyzed for PSM analyses.
Conclusions: Thrombocytopenia is an independent risk factor for poor prognosis in PLA and patients may be more prone to adverse outcomes.
1. Introduction
Pyogenic liver abscess (PLA) is an infectious disease caused by a microbial infection that leads to liver necrosis, septic shock, and other serious consequences (1). The disease has an acute onset and complex condition, and missing the best treatment time may lead to various complications that seriously harm the health and quality of life of PLA patients (2). The incidence of PLA is higher in Asian countries, which can reach 12–18 cases per 100,000 people per year, with a mortality rate of approximately 2%–31% (3, 4).Therefore, prognostic markers should be identified to provide more aggressive and timely resuscitation for patients and plan effective treatment for patients with PLA to improve prognosis.
Thrombocytopenia is the most common hemostatic disorder in critically ill patients, with a prevalence of approximately 40%–53% (5). Previous studies have reported that platelet counts (PLT) regulate inflammation by controlling tissue integrity, and protecting against infection (6). Hence, PLT is considered to be valuable in predicting some disease outcomes, such as sepsis (7), COVID-19 (8, 9), and cancer (10). Zhou (11) demonstrated that patients with severe thrombocytopenia had more blood transfusions, more days requiring advanced support, and worse outcomes than those in the normal group. Orak et al. (12). retrospectively studied 330 patients diagnosed with sepsis in the emergency department and found that the PLTs were lower in patients who died than in the survivors. What's more, platelets have been used as prognostic markers for other hepatobiliary duct diseases, such as cholecystitis/cholangitis, which are closely associated with PLA (13–15). PLA is an inflammatory disease, and we hypothesized that thrombocytopenia may be also associated with its prognosis, which is worthy of our in-depth and detailed exploration and research.
To date, many studies have demonstrated a number of risk factors related to the prognosis of liver abscesses, such as malnutrition, pleural effusion, fever, multiple organ dysfunction syndrome (MODS), presence of gas formation, the size of abscess, and microbiology (16–20). However, few studies have explored the direct association between thrombocytopenia and PLA prognosis. If PLTs, as a common laboratory indicator that is easy to detect, could help to recognize patients with PLA at high-risk for adverse outcomes, it would have even greater clinical benefits. This study was conducted to explore the relationship between thrombocytopenia and PLA prognosis to provide a new and convenient prognostic marker of PLA.
2. Methods
2.1. Study design and participant
This was a retrospective collection of a consecutive case series of 458 patients with PLA admitted to Tongji Hospital, Tongji Medical College, Huazhong University of Science and Technology, between October 2011 and June 2021.
Patients with PLA were identified by retrospectively searching the medical record code (search term “pyogenic liver abscess”, ICD 10 code = K750) in the medical record department. The inclusion criteria for analysis were as follows: (1) diagnosis of PLA according to the following diagnostic criteria: a. imaging examination found liver abscess lesion (either magnetic resonance imaging (MRI), computed tomography (CT), or ultrasound (US); b. the patient had fever, chills, liver percussion pain, and other clinical manifestations and signs; c. positive bacterial culture; d. the lesions subsided after antibiotic treatment; e. liver biopsy or surgical pathology confirmed; a was essential for diagnosis, and b-e were non-essential diagnostic criteria; (2) age ≥18 years; (3) complete key laboratory results and imaging data. The following were the exclusion criteria: (1) incomplete clinical data; (2) amebic liver abscess or parasitic liver abscess; and (3) underlying conditions at risk for thrombocytopenia (hematologic malignancies, chemotherapy, cirrhosis, and chronic heart failure). The management of PLA was in accordance to the Expert consensus on multidisciplinary management of intra-abdominal infections (21) and Quality Improvement Guidelines for Percutaneous Drainage/Aspiration of Abscess and Fluid Collections (22). Typically, the duration of parenteral antibiotic treatment of liver abscesses is between 4 and 6 weeks. Interval imaging was typically performed after a specific period of antibiotic treatment. The interval between imaging studies also varied depending on the patient's clinical progress, response to therapy, and the physician's judgment.
The study was approved by the ethics committee of Tongji Hospital of Huazhong University of Science and Technology and conducted in accordance with the Declaration of Helsinki (TJ-IRB20221240). This study was exempt from informed consent because of its retrospective design.
2.2. Data collection
Data collected from the electronic medical record system in hospital included patients' demographic characteristics (age and sex), comorbidities (diabetes mellitus, hypertension, chronic respiratory disease, cardiovascular disease, gastrointestinal and hepatobiliary diseases, and malignancy), clinical symptoms and signs (fever, nausea and vomiting, abdominal distension or pain, diarrhea, fatigue), vital signs on admission (temperature, heart rate, respiration rate, and blood pressure), lab tests upon admission [blood routine test, liver function, renal function, serum levels of inflammatory markers, coagulation function, serum lipid parameters, random blood glucose, troponin I, n-terminal pro-brain natriuretic peptide(NT-proBNP), and other related indexes], bacterial cultures, treatments, imaging findings, serious complications, and adverse outcomes including septic shock, acute renal failure, acute hepatic failure, heart failure, myocardial infarction, pulmonary edema, pulmonary infection, acute respiratory distress syndrome (ARDS), pleural effusion, ICU occupancy, and death.
2.3. Definitions
Thrombocytopenia was defined as a PLT less than 125 × 109/L (laboratory reference range 125–350 × 109/L). Patients with liver abscess were categorized into the thrombocytopenia and non-thrombocytopenia groups based on PLTs less than or above 125 × 109/L, respectively. Septic shock was defined as acute circulatory failure with uncorrectable hypotension unexplained by other causes, despite sufficient fluid resuscitation (23). Acute renal failure was diagnosed when serum creatinine above 176 µmol/L, or an absolute increase was greater than 44 µmol/L (24). Acute hepatic injury was defined by WHO diagnostic criteria as alanine aminotransferase (ALT), aspartate aminotransferase (AST), total bilirubin (TBIL) where any one of these markers was more than 1.25 times the reference value upper limit. Heart failure was defined in accordance with the guidelines of the Heart Failure Association of the European Society of Cardiology (25). Myocardial infarction was defined as a serum level of hypersensitive cardiac troponin I (hs-cTnI) >34 pg/ml (26). Pulmonary edema is mainly diagnosed on the basis of pulmonary imaging findings. ARDS was defined according to The Berlin Definition of Acute Respiratory Distress Syndrome (2012) (27).
2.4. Statistical analysis
The mean ± standard deviation was used to express the continuous variable of normal distribution, and the median (quartile distance) was used to express the continuous variable of skewness distribution. Categorical variables were expressed as frequencies and percentages (%). For comparison between the two groups (thrombocytopenia group vs. non-thrombocytopenia group), continuous variables were analyzed by Student's t-test or Mann-Whitney U test, and categorical variables were analyzed by Fisher's exact or chi-squared test. Univariate logistic regression analysis was performed to ascertain the possible risk factors that showed a relationship with shock, ICU admission, and mortality. Variables without collinearity were selected for the multivariable analysis to assess the association between thrombocytopenia and PLA, taking into consideration previous research findings (28), clinical implications, and significant variables identified in the univariate logistic regression analysis. Finally, age, gender, hemoglobin (Hb), TBIL, creatinine, white blood cell, ARDS, presence of gas and pleural effusion were included in the multivariate analysis. The distribution of isolated microorganisms of the total or two groups (thrombocytopenia group vs. non-thrombocytopenia group) is presented in Figure 1. Receiver operating characteristic curve (ROC) was plotted to evaluate the discriminatory performance for adverse outcomes (shock, ICU admission, and mortality) of PLA according to the value of the area under the ROC curve (AUC). To adjust for additional confounding factors, a propensity score matching analysis was performed. Standardized mean differences and t-tests were used to ensure baseline demographics were comparable between the two groups. After matching, the standardized mean differencece of all matching factors in the t-test was not statistically significant. The matched variables included: age, sex, fever, nausea and vomiting, abdominal distension or pain, diarrhea, fatigue and muscle pain, palpitation, cough and sputum, dizziness or headache, SBP, DBP, heartrates, diabetes mellitus, hypertension, cardiovascular disease, malignancy, liver and gallbladder stones, viral hepatitis, fatty liver disease, presence of gas, hemoglobin, total bilirubin, direct bilirubin, ALT, AST, albumin, creatinine. SPSS version 20.0 software (SPSS Inc, Chicago, IL, USA) and GraphPad Prism (ver.9, GraphPad Software, La Jolla, USA) were used for all statistical analyses and figure construction. Statistical significance was defined as a two-sided P-value <0.05.
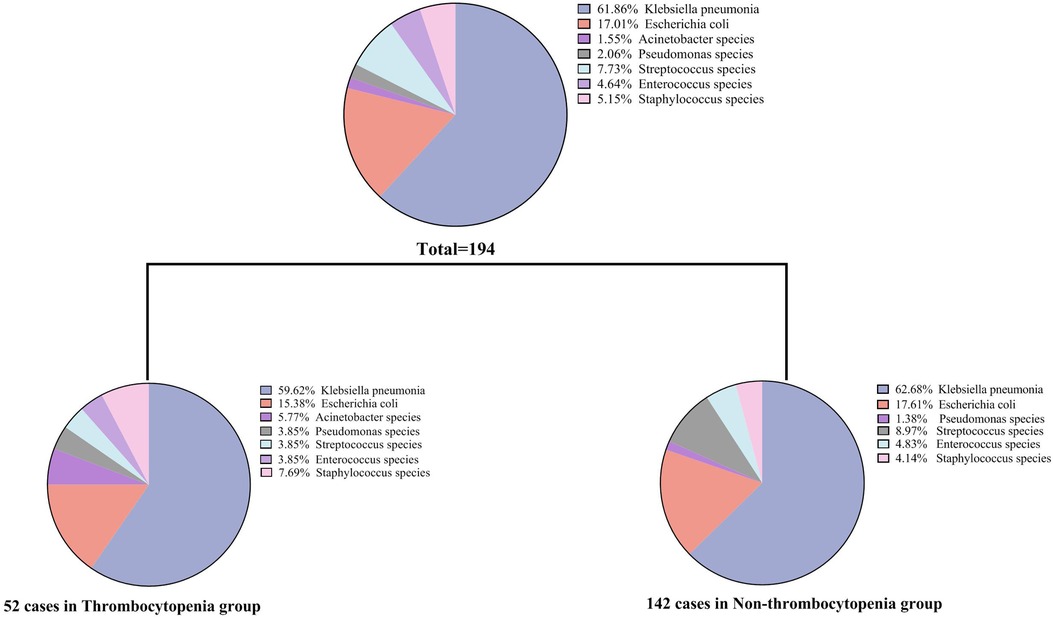
Figure 1. Profiles of isolated microorganisms in patients with pyogenic liver abscess.
3. Results
3.1. Demographics and baseline characteristics of patients with PLA
Table 1 shows the demographic data of patients at admission. A total of 458 patients with liver abscess were enrolled in this study, with an average age of 53.0 ± 0.6 years, of whom 131 (28.6%) patients were female. The most common clinical symptom was abdominal distension or abdominal pain (n = 230, 50.2%), followed by fatigue and muscle pain (n = 178, 38.9%) and fever (n = 129, 28.2%). Less common symptoms included dyspnea (n = 8, 1.7%) and disturbance of consciousness (n = 7, 1.5%). Diabetes mellitus (n = 101, 22.1%) was the most common comorbidity, followed by liver or gallbladder stones (n = 100, 21.8%) and hypertension (n = 78, 17.0%).

Table 1. Demographics and baseline characteristics between thrombocytopenia group and non-thrombocytopenia group with pyogenic liver abscess.
Patients were categorized, based on PLT, into either the thrombocytopenia group (n = 94) or non-thrombocytopenia group (n = 364). Compared with the non-thrombocytopenia group, the thrombocytopenia group was more likely to report nausea, vomiting, fatigue, muscle pain, palpitations, and dyspnea and had lower blood pressure and higher heart rates for vital signs at admission (P < 0.05). However, no significant differences in size of abscess, presence of gas, or multiloculation were observed between the two groups.
3.2. Baseline laboratory parameters of patients with PLA
The thrombocytopenia group showed significantly decreased levels of lymphocyte, albumin, total cholesterol, high density lipoprotein-cholesterol (HDL-C), low density lipoprotein-cholesterol (LDL-C), and fibrinogen, as well as increased levels of inflammatory markers like C-reactive protein, hepatic function indicators (TBIL, direct bilirubin, ALT, and AST), kidney function indicators (urea nitrogen and creatinine), coagulation function indicators (PT and D-D dimer), cardiac parameters (NT-proBNP and cTnI), and others, such as random blood glucose, compared with the non-thrombocytopenia group (Table 2, P < 0.05).
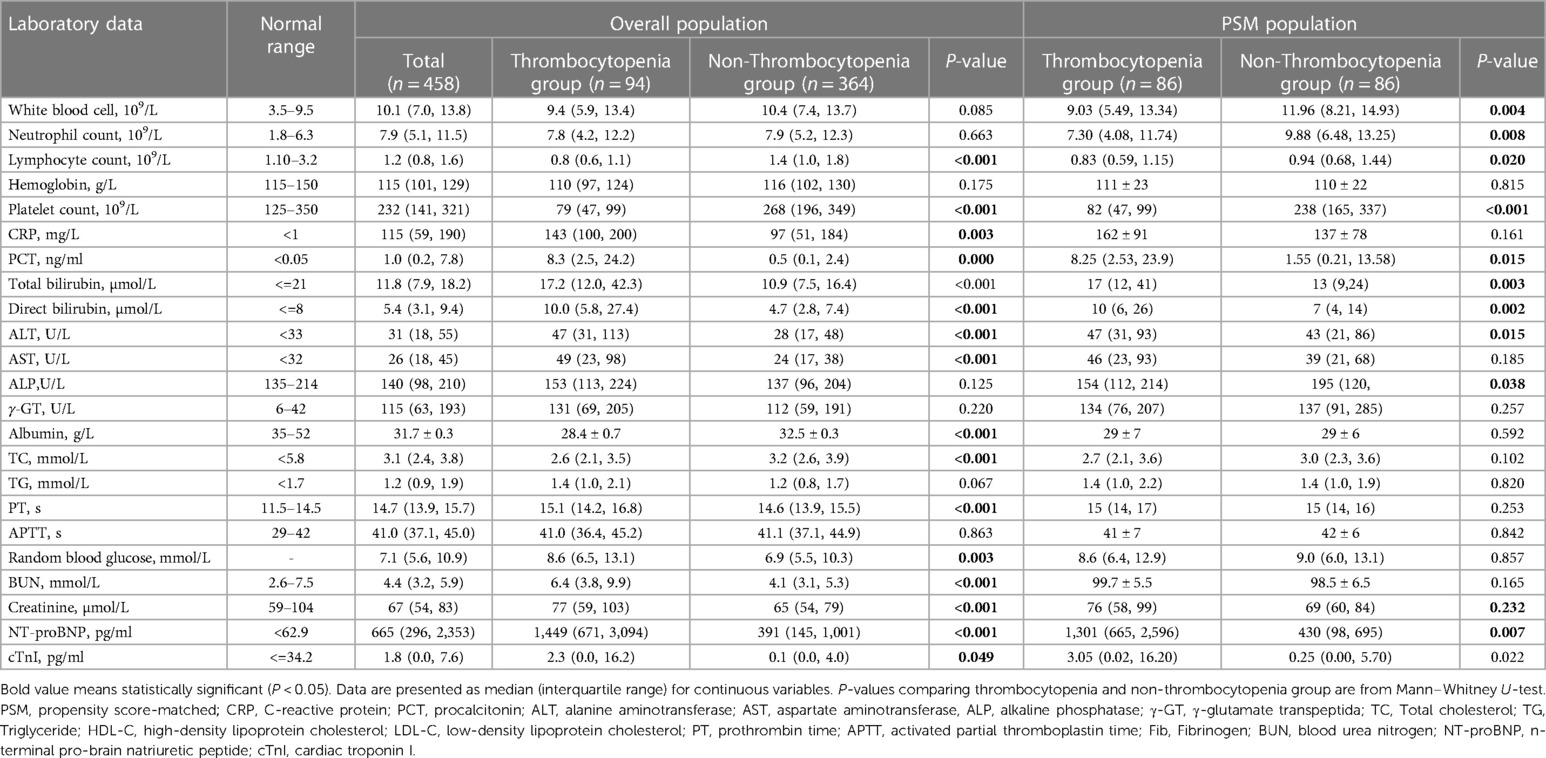
Table 2. Laboratory indices between thrombocytopenia and non-thrombocytopenia group with pyogenic liver abscess.
3.3. Profiles of isolated microorganisms of patients with PLA
Of the 458 patients with PLA, 194 (42.4%) showed positive bacterial culture results. Twenty-six (12.37%) of the cases were multiple bacterial infections. Among them, 22 cases were cultured with two kinds of bacteria, and 4 cases were cultured with three or more kinds of bacteria. Additionally, there were 4 cases of bacterial infection with fungal infection. As shown in Figure 1, Klebsiella pneumoniae was the most common pathogenic microorganism in both the thrombocytopenia and non-thrombocytopenia groups, accounting for 61.86% of all patients, followed by Escherichia coli (17.01%). Streptococcus (7.73%), Staphylococcus (5.15%), and Enterococcus (4.64%) accounted for a certain proportion. There was no difference in the bacterial culture composition ratio between the thrombocytopenia and non-thrombocytopenia groups (P = 0.318).
3.4. Treatment and clinical outcomes of patients with PLA
As shown in Table 3, 128 patients (27.9%) received conservative treatment with antibiotics alone, 278 patients (60.7%) received antibiotics with abscess puncture and drainage, and 33 patients (7.2%) received antibiotics with surgery. In these areas, there were no statistical differences between the thrombocytopenia and non-thrombocytopenia groups regarding the treatment received. Albumin infusion (P = 0.002), glucocorticoid use (P < 0.001), and antiviral drug use (P = 0.010) were significantly higher in the patients with thrombocytopenia than in those without thrombocytopenia.

Table 3. Treatment and clinical outcomes between thrombocytopenia and non-thrombocytopenia group with pyogenic liver abscess.
Compared with the non-thrombocytopenia group, patients with thrombocytopenia were more likely to develop serious complications, such as septic shock (P < 0.001), acute renal injury (P < 0.001), acute hepatic injury (P < 0.001), heart failure (P < 0.001), myocardial infarction (P = 0.001), pulmonary edema (P = 0.001), ARDS (P < 0.001), and pleural effusion (P < 0.001). In addition, ICU occupancy (P < 0.001) and mortality rates (P < 0.001) were significantly higher in the thrombocytopenia group than in the non-thrombocytopenia group.
Furthermore, we compared baseline data of liver abscess patients grouped by death, ICU admission, and shock, and the results are presented in the Supplementary (Tables S1–S3).
3.5. Independent association between thrombocytopenia and poor prognosis in patients with PLA
Based on univariate analysis (Table 4), decreased hemoglobin (P = 0.003), PLT (P = 0.001), and albumin (P < 0.001), as well as pleural effusion (P = 0.018) and ARDS (P < 0.001) were correlated with septic shock; female sex, decreased hemoglobin (P = 0.011), PLT (P = 0.003), albumin (P < 0.001), increased ALT (P = 0.020), and pleural effusion (P = 0.004) and ARDS (P < 0.001) were correlated with ICU admission; and decreased hemoglobin (P = 0.009), PLT (P = 0.003), albumin (P < 0.001),and increased TBIL, creatinine (P = 0.011) and ARDS (P < 0.001)were correlated with mortality in PLA patients. Moreover, the independent association between thrombocytopenia and poor prognosis was determined using a multivariate logistic regression analysis. After adjusting for age, sex, hemoglobin, albumin, ALT/TB, and pleural effusion, thrombocytopenia remained independently associated with shock, ICU admission, and mortality in patients with PLA. As seen in Table 5, in model 3, the ORs for thrombocytopenia (PLT < 125 × 109/L) were 14.300 (95% CI = 3.529–57.944; P < 0.001), 5.753 (95% CI = 1.286–25.733; P = 0.022), and 8.163 (95% CI = 1.947–34.223; P = 0.004) for shock, ICU admission, and mortality, respectively. Additionally, when the PLT was tested as a continuous variable, with each 10-unit increase in PLT, the adjusted ORs of shock, ICU admission, and mortality were 0.936 (95% CI = 0.890–0.984; P = 0.010), 0.932 (95% CI = 0.875–0.992; P = 0.027), and 0.915 (95% CI = 0.852–0.982; P = 0.014), respectively.
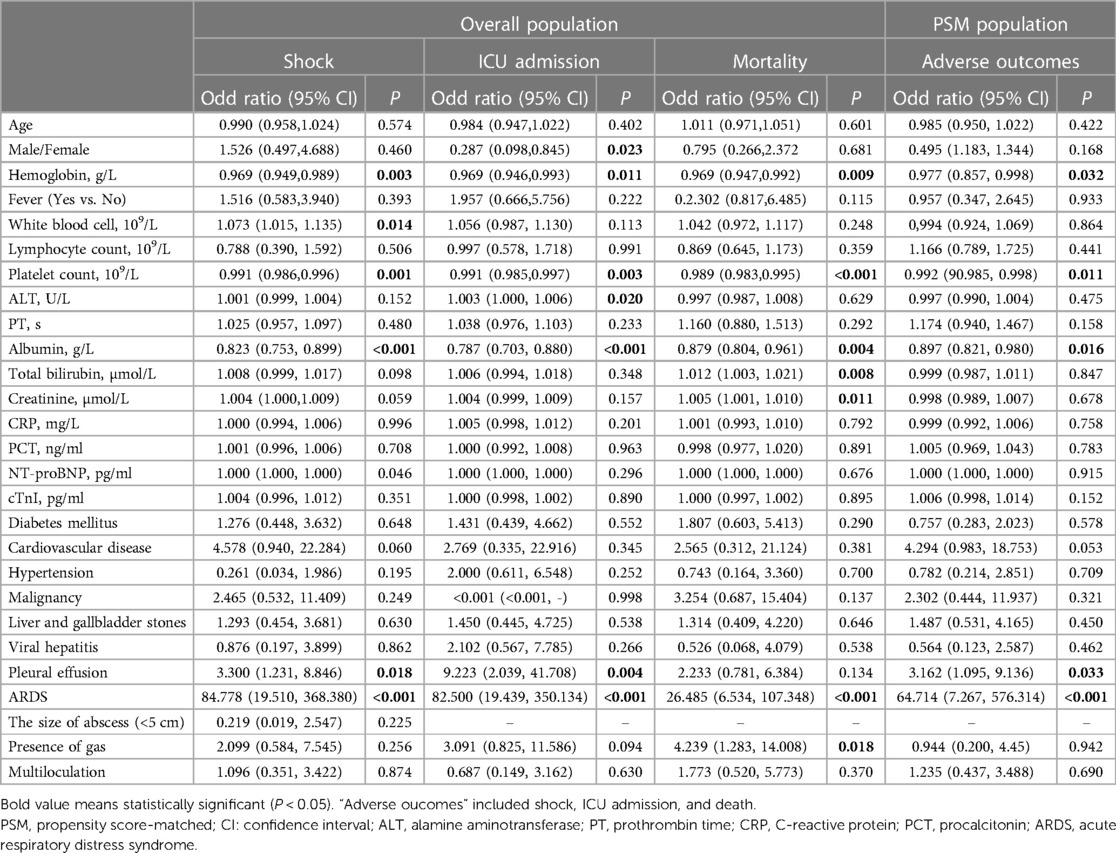
Table 4. Univariate logistic regression analysis for risk factors associated with shock, ICU admission and mortality in patients with pyogenic liver abscess.
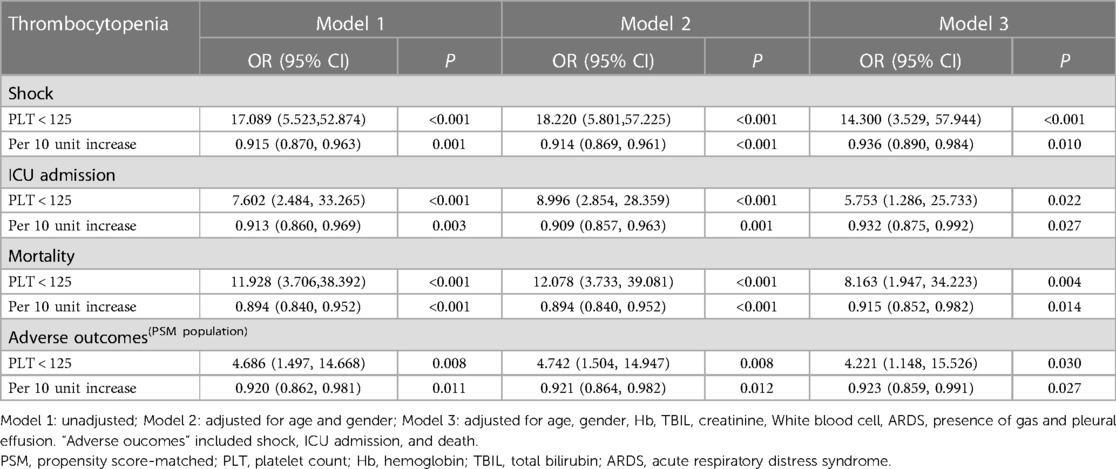
Table 5. Association of thrombocytopenia with shock, ICU admission and mortality in patients with pyogenic liver abscess.
3.6. Propensity score-matched analysis
The PSM analysis resulted in a total of 86 pairs of study participants. Due to the limited number of subjects, several analyses were constrained. Therefore, we combined three outcome events (shock, ICU admission, and death) as “adverse outcomes” for analysis. It is noteworthy that the baseline features were well balanced between the two groups, as indicated in Table 1. Consistent with findings in the overall population, the PSM analysis demonstrated an independent association between thrombocytopenia and adverse outcomes in patients with PLA.
3.7. Prognostic value of PLT
As shown in Figure 2, ROC analysis was performed to evaluate the relationship between PLT and PLA prognosis. For the discriminative ability of shock in patients with PLA, the AUC value of the PLT was 0.8119 (95% CI = 0.6773–0.9465, P < 0.0001) (Figure 2A). The optimal cut-off (the value of PLT when the Youden index reaches the maximum) was 92.5 × 10⁹/L) with a corresponding sensitivity and specificity of 89.07% and 73.68%, respectively. The AUC value of PLT as an identified marker of ICU admission was 0.7484 (95% CI = 0.5958–0.9010, P = 0.0015) (Figure 2B), and the cut-off value was 82.50 × 10⁹/L with a corresponding sensitivity and specificity of 90.54% and 64.29%, respectively. The AUC of PLT for the discriminative ability of mortality was 0.7827 (95% CI = 0.6539–0.9295, P = 0.002) (Figure 2C) and the cut-off value was 122.50 × 10⁹/L with a corresponding sensitivity and specificity of 81.53% and 73.33%, respectively. In addition, in the PSM analysis, the AUC value of PLT was 0.7209 (95%CI = 0.5887–0.8531, P = 0.0011) as an indicator of adverse outcomes in PLA patients (Figure 2D). The cut-off value was 82.5 × 10⁹/L, the sensitivity was 79.47%, and the specificity was 66.67%.
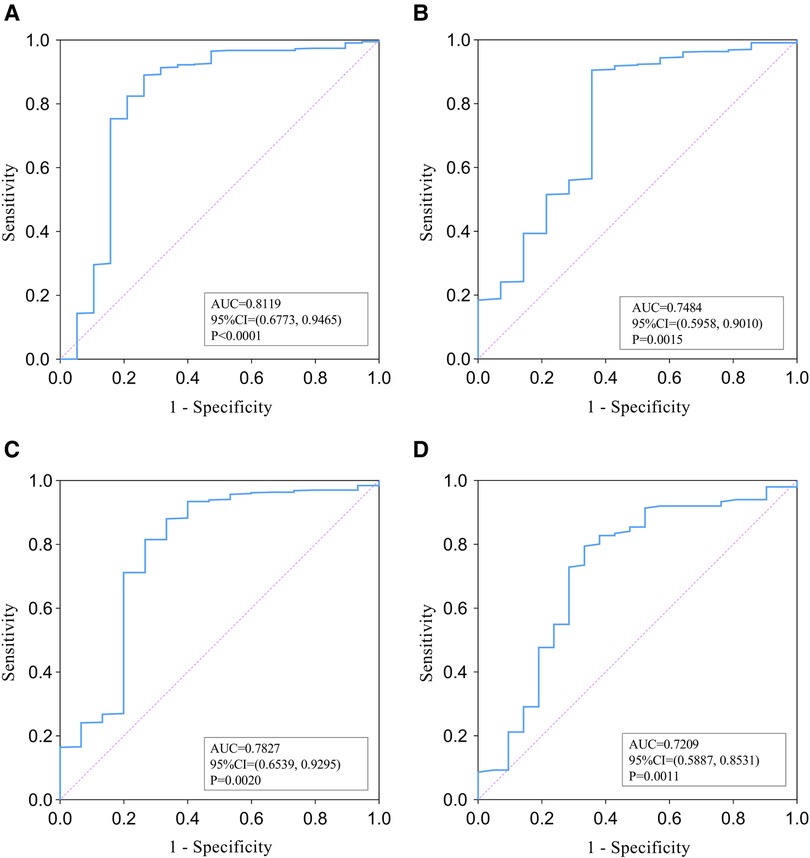
Figure 2. ROC analysis of PLT for the identification of shock (A), ICU admission (B), and mortality (C) among overall papulation with pyogenic liver abscess. (D) presents ROC analysis of PLT's ability to identify adverse outcomes in PSM populations.
4. Discussion
In the study involving 458 patients with PLA, thrombocytopenia was found in 20% of cases. Patients with thrombocytopenia were more likely to have deranged (including inflammatory markers and hepatic and renal function indicators were deranged), increased risk of complications, higher ICU admission rates, and elevated mortality. ROC analysis indicated that PLT, an inexpensive and easily obtained biomarker, may be a good candidate to meaningfully identify the poor prognosis of PLA.
Platelets are small anucleate circulating cells that are increasingly recognized as key effector cells that modulate host responses to inflammation and infections (29, 30). Platelets play a key role in innate immunity by interacting with other immune cells, through multiple receptors on their surface, such as Toll-like receptor 4 (31). Thrombocytopenia is a common complication of infection-related diseases. Platelets can interact with pathogens through a variety of platelet damage-related molecular pattern receptors, with the most common causative agent being viruses (28%), followed by bacteria (28%), and fungi (15%) (31). Current studies indicate that the causes of infection or sepsis-associated thrombocytopenia are complex, not fully elucidated, and may involve several factors, for example, a decrease in platelet production. The liver is the most vital site for the synthesis of thrombopoietin (TPO), a crucial platelet-stimulating factor that modulates platelet production (31). Liver injury due to PLA may result in an absolute or relative deficiency in TPO levels in these patients, leading to thrombocytopenia. In addition, various inflammatory cytokines can cause thrombocytopenia by destroying stem cells in the bone marrow (32, 33). This is followed by increased platelet destruction and consumption. Infections can stimulate platelet activation and aggregation through various pathways leading to thrombocytopenia (34, 35). Bacteria, such as Escherichia coli, Staphylococcus aureus, and Streptococcus pneumonia, can directly stimulate platelet activation and platelet-leukocyte aggregation by binding to and activating platelet receptors such as toll-like receptors or by participating plasma proteins related pathways (36). The release of diverse antimicrobial peptides can give rise to cell destruction and tissue damage. Endothelial cell injury and its release of inflammatory factors can also induce platelet activation and aggregation, increase platelet consumption or thrombosis (31, 37–39), and lead to thrombocytopenia. Studies have shown that the release or upregulation of sialidase during infection leads to the hydrolysis of sialic acid, a natural sugar acid that protects platelets from destruction (40–42), thereby causing thrombocytopenia. Additionally, treatment-related drug induction has been shown to cause thrombocytopenia. For example, vancomycin (43), linezolid, cephalosporin, and chloroquine phosphate (44, 45) can produce antiplatelet antibodies that induce increased platelet destruction. Finally, thrombocytopenia was found to be associated with a lower protein concentration and higher fluid balance, which may suggest a hemodilution effect caused by heavy fluid rehydration during treatment (46).
The pathophysiological mechanism of adverse outcomes in thrombocytopenia remains unclear. Possible reasons for this are as follows. Platelets fulfill vital functions in microbial host defense, angiogenesis and tissue remodeling, as well as wound healing (45–47). The higher incidence of adverse outcomes in the thrombocytopenia group can be directly explained by the decreased antimicrobial defenses of thrombocytopenia and changes in platelet function. The interaction between platelets, white blood cells, and the endothelium can result in endothelial dysfunction, leading to inflammation and thrombosis. This process is primarily mediated by platelets, which serve as the fundamental components driving this pathological cascade (7). The specific process is that platelets can be activated by microbial components or inflammatory mediators, leading to their interaction with neutrophils (48). This interaction exacerbates systemic inflammatory responses, triggers the release of inflammatory cytokines, stimulates endothelial cells, and dysregulates host defense responses by inhibiting or activating relevant signaling pathways (49). Additionally, platelets may play a chief part in the pathophysiology of disseminated intravascular coagulation (DIC) and MODS, together with the activation of endothelial cells and leukocytes (7). Although thrombocytopenia is often referred to as a condition of hypocoagulation, the reality is complex, and patients are at a potential risk for bleeding and thrombosis (50). Although different types of infection and definitions of thrombocytopenia influenced the outcome analysis, PLTs may be used to indicate infection severity.
As a suppurative infection of the liver parenchyma, PLA may be caused by a wide variety of bacteria, including biliary tract, portal vein, blood-borne or cryptogenic, and adjacent structure infections (51). Klebsiella pneumoniae was identified as the predominant bacterium in patients with PLA in our study, which aligns with findings from previous studies (52, 53). It has been reported that multibacteremia occurs in 14%–55% of PLA cases (54), a proportion slightly lower than what we observed in our study. Our study found no significant difference in bacterial culture results between the thrombocytopenia and non-thrombocytopenia groups, which was coincident with the findings of Johansson, et al. (36). However, some studies have demonstrated that thrombocytopenia is more common in gram-negative bacterial infections (55) and its duration is longer in gram-negative bacterial or fungal infections than in gram-positive bacteria (56). Unfortunately, this study lacked data on patients' platelet dynamics and did not draw similar conclusions. Owing to the differences in the distribution of microorganisms in previous studies, prevalence and duration of thrombocytopenia based on different bacterial infections remain unclear.
As mentioned above, bacterial components can directly activate platelets and release sialidase, thereby causing platelet destruction. During the deterioration of PLA, a large number of inflammatory cytokines are released, and endothelial damage occurs, triggering the activation of the coagulation cascade, which in turn result in platelet activation (7). And activated platelets lead to the production of thrombin by promoting the release of procoagulant factors, which further aggravates the development of the disease and leads to septic shock, liver and kidney function injury, and even multiple organ dysfunction in severe cases. Thrombocytopenia has been proved to be closely related to the increase of ICU occupancy rate, length of stay and mortality in critically-ill patients (57). A prospective study (58) also showed that changes in platelet mitochondrial function occurred early in patients with septic shock and were independently associated with the development of organ failure. Because thrombocytopenia induces organ damage, including renal failure, acute lung injury, and septic shock, it may indirectly lead to death (7, 57). Similarly, our findings showed that thrombocytopenia patients with PLA had nearly 7 times the risk of death, 12 times the risk of shock, and 11 times the risk of ICU transfer compared to patients without thrombocytopenia. These findings suggest that thrombocytopenia may be associated with severe infection and poor prognosis.
Additionally, previous research has indicated that the size of the abscess, gas production, and multiloculation are closely associated with the prognosis of PLA (19, 20). However, in our study, we did not observe significant differences in these variables between the two groups. Only a positive correlation between gas production and mortality was identified through univariate regression analysis. This discrepancy may be attributed to several factors, such as our relatively small sample size, missing data, confounding factors, or the heterogeneity of different ethnic groups.
In recent years, many advances have been made in the treatment of PLA. Percutaneous aspiration/drainage under US or CT guidance plus long-term antibiotic therapy has replaced traditional surgical drainage as the cornerstone of treatment (22). As in this study, most patients received antibiotics combined with puncture and drainage (60.7%). The prognosis of PLA is influenced by early diagnosis, as delayed detection can lead to complications such as liver and kidney failure, as well as respiratory failure, resulting in poor outcomes (2). However, thanks to the continuous advancements in treatment approaches, the mortality rate associated with PLA has significantly declined in recent years.
The study's limitations are as follows: (1) This is a retrospective study and lacks follow-up of patient parameters over time to directly establish absolute causality based on the results of this study. (2) Although we continuously recruited participants at our hospital and our participants were representative of local inpatients, they were not representative of the entire regional population of patients with PLA. (3) The etiological specimens were obtained from the blood or fester of patients, and different specimens for detection may have led to certain errors. (4) Data deficiencies include no details on the duration of antibiotic use, interval imaging, and a small sample size of patients reporting abscess size. (5) The data collected in this study were all indicators obtained on hospital admission without dynamic observation. In the future, a large-scale prospective study should be conducted to validate our conclusions.
5. Conclusion
Thrombocytopenia, an independent risk factor, was significantly associated with septic shock, ICU admission, and mortality in patients with PLA. PLT, a rapid and easy clinical laboratory index, can assist risk assessment and hierarchical management in patients with liver abscess and help identify those patients with a poor prognosis early, important for timely and appropriate intervention to improve poor outcomes. Larger sample sizes and prospective studies are required to confirm this conclusion.
Data availability statement
The original contributions presented in the study are included in the article/Supplementary Material, further inquiries can be directed to the corresponding authors.
Ethic statement
The Ethics Committee of Tongji Hospital of Huazhong University of Science and Technology had approved this study, which was exempt from informed consent because of its retrospective design (TJ-IRB20221240).
Author contributions
ZlL, LL and SzL designed the study. SzL, ShL and MH collected data. SzL, ShL and LL performed statistical analyses and generated figures and tables. ShL, LL and SzL wrote the manuscript. TY, ShL and SH read and approved the final manuscript. All authors have approved the final version of the manuscript.
Funding
This work was supported by the Sen-Mei China Diabetes Research Fund (Z-2017-26-1902), Teaching Research Project of Huazhong University of Science and Technology (2022141 to LL), and Teaching Research Fund of the Second Clinical College of Huazhong University of Science and Technology (2021058 to LL).
Acknowledgments
The authors thank the staff at the Department of Endocrinology and Medical record, Tongji Hospital, Tongji Medical College, Huazhong University of Science and Technology, and all the patients who participated in the study. We would like to thank Sen-Mei China Diabetes Research Fund (Z-2017-26-1902), Teaching Research Project of Huazhong University of Science and Technology (2022141 to LL), and Teaching Research Fund of the Second Clinical College of Huazhong University of Science and Technology (2021058 to LL) for the foundation support.
Conflict of interest
The authors declare that the research was conducted in the absence of any commercial or financial relationships that could be construed as a potential conflict of interest.
Publisher's note
All claims expressed in this article are solely those of the authors and do not necessarily represent those of their affiliated organizations, or those of the publisher, the editors and the reviewers. Any product that may be evaluated in this article, or claim that may be made by its manufacturer, is not guaranteed or endorsed by the publisher.
Supplementary material
The Supplementary Material for this article can be found online at: https://www.frontiersin.org/articles/10.3389/fsurg.2023.1192523/full#supplementary-material
References
1. Chen YC, Lin CH, Chang SN, Shi ZY. Epidemiology and clinical outcome of pyogenic liver abscess: an analysis from the national health insurance research database of Taiwan, 2000–2011. J Microbiol Immunol Infect. (2016) 49:646–53. doi: 10.1016/j.jmii.2014.08.028
2. Khim G, Em S, Mo S, Townell N. Liver abscess: diagnostic and management issues found in the low resource setting. Br Med Bull. (2019) 132:45–52. doi: 10.1093/bmb/ldz032
3. Lo JZ, Leow JJ, Ng PL, Lee HQ, Mohd Noor NA, Low JK, et al. Predictors of therapy failure in a series of 741 adult pyogenic liver abscesses. J Hepatobiliary Pancreat Sci. (2015) 22:156–65. doi: 10.1002/jhbp.174
4. Poovorawan K, Pan-Ngum W, Soonthornworasiri N, Kulrat C, Kittitrakul C, Wilairatana P, et al. Burden of liver abscess and survival risk score in Thailand: a population-based study. Am J Trop Med Hyg. (2016) 95:683–8. doi: 10.4269/ajtmh.16-0228
5. Hui P, Cook DJ, Lim W, Fraser GA, Arnold DM. The frequency and clinical significance of thrombocytopenia complicating critical illness: a systematic review. Chest. (2011) 139:271–8. doi: 10.1378/chest.10-2243
6. Li X, Li T, Wang J, Feng Y, Ren C, Xu Z, et al. Clinical value of C-reactive protein/platelet ratio in neonatal sepsis: a cross-sectional study. J Inflamm Res. (2021) 14:5123–9. doi: 10.2147/jir.S334642
7. Thiery-Antier N, Binquet C, Vinault S, Meziani F, Boisramé-Helms J, Quenot JP. Is thrombocytopenia an early prognostic marker in septic shock? Crit Care Med. (2016) 44:764–72. doi: 10.1097/ccm.0000000000001520
8. Liu Y, Sun W, Guo Y, Chen L, Zhang L, Zhao S, et al. Association between platelet parameters and mortality in coronavirus disease 2019: retrospective cohort study. Platelets. (2020) 31:490–6. doi: 10.1080/09537104.2020.1754383
9. Kermali M, Khalsa RK, Pillai K, Ismail Z, Harky A. The role of biomarkers in diagnosis of COVID-19 - A systematic review. Life Sci. (2020) 254:117788. doi: 10.1016/j.lfs.2020.117788
10. Sun L, Wei Y, Chen Y, Hu W, Ji X, Xu H, et al. Comparison of the prognostic value of platelet-related indices in biliary tract cancer undergoing surgical resection. Cancer Res Treat. (2021) 53:528–40. doi: 10.4143/crt.2020.833
11. Zhou Z, Feng T, Xie Y, Zhang X, Du J, Tian R, et al. Prognosis and rescue therapy for sepsis-related severe thrombocytopenia in critically ill patients. Cytokine. (2020) 136:155227. doi: 10.1016/j.cyto.2020.155227
12. Orak M, Karakoç Y, Ustundag M, Yildirim Y, Celen MK, Güloglu C. An investigation of the effects of the mean platelet volume, platelet distribution width, platelet/lymphocyte ratio, and platelet counts on mortality in patents with sepsis who applied to the emergency department. Niger J Clin Pract. (2018) 21:667–71. doi: 10.4103/njcp.njcp_44_17
13. Budak YU, Polat M, Huysal K. The use of platelet indices, plateletcrit, mean platelet volume and platelet distribution width in emergency non-traumatic abdominal surgery: a systematic review. Biochem Med (Zagreb). (2016) 26:178–93. doi: 10.11613/bm.2016.020
14. Gatselis NK, Goet JC, Zachou K, Lammers WJ, Janssen HLA, Hirschfield G, et al. Factors associated with progression and outcomes of early stage primary biliary cholangitis. Clin Gastroenterol Hepatol. (2020) 18:684–92.e6. doi: 10.1016/j.cgh.2019.08.013
15. Cheung KS, Seto WK, Fung J, Lai CL, Yuen MF. Prognostic factors for transplant-free survival and validation of prognostic models in Chinese patients with primary biliary cholangitis receiving ursodeoxycholic acid. Clin Transl Gastroenterol. (2017) 8:e100. doi: 10.1038/ctg.2017.23
16. Yin D, Ji C, Zhang S, Wang J, Lu Z, Song X, et al. Clinical characteristics and management of 1572 patients with pyogenic liver abscess: a 12-year retrospective study. Liver Int. (2021) 41:810–8. doi: 10.1111/liv.14760
17. Chan KS, Chia CTW, Shelat VG. Demographics, radiological findings, and clinical outcomes of Klebsiella pneumonia vs. non-Klebsiella pneumoniae pyogenic liver abscess: a systematic review and meta-analysis with trial sequential analysis. Pathogens. (2022) 11:976. doi: 10.3390/pathogens11090976
18. Xu J, Zhou X, Zheng C. The geriatric nutritional risk index independently predicts adverse outcomes in patients with pyogenic liver abscess. BMC Geriatr. (2019) 19:14. doi: 10.1186/s12877-019-1030-5
19. Chan KS, Thng CB, Chan YH, Shelat VG. Outcomes of gas-forming pyogenic liver abscess are comparable to non-gas-forming pyogenic liver abscess in the era of multi-modal care: a propensity score matched study. Surg Infect (Larchmt). (2020) 21:884–90. doi: 10.1089/sur.2019.278
20. Chan KS, Shelat V. The IASGO textbook of multi-disciplinary management of hepato-pancreato-biliary diseases. Singapore: Springer Nature Singapore (2022).
21. Expert consensus on multidisciplinary management of intra-abdominal infections]. Zhonghua Wai Ke Za Zhi. (2021) 59:161–78. doi: 10.3760/cma.j.cn112139-20201223-00874
22. Wallace MJ, Chin KW, Fletcher TB, Bakal CW, Cardella JF, Grassi CJ, et al. Quality improvement guidelines for percutaneous drainage/aspiration of abscess and fluid collections. J Vasc Interv Radiol. (2010) 21:431–5. doi: 10.1016/j.jvir.2009.12.398
23. Singer M, Deutschman CS, Seymour CW, Shankar-Hari M, Annane D, Bauer M, et al. The third international consensus definitions for sepsis and septic shock (sepsis-3). JAMA. (2016) 315:801–10. doi: 10.1001/jama.2016.0287
24. Englberger L, Suri RM, Li Z, Casey ET, Daly RC, Dearani JA, et al. Clinical accuracy of RIFLE and acute kidney injury network (AKIN) criteria for acute kidney injury in patients undergoing cardiac surgery. Crit Care. (2011) 15:R16. doi: 10.1186/cc9960
25. Mueller C, McDonald K, de Boer RA, Maisel A, Cleland JGF, Kozhuharov N, et al. Heart failure association of the European society of cardiology practical guidance on the use of natriuretic peptide concentrations. Eur J Heart Fail. (2019) 21:715–31. doi: 10.1002/ejhf.1494
26. Gao C, Wang Y, Gu X, Shen X, Zhou D, Zhou S, et al. Association between cardiac injury and mortality in hospitalized patients infected with avian influenza A (H7N9) virus. Crit Care Med. (2020) 48:451–8. doi: 10.1097/ccm.0000000000004207
27. Ranieri VM, Rubenfeld GD, Thompson BT, Ferguson ND, Caldwell E, Fan E, et al. Acute respiratory distress syndrome: the Berlin definition. JAMA. (2012) 307:2526–33. doi: 10.1001/jama.2012.5669
28. Park KS, Lee SH, Yun SJ, Ryu S, Kim K. Neutrophil-to-lymphocyte ratio as a feasible prognostic marker for pyogenic liver abscess in the emergency department. Eur J Trauma Emerg Surg. (2019) 45:343–51. doi: 10.1007/s00068-018-0925-8
29. Manne BK, Xiang SC, Rondina MT. Platelet secretion in inflammatory and infectious diseases. Platelets. (2017) 28:155–64. doi: 10.1080/09537104.2016.1240766
30. Cedervall J, Hamidi A, Olsson AK. Platelets, NETs and cancer. Thromb Res. (2018) 164(Suppl 1):S148–S52. doi: 10.1016/j.thromres.2018.01.049
31. Zhang Y, Zeng X, Jiao Y, Li Z, Liu Q, Ye J, et al. Mechanisms involved in the development of thrombocytopenia in patients with COVID-19. Thromb Res. (2020) 193:110–5. doi: 10.1016/j.thromres.2020.06.008
32. Karimi Shahri M, Niazkar HR, Rad F. COVID-19 and hematology findings based on the current evidences: a puzzle with many missing pieces. Int J Lab Hematol. (2021) 43:160–8. doi: 10.1111/ijlh.13412
33. Behrens K, Alexander WS. Cytokine control of megakaryopoiesis. Growth Factors. (2018) 36:89–103. doi: 10.1080/08977194.2018.1498487
34. Gawaz M, Fateh-Moghadam S, Pilz G, Gurland HJ, Werdan K. Platelet activation and interaction with leucocytes in patients with sepsis or multiple organ failure. Eur J Clin Invest. (1995) 25:843–51. doi: 10.1111/j.1365-2362.1995.tb01694.x
35. Hamzeh-Cognasse H, Damien P, Chabert A, Pozzetto B, Cognasse F, Garraud O. Platelets and infections—complex interactions with bacteria. Front Immunol. (2015) 6:82. doi: 10.3389/fimmu.2015.00082
36. Johansson D, Rasmussen M, Inghammar M. Thrombocytopenia in bacteraemia and association with bacterial species. Epidemiol Infect. (2018) 146:1312–7. doi: 10.1017/s0950268818001206
37. Joffre J, Hellman J, Ince C, Ait-Oufella H. Endothelial responses in sepsis. Am J Respir Crit Care Med. (2020) 202:361–70. doi: 10.1164/rccm.201910-1911TR
38. Houck KL, Yuan H, Tian Y, Solomon M, Cramer D, Liu K, et al. Physical proximity and functional cooperation of glycoprotein 130 and glycoprotein VI in platelet membrane lipid rafts. J Thromb Haemost. (2019) 17:1500–10. doi: 10.1111/jth.14525
39. Ackermann M, Verleden SE, Kuehnel M, Haverich A, Welte T, Laenger F, et al. Pulmonary vascular endothelialitis, thrombosis, and angiogenesis in COVID-19. N Engl J Med. (2020) 383:120–8. doi: 10.1056/NEJMoa2015432
40. Grewal PK, Uchiyama S, Ditto D, Varki N, Le DT, Nizet V, et al. The ashwell receptor mitigates the lethal coagulopathy of sepsis. Nat Med. (2008) 14:648–55. doi: 10.1038/nm1760
41. Grewal PK, Aziz PV, Uchiyama S, Rubio GR, Lardone RD, Le D, et al. Inducing host protection in pneumococcal sepsis by preactivation of the Ashwell-Morell receptor. Proc Natl Acad Sci U S A. (2013) 110:20218–23. doi: 10.1073/pnas.1313905110
42. Li MF, Li XL, Fan KL, Yu YY, Gong J, Geng SY, et al. Platelet desialylation is a novel mechanism and a therapeutic target in thrombocytopenia during sepsis: an open-label, multicenter, randomized controlled trial. J Hematol Oncol. (2017) 35:200–21. doi: 10.1186/s13045-017-0476-1
43. Thushara RM, Hemshekhar M, Kemparaju K, Rangappa KS, Devaraja S, Girish KS. Therapeutic drug-induced platelet apoptosis: an overlooked issue in pharmacotoxicology. Arch Toxicol. (2014) 88:185–98. doi: 10.1007/s00204-013-1185-3
44. Bakchoul T, Marini I. Drug-associated thrombocytopenia. Hematology Am Soc Hematol Educ Program. (2018) 2018:576–83. doi: 10.1182/asheducation-2018.1.576
45. Fan X, Chen L, Yang J, Feng P. Entecavir-associated thrombocytopenia in a decompensated cirrhotic patient: a case report and literature review. Medicine (Baltimore). (2016) 95:e3103. doi: 10.1097/md.0000000000003103
46. Bedet A, Razazi K, Boissier F, Surenaud M, Hue S, Giraudier S, et al. Mechanisms of thrombocytopenia during septic shock: a Multiplex cluster analysis of endogenous sepsis mediators. Shock. (2018) 49:641–8. doi: 10.1097/shk.0000000000001015
47. Golebiewska EM, Poole AW. Platelet secretion: from haemostasis to wound healing and beyond. Blood Rev. (2015) 29:153–62. doi: 10.1016/j.blre.2014.10.003
48. Zuchtriegel G, Uhl B, Puhr-Westerheide D, Pörnbacher M, Lauber K, Krombach F, et al. Platelets guide leukocytes to their sites of extravasation. PLoS Biol. (2016) 14:e1002459. doi: 10.1371/journal.pbio.1002459
49. Claushuis TA, van Vught LA, Scicluna BP, Wiewel MA, Klein Klouwenberg PM, Hoogendijk AJ, et al. Thrombocytopenia is associated with a dysregulated host response in critically ill sepsis patients. Blood. (2016) 127:3062–72. doi: 10.1182/blood-2015-11-680744
50. Sigal SH, Sherman Z, Jesudian A. Clinical implications of thrombocytopenia for the cirrhotic patient. Hepat Med. (2020) 12:49–60. doi: 10.2147/hmer.S244596
51. Song H, Wang X, Lian Y, Wan T. Analysis of the clinical characteristics of 202 patients with liver abscess associated with diabetes mellitus and biliary tract disease. J Int Med Res. (2020) 48:300060520949404. doi: 10.1177/0300060520949404
52. Qu TT, Zhou JC, Jiang Y, Shi KR, Li B, Shen P, et al. Clinical and microbiological characteristics of Klebsiella pneumoniae liver abscess in East China. BMC Infect Dis. (2015) 15:161. doi: 10.1186/s12879-015-0899-7
53. Luo M, Yang XX, Tan B, Zhou XP, Xia HM, Xue J, et al. Distribution of common pathogens in patients with pyogenic liver abscess in China: a meta-analysis. Eur J Clin Microbiol Infect Dis. (2016) 35:1557–65. doi: 10.1007/s10096-016-2712-y
54. Eltawansy SA, Merchant C, Atluri P, Dwivedi S. Multi-organ failure secondary to a Clostridium perfringens gaseous liver abscess following a self-limited episode of acute gastroenteritis. Am J Case Rep. (2015) 16:182–6. doi: 10.12659/ajcr.893046
55. Bhat MA, Bhat JI, Kawoosa MS, Ahmad SM, Ali SW. Organism-specific platelet response and factors affecting survival in thrombocytopenic very low birth weight babies with sepsis. J Perinatol. (2009) 29:702–8. doi: 10.1038/jp.2009.72
56. Aydemir H, Piskin N, Akduman D, Kokturk F, Aktas E. Platelet and mean platelet volume kinetics in adult patients with sepsis. Platelets. (2015) 26:331–5. doi: 10.3109/09537104.2012.701027
57. Thachil J, Warkentin TE. How do we approach thrombocytopenia in critically ill patients? Br J Haematol. (2017) 177:27–38. doi: 10.1111/bjh.14482
Keywords: pyogenic liver abscess, thrombocytopenia, platelet count, prognosis, cross-sectional analysis
Citation: Li S-z, Liu S-h, Hao M, Yu T, Hu S, Liu L and Liu Z-l (2023) Thrombocytopenia as an important determinant of poor prognosis in patients with pyogenic liver abscess: a retrospective case series. Front. Surg. 10:1192523. doi: 10.3389/fsurg.2023.1192523
Received: 23 March 2023; Accepted: 30 June 2023;
Published: 25 July 2023.
Edited by:
Gabriel Sandblom, Karolinska Institutet (KI), SwedenReviewed by:
Zeevaert Jean Baptiste, Clinique CHC MontLégia, BelgiumKai Siang Chan, MOH Holdings, Singapore
Na Huang, First Affiliated Hospital of Wenzhou Medical University, Wenzhou Medical University, China
© 2023 Li, Liu, Hao, Yu, Hu, Liu and Liu. This is an open-access article distributed under the terms of the Creative Commons Attribution License (CC BY). The use, distribution or reproduction in other forums is permitted, provided the original author(s) and the copyright owner(s) are credited and that the original publication in this journal is cited, in accordance with accepted academic practice. No use, distribution or reproduction is permitted which does not comply with these terms.
*Correspondence: Li Liu bGlsaXVAdGpoLnRqbXUuZWR1LmNu Zhe-long Liu bGl1emhlbG9uZ0AxNjMuY29t
†These authors have contributed equally to this work and share first authorship