 Ze Liu
 Qi Liu
 Min Wang
 Chenhan Zhou1,2
 Jieyu Liang
 Yi Zhang
- 1Department of Orthopaedics, Xiangya Hospital, Central South University, Changsha, China
- 2National Clinical Research Center for Geriatric Disorders, Xiangya Hospital, Central South University, Changsha, China
- 3Department of Orthopaedics, Seventh Clinical Medical College, Beijing Jishuitan Hospital, Capital Medical University, Beijing, China
- 4Department of Endocrinology, Xiangya Hospital, Central South University, Changsha, China
Aims: We aimed to explore the associations of the early PVR in four cortices with Healing Index (HI), Lengthening Index (LI), and External Fixator Index (EFI) in the bone union and non-union groups.
Methods: A total of 52 patients, including 39 bone union and 13 bone non-union subjects, were recruited in this study. The general characteristics and PVR in four cortices in each group were explored. Afterward, the early PVR in four cortices, including medial, lateral, anterior, and posterior sides, were compared. Finally, the associations of the early PVR in four cortices with HI, LI, and EFI were also investigated.
Results: The general characteristics of these patients were consistent, except for HI (31.54 ± 12.24 vs. 45.08 ± 27.10, P = 0.018) and EFI (57.63 ± 18.15 vs. 71.29 ± 24.60, P = 0.046). The growth of regenerated callus was asymmetrical in the bone union group (the posterior PVR seems to grow faster), whereas no statistical difference was obtained in the bone non-union group. Furthermore, the posterior PVR in the bone union group was significantly higher than that in the bone non-union group (the first month: 0.96 ± 0.17 vs. 0.86 ± 0.06, p = 0.047; the second month: 0.98 ± 0.14 vs. 0.89 ± 0.09, p = 0.041; the third month: 1.00 ± 0.12 vs. 0.92 ± 0.09, p = 0.039). Most importantly, the posterior PVR was inversely associated with HI, LI, and EFI (the first month: r = −0.343, p = 0.041; r = −0.346, p = 0.042; r = −0.352, p = 0.041; the second month: r = −0.459, p = 0.004; r = −0.277, p = 0.101; r = −0.511, p = 0.002; the third month: r = −0.479, p = 0.003; r = −0.398, p = 0.018; r = −0.551, p = 0.001) in the bone union group, respectively. However, this finding was lost in the bone non-union group.
Conclusion: The early posterior cortex PVR seems to grow faster than the medial, lateral, and anterior sides in the bone union group, which represents an asymmetrical development pattern. Moreover, the posterior cortex PVR was negatively associated with HI, LI, and EFI, respectively. The posterior cortex PVR may be a novel and reliable detection index in the process of DO.
1. Introduction
Distraction osteogenesis (DO) is a method that promotes bone tissue regeneration and growth by continuous and slow traction for bone lengthening (extending peripheral nerves, blood vessels, muscles, and skin) (1, 2). Osteotomy is performed on the bone that needs to be lengthened initially. After a short latency period, a distractor is utilized to distract the bone at an appropriate speed/frequency to spontaneously promote bone regeneration in the distraction gap. This period is referred to as the distraction period. Next, a long period of consolidation is needed to achieve new bone mineralization and remodeling (3). The llizarov technique used in DO dates back to 1951 and is widely utilized nowadays to treat bone defects, limb unequal lengths, and deformities (4, 5). However, DO requires regular monitoring of callus growth due to the long treatment time, possible skin scar, psychological and life burden, pain syndrome, joint stiffness, pin tract infection, and bone non-union (6). Among them, bone non-union is a serious clinical issue, which prolongs the treatment course and increases the difficulty in bone extension (7). Paley et al. have found that both technical factors (traumatic corticotomy, instability, and rapid traction) and patient factors (infection, malnutrition, and metabolism) may contribute to the DO-related non-union (8). However, the current effective prediction methods of bone non-union are quite limited. Several methods were used to monitor DO, such as quantitative computed tomography (QCT), dual-energy x-ray absorptiometry (DXA), standard radiography (x-ray), ultrasound, biomechanical evaluation, and biochemical marker. Among them, x-ray is the most convenient and affordable approach (9, 10). Additionally, the pixel value ratio (PVR) can be measured by digital x-rays, which have been shown to correlate well with bone mineral density (BMD) of regenerated bone. Therefore, PVR is a quantitative indicator of mineralization in DO healing (11, 12). As far as we know, the major previous studies are related to the later stage for the timing of removing the external fixator (13–15), and less attention is paid to the early PVR. Our recent studies found the associations of early PVR with healing index, (HI: the time to complete consolidation (days) divided by the length obtained (cm)), lengthening index (LI: the number of months required to achieve 1 cm lengthening), and external fixator index (EFI: dividing the using period of external fixator (days) by the distracted length of the bone (cm)) (16). However, E. Vulcano et al. showed the uneven PVR in four cortices of the callus during the late weight-bearing period of intramedullary extension (lateral: 0.84, medial: 0.89, anterior: 0.92, posterior: 0.98). It is not clear whether this condition exists in the early stage of DO and which cortex is related to HI, LI, and EFI (14). Furthermore, our other previous study found that the PVR growth pattern in bone union differed from that in bone non-union (17). Therefore, the intention of this study was to compare the early measurements of the PVR in two cohorts of patients: those who had uncomplicated bone lengthening and those who developed failure of the regenerate bone to form properly. This study aims to: (1) compare the early PVR in four cortices of the bone union and non-union groups; (2) clarify the different growth patterns of early PVR in four cortices in bone union and non-union groups; (3) identify the associations of early PVR in four cortices with HI, LI, and EFI, respectively.
2. Materials and methods
2.1. Study design and patients
This study was approved by the Ethics Committee of Xiangya Hospital of Central South University. We retrospectively analyzed the clinical data and images of patients who underwent bone lengthening surgery at Xiangya Hospital of Central South University from January 2010 to April 2023. The inclusion criteria were: (1) The lower extremities were lengthened using the Ilizarov method; (2) Patients with bone union and non-union during DO. The diagnostic standards of bone union and bone non-union: bone union indicated the ones where the external fixator was removed successfully, whereas bone non-union represented the ones where bridging callus did not appear even after 9 months (an absence of bridging callus for at least three out of four cortices on plain radiographs) that needs autogenous bone transplantation (18–20). (3) The patients who had primary surgery. The exclusion criteria were: (1) The patients who could not complete the full course of bone lengthening therapy; (2) The patients who suffered from bone diseases that affected bone healing (e.g., osteomyelitis); (3) The patients who were lost to follow-up.
2.2. Surgical methods
The surgery involved in this study was performed by senior surgeons in Xiangya Hospital of Central South University. A tibial or femoral osteotomy was performed and a ring or unilateral external fixation fixator was then placed. The bone lengthening was initiated 1 week after the operation (the extension rate is 0.75 mm/day for adults and 1 mm/day for adolescents), and the growth of callus was monitored monthly (detailed distraction osteogenesis parameters are shown in Table 1). The standard for removing external fixtures was listed as follows: (1) At least three of the four cortices of the extension are fully developed according to anteroposterior and lateral x-ray photographs; (2) The fixation time generally conforms to the average stretch index (1 month of consolidation time is required for every 1 cm of extended callus); (3) There is no abnormal feeling of complete load-bearing after loosening the nut (16, 21).

Table 1. The basic distraction osteogenesis parameters between bone union and non-union.
2.3. Pixel value ratio measurement based on x-ray
The Picture Archiving and Communication System (PACS) of Xiangya Hospital of Central South University was utilized to measure x-rays of recruited patients, including anterior callus, posterior callus, medial callus, lateral callus, proximal bone, and distal bone (Figure 1). All data were tested by the same technician/equipment and evaluated by two senior orthopedic surgeons independently. The individual data with different opinions were recalled and fully discussed. In the measurement process, the interference of the metal frame was carefully avoided to ensure the accuracy of the data analysis. The higher PVR indicated that the callus was closer to a normal bone, whereas the lower PVR represented the immature regenerated callus (22). The formula is as follows (12, 14):

Figure 1. The assesment nof lateral, medial, anterior and posterior callus pixel value ratio.
2.4. The general characteristics of patients and the PVR in four cortices analyses, and their associations with the healing index, lengthening index, and external fixator index
A total of 52 patients were recruited in this study (including 39 bone union and 13 bone non-union subjects). The general characteristics of the patients including sex, age, body mass index (BMI), osteotomy location, external fixator type, healing index (HI), lengthening index (LI), and external fixator index (EFI) were collected and analyzed. Based on the anteroposterior and lateral x-rays, the callus was divided into four sides: anterior, posterior, medial, and lateral. The PVR in four cortices of the callus was collected months after osteotomy, which were further analyzed and compared. Moreover, the anterior, posterior, medial, and lateral cortical PVRs of the bone union and non-union were also analyzed and compared. HI was calculated by dividing the time of tricortical formation (days) by the length of extension (centimeters) (23). LI referred to the time it took to extend one centimeter in months (24). EFI was the time spent wearing the external fixation frame (days) divided by the extension length (cm) (25). All three indices were valid indicators, which reflected the final clinical outcome of DO well. The associations of early PVR in four cortices with the HI, LI, and EFI were investigated in our study.
2.5. Statistical analysis
All analyses were performed using SPSS version 26.0 software. The differences in general characteristics between the bone union and non-union groups were analyzed by multivariate analysis of variance. The analysis of variance was used to analyze the differences in four cortices PVR within the bone union and non-union groups. The correlation between PVR in four cortices of callus and HI/LI/EFI in bone union and non-union groups was performed by Pearson correlation analysis. P < 0.05 was considered statistically significant.
3. Results
3.1. The general characteristics of the included subjects
The general characteristics of the patients are shown in Table 2. Most of the basic characteristics of the bone union and bone non-union groups were similar, except for two indices (HI: 31.54 ± 12.24 vs. 45.08 ± 27.10, P = 0.018; EFI: 57.63 ± 18.15 vs. 71.29 ± 24.60, P = 0.046).
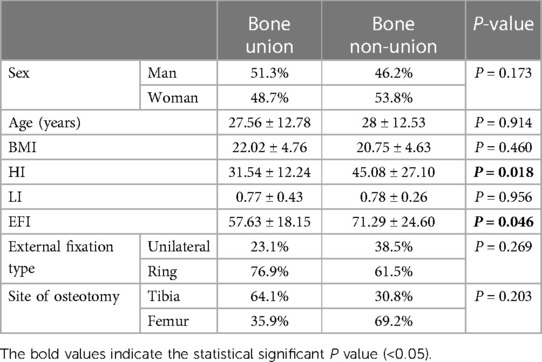
Table 2. The basic information between bone union and non-union.
3.2. The asymmetric growth of early callus PVR in bone union
The growth of early callus PVR in bone union was asymmetrical. The anterior, posterior, medial, and lateral PVR of the first, second, and third months were (0.80 ± 0.18, 0.96 ± 0.17, 0.88 ± 0.16, 0.89 ± 0.15, and P = 0), (0.82 ± 0.17, 0.98 ± 0.14, 0.90 ± 0.16, 0.90 ± 0.17, and P = 0.01), (0.85 ± 0.13, 1.00 ± 0.12, 0.92 ± 0.12, 0.95 ± 0.17, and P = 0), respectively. However, no significant statistical differences were obtained in the non-union group (Table 3).
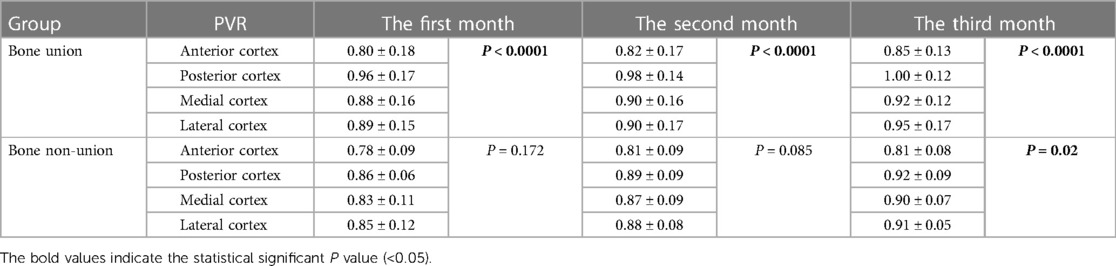
Table 3. The PVR in four cortices in the first three months after osteotomy.
3.3. The early posterior PVR in bone union was significantly higher than that in bone non-union
The early posterior PVR in bone union was significantly higher than that in bone non-union: 0.96 ± 0.17 vs. 0.86 ± 0.06, p = 0.047 (first month); 0.98 ± 0.14 vs. 0.89 ± 0.09, p = 0.041 (second month); 1.00 ± 0.12 vs. 0.92 ± 0.09, p = 0.039 (third month). However, no significant statistical differences were obtained in anterior, medial, and lateral PVR (Table 4).
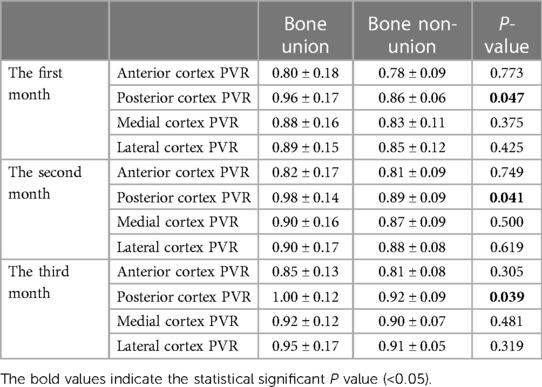
Table 4. The comparison of PVR in four cortices in the first three months for bone union and non-union.
3.4. Associations of the healing index, lengthening index, and external fixator index with the early pixel value ratio in four cortices of the callus
The early posterior PVR was inversely associated with HI in the bone union group: r = −0.343, p = 0.041 (first month); r = −0.459, p = 0.004 (second month); r = −0.479, p = 0.003 (third month). In addition, the early posterior PVR of the bone union group was inversely associated with LI in the bone union group: r = −0.346, p = 0.042 (first month); r = −0.277, p = 0.101 (second month); r = −0.398, p = 0.018 (third month). With regard to EFI, the early posterior PVR was also inversely associated with EFI in the bone union group: r = −0.352, p = 0.041 (first month); r = −0.511, p = 0.002 (second month); r = −0.551, p = 0.001 (third month). However, interestingly, such a relationship was lost on the other three sides (Table 5). Moreover, the negative associations of posterior PVR with HI, LI, and EFI were not obtained in bone non-union (Table 6).
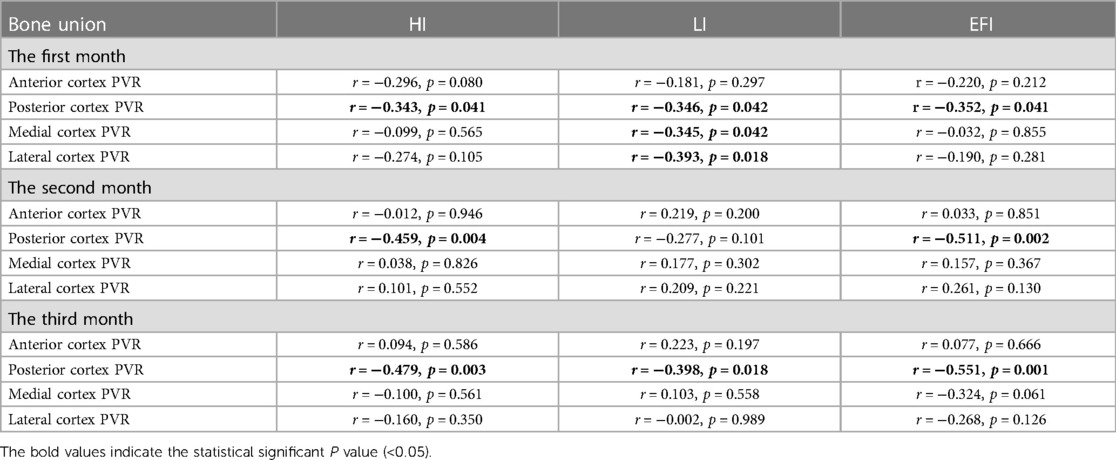
Table 5. The associations of early PVR in four cortices with the healing index, lengthening index, and external fixator index in bone union.
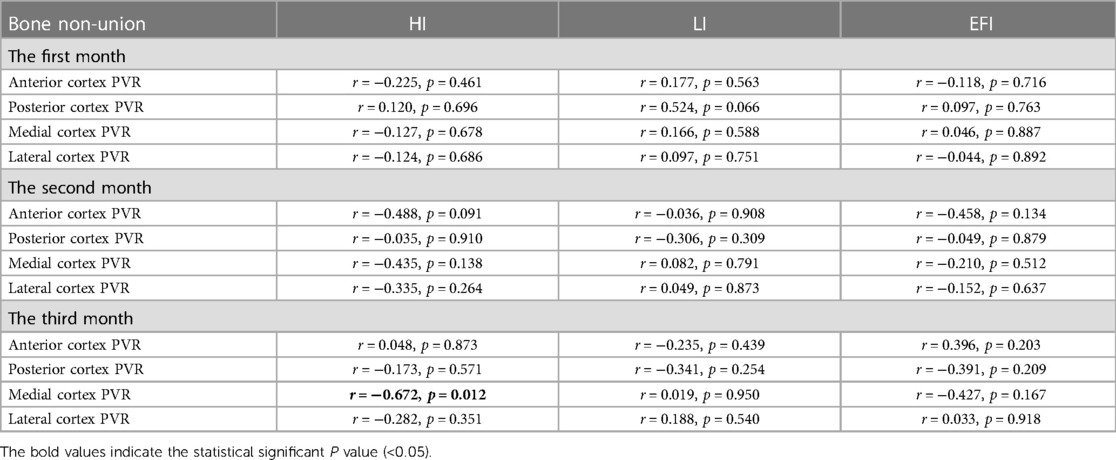
Table 6. The associations of early PVR in four cortices with the healing index, lengthening index, and external fixator index in bone non-union.
4. Discussion
Previous studies have investigated the late PVR to consider the timing for external fixator removal. E. Vulcano et al. declared that an overall mean PVR of 0.90 was representative of clinical bone healing (14). A. Bafor et al. found that the participants started weight-bearing with no adverse effects when three of four cortices had a PVR of at least 0.93 (12). Moreover, L. Zhao et al. concluded that the PVR criteria for partial and full weight-bearing were the two/three cortical PVR close to one, respectively (22). Besides, the discovery of three or four consecutive cortices at least 2 mm thick on anteroposterior and lateral radiographs is a common criterion for removing external fixation frames after DO (26, 27). However, the above evidence was related to the intramedullary lengthening, and the early PVR in four cortices was also ignored. Therefore, this study was employed to address these issues.
Our previous study has shown that the early PVR was moderately negatively associated with HI and LI, which suggests that the early PVR can effectively reflect the clinical outcome of DO (16). However, the four cortices were taken as a whole. Considering the different rates of PVR growth in the four cortices, it is not clear which side of PVR matters a lot (12, 14, 22). In addition, we also found that the PVR growth pattern between bone union and non-union was quite different (17). Therefore, the present study aimed to investigate the growth of early PVR in four cortices for the bone union and non-union groups and analyzed their relationship with HI, LI, and EFI, respectively. Our study found that the early posterior cortex PVR in the bone union group grew faster and was negatively associated with HI, LI, and EFI in bone union, rather than in bone non-union. This result is consistent with E. Vulcano et al.'s study (the four cortical PVRs were: lateral 0.84, medial 0.89, anterior 0.92, and posterior 0.98) (14). It was speculated that the posterior cortex had less periosteum (necessary for bone tissue growth) and soft tissue destruction during osteotomy. The periosteum has three layers of structure: the superficial fibrous layer, the middle vascular undifferentiated area, and the inner cambium layer, which is adjacent to the outer surface of the bone with decent osteogenic ability (28, 29). Importantly, the callus formation was significantly impaired (failed bone lengthening) after periosteum removal (30). Furthermore, K. Nakahara et al.'s study proved that the periosteum plays an indispensable indirect role in the process of DO (31). The above evidence seems to support the asymmetric growth pattern of early callus PVR in bone union.
5. Advantages and limitations
The advantages of this study are as follows: (1) this is the first extramedullary extension study to monitor early PVR in four cortices during DO; (2) our study has specified the early posterior cortex PVR as a potential novel reliable indicator for DO. The limitations of our study should also be acknowledged: (1) several issues cannot be addressed due to the nature of the retrospective study design; (2) interference from metal fixtures during PVR measurement may have a slight impact on PVR evaluation; (3) the number of recruited subjects is relatively small, which may inevitably influence our results.
6. Conclusion
The early posterior cortex PVR seems to grow faster than the medial, lateral, and anterior sides in the bone union group, which represents an asymmetrical development pattern. Moreover, the posterior cortex PVR was negatively associated with HI, LI, and EFI, respectively. The posterior cortex PVR may be a novel and reliable detection index in the process of DO. Our results suggest that the early posterior cortex PVR should be noticed in clinical practice, which provides important information for accurate monitoring of callus in subjects with DO. However, due to the small sample size and retrospective design of this study, further large-scale prospective studies are needed to support the issues concerned.
Data availability statement
The original contributions presented in the study are included in the article/Supplementary Material, further inquiries can be directed to the corresponding authors.
Ethics statement
The studies involving humans were approved by The Ethics Committee of Xiangya Hospital of Central South University. The studies were conducted in accordance with the local legislation and institutional requirements. Written informed consent for participation in this study was provided by the participants’ legal guardians/next of kin.
Author contributions
ZL: Data curation, Formal Analysis, Investigation, Methodology, Software, Validation, Visualization, Writing – original draft, Writing – review & editing. MW: Data curation, Funding acquisition, Investigation, Methodology, Project administration, Resources, Validation, Writing – review & editing. QL: Conceptualization, Formal Analysis, Investigation, Methodology, Visualization, Writing – review & editing. CZ: Investigation, Methodology, Validation, Visualization, Writing – review & editing. HG: Investigation, Methodology, Validation, Visualization, Writing – review & editing. JL: Conceptualization, Investigation, Methodology, Software, Supervision, Validation, Visualization, Writing – review & editing. YZ: Conceptualization, Data curation, Formal Analysis, Funding acquisition, Investigation, Methodology, Project administration, Resources, Software, Supervision, Validation, Visualization, Writing – original draft, Writing – review & editing.
Funding
The author(s) declare financial support was received for the research, authorship, and/or publication of this article.
This study was supported by the National Natural Science Foundation of China (82102581, 82270930), the National Postdoctoral Science Foundation of China (2021M693562), the Provincial Natural Science Foundation of Hunan (2019JJ40517, 2022JJ40843), the Provincial Outstanding Postdoctoral Innovative Talents Program of Hunan (2021RC2020), the Young Investigator Grant of Xiangya Hospital, Central South University (2020Q14), the FuQing Postdoc Program of Xiangya Hospital, Central South University (176), and Fund of Reform and Practice of Ideological and Political in Xiangya Hospital, Central South University (36, 40).
Conflict of interest
The authors declare that the research was conducted in the absence of any commercial or financial relationships that could be construed as a potential conflict of interest.
Publisher's note
All claims expressed in this article are solely those of the authors and do not necessarily represent those of their affiliated organizations, or those of the publisher, the editors and the reviewers. Any product that may be evaluated in this article, or claim that may be made by its manufacturer, is not guaranteed or endorsed by the publisher.
References
1. Li J, Li B, Zhang Z, Wang S, Liu L. Ilizarov external fixation versus plate internal fixation in the treatment of end-stage ankle arthritis: decision analysis of clinical parameters. Sci Rep. (2017) 7:16155. doi: 10.1038/s41598-017-16473-4
2. Malkova TA, Borzunov DY. International recognition of the ilizarov bone reconstruction techniques: current practice and research (dedicated to 100(th) birthday of G. A. Ilizarov). World J Orthop. (2021) 12:515–33. doi: 10.5312/wjo.v12.i8.515
3. Yang S, Wang N, Ma Y, Guo S, Guo S, Sun H. Immunomodulatory effects and mechanisms of distraction osteogenesis. Int J Oral Sci. (2022) 14:4. doi: 10.1038/s41368-021-00156-y
4. Shchudlo N, Varsegova T, Stupina T, Shchudlo M, Saifutdinov M, Yemanov A. Benefits of ilizarov automated bone distraction for nerves and articular cartilage in experimental leg lengthening. World J Orthop. (2017) 8:688–96. doi: 10.5312/wjo.v8.i9.688
5. Selhi HS, Mahindra P, Yamin M, Jain D, De Long WG Jr., Singh J. Outcome in patients with an infected non-union of the long bones treated with a reinforced antibiotic bone cement rod. J Orthop Trauma. (2012) 26:184–8. doi: 10.1097/BOT.0b013e318225f77c
6. Liu Z, Liu Q, Guo H, Liang J, Zhang Y. Overview of physical and pharmacological therapy in enhancing bone regeneration formation during distraction osteogenesis. Front Cell Dev Biol. (2022) 10:837430. doi: 10.3389/fcell.2022.837430
7. Berner A, Reichert JC, Müller MB, Zellner J, Pfeifer C, Dienstknecht T, et al. Treatment of long bone defects and non-unions: from research to clinical practice. Cell Tissue Res. (2012) 347:501–19. doi: 10.1007/s00441-011-1184-8
8. Paley D. Problems, obstacles, and complications of limb lengthening by the ilizarov technique. Clin Orthop Relat Res. (1990) 250:81–104.
9. Tesiorowski M, Kacki W, Jasiewicz B, Rymarczyk A, Sebastianowicz P. Methods for the evaluation of bone regeneration during distraction osteogenesis. Chir Narzadow Ruchu Ortop Pol. (2005) 70:127–30.16158871
10. Babatunde OM, Fragomen AT, Rozbruch SR. Noninvasive quantitative assessment of bone healing after distraction osteogenesis. Hss J. (2010) 6:71–8. doi: 10.1007/s11420-009-9130-y
11. Hazra S, Song HR, Biswal S, Lee SH, Lee SH, Jang KM, et al. Quantitative assessment of mineralization in distraction osteogenesis. Skeletal Radiol. (2008) 37:843–7. doi: 10.1007/s00256-008-0495-7
12. Bafor A, Duncan ME, Iobst CA. Evaluating the utility of the pixel value ratio in the determination of time to full weight-bearing in patients undergoing intramedullary limb lengthening. Strategies Trauma Limb Reconstr. (2020) 15:74–8. doi: 10.5005/jp-journals-10080-1461
13. Song SH, Agashe M, Kim TY, Sinha S, Park YE, Kim SJ, et al. Serial bone mineral density ratio measurement for fixator removal in tibia distraction osteogenesis and need of a supportive method using the pixel value ratio. J Pediatr Orthop B. (2012) 21:137–45. doi: 10.1097/BPB.0b013e32834f04f3
14. Vulcano E, Markowitz JS, Ali S, Nguyen J, Fragomen AT, Rozbruch SR. Assessment of bone healing during antegrade intramedullary rod femur lengthening using radiographic pixel density. J Am Acad Orthop Surg. (2018) 26:e388–94. doi: 10.5435/jaaos-d-16-00949
15. Song SH, Sinha S, Kim TY, Park YE, Kim SJ, Song HR. Analysis of corticalization using the pixel value ratio for fixator removal in tibial lengthening. J Orthop Sci. (2011) 16:177–83. doi: 10.1007/s00776-011-0036-4
16. Liu Q, Mei H, Zhu G, Liu Z, Guo H, Wang M, et al. Early pixel value ratios to assess bone healing during distraction osteogenesis. Front Bioeng Biotechnol. (2022) 10:929669. doi: 10.3389/fbioe.2022.929699
17. Liu Q, Liu Z, Guo H, Wang M, Liang J, Zhang Y. A comparative study of bone union and non-union during distraction osteogenesis. BMC Musculoskelet Disord. (2022) 23(1):1053. doi: 10.1186/s12891-022-06034-w
18. Zhang J, Yin P, Han B, Zhao J, Yin B. The treatment of the atrophic clavicular non-union by double-plate fixation with autogenous cancellous bone graft: a prospective study. J Orthop Surg Res. (2021) 16(1):22. doi: 10.1186/s13018-020-02154-y
19. Wu S, Quan K, Mei J, Dai M, Song S. Cortical allograft strut augmented with platelet-rich plasma for the treatment of long bone non-union in lower limb- a pilot study. BMC Musculoskelet Disord. (2022) 23(1):512. doi: 10.1186/s12891-022-05375-w
20. Jiang Y, Wang X, Huang W, Zhu Y, Zhang K, Feng D. A novel bone graft technique combined with plating for aseptic recalcitrant long bone non-union. BMC Musculoskelet Disord. (2022) 23(1):873. doi: 10.1186/s12891-022-05830-8
21. Iobst CA, Mohammed W, Colley R. Determining when it is safe to remove the external fixator: results from a survey of the limb lengthening and reconstruction society. Orthopedics. (2017) 40:e876–9. doi: 10.3928/01477447-20170810-06
22. Zhao L, Fan Q, Venkatesh KP, Park MS, Song HR. Objective guidelines for removing an external fixator after tibial lengthening using pixel value ratio: a pilot study. Clin Orthop Relat Res. (2009) 467:3321–6. doi: 10.1007/s11999-009-1011-7
23. Wright SE, Goodier WD, Calder P. Regenerate deformity with the precice tibial nail. Strategies Trauma Limb Reconstr. (2020) 15:98–105. doi: 10.5005/jp-journals-10080-1457
24. Koczewski P, Shadi M. Factors influencing bone regenerate healing in distraction osteogenesis. Ortop Traumatol Rehabil. (2013) 15:591–9. doi: 10.5604/15093492.1091515
25. Abulaiti A, Liu Y, Cai F, Liu K, Abula A, Maimaiti X, et al. Bone defects in tibia managed by the bifocal vs. trifocal bone transport technique: a retrospective comparative study. Front Surg. (2022) 9:858240. doi: 10.3389/fsurg.2022.858240
26. Fischgrund J, Paley D, Suter C. Variables affecting time to bone healing during limb lengthening. Clin Orthop Relat Res. (1994) 301:31–7.
27. Skaggs DL, Leet AI, Money MD, Shaw BA, Hale JM, Tolo VT. Secondary fractures associated with external fixation in pediatric femur fractures. J Pediatr Orthop. (1999) 19(5):582–6. doi: 10.1097/00004694-199909000-00005
28. Zhang W, Wang N, Yang M, Sun T, Zhang J, Zhao Y, et al. Periosteum and development of the tissue-engineered periosteum for guided bone regeneration. J Orthop Translat. (2022) 33:41–54. doi: 10.1016/j.jot.2022.01.002
29. Tang Y, Wu B, Huang T, Wang H, Shi R, Lai W, et al. Collision of commonality and personalization: better understanding of the periosteum. Tissue Eng Part B Rev. (2023) 29:91–102. doi: 10.1089/ten.TEB.2022.0076
30. Kojimoto H, Yasui N, Goto T, Matsuda S, Shimomura Y. Bone lengthening in rabbits by callus distraction. The role of periosteum and endosteum. J Bone Joint Surg Br. (1988) 70:543–9. doi: 10.1302/0301-620x.70b4.3403595
Keywords: bone union and nonunion, distraction osteogenesis, external fixator, pixel value ratio, bone regeneration index, healing index, lengthening index, external fixator index
Citation: Liu Z, Liu Q, Wang M, Zhou C, Guo H, Liang J and Zhang Y (2023) The early posterior cortex pixel value ratio: a novel reliable indicator for distraction osteogenesis. Front. Surg. 10:1280332. doi: 10.3389/fsurg.2023.1280332
Received: 25 August 2023; Accepted: 13 October 2023;
Published: 30 October 2023.
Edited by:
Longpo Zheng, Tongji University, ChinaReviewed by:
Anirejuoritse Bafor, Nationwide Children’s Hospital, United StatesShahrokh Hatefi, Nelson Mandela University, South Africa
© 2023 Liu, Liu, Wang, Zhou, Guo, Liang and Zhang. This is an open-access article distributed under the terms of the Creative Commons Attribution License (CC BY). The use, distribution or reproduction in other forums is permitted, provided the original author(s) and the copyright owner(s) are credited and that the original publication in this journal is cited, in accordance with accepted academic practice. No use, distribution or reproduction is permitted which does not comply with these terms.
*Correspondence: Jieyu Liang amFtZXNsaWFuZzhAYWxpeXVuLmNvbQ== Yi Zhang emhhbmd5aTAyMDVAY3N1LmVkdS5jbg==