 Meizhen Wu1*
 Haijin Gao2
- 1Department of Intensive Care Unit, Shanxi Province Cancer Hospital/Shanxi Hospital Affiliated to Cancer Hospital, Chinese Academy of Medical Sciences/Cancer Hospital Affiliated to Shanxi Medical University, Taiyuan, China
- 2Department of Intensive Care Unit, The First Hospital of Shanxi Medical University, Taiyuan, China
Aim: To identify predictors for in-hospital mortality in patients with metastatic cancer in intensive care units (ICUs) and established a prediction model for in-hospital mortality in those patients.
Methods: In this cohort study, the data of 2,462 patients with metastatic cancer in ICUs were extracted from the Medical Information Mart for Intensive Care III (MIMIC-III) database. Least absolute shrinkage and selection operator (LASSO) regression analysis was applied to identify the predictors for in-hospital mortality in metastatic cancer patients. Participants were randomly divided into the training set (n = 1,723) and the testing set (n = 739). Patients with metastatic cancer in ICUs from MIMIC-IV were used as the validation set (n = 1,726). The prediction model was constructed in the training set. The area under the curve (AUC), sensitivity, specificity, positive predictive value (PPV), and negative predictive value (NPV) were employed for measuring the predictive performance of the model. The predictive performance of the model was validated in the testing set and external validation was performed in the validation set.
Results: In total, 656 (26.65%) metastatic cancer patients were dead in hospital. Age, respiratory failure, the sequential organ failure assessment (SOFA) score, the Simplified Acute Physiology Score II (SAPS II) score, glucose, red cell distribution width (RDW) and lactate were predictors for the in-hospital mortality in patients with metastatic cancer in ICUs. The equation of the prediction model was ln(P/(1 + P)) = −5.9830 + 0.0174 × age + 1.3686 × respiratory failure + 0.0537 × SAPS II + 0.0312 × SOFA + 0.1278 × lactate − 0.0026 × glucose + 0.0772 × RDW. The AUCs of the prediction model was 0.797 (95% CI,0.776–0.825) in the training set, 0.778 (95% CI, 0.740–0.817) in the testing set and 0.811 (95% CI, 0.789–0.833) in the validation set. The predictive values of the model in lymphoma, myeloma, brain/spinal cord, lung, liver, peritoneum/pleura, enteroncus and other cancer populations were also assessed.
Conclusion: The prediction model for in-hospital mortality in ICU patients with metastatic cancer exhibited good predictive ability, which might help identify patients with high risk of in-hospital death and provide timely interventions to those patients.
Introduction
The number of cancer patients has steadily been increasing and cancer has become the major cause of death in many countries (1). The American Cancer Society estimated that 1,898,160 new cancer cases and 608,570 cancer deaths are projected to occur in the United States in 2021 (2). According to the data from the World Health Organization (WHO), the global incidence of cancer might increase by over 63% in 2040 relative to 2018 (3). Approximately 5%–10% of cancer patients may develop a life-threatening disease which requires intensive care unit (ICU) admission (4). A previous study indicated that nearly 1/7 of the patients in ICUs had cancers in Europe (5). Cancer patients admitted into ICUs were associated with poor outcomes with a hospital mortality as high as 50% (6). In recent years, more and more patients with metastatic cancer actively received the treatments and many of them may be admitted to ICUs during the course of their disease, and the prognosis of these patients was even poorer (7). To accurately identify patients with metastatic cancer who are at high risk of mortality was essential for clinicians to provide timely interventions and improve the outcomes of these patients.
Previously, several studies have identified various predictors for the mortality in patients with metastatic cancers (8–10). Additionally, Lee Cheng et al. established a prediction model for predicting the 14-days' mortality in patients with metastatic or advanced cancer based on the laboratory test results of these patients at hospital admission in ICUs (11). This study included patients with metastatic or advanced cancer, but the characteristics of patients with metastatic or advanced cancers were not the same (12). Cancer metastasis includes both regional lymph node metastasis, non-regional lymph node metastasis, and distant metastasis. Patients with cancers at advanced stage are metastatic, which generally refers to distant metastasis (12, 13). Additionally, the discriminatory ability of the model was moderate. A suitable model for predicting the mortality of ICU patients with metastatic cancer was still required.
In the current study, we planned to establish a prediction model for in-hospital mortality in those patients based on the data from the Medical Information Mart for Intensive Care III (MIMIC-III). The predictive value of the model for different cancers were also evaluated. Internal validation of the performance of the model was assessed. External validation of the performance of the model was conducted using the data from MIMIC-IV. The findings of this study might provide a tool for identify patients with high risk of in-hospital death in ICU patients with metastatic cancer.
Materials and methods
Study design and population
In this cohort study, the data of 2,462 patients ≥18 years with metastatic cancer admitted into ICUs were extracted from MIMIC-III database and the data of 1,726 patients ≥18 years with metastatic cancer admitted into ICUs were extracted from MIMIC-IV database. MIMIC-III is a freely accessed database including the demographic characteristics, vital signs, laboratory test results, imaging examinations, and a data dictionary if patients admitted to the Beth Israel Deaconess Medical Center in Boston, Massachusetts (14). A complete hospitalization record of each patient can be obtained by using a special code assigned in each hospital at ICU admission, and hospital staff entered the final precise diagnosis based on the International Classification of Disease 9th Edition (ICD-9) when patients were discharged. MIMIC-IV is an updated version of MIMIC-III that simplified the structure, added new data elements, and improved the usability of previous data elements (15). This study was conducted using an anonymized public database that satisfied review committee agreements, and the requirement for ethical consent was not necessary.
Potential predictors
The potential predictors for the in-hospital mortality in patients with metastatic cancer admitted into ICUs included baseline characteristics, treatment associated characteristics and clinical characteristics. Some baseline and clinical variables analyzed as potential predictors used the first measurement data measured within 24 h ICU admission.
Baseline characteristics included age (years), gender, race (White, Black, Asian, Hispanic or others), marital status (married, single, widowed or divorced/separated), history of comorbidities included congestive heart failure, cardiac dysrhythmia, atrial fibrillation, chronic kidney disease (CKD), myocardial infarction, diabetes mellitus, hypertension, hyperlipidemia, and septicemia, tumor type (lymphoa, myeloma, brain/spinal cord, lung, liver, peritoneum/pleura, enteroncus or others) and respiratory failure.
Treatment associated characteristics included surgery, chemotherapy, radiotherapy, ventilation, partial arterial oxygen pressure (PaO2)/the fraction of inspired oxygen (FiO2), the Simplified Acute Physiology Score II (SAPS II) score, the Glasgow Coma Scale (GCS) score, the sequential organ failure assessment (SOFA) score.
Clinical characteristics included temperature (°C), heart rate (time/minute), systolic blood pressure (SBP, mmHg), diastolic blood pressure (DBP, mmHg), mean arterial pressure (MAP, mmHg), red blood count (RBC, m/µl), sodium (mEq/L), potassium (mEq/L), phosphate (mg/dl), calcium (mg/dl), platelets (PLT, K/µl), pondus hydrogenii (pH), lactate (mmol/L), international normalized ratio (INR), albumin (g/L), hemoglobin (g/dL), white blood cell count (WBC, K/µL), glucose (mg/dl), creatinine (mg/dl), blood urea nitrogen (BUN, mg/dl), bicarbonate (mEq/l), neutrophil, lymphocytes, total bilirubin (TBIL, μmol/L), hematocrit (HCT, L/L), and red cell distribution width (RDW).
Outcome variables
The outcome in our study was patients with metastatic cancer died in hospital or discharged from hospital. The medium follow-up time was 6.63 (3.78, 10.67) days. The follow-up was terminated when the outcome occurred.
Data extraction
The data of 2,462 patients with metastatic cancer admitted into ICUs were extracted from the MIMIC-III v1.3. The numbers of patients and ICD-9 code of different cancers were shown in Supplementary Table S1. The missing values were exhibited in Supplementary Table S2. Sensitivity analysis was conducted and the results depicted that no statistical difference was observed between the data before and after manipulation (Supplementary Table S2).
Construction of the prediction model
Participants from MIMIC-III were randomly divided into the training set (n = 1,723) and the testing set (n = 739). Least absolute shrinkage and selection operator (LASSO) regression analysis was used for identifying the factors with statistical difference between the survival group and the death group in the training set (P < 0.05) to screen the predictors of mortality in ICU patients with metastatic cancer. The predictors were included in the prediction model and area under the curve (AUC), sensitivity, specificity, positive predictive value (PPV), and negative predictive value (NPV) were employed for measuring the predictive performance of the model. ROC curve and Calibration curve were plotted to evaluate the predictive value of the model. Subgroup analysis was conducted in terms of different cancer types. The data in the testing set were used as internal validation of the performance of the model and the data from MIMIC-IV (n = 1,726) were applied as external validation of the value of the model.
Statistical analysis
The Shapiro test was applied to test the normality of measurement data. The measurement data with normal distribution were described as Mean ± standard deviation (SD) and t test was applied for comparisons between groups. Non-normal distributed data were shown as median and quartile spacing M (Q1, Q3), and comparisons between groups was performed by Mann-Whitney U rank-sum test. The enumeration data were displayed as n (%), and the differences between groups were conducted via χ2 test or Fisher's exact probability method. The missing values were manipulated via multiple imputation (R: mice) and differences of variables before and after interpolation were analyzed by sensitivity analysis (Supplementary Table S2). The data from MIMIC-III were randomly divided into the training set and the testing set at 7:3 via SAS 9.4 generated random number. All statistical tests were performed by a two-sided test. SAS 9.4 was used to screen the predictors and construct the prediction model. The validation and nomogram of the model were performed by R 4.0.2. P < 0.05 was set as statistical difference.
Results
Equilibrium test in the training set and the testing set
In total, 2,530 patients with metastatic cancer admitted into ICUs from MIMIC-III were included in this study. Patients <18 years were excluded (n = 68) and 2,462 patients finally participated in. The screen process was displayed in Figure 1. The average age of all subjects were 65.28 ± 12.65 years, including 1,312 males (53.29%) and 1,150 females (46.71%). Among all patients, 1996 patients were White, accounting for 81.07%, 201 subjects were Black, accounting for 8.16%, 114 persons were Asia, accounting for 4.63%, 58 people were the Spanish, accounting for 2.36%, and 93 participants were other races, accounting for 3.78%. 1504 participants were married (61.09%), 500 subjects were single (20.31%), 290 people were widowed (11.78%), and 168 patients were divorced/separated (6.82%). 382 patients were complicated with congestive heart failure, accounting for 15.52%, 143 persons had arrhythmias, accounting for 5.81%, 584 subjects had respiratory failure, accounting for 23.72%, and 455 participants were complicated with sepsis, accounting for 18.48%. In terms of cancer types, 323 patients were lymphoma (13.12%), 325 patients were myeloma (13.20%), 376 people were brain/spinal cancer (15.27%), 273 persons were lung cancer (11.09%), 328 patients were liver cancer (13.32%), 245 subjects were peritoneum/pleura cancer (9.95%), 103 participants were enteroncus (4.18%), and 489 patients were others (19.86%). In all participants, 656 people died, accounting for 26.65%, and 1806 were survived, accounting for 73.35%. The equilibrium test revealed that there was no significant difference in the baseline, treatment and clinical characteristics between the training set and the testing set (All P > 0.05) (Table 1).
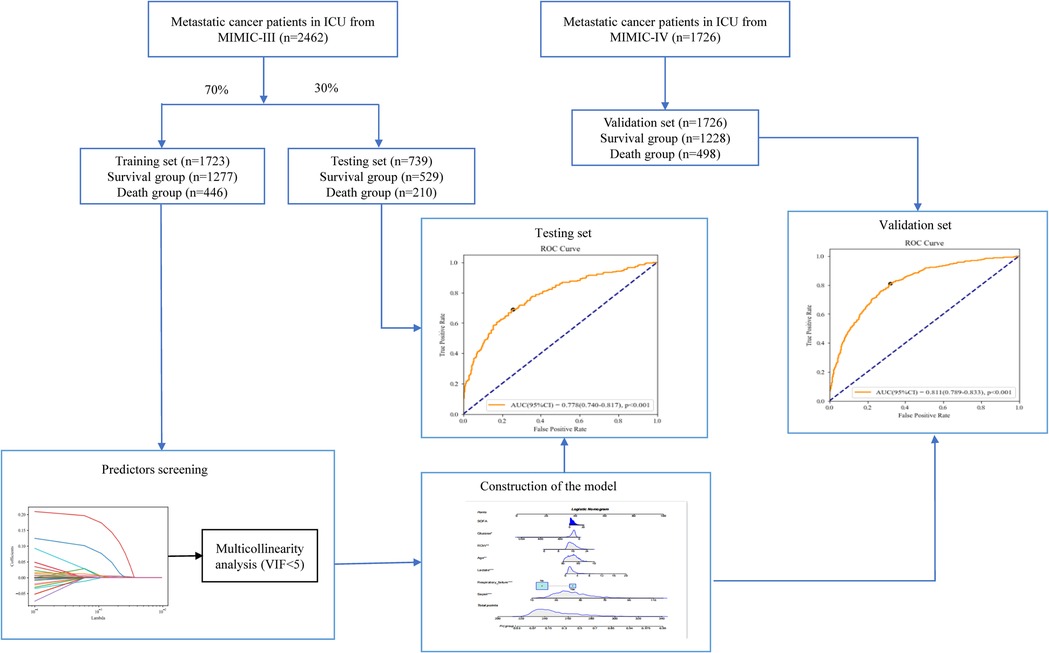
Figure 1. The screen process of participants.
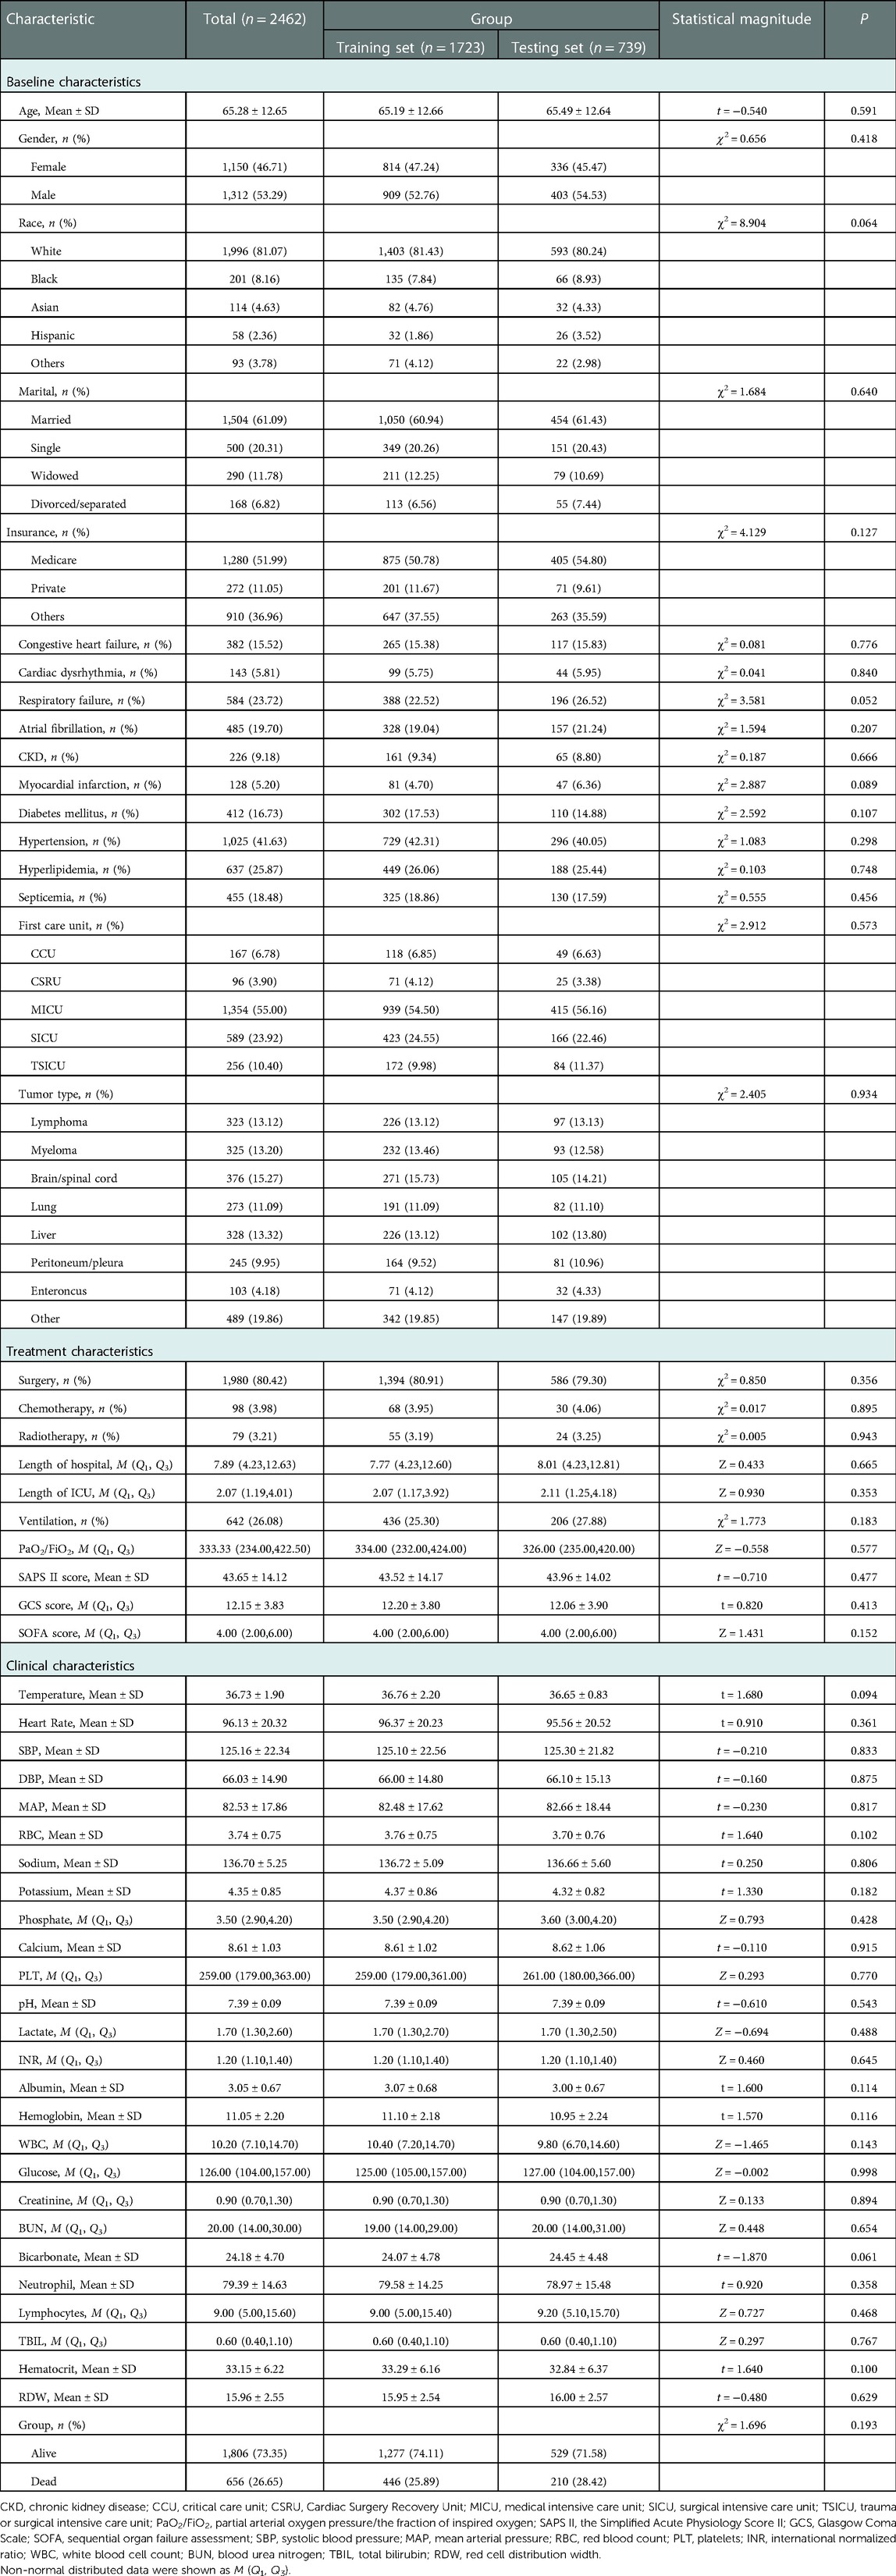
Table 1. The equilibrium test in the training set and the testing set.
Comparisons of the characteristics in patients between the survival group and the death group in the training set
The proportions of patients with respiratory failure in death group (47.53% vs. 13.76%, χ2 = 215.814, P < 0.001), patients with myocardial infarction (6.95% vs. 3.92%, χ2 = 6.797, P = 0.009), patients with septicemia (37.89% vs. 12.22%, χ2 = 142.391, P < 0.001), patients with chemotherapy (5.83% vs. 3.29%, χ2 = 5.628, P = 0.018), and mechanical ventilation (31.61% vs. 23.10%, χ2 = 12.675, P < 0.001) were higher than in the survival group. The median LOS in ICU (2.63 day vs. 2.00 day, Z = 5.060, P < 0.001), SAPS II score (52.87 vs. 40.26, t = −15.140, P < 0.001), SOFA scores (6.00 vs. 3.00, Z = 13.362, P < 0.001), heart rate (102.75 times/minute vs. 94.15 times/minute, t = −7.480, P < 0.001), potassium (4.58 mEq/l vs. 4.29 mEq/l, t = 5.460, P < 0.001), phosphate (3.80 mg/dl vs. 3.50 mg/dl, Z = 5.334, P < 0.001) and lactate (2.20 mmol/l vs. 1.70 mmol/l, Z = 9.100, P < 0.001), INR (1.30 vs. 1.20, Z = 7.692, P < 0.001), WBC (11.5 K/uL vs. 9.9 K/uL, Z = 4.582, P < 0.001), creatinine (1.00 mg/dl vs. 0.90 mg/dl, Z = 5.893, P < 0.001), BUN (26.00 mg/dl vs. 18.00 mg/dl, Z = 10.677, P < 0.001), TBIL (0.61 μmol/l vs. 0.60 μmol/l, Z = 2.843, P = 0.004) and RDW(16.60 vs. 15.72, t = −6.090, P < 0.001) in the death group were higher than in the survival group. The proportion of patients with hyperlipidemia (19.06% vs. 28.50%, χ2 = 15.307, P < 0.001) in the death group was lower than in the survival group. The median LOS in hospital (6.05 days vs. 8.21 days, Z = −7.474, P < 0.001), PaO2/FiO2 (285.00 vs. 351.43, Z = 7.418, P < 0.001), GCS score (13.99 vs. 14.00, Z = 7.632, P < 0.001), SBP (119.05 mmHg vs. 127.21 mmHg, t = 7.070, P < 0.001), MAP (78.54 mmHg vs. 83.85 mmHg, t = 5.530, P < 0.001), RBC (3.70 m/µl vs. 3.78 m/µl, t = 2.030, P = 0.043), sodium (135.59 mEq/L vs. 137.12 mEq/L, t = 4.900, P < 0.001), calcium (8.51 mg/dl vs. 8.65 mg/dl, t = 2.170, P = 0.030), PLT (249.50 K/µl vs. 262.00 K/µl, Z = 2.042, P = 0.040), pH (7.36 vs. 7.40, t = 7.460, P < 0.001), albumin (1.30 g/L vs. 1.20 g/L, T = 7.460, P < 0.001), hemoglobin (10.85 g/dl vs. 11.18 g/dl, t = 2.800, P = 0.005), glucose (120.00 mg/dl vs. 128.00 mg/dl, Z = −2.919, P = 0.004), bicarbonate (23.15 mEq/L vs. 24.39 mEq/L, t = 4.270, P < 0.001), and lymphocytes (6.80 vs. 10.00, Z = 8.188, P < 0.001) in the death group were lower than the survival group. The race (χ2 = 15.991, P = 0.003), first care unit (χ2 = 87.775, P < 0.001) and tumor type (χ2 = 53.144, P < 0.001) were statistically different between the death group and the survival group (Table 2).
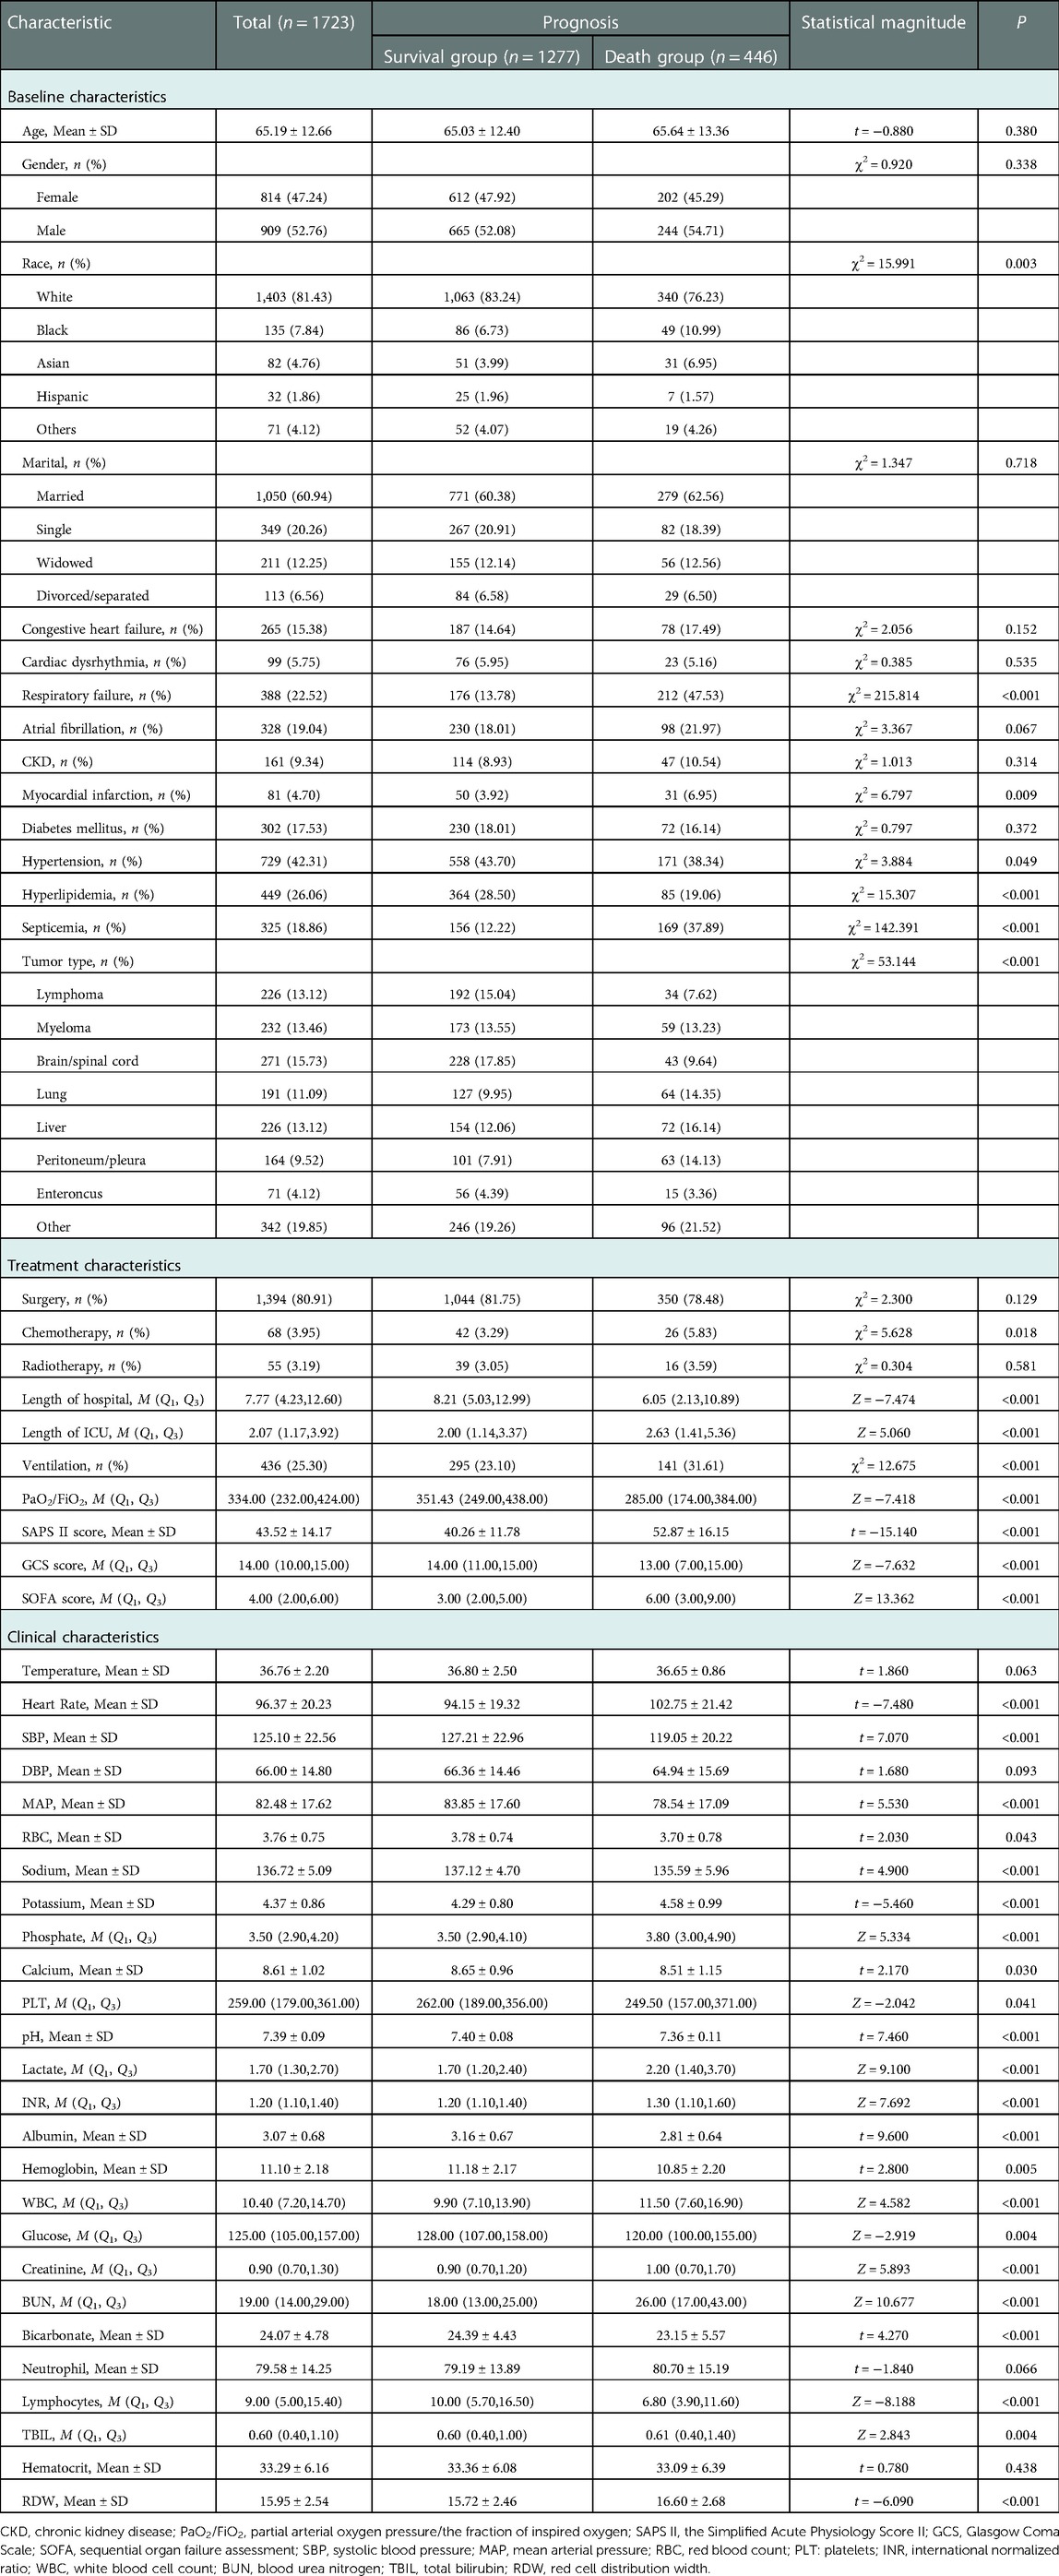
Table 2. Comparisons of the characteristics in patients between the survival group and the death group in the training set.
Predictors influencing the mortality in ICU patients with metastatic cancer
LASSO regression analysis was applied to screen the predictors for the mortality in ICU patients with metastatic cancer. As variables including ventilation, PaO2/FiO2, PLT, TBIL, and creatinine were included in SOFA score, and variables including heart rate, SBP, temperature, ventilation, PaO2/FiO2, BUN, WBC, potassium, sodium, bicarbonate, and TBIL were involved in SAPS II, these variables were not included in LASSO regression to avoid collinearity. The results depicted that age, respiratory failure, SOFA score, SAPS II, glucose, RDW and lactate were predictors of in-hospital death in patients with metastatic cancer in ICUs (Figure 2). Multicollinearity analysis reported that the variance inflation factor (VIF) of these predictors were <5 (Supplementary Table S3), indicating low collinearity in these variables. The final equation for the prediction model was ln(P/(1 + P)) = −5.9830 + 0.0174 × age + 1.3686 × respiratory failure + 0.0537 × SAPS II + 0.0312 × SOFA + 0.1278 × lactate − 0.0026 × glucose + 0.0772 × RDW.
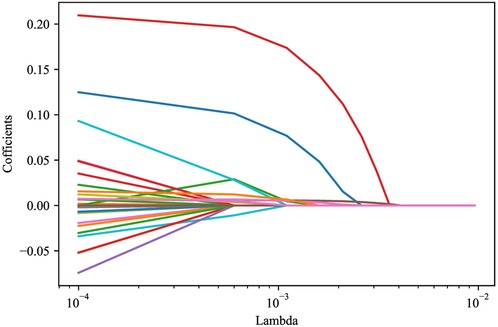
Figure 2. LASSO regression analysis screening the predictors for in-hospital mortality of metastasitc cancer patients.
Construction and validation of the prediction model
The ROC and calibration curves were applied for evaluating the predictive value of the prediction model. The data delineated that in the training set, the AUC was 0.797 (95% CI, 0.776–0.825), the sensitivity was 0.767 (95% CI, 0.728–0.806), the specificity was 0.720 (95% CI, 0.696–0.745), and the NPV was 0.898 (95% CI, 0.880–0.917). In the testing set, the AUC was 0.778 (95% CI, 0.740–0.817), the sensitivity was 0.690 (95% CI, 0.628–0.753), the specificity was 0.745 (95% CI, 0.708–0.782), and the NPV was 0.858 (95% CI, 0.826–0.890) (Table 3). The data from MIMIC-IV were applied as a validation set, and the detailed characteristics of participants were shown in Supplementary Table S4. The AUC in the validation set was 0.811 (95% CI, 0.789–0.833), the sensitivity was 0.811 (95 %CI, 0.777–0.846), the specificity was 0.679 (95% CI, 0.653–0.705) and the NPV was 0.899 (95% CI, 0.879–0.918) (Table 3) (Figure 3). The calibration curves of the testing set (Figure 4) and the validation set (Figure 5) were plotted, which depicted that the prediction values of the model deviated slightly from the ideal model, but was close to matching, indicating the prediction model had good agreement between the predictive probability and the actual probability. A nomogram was plotted and a sample was randomly selected from the participants to validate the prediction ability of our model. The values of each predictor were represented by the red dot in the Figure 6. Each value corresponded to the score in the first row, and then the total score of the predictors in the sample was 290 in the penultimate row, and the probability of death in the sample was 0.791, which was the same with the actual outcome.
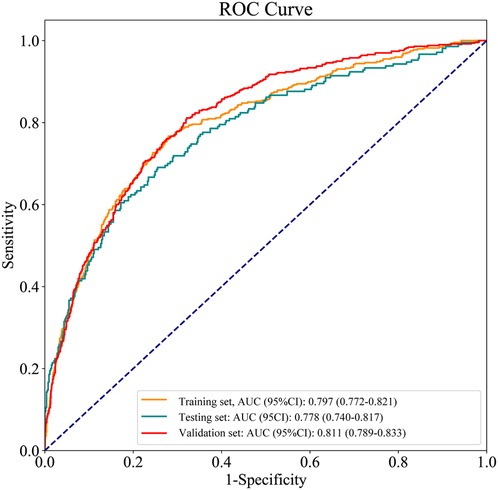
Figure 3. ROC curves for the prediction model in the training set, testing set and validation set.
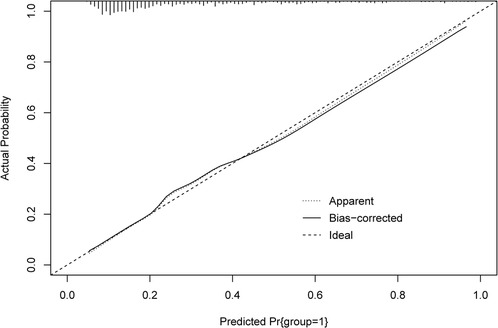
Figure 4. The calibration curves of model in the testing set.
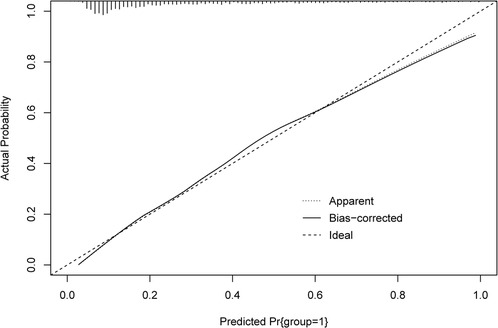
Figure 5. The calibration curves of the model in the validation set.
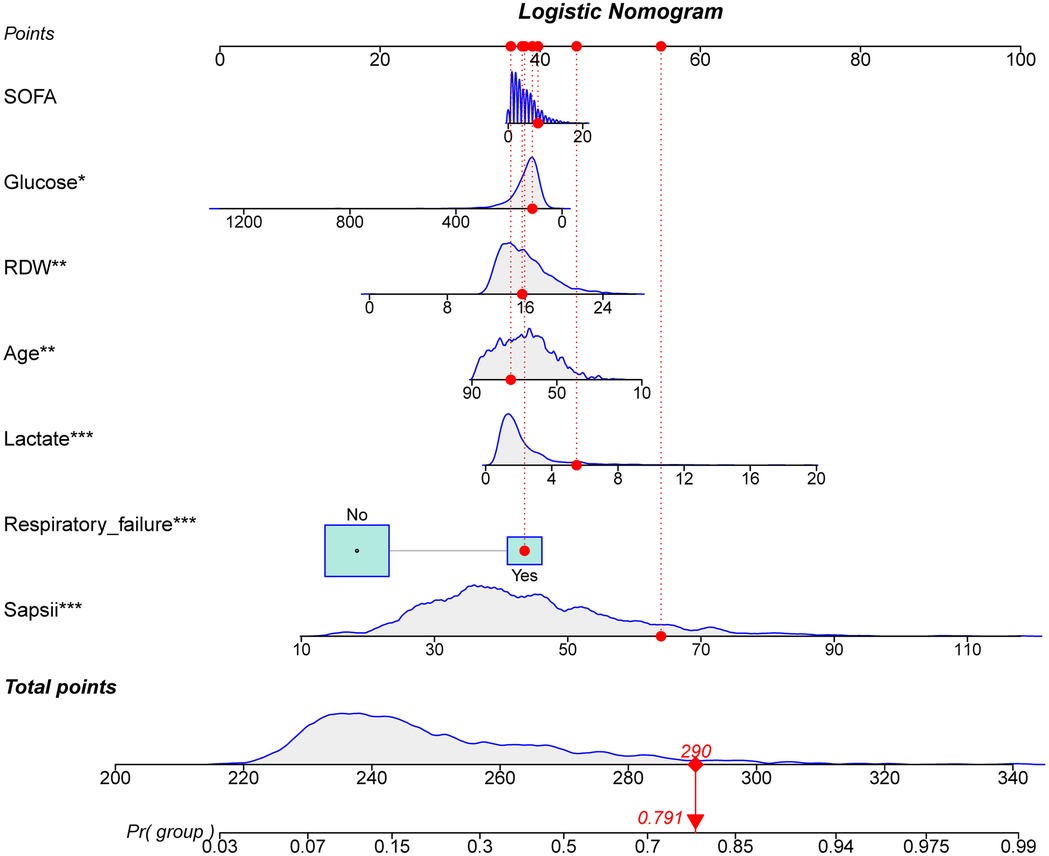
Figure 6. The nomogram for predicting the probability of death in patients with metastatic cancer.
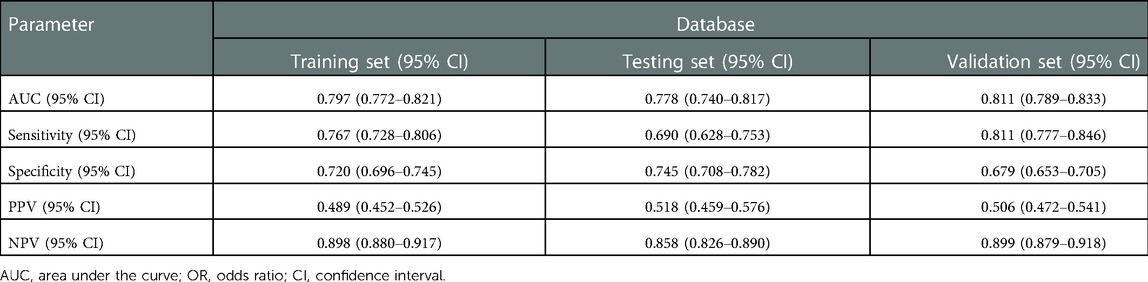
Table 3. Construction and validation of the prediction model.
Evaluation of the prediction value of the model in different cancers
As shown in Table 4, the AUCs of the prediction model for lymphoma, myeloma, brain/spinal cord, lung, liver, peritoneum/pleura, enteroncus and other cancer populations were 0.750 (95% CI, 0.692–0.808), 0.814 (95% CI, 0.753–0.875), 0.793 (95% CI, 0.714–0.871), 0.786 (95% CI, 0.735–0.836), 0.811 (95% CI, 0.768–0.854), 0.790 (95% CI, 0.734–0.846), 0.735 (95% CI, 0.593–0.877) and 0.807 (95% CI, 0.760–0.854), respectively (Figure 7). The sensitivity and specificity of the prediction models for different cancer types were exhibited in Table 4.
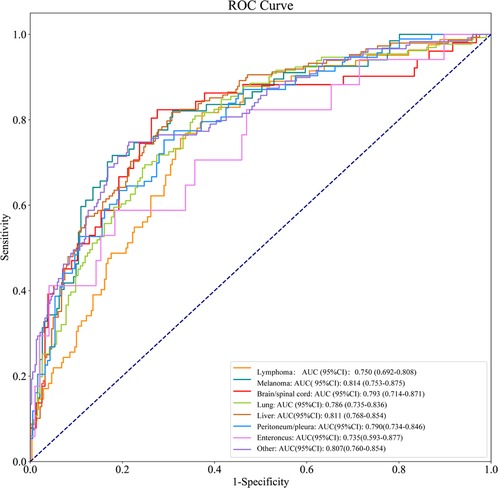
Figure 7. The nomogram for predicting the probabilityof death in patients with metastatic cancer.
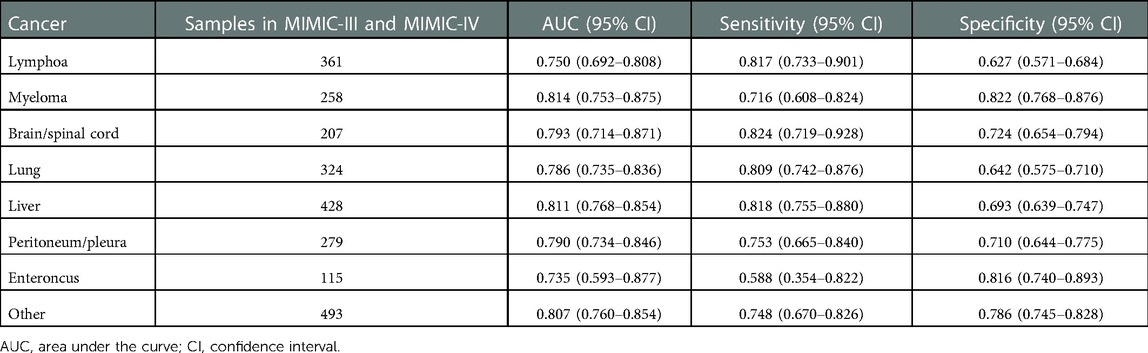
Table 4. Evaluation of the prediction value of the model in different cancers.
Discussion
The presented study established a prediction model for in-hospital mortality in metastasis patients using the data of 2,462 patients from the MIMIC-III and validated the performance of the prediction model through the data of 1,726 patients from MIMIC-IV. The results showed that the prediction model constructed in our study presented good predictive ability for the in-hospital mortality in patients with metastatic cancer in ICUs based on the predictors including age, respiratory failure, SOFA score, SAPS II, glucose, RDW and lactate. The model also depicted good predictive performance in different cancer types. The findings of this study might help identify patients with metastatic cancer who were at high risk of death in hospital, and reminded the clinicians to make proper interventions on these patients and improve their outcomes.
The prediction model for the mortality in metastatic cancer patients in ICUs was established. Compared with the previous prediction model from Lee Cheng et al. (11), our model was only included patients with metastatic cancer, and patients with advanced cancer but without metastasis were not included in this study, this could decrease the inclusion bias in patients. As the characteristics of patients with metastatic or advanced cancers were not the same (12). Some patients were at advanced stage but without metastasis (16). The model was more targeted for predicting the mortality in patients with metastatic cancer in ICUs. In addition, the predictive value of our model was higher than the previous model (AUC: 0.797 vs. 0.74). The calibration curve revealed that the prediction model was well calibrated. The sensitivity, specificity, PPV, NPV were also assessed to more comprehensively estimate the discriminatory ability of the model (17). The sensitivity, specificity, PPV, NPV of our model were high, which indicated the good predictive value of the model. The predictive value of the model was also validated in the testing set, and it also showed good discriminatory ability. External validation of the predictive performance was performed using the data from MIMIC-IV, and the results indicated good predictive value of the model. We also verified the prediction values of the model in different types of cancers, the predictive performances were all very good in different cancers. This suggested that our model was suitable for predicting the mortality in patients with different metastatic cancers. A nomogram was plotted, which can easily obtain the probability of death in patients with metastatic cancer in ICUs. In addition, an online tool was established based on our model to help the clinicians to quickly identify patients with high risk of mortality (https://wumeizhen.shinyapps.io/DynNomapp/). The findings of our model can help clinicians quickly identify metastatic cancer patients in ICUs with high risk of in-hospital death. Previous studies demonstrated that cancer patients in ICUs may derive benefits from different intensive care support (18), and if patients were predicted at high risk of mortality, clinicians should make timely interventions on their treatments and ICU management to improve their outcomes.
Acute respiratory failure is the major cause for ICU admission and death in patients with cancer (19, 20). Several studies have indicated that the in-hospital mortality of patients receiving open repair of descending thoracic aortic aneurysm with respiratory failure was higher than patients without respiratory failure (21). Another study also demonstrated that respiratory failure increased the hospital morality of lung cancer patients in ICUs by 3.00 times, which was an independent risk factor for hospital morality of lung cancer patients in ICUs (22). These findings were allied with the results in our study, which revealed that respiratory failure was associated with the risk of mortality in patients with metastatic cancer. For participants with respiratory failure, special care and early treatments should be provided. The SOFA score assesses the organ dysfunction over a period of time and evaluates the morbidity in ICU patients based on a scale of 0–4 for each organ system (23). The SOFA score was reported to be a sensitive and accurate tool for predicting the mortality in cancer patients admitted to ICUs with suspected infection (24). In our study, SOFA score was correlated with the risk of death in patients with metastatic cancer.
In critically ill patients with cancer, high levels of lactate may represent the cancer disease itself and the metabolism of the cancer cells, that is the Warburg effect (25). High levels of lactate was identified in some cancers, such as the aerobic glycolysis, the tumor cells consume glucose in the presence of oxygen, and product high levels of lactate, resulting in lactic acidosis (26). Additionally, increased levels of lactate were reported to be an essential predictor for the mortality in patients with cancer (26, 27). These findings gave support to the data in this study, delineating that the levels of lactate were associated with the risk of death in metastatic cancer patients in ICUs. For those with high levels of lactate, interventions such as sodium bicarbonate should be applied if necessary. Previous studies indicated that age was an important prognostic index of metastatic cancer patients, and patients with old ages might benefit less from the treatment and was associated with a higher risk of mortality (28, 29). Herein, age was also included as a predictor for the mortality in metastatic cancer patients in ICUs. RDW is reported to be of great value as a marker of poor prognosis for different cancers (30–33). The increased value of RDW might reflect the imbalance of RBC homeostasis, which may be due to the impaired RBC formation ability and abnormal RBC survival caused by the body's abnormal metabolism (34). In our study, RDW was identified to be a predictor for the risk of mortality in metastatic cancer patients. Special treatments might be required to patients with abnormal RDW.
Several limitations existed in the current study. Firstly, the data of included patients were extracted from the MIMIC-III database, and some important information such as the primary site of the tumors and the detailed treatment before admitted to or during ICUs. Secondly, the external validation of our model was not performed. Thirdly, the patients from MIMIC-III were mainly White people, whether the prediction model was suitable for patients from other countries still needs more verification. In the future, more well-designed prospective studies were required to validate the results in the present study.
Conclusions
In this study, the data of 2,462 patients were collected from the MIMIC-III to construct the prediction model for the in-hospital mortality of ICU patients with metastatic cancer and the data of 1,726 patients from MIMIC-IV were applied to validate the performance of the model. The model exhibited good predictive ability for the in-hospital mortality in patients with metastatic cancer in ICUs and also showed good predictive value for patients with different cancers. An online tool was made to help the clinicians to quickly use the model. The findings of the current study might help identify patients with metastatic cancer who were at high risk of death in hospital, and the clinicians should make timely interventions on these patients and improve their outcomes.
Data availability statement
Publicly available datasets were analyzed in this study. This data can be found here: MIMIC-III database, https://mimic.physionet.org/iii/.
Ethics statement
Ethical approval was not provided for this study on human participants because this study was conducted using an anonymized public database that satisfied review committee agreements. The patients/participants provided their written informed consent to participate in this study.
Author contributions
MW designed the study and wrote the manuscript. MW and HG collected, analyzed and interpreted the data. MW critically reviewed, edited and approved the manuscript. All authors contributed to the article and approved the submitted version.
Conflict of interest
The authors declare that the research was conducted in the absence of any commercial or financial relationships that could be construed as a potential conflict of interest.
Publisher's note
All claims expressed in this article are solely those of the authors and do not necessarily represent those of their affiliated organizations, or those of the publisher, the editors and the reviewers. Any product that may be evaluated in this article, or claim that may be made by its manufacturer, is not guaranteed or endorsed by the publisher.
Supplementary material
The Supplementary Material for this article can be found online at: https://www.frontiersin.org/articles/10.3389/fsurg.2023.992936/full#supplementary-material.
References
1. Torre LA, Siegel RL, Ward EM, Jemal A. Global cancer incidence and mortality rates and trends–an update. Cancer Epidemiol Biomarkers Prev. (2016) 25(1):16–27. doi: 10.1158/1055-9965.EPI-15-0578
2. Siegel RL, Miller KD, Fuchs HE, Jemal A. Cancer statistics, 2021. CA Cancer J Clin. (2021) 71(1):7–33. doi: 10.3322/caac.21654
3. Bray F, Ferlay J, Soerjomataram I, Siegel RL, Torre LA, Jemal A. Global cancer statistics 2018: GLOBOCAN estimates of incidence and mortality worldwide for 36 cancers in 185 countries. CA Cancer J Clin. (2018) 68(6):394–424. doi: 10.3322/caac.21492
4. Shimabukuro-Vornhagen A, Böll B, Kochanek M, Azoulay É, von Bergwelt-Baildon MS. Critical care of patients with cancer. CA Cancer J Clin. (2016) 66(6):496–517. doi: 10.3322/caac.21351
5. Taccone FS, Artigas AA, Sprung CL, Moreno R, Sakr Y, Vincent JL. Characteristics and outcomes of cancer patients in European ICUs. Crit Care. (2009) 13(1):R15. doi: 10.1186/cc7713
6. Soares M, Salluh JI. Validation of the SAPS 3 admission prognostic model in patients with cancer in need of intensive care. Intensive Care Med. (2006) 32(11):1839–44. doi: 10.1007/s00134-006-0374-4
7. Epstein AS, Yang A, Colbert LE, Voigt LP, Meadows J, Goldberg JI, et al. Outcomes of ICU admission of patients with progressive metastatic gastrointestinal cancer. J Intensive Care Med. (2020) 35(3):297–302. doi: 10.1177/0885066617748874
8. Ha FJ, Weickhardt AJ, Parakh S, Vincent AD, Glassford NJ, Warrillow S, et al. Survival and functional outcomes of patients with metastatic solid organ cancer admitted to the intensive care unit of a tertiary centre. Crit Care Resusc. (2017) 19(2):159–66.28651512
9. Oud L. Critical illness in patients with metastatic cancer: a population-based cohort study of epidemiology and outcomes. J Invest Med. (2022) 70(3):820–8. doi: 10.1136/jim-2021-002032
10. Caruso P, Ferreira AC, Laurienzo CE, Titton LN, Terabe DS, Carnieli DS, et al. Short- and long-term survival of patients with metastatic solid cancer admitted to the intensive care unit: prognostic factors. Eur J Cancer Care (Engl). (2010) 19(2):260–6. doi: 10.1111/j.1365-2354.2008.01031.x
11. Cheng L, DeJesus AY, Rodriguez MA. Using laboratory test results at hospital admission to predict short-term survival in critically ill patients with metastatic or advanced cancer. J Pain Symptom Manage. (2017) 53(4):720–7. doi: 10.1016/j.jpainsymman.2016.11.008
12. Wang X, Cai J, Zeng Z, Liu A. Efficacy of osimertinib for preventing leptomeningeal metastasis derived from advanced EGFR-mutated non-small cell lung cancer: a propensity-matched retrospective study. BMC Cancer. (2021) 21(1):873. doi: 10.1186/s12885-021-08581-2
13. Kiluk JV, Prowler V, Lee MC, Khakpour N, Laronga C, Cox CE. Contralateral axillary nodal involvement from invasive breast cancer. Breast (Edinburgh, Scotland). (2014) 23(3):291–4. doi: 10.1016/j.breast.2014.03.004
14. Johnson AE, Pollard TJ, Shen L, Lehman LW, Feng M, Ghassemi M, et al. MIMIC-III, a freely accessible critical care database. Sci Data. (2016) 3:160035. doi: 10.1038/sdata.2016.35
15. Liu T, Zhao Q, Du B. Effects of high-flow oxygen therapy on patients with hypoxemia after extubation and predictors of reintubation: a retrospective study based on the MIMIC-IV database. BMC Pulm Med. (2021) 21(1):160. doi: 10.1186/s12890-021-01526-2
16. Wang R, Li J, Fang MJ, Dong D, Liang P, Gao JB. [The value of spectral CT-based radiomics in preoperative prediction of lymph node metastasis of advanced gastric cancer]. Zhonghua yi xue za zhi. (2020) 100(21):1617–22. doi: 10.3760/cma.j.cn112137-20191113-02468
17. Liebetrau C, Gaede L, Dörr O, Hoffmann J, Wolter JS, Weber M, et al. High-sensitivity cardiac troponin T and copeptin assays to improve diagnostic accuracy of exercise stress test in patients with suspected coronary artery disease. Eur J Prev Cardiol. (2015) 22(6):684–92. doi: 10.1177/2047487314529691
18. Soares M, Caruso P, Silva E, Teles JM, Lobo SM, Friedman G, et al. Characteristics and outcomes of patients with cancer requiring admission to intensive care units: a prospective multicenter study. Crit Care Med. (2010) 38(1):9–15. doi: 10.1097/CCM.0b013e3181c0349e
19. Mokart D, Lambert J, Schnell D, Fouché L, Rabbat A, Kouatchet A, et al. Delayed intensive care unit admission is associated with increased mortality in patients with cancer with acute respiratory failure. Leuk Lymphoma. (2013) 54(8):1724–9. doi: 10.3109/10428194.2012.753446
20. Park SY, Lim SY, Um SW, Koh WJ, Chung MP, Kim H, et al. Outcome and predictors of mortality in patients requiring invasive mechanical ventilation due to acute respiratory failure while undergoing ambulatory chemotherapy for solid cancers. Support Care Cancer. (2013) 21(6):1647–53. doi: 10.1007/s00520-012-1709-z
21. Miyashita F, Kinoshita T, Suzuki T, Asai T. Respiratory failure after open descending aortic aneurysm repair: risk factors and outcomes. Ann Thorac Cardiovasc Surg. (2021) 27(1):41–8. doi: 10.5761/atcs.oa.20-00020
22. Gorham J, Ameye L, Paesmans M, Berghmans T, Sculier JP, Meert AP. [Lung cancer: prognosis in intensive care depends mainly on the acute complication]. Rev Mal Respir. (2019) 36(3):333–41. doi: 10.1016/j.rmr.2018.05.014
23. Chopra S, Pednekar S, Karnik ND, Londhe C, Pandey D. A study of the outcome of critically ill elderly patients in a tertiary care hospital using SOFA score. Indian J Crit Care Med. (2021) 25(6):655–9. doi: 10.5005/jp-journals-10071-23883
24. Costa RT, Nassar AP Jr, Caruso P. Accuracy of SOFA, qSOFA, and SIRS scores for mortality in cancer patients admitted to an intensive care unit with suspected infection. J Crit Care. (2018) 45:52–7. doi: 10.1016/j.jcrc.2017.12.024
25. Potter M, Newport E, Morten KJ. The warburg effect: 80 years on. Biochem Soc Trans. (2016) 44(5):1499–505. doi: 10.1042/BST20160094
26. Ngo DC, Ververis K, Tortorella SM, Karagiannis TC. Introduction to the molecular basis of cancer metabolism and the Warburg effect. Mol Biol Rep. (2015) 42(4):819–23. doi: 10.1007/s11033-015-3857-y
27. Panay S, Ruiz C, Abarca M, Nervi B, Salazar I, Caro P, et al. Mortality of adult patients with cancer admitted to an intensive care unit in Chile: a prospective cohort study. J Glob Oncol. (2018) 4:1–9. doi: 10.1200/JGO.18.00091
28. Kurreck A, Heinemann V, von Weikersthal L F, Decker T, Kaiser F, Uhlig J, et al. Impact of age on efficacy and early mortality of initial sequential treatment versus upfront combination chemotherapy in patients with metastatic colorectal cancer: a subgroup analysis of a phase III trial (AIO KRK0110, XELAVIRI study). Eur J Cancer. (2020) 137:81–92. doi: 10.1016/j.ejca.2020.06.010
29. Rumpold H, Niedersüß-Beke D, Heiler C, Falch D, Wundsam HV, Metz-Gercek S, et al. Prediction of mortality in metastatic colorectal cancer in a real-life population: a multicenter explorative analysis. BMC Cancer. (2020) 20(1):1149. doi: 10.1186/s12885-020-07656-w
30. Li Y, Li Z, Zhang G. Clinical utility of red blood cell distribution width for the diagnosis and prognosis of cervical cancer. Int J Gen Med. (2022) 15:2597–606. doi: 10.2147/IJGM.S354569
31. Ma W, Mao S, Bao M, Wu Y, Guo Y, Liu J, et al. Prognostic significance of red cell distribution width in bladder cancer. Transl Androl Urol. (2020) 9(2):295–302. doi: 10.21037/tau.2020.03.08
32. Fava C, Cattazzo F, Hu ZD, Lippi G, Montagnana M. The role of red blood cell distribution width (RDW) in cardiovascular risk assessment: useful or hype? Ann Transl Med. (2019) 7(20):581. doi: 10.21037/atm.2019.09.58
33. Mohindra R, Mishra U, Mathew R, Negi NS. Red cell distribution width (RDW) index as a predictor of severity of acute ischemic stroke: a correlation study. Adv J Emerg Med. (2020) 4(2):e24. doi: 10.22114/ajem.v0i0.257
Keywords: nomogram, in-hospital mortality, intensive care unit, metastatic cancer, MIMIC-III
Citation: Wu M and Gao H (2023) A prediction model for in-hospital mortality in intensive care unit patients with metastatic cancer. Front. Surg. 10:992936. doi: 10.3389/fsurg.2023.992936
Received: 13 July 2022; Accepted: 2 January 2023;
Published: 30 January 2023.
Edited by:
Min-Ying Lydia Su, University of California, Irvine, United StatesReviewed by:
Jenna Reps, Janssen Pharmaceuticals, Inc., United StatesJames Orwa, Aga Khan University (Kenya), Kenya
© 2023 Wu and Gao. This is an open-access article distributed under the terms of the Creative Commons Attribution License (CC BY). The use, distribution or reproduction in other forums is permitted, provided the original author(s) and the copyright owner(s) are credited and that the original publication in this journal is cited, in accordance with accepted academic practice. No use, distribution or reproduction is permitted which does not comply with these terms.
*Correspondence: Meizhen Wu d3VtZWl6aGVuLWljdUBvdXRsb29rLmNvbQ==
Specialty Section: This article was submitted to Surgical Oncology, a section of the journal Frontiers in Surgery