 Jafar Khosravian1Salman Qureshi2*Sajedeh Rostamzadeh3
 Bahare Moradi4Parisa Derakhshesh5Samin Yousefi6Keyvan Jamali6Reyhaneh Ahmadi7
 Fatemeh Nickravesh6
- 1Department of Remote Sensing and GIS, Faculty of Geography, University of Tehran, Tehran, Iran
- 2Institute of Geography (Landscape Ecology), Humboldt University of Berlin, Berlin, Germany
- 3Department of Environmental Planning, Faculty of Environment, University of Tehran, Tehran, Iran
- 4Department of Urban Planning & Design, Faculty of Art and Architecture, Tarbiat Modares University, Tehran, Iran
- 5Department of Urban Design, Faculty of Engineering, North Tehran Branch, Islamic Azad University, Tehran, Iran
- 6Department of Human Geography, Faculty of Geography, University of Tehran, Tehran, Iran
- 7Department of Regional and City Planning, Faculty of Christopher C. Gibbs’s College of Architecture, University of Oklahoma, Norman, OK, United States
Shopping centers are among the major economic and commercial places in cities in terms of social function, urban sustainability, environment, etc. Therefore, it is crucial to determine suitable locations for building new shopping centers. In this regard, urban vacant lands can be considered as high-potential locations to transform the urban landscape and enhance socio-economic development. The main purpose of this study is to assess the potential of urban vacant lands based on a spatial multi-criteria decision-making (SMCDM) system for building shopping centers in 22 districts of Tehran. In this study, first, 16 effective spatial criteria for locating the new shopping centers were identified using expert opinions and a literature review. The best-worst method (BWM) and the Min/Max method were used to calculate the weight and standardized values of each criterion. Then, the ordered weighted averaging (OWA) method was used to prepare a potential map of urban vacant lands for the construction of a shopping center under different decision-making scenarios, including very optimistic, optimistic, intermediate, pessimistic, and very pessimistic. Finally, the spatial distribution of potential locations in the 22 districts of Tehran was investigated. The results showed that among the different criteria, the distance from the highway networks and distance from public transportation stations had the most weight, whereas the distance from fault and distance from stream networks had the least weight. The number of vacant lands with a very high potential for building a shopping center in Tehran based on very pessimistic, pessimistic, intermediate, optimistic and very optimistic scenarios was obtained at 29, 95, 105, 122, and 224, respectively. An increase in the degree of optimism in the attitude of decision-makers or investors increased the number of available options in the very high potential category. Under all scenarios, all vacant lands in 10 of Tehran’s 22 districts with very high potential for building shopping centers. The results of the proposed model in this study can be useful and practical for a wide range of planners, decision-makers, and investors with different mental attitudes and risk tolerance. Close attention to these results can contribute to achieving sustainable urban development.
1 Introduction
In today’s world, cities are rapidly changing and evolving due to the constant population growth and diverse social and economic needs (Nadizadeh Shorabeh et al., 2020; Mansourihanis et al., 2023). One driving force behind these changes is the creation and development of shopping centers as major economic and social hubs (Burayidi and Yoo, 2021). The increase in demand for services and goods has highlighted the need for shopping centers that can handle the ever-increasing population as an urban development priority (Arif et al., 2021). Also, easy access to facilities and infrastructure is one of the priorities in order to achieve a smart city. However, creating suitable shopping centers in cities faces many challenges. One such challenge is location selection. Selecting a suitable location requires close attention to public needs, optimization of land use (Kordi and Yousefi, 2022), easy and convenient access, economic justification, and harmony with other urban components (Mohamad et al., 2015). Vacant lands in the city are among the first and foremost options available for building shopping centers.
Vacant lands are areas that have not yet been developed and have no buildings, which are considered critical and strategic assets in urban planning (Mohamad Selamat et al., 2023). Their unique importance can be emphasized in two ways. On the one hand, vacant lands are limited resources in terms of area in urban environments. Population growth and urban development make it necessary to take the most advantage of these resources (Song et al., 2020). On the other hand, vacant lands are considered potential places for transforming the urban landscape, boosting economic development, and creating public and social spaces (Mao et al., 2022). With the help of proper planning, these lands can be turned into facilities and urban structures such as shopping centers, entertainment centers, and green spaces, with major positive effects on the quality of life of citizens and the sustainable development of the city (Wesener, 2015; Kim et al., 2020). Therefore, it is crucial to analyze the suitability of these lands for various uses, including the construction of shopping centers.
The suitability of urban vacant lands for building a shopping center is determined by various factors such as access and traffic (McClintock et al., 2013), population and regional needs (Pearsall et al., 2014), economy and market (López et al., 2021), infrastructural and spatial observations (Kirnbauer and Baetz, 2014), environmental effects (Branas et al., 2018), urban development strategies (Kim, 2016), and sustainability in the face of natural hazards (Gaillard, 2007). Hence, these factors must be taken into account when investigating the suitability of vacant lands. In general, assessing the suitability of vacant lands for the construction of a shopping center is a multi-criteria and spatial issue. In previous studies, it was shown that spatial multi-criteria decision-making (SMCDM) along with geographic information system (GIS) are powerful tools for making different decisions in the urban environment by considering different criteria (Afsari et al., 2022, 2023; Shahpari Sani et al., 2022; Ali et al., 2023). By combining various spatial criteria, these systems provide the possibility to analyze, evaluate, and select suitable locations for urban projects (Dutta et al., 2023). So far, many GIS-SMCDM models have been used to select suitable locations for building shopping centers. For example, Erdin and Akbaş (2019) used the Fuzzy TOPSIS model to determine suitable locations for building shopping centers in Turkey. Ghorui et al. (2020) used the AHP-TOPSIS model to select an optimal location for a shopping mall in and around the city of Kolkata, West Bengal, India. Deb (2012) used the fuzzy AHP model to select suitable locations for the construction of a shopping center from the point of view of customers. Önüt et al. (2010) proposed a combined GIS-SMCDM method to determine the optimal areas for building a shopping center. They used Fuzzy AHP to allocate criteria weights and Fuzzy TOPSIS to determine the most suitable location. In summary, GIS-SMCDM-based systems evaluate criteria and select optimal locations using the analytical methods presented in Table 1.
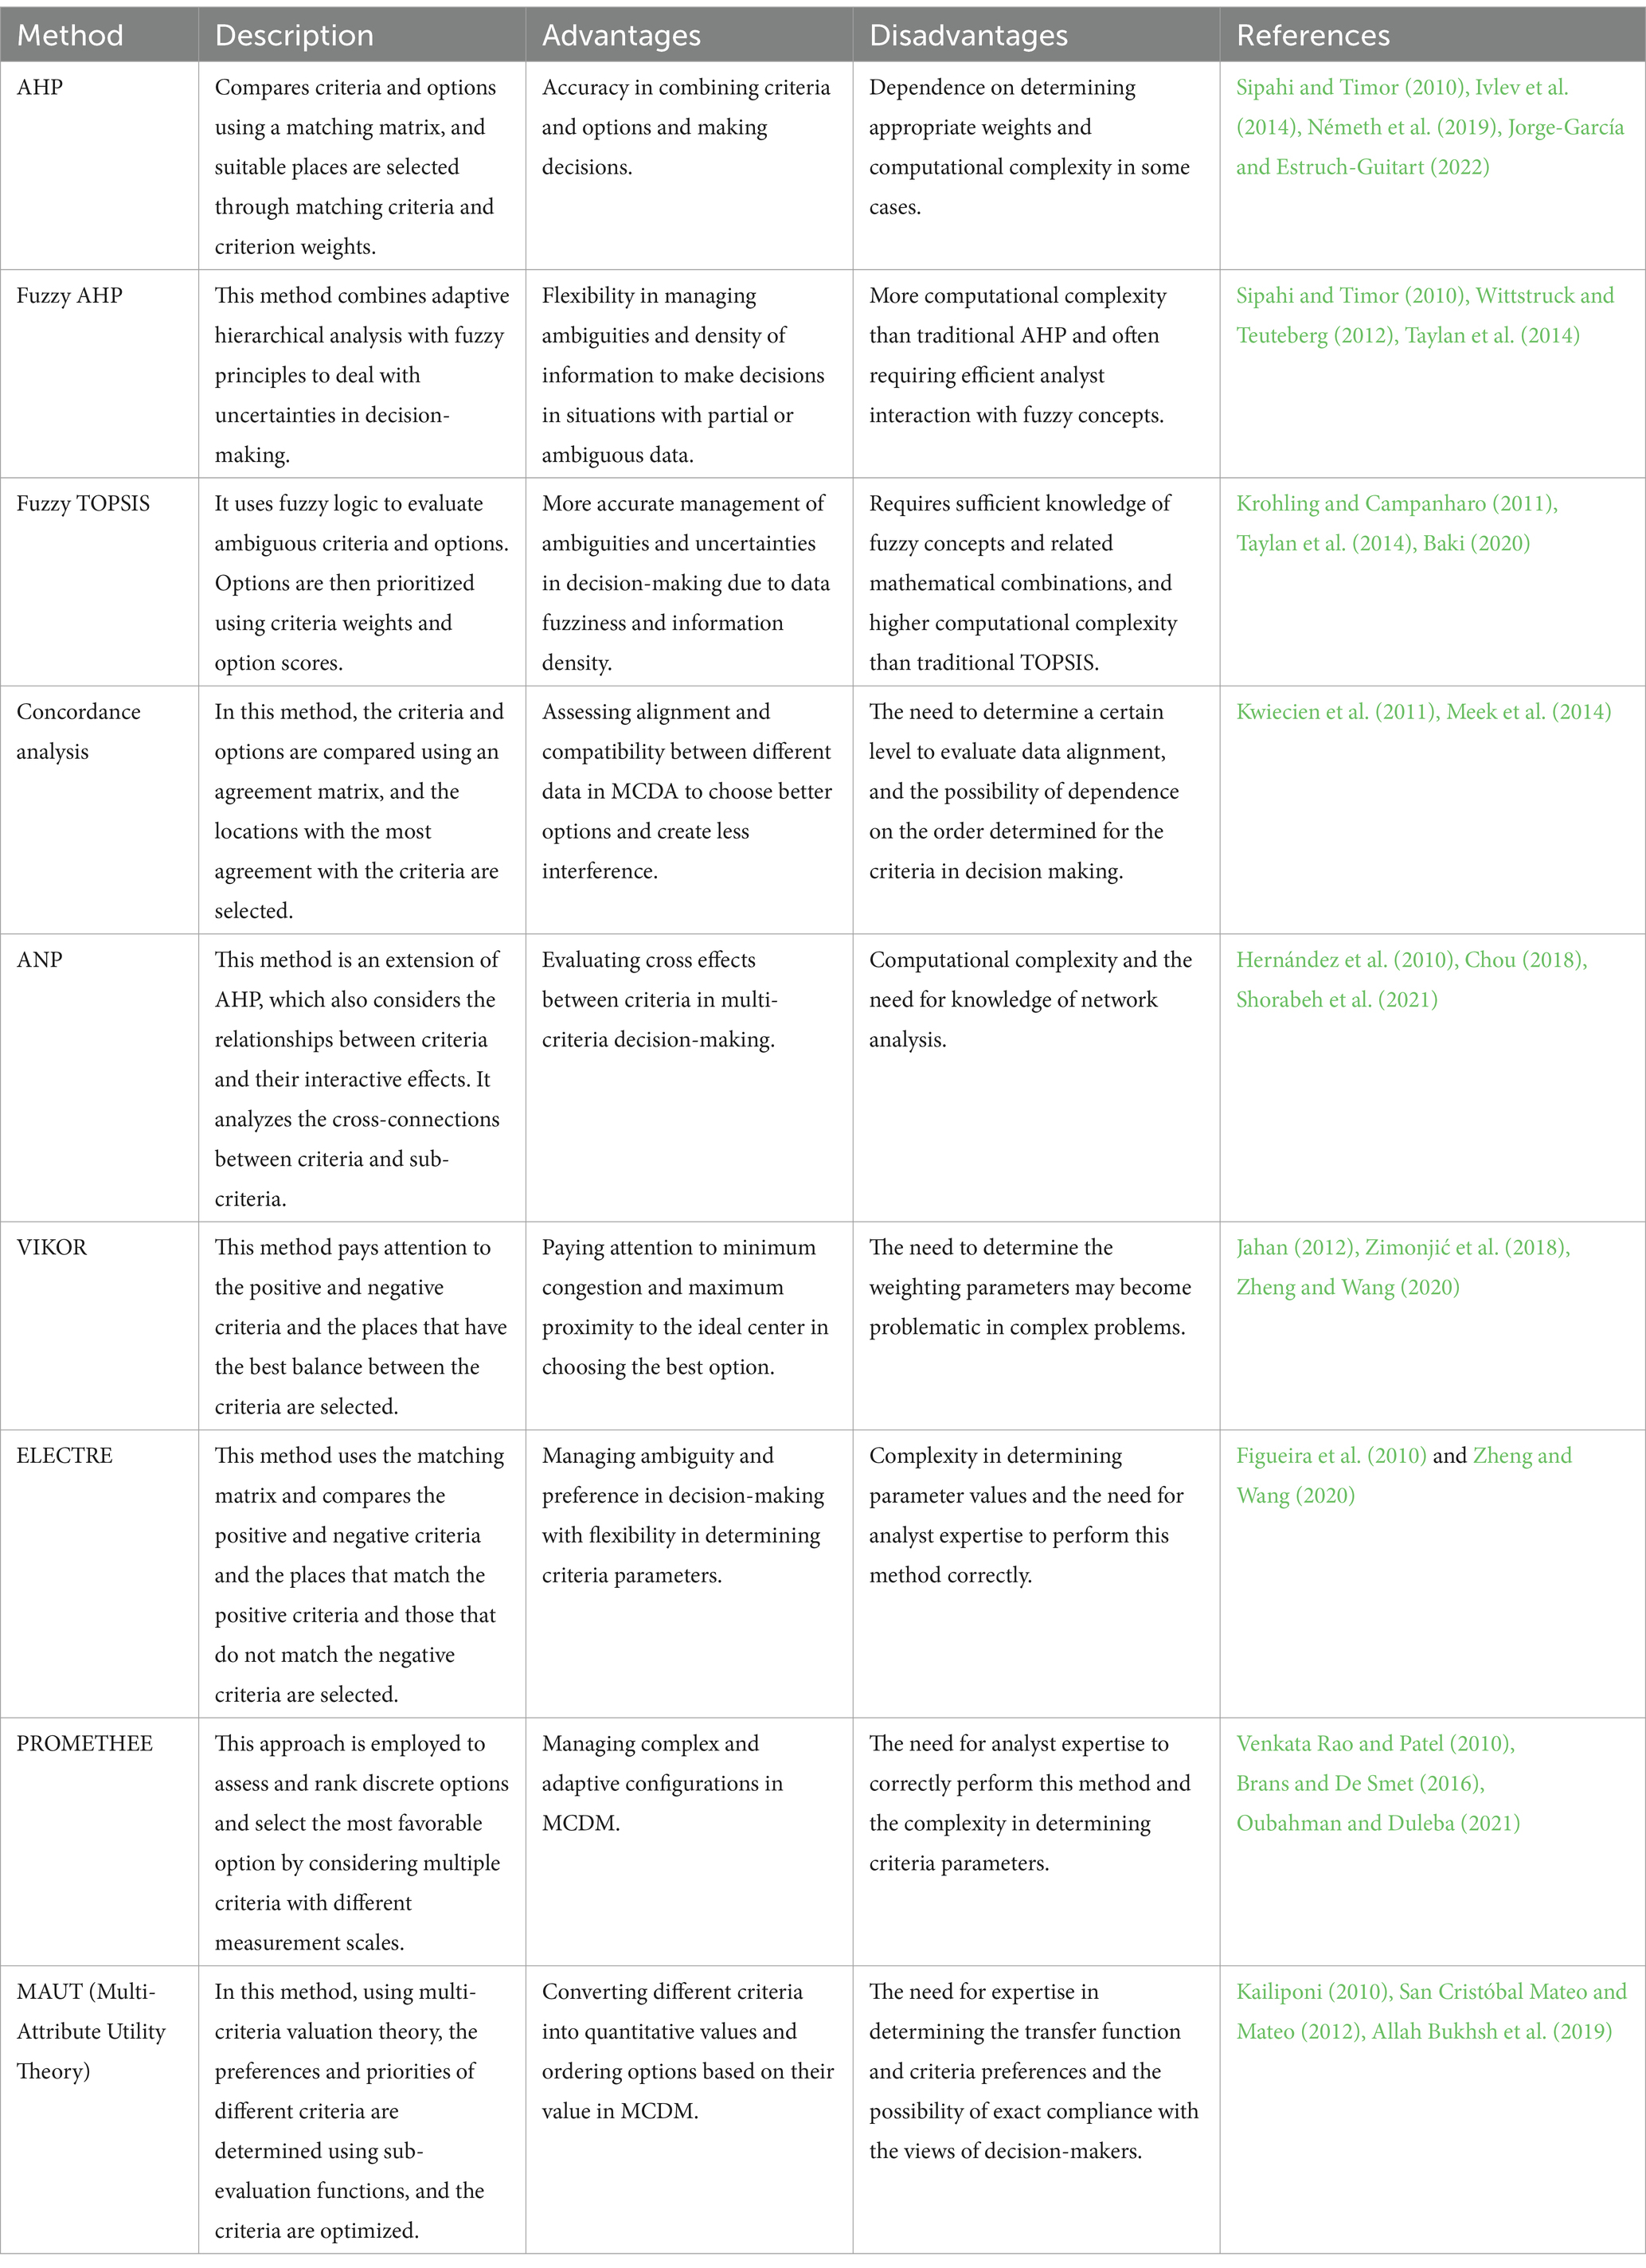
Table 1. Analytical methods used in GIS-SMCDM to evaluate criteria and select optimal locations.
Attitudes of decision-makers can be effective in determining optimal locations for building shopping centers. Decision-makers have different attitudes in terms of risk tolerance, including a wide range of very optimistic to very pessimistic. The models used in previous studies to select the optimal locations for the construction of the shopping center did not consider the attitude of the investors. The Ordered Weighted Averaging (OWA) model is an efficient method for SMCDM which accounts for the investor risk attitudes. The OWA model is more accurate in being flexible and adapting to individual preferences, which helps decision-makers select the best locations according to their views. This model can also cope with uncertainty in data and evaluations while accounting for their effects. In short, this model offers the potential to enhance decision-making quality and optimize location selection thanks to its flexibility, capacity to handle ambiguities, and adaptability to individual preferences.
Therefore, the main purpose of this study is to assess the potential of urban vacant lands based on a spatial multi-criteria decision-making (SMCDM) system for building a shopping center in 22 districts of Tehran. Contributions of this research include (1) the emphasis on vacant lands as manageable areas in the field of urban development, including the construction of a shopping center and (2) using the OWA model to produce potential maps of vacant lands, taking into account the attitudes of decision-makers and investors.
2 Materials and methods
2.1 Study area
Tehran is the largest city and capital of Iran and the capital of Tehran province with a population of 9,162,550 people and an area of 730 km2. The city covers the altitudes 35°36′ to 35°44′ N and longitudes 51°17′ to 51°33′ E. It is located in the north of Iran to the south of the Alborz mountain range, 112 km south of the Caspian Sea. Tehran is the 38th most populated capital in the world and the 24th largest city in the world. The city has a dense network of highways and seven active subway lines that move more than 2.5 million passengers on average every day (Figure 1).
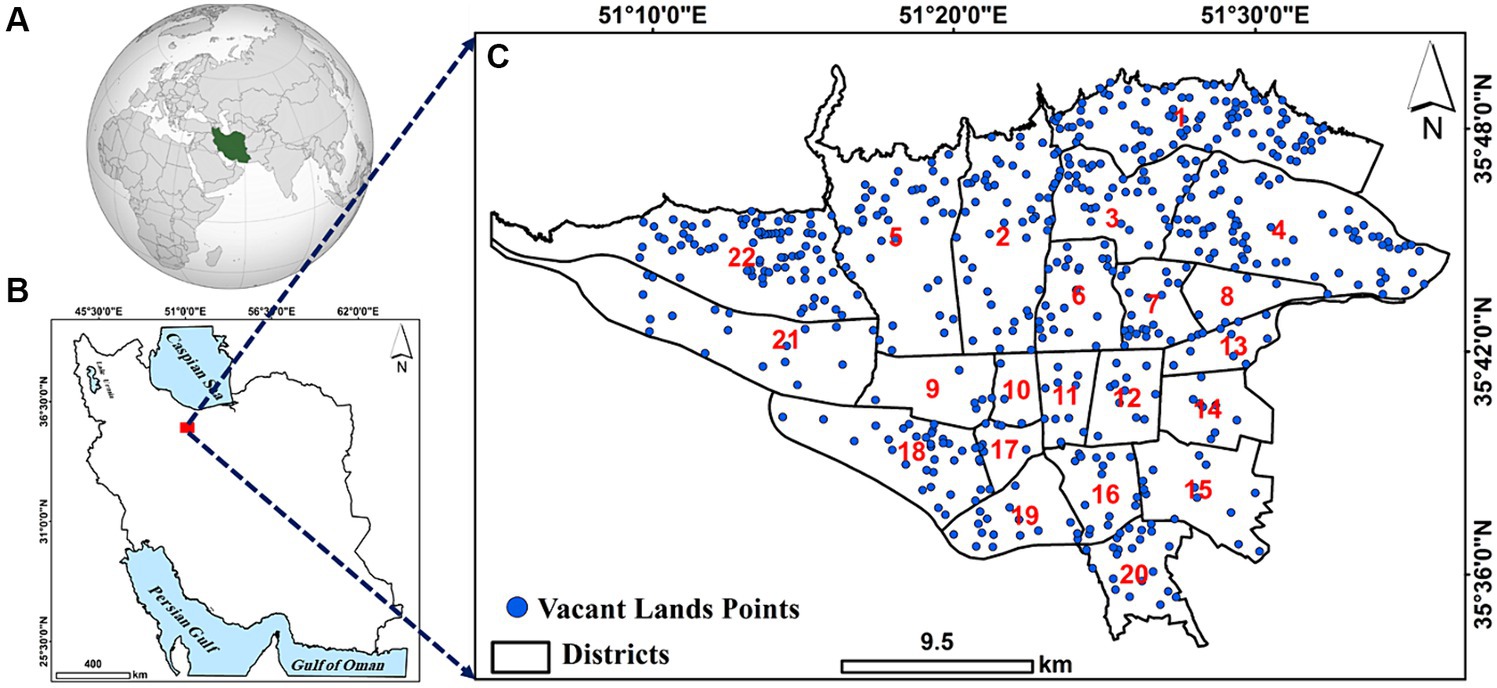
Figure 1. (A) Iran’s position in the world; (B) location of Tehran in Iran; and (C) location of vacant lands points in Tehran districts.
According to the statistics of 2016, Tehran’s share in the total gross domestic product of Iran is 27%, and it plays an important role in Iran’s economy by allocating half of the country’s industrial sector to itself. In addition, this city accounts for about 20% of the country’s population, 24% of value-added in the industry sector, and 38% of the service sector in the entire country. Therefore, determining suitable areas for the construction of a shopping center is of great importance in this city. Population growth, heavy traffic and population density are important factors in decision-making the location of shopping centers in Tehran. Also, different districts of Tehran city have different characteristics in terms of residential density, commercial density and access to transportation. All these factors have made vacant lands become valuable assets and strategic locations with inherent potentials for urban development. Tehran is divided into 22 districts, 134 regions, and 376 neighborhoods. The total number of vacant lands considered for this study is 591. These vacant lands are considered as proposed places for building commercial centers on the urban land use map prepared by Tehran Municipality. Some characteristics of Tehran’s urban areas are shown in Table 2.
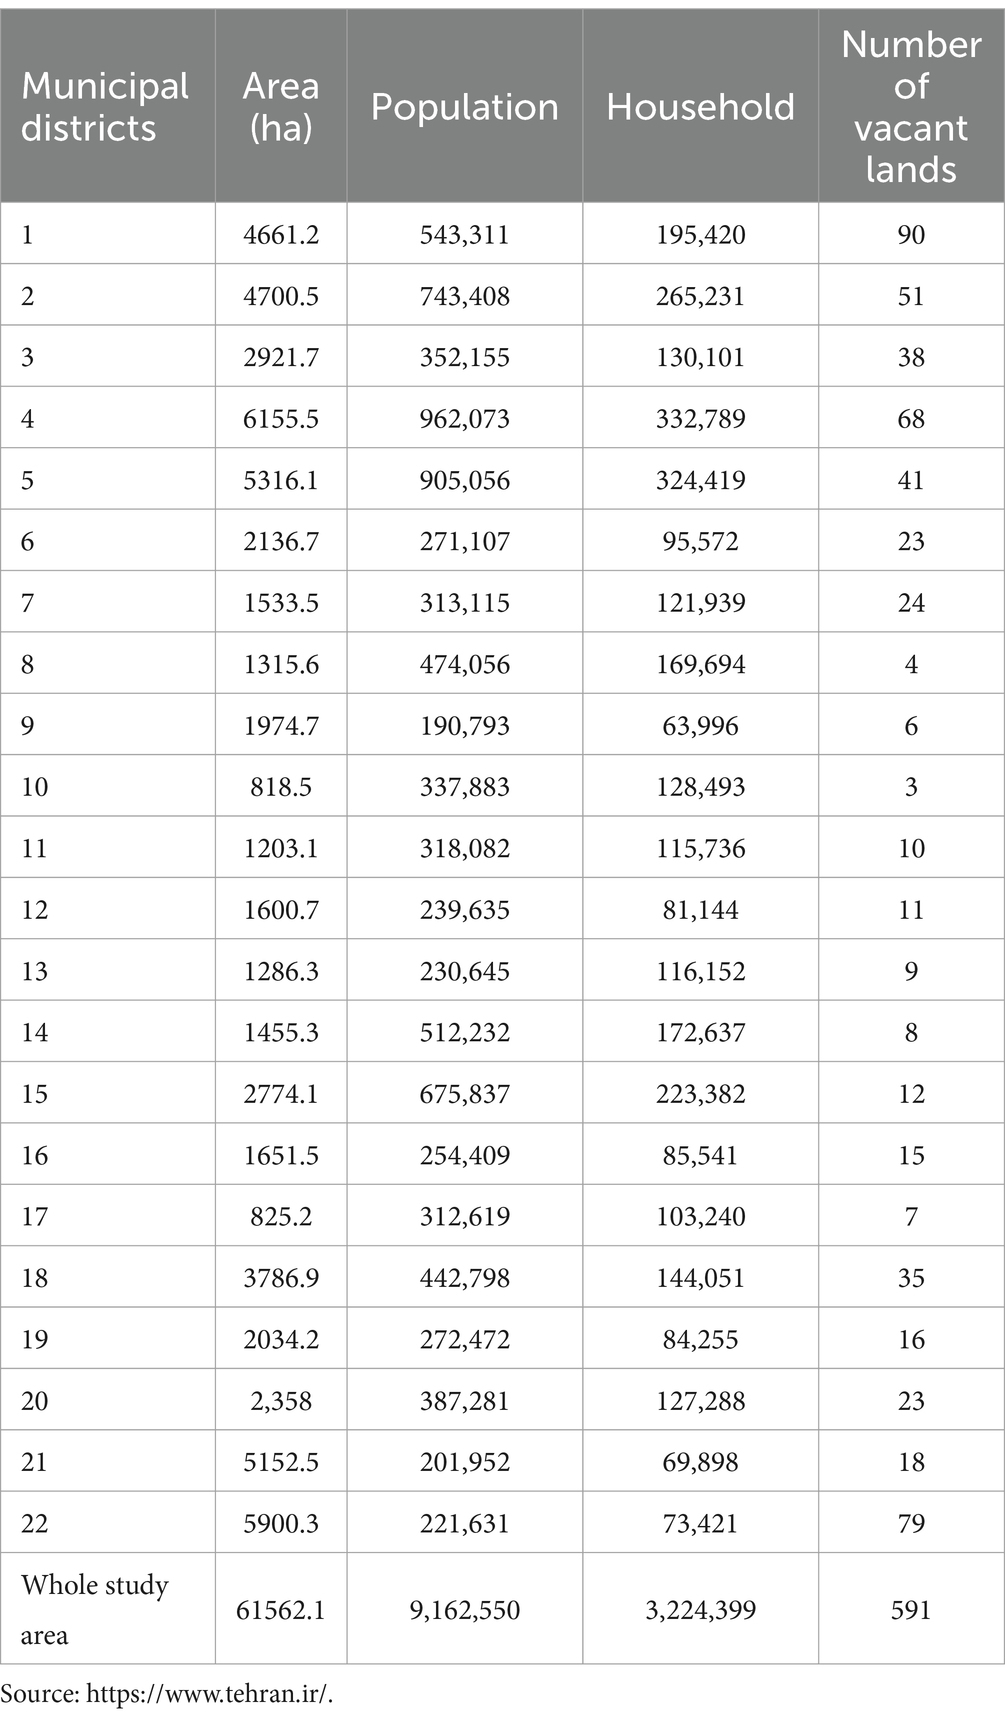
Table 2. Characteristics of urban areas of Tehran.
2.2 Research data
The research data included datasets that have a spatial nature. These consisted of two groups: remote sensing data (i.e., slope raster data) and data collected from related organizations [i.e., vector data on highway networks, public transportation stations, existing shopping centers, land price, rental rate, entertainment and tourist centers, per-capita income, service centers, fault lines, stream networks, traffic and air pollution plan, population density, parks, central business district (CBD) and crowded centers]. The geographic locations of vacant lands suitable (e.g., legally) for building a shopping center were sourced from Tehran Municipality. The data specifications are presented in Table 3. Finally, after collecting the primary data layers, spatial analysis was conducted in QGIS to produce and analyze the information layers and prepare the criteria map considering their capabilities at each stage. IDRISI was used to prepare shopping mall potential maps under different scenarios.
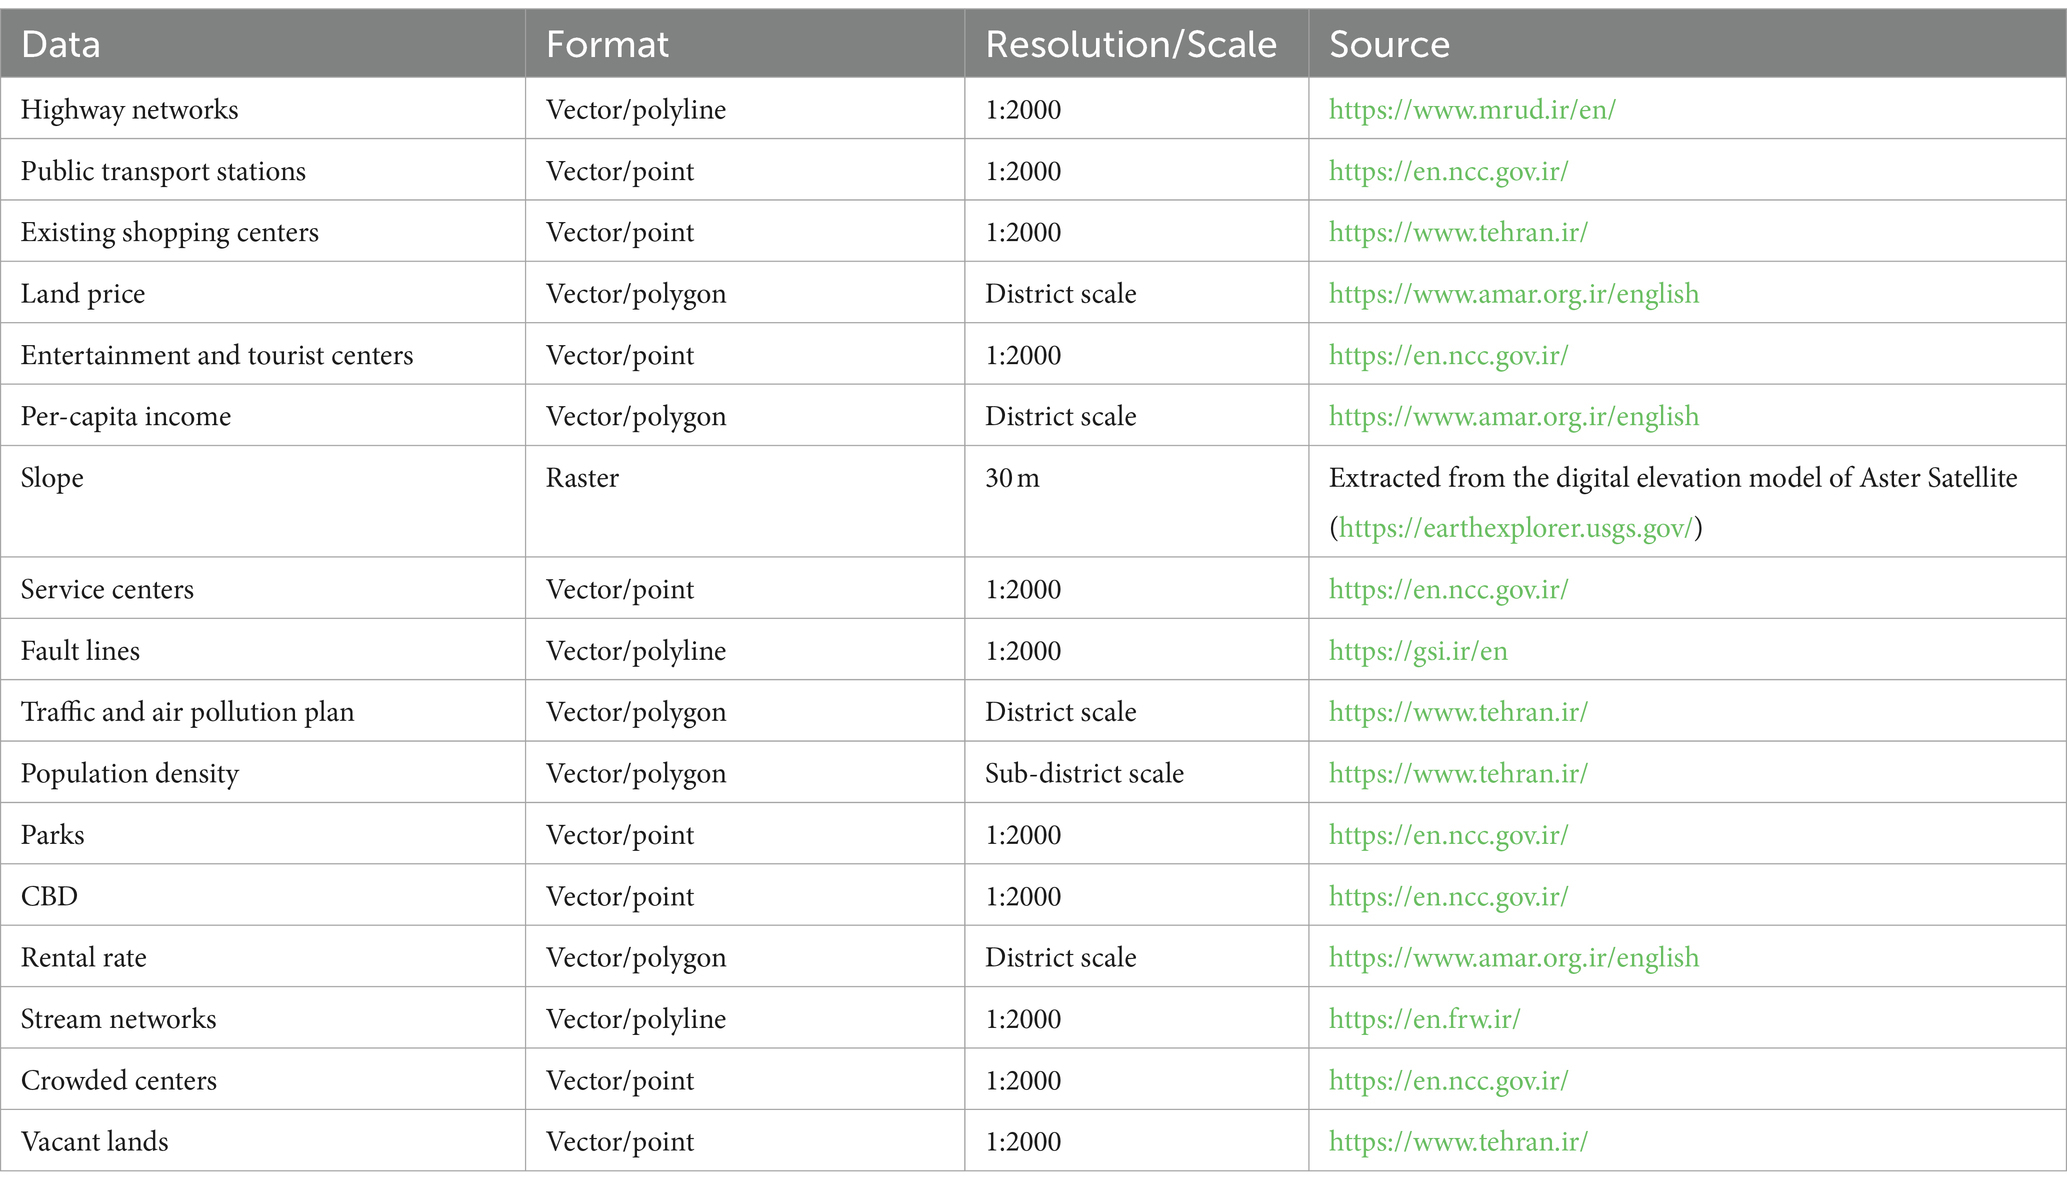
Table 3. Research data.
2.3 Methodology
Figure 2 shows the main steps of the research method (five main steps). (1) At this stage, by using expert opinions, library sources, and previous studies, the effective criteria for building shopping centers were identified and the necessary data was collected to create a spatial database. (2) The second stage involved pre-processing operations (to unify the coordinate system of the layers) and spatial analysis in GIS (to prepare criteria maps). (3) At this stage, the data were standardized to allow for direct comparison of different units. Then, the weight and importance of the criteria were calculated using the BWM method. (4) At this stage, benchmark maps and their weights were introduced as input to the OWA model, and a potential map was created for the construction of shopping centers in the study area. (5) At this stage, the number of shopping centers in 22 districts of Tehran was determined. (6) Finally, to evaluate the results obtained from the OWA model in measuring the potential of building shopping centers and determining the best scenario, the opinions of the stakeholders were used from the obtained map.
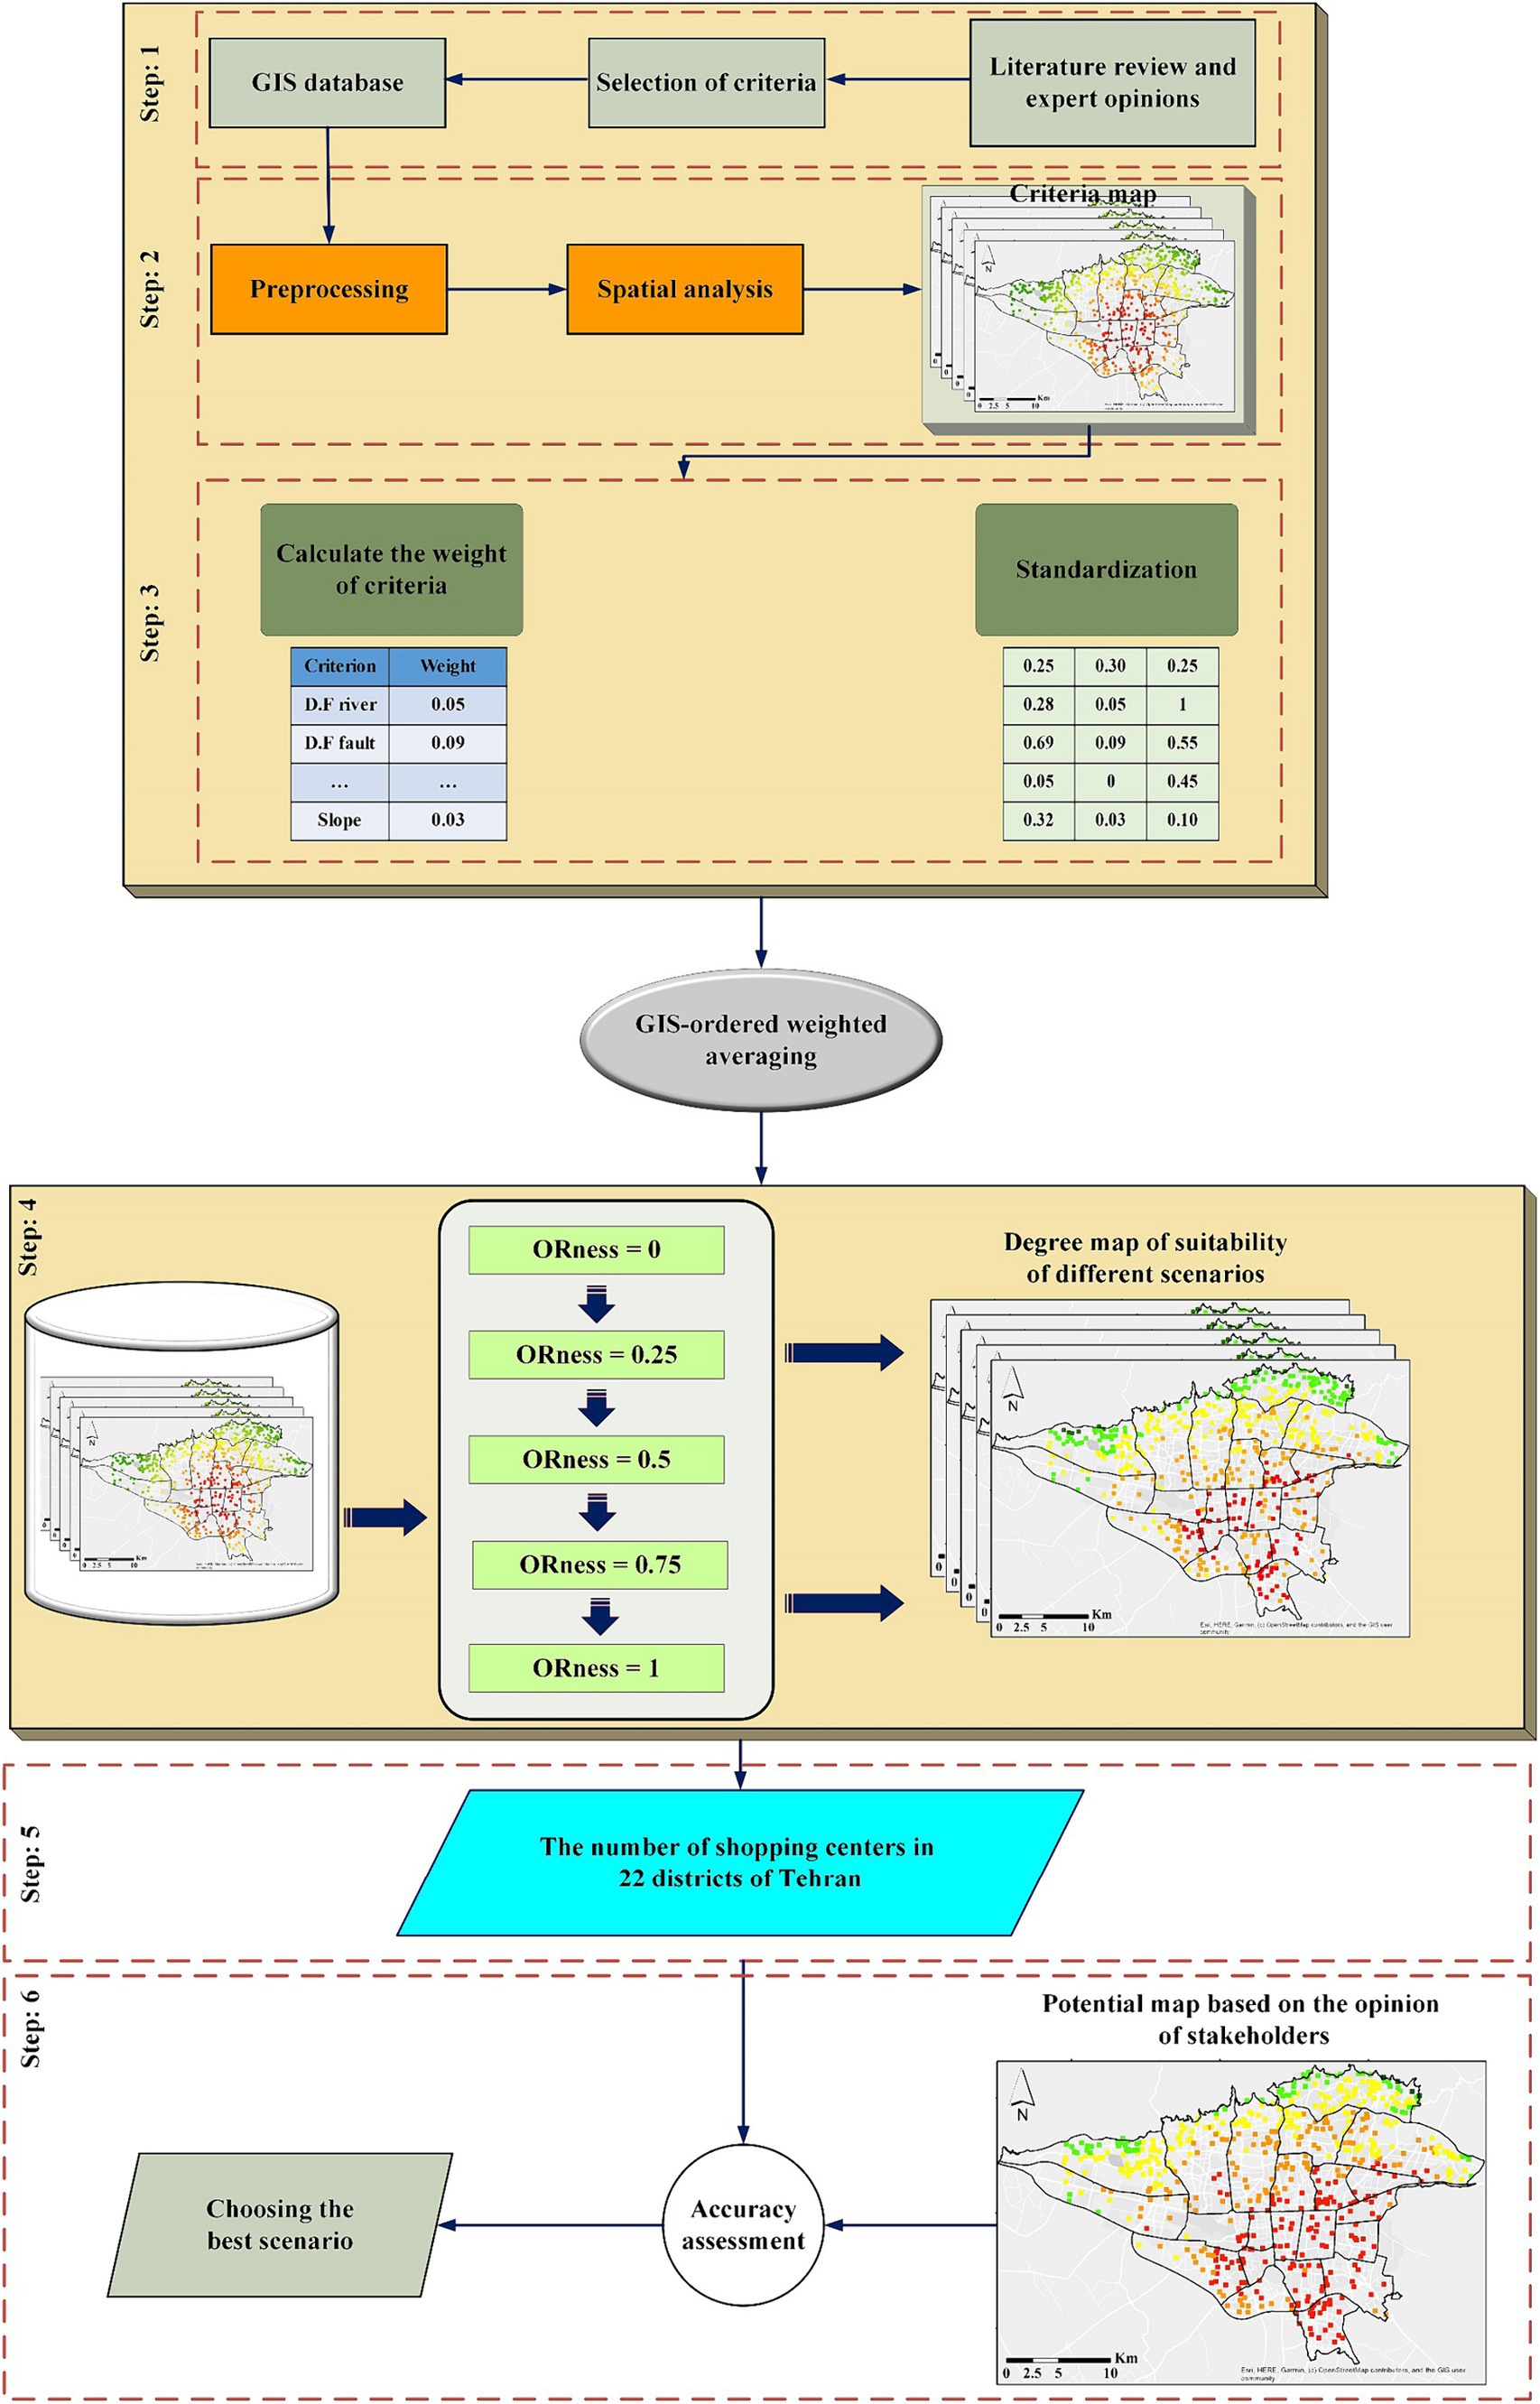
Figure 2. Flowchart of the main research steps.
2.3.1 Criteria used
Various criteria are involved in measuring the potential of urban vacant lands for the construction of a shopping center, meaning that it is a multi-criteria decision-making process. Therefore, 16 spatial criteria were identified based on the conditions of the study area, library sources, expert opinions, and previous studies. Table 4 provides a description of each criterion and how to extract it.
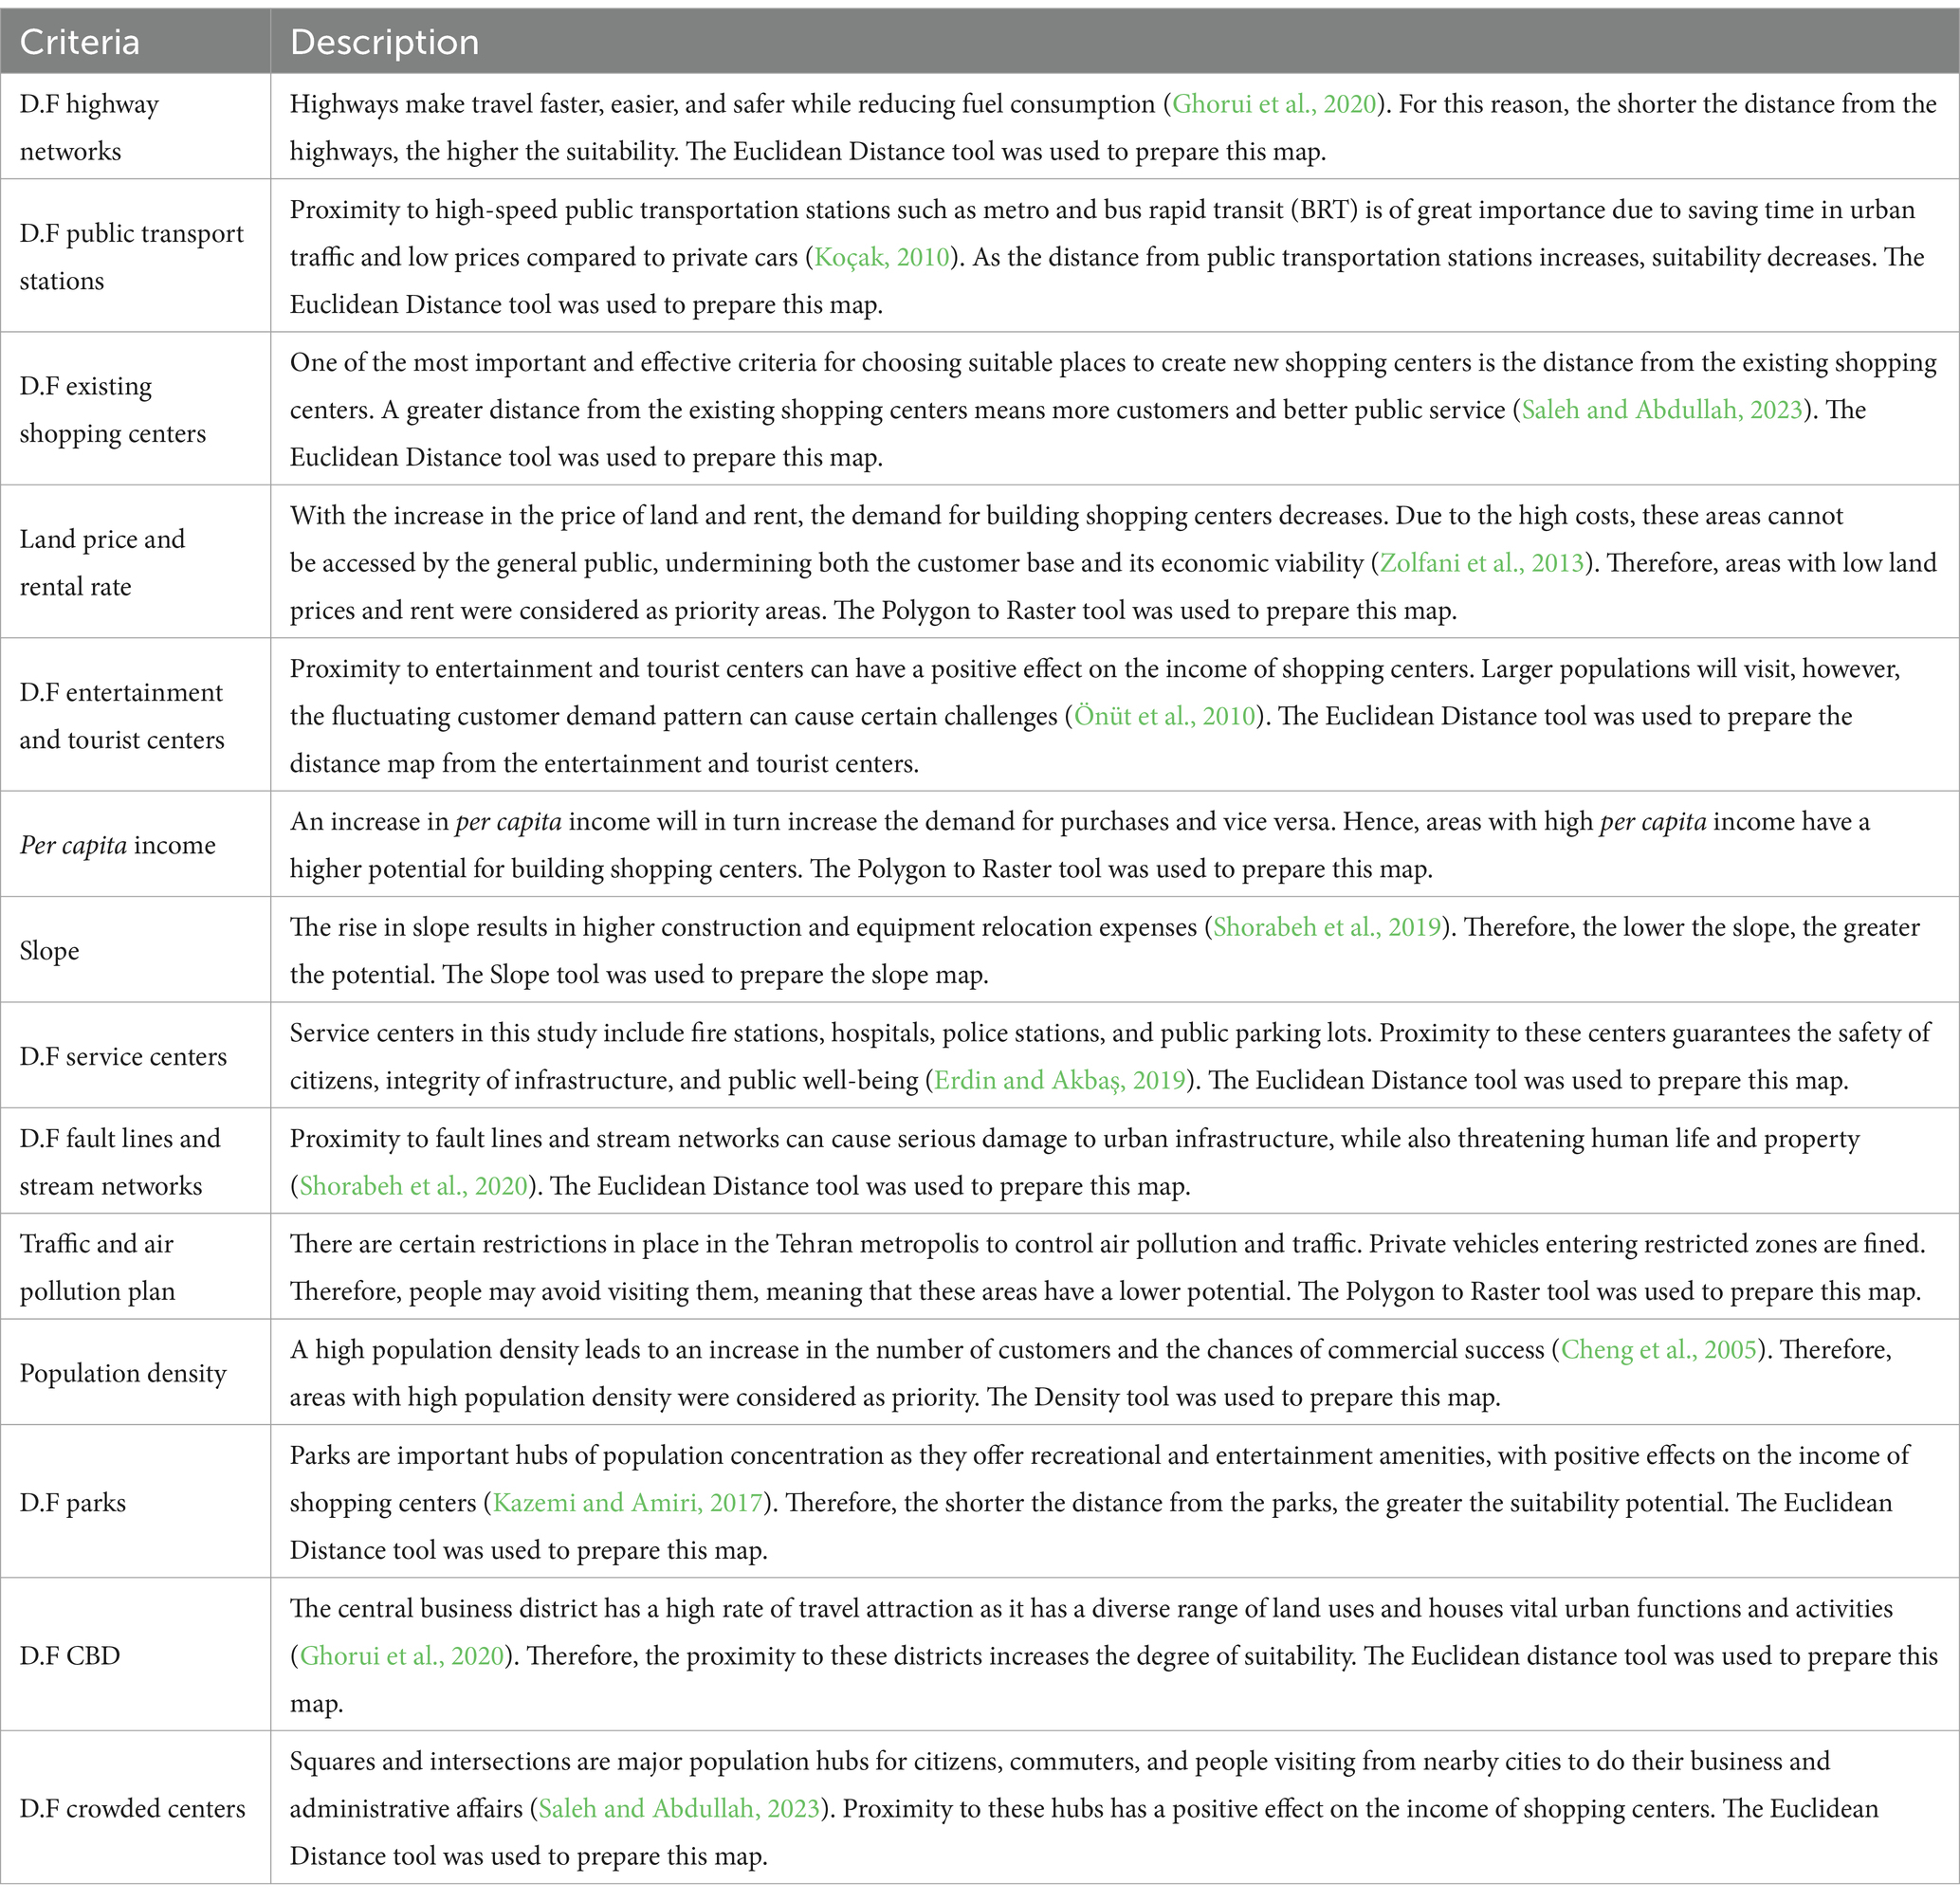
Table 4. Description of the research criteria.
2.3.2 Standardization of criteria
Data standardization, also known as data de-scaling, is a method to change a diverse range of variable values into a uniform scale (Luo et al., 2023). In other words, a data explorer may encounter situations where the features in the data include values that are in different ranges or domains. Features with large values may have a much greater effect on the cost function than those with smaller values. This problem will be solved by standardizing the features so that their values are on a similar scale. After standardization, the values of all criteria fall into a 0–1 range. The values 1 and 0 in the criteria have different meanings. For example, in the criteria of distance from highway networks and distance from parks, 1 indicates areas with very low potential, whereas 0 indicates areas with very high potential for building shopping centers. In other words, by reducing the distance, the number of potential areas for building shopping centers increases. On the other hand, in the criteria of distance from the stream network and distance from fault lines, 1 indicates areas with very high potential and 0 indicates areas with very low potential. In other words, as the distance increases, the potential areas for building shopping centers increase. Therefore, Equation (1) is used for the first type criteria, and Equation (2) is used for the second type criteria.
Where, is the standardized score for the ith decision alternative and the jth criterion, and are, respectively, the minimum and maximum values of score importance, and is the score of the criterion (Wang et al., 2011).
2.3.3 Best-worst method
The best-worst method, as a multi-criteria decision-making method, was used here to calculate the weight and importance of criteria. In MCDM methods, criteria are evaluated to choose the best option (Taherdoost and Madanchian, 2023). Based on the best-worst method presented by Rezaei (2015), the best (most important, most desirable) and worst (least important, most undesirable) criteria are determined by the decision maker. Then pairwise comparisons are made between each of these criteria with other criteria. The advantages of this method compared to previous similar methods are: (1) it requires less comparative data and (2) this method leads to a more stable comparison; i.e., more reliable answers (Rezaei, 2016).
In this method, after determining the criteria and the best and worst options, the preference of the best criteria over other criteria and the preference of the other criteria over the worst criteria is determined using a Saaty (2004) scale. The result will be the two vectors and . Where, indicates the preference of the best criterion over the jth criterion and indicates the preference of the j criterion over the worst criterion. Then, the optimal weight of the criteria is calculated based on Equation (3):
By solving this equation, the optimal weights and which represent the incompatibility ratio are obtained (Gigović et al., 2019). The closer the inconsistency value is to zero, the higher the compatibility of the criteria pairwise comparisons (Karakuş, 2023).
2.3.4 Potential mapping
The OWA method was used to prepare a potential map of urban vacant lands for the construction of a shopping center due to its greater flexibility and power in the decision-making space. This method, presented by Yager (1988), combines a weighted sum with the prioritization of evaluation criteria, thus considering both criteria weights and their prioritization (Malczewski, 2006). The prioritization of weights enables the direct control of the criteria. This method can calculate investor risk tolerance and use it in choosing the final option (Firozjaei et al., 2019), leading to a continuous ranking of scenarios between the risk-averse (intersect) operator and the risk-taking (union) operator (Malczewski et al., 2003). It can be said that the OWA method is a relatively new combination that is similar to the WLC method but includes two sets of weights (Malczewski, 2004). The advantage of the OWA method is that the researcher can create a wide range of predictions and scenarios by sorting and changing the parameters of each criterion (Boloorani et al., 2021).
The OWA method includes two groups of criteria weights and order weights. Criterion weights are given by considering the decision maker’s preference for a certain criterion or feature in the study area (Malcezewski, 2006). This is because the relative importance of that criterion is determined compared to other existing criteria, but order weights are assigned based on the location of cells of layers and maps (Xu, 2005). Therefore, all the cells of a map have a common criterion weight, but their order weight is different. The OWA method can produce results very similar to those of AND, OR, and WLC operators. Because these methods are a subset of OWA. The final states of this method are shown by AND and OR operators and are related to MIN and MAX operators, respectively (Malczewski et al., 2003). In the first case, the highest value is given to the largest value of the criteria. This optimistic approach has maximum risk tolerance and no trade-off (Mahmood et al., 2023). On the other hand, the highest value is given to the lowest criterion (i.e., pessimistic approach with minimal risk) (Zhang et al., 2021), which has no trade-off. Meanwhile, there are a large number of criteria sets with different degrees of trade-off. More details of the OWA method are provided in Shorabeh et al. (2019).
In the OWA method, a factor called ORness determines the degree of risk in decision making. Its value range is between 0 and 1. In this study, potential maps were prepared in 5 different scenarios including ORness = 0 (very pessimistic), ORness = 0.25 (pessimistic), ORness = 0.5 (intermediate), ORness = 0.75 (optimistic) and ORness = 1 (very optimistic). The values of the potential maps obtained from these scenarios vary between 0 and 1. Value 0 represents the lowest and value 1 represents the highest potential for building shopping centers. Finally, the maps obtained from different scenarios were classified into five classes, very low (0–0.2), low (0.2–0.4), medium (0.4–0.6), high (0.6–0.8), and very high (0.8–1), based on the degree of potential.
2.3.5 Accuracy assessment
The evaluation of the results obtained from the OWA model was used to assess the potential of building shopping centers and determine the best scenario from the opinions of stakeholders including 50 investors. Based on this, the weight of the effective criteria on choosing the right location of shopping centers was determined by the stakeholders. Then, based on the weighted linear combination model, the weight and standardized values of the criteria were combined with each other. In the next step, a classification map of the potential of building shopping centers including very low (0–0.2), low (0.2–0.4), medium (0.4–0.6), high (0.6–0.8), and very high (0.8–1) classes were prepared. Finally, the spatial compatibility of the areas classified as very high potential in different scenarios of the OWA model and the stakeholder map was investigated. For this purpose, overall spatial accuracy and prediction rate metrics were calculated for each scenario.
3 Results
The calculated weights for the criteria based on BWM are shown in Figure 3. Distance from highway networks (0.108), distance from transportation stations (0.105), population density (0.09), rental rate (0.085), and distance from existing shopping centers (0.08) had higher weights than other criteria. Moreover, distance from faults and distance from stream networks had the least weight in determining land suitability. The average weights of access, economic-social, and natural-environmental groups were 0.071, 0.065, and 0.036, respectively. The importance of access group criteria was higher than other criteria. The consistency rate in the BWM model was less than 0.01, which indicates the high consistency of expert opinions in determining criteria weights.
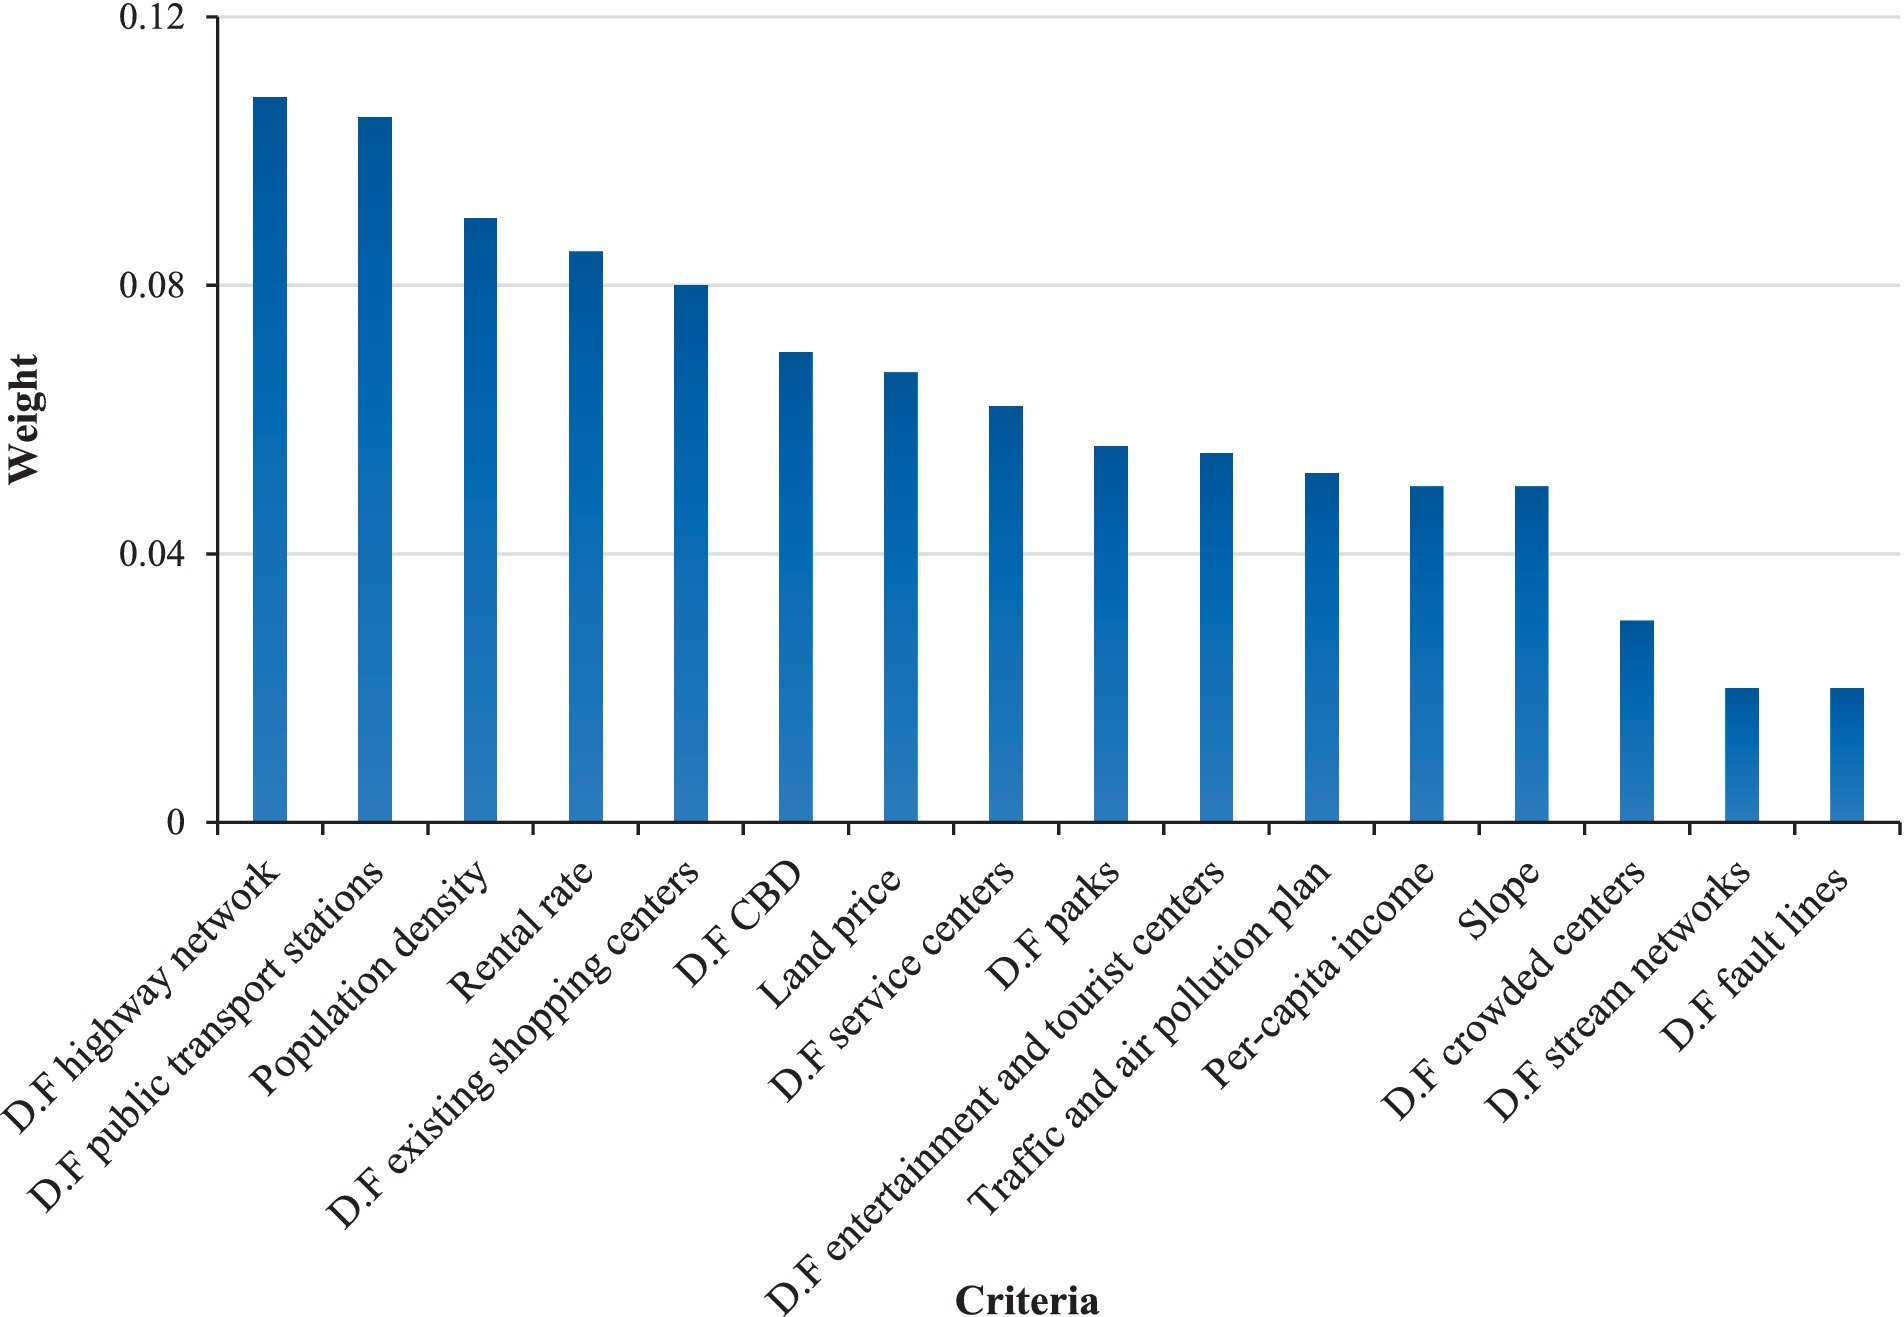
Figure 3. Weights calculated based on BWM for effective criteria in determining suitable locations.
The map of the criteria used in determining the potential of vacant lands is shown in Figure 4. The spatial distribution of effective criteria values is heterogeneous across the studied area. In terms of traffic plan criteria and pollution, central vacant lands (e.g., CBD) had the lowest suitability, and vacant lands located in the outer parts of the city had the highest suitability. The vacant lands in the northern parts of Tehran had a higher slope, which means less suitability for building a shopping center. The central, southeastern, and southern regions of Tehran had a higher population density than other regions and were more suitable. The land and rent prices in the northern areas were higher than in the southern areas; meaning that the southern areas are more suitable. On the contrary, in terms of per capita income, vacant lands in the northern regions had a higher suitability since per capita income is higher in these regions. Vacant lands in the central areas had a higher priority than the peripheral areas due to their proximity to CBD. In terms of the distance from faults, due to earthquake risks, vacant lands located in the northern and southern regions had a lower suitability than vacant lands in the central regions. Due to the concentration of stream networks in the northern half of Tehran city, vacant lands in these areas are at risk of flooding and have a lower suitability. Vacant lands in marginal areas are less suitable due to their greater distance from public transportation stations, crowded areas, and recreational and park areas. In addition, the vacant lands located in the southwest and eastern regions are more suitable than other vacant lands due to their greater distance from the existing shopping centers. In terms of the distance from highways, vacant lands located in the northwestern regions had a lower suitability.
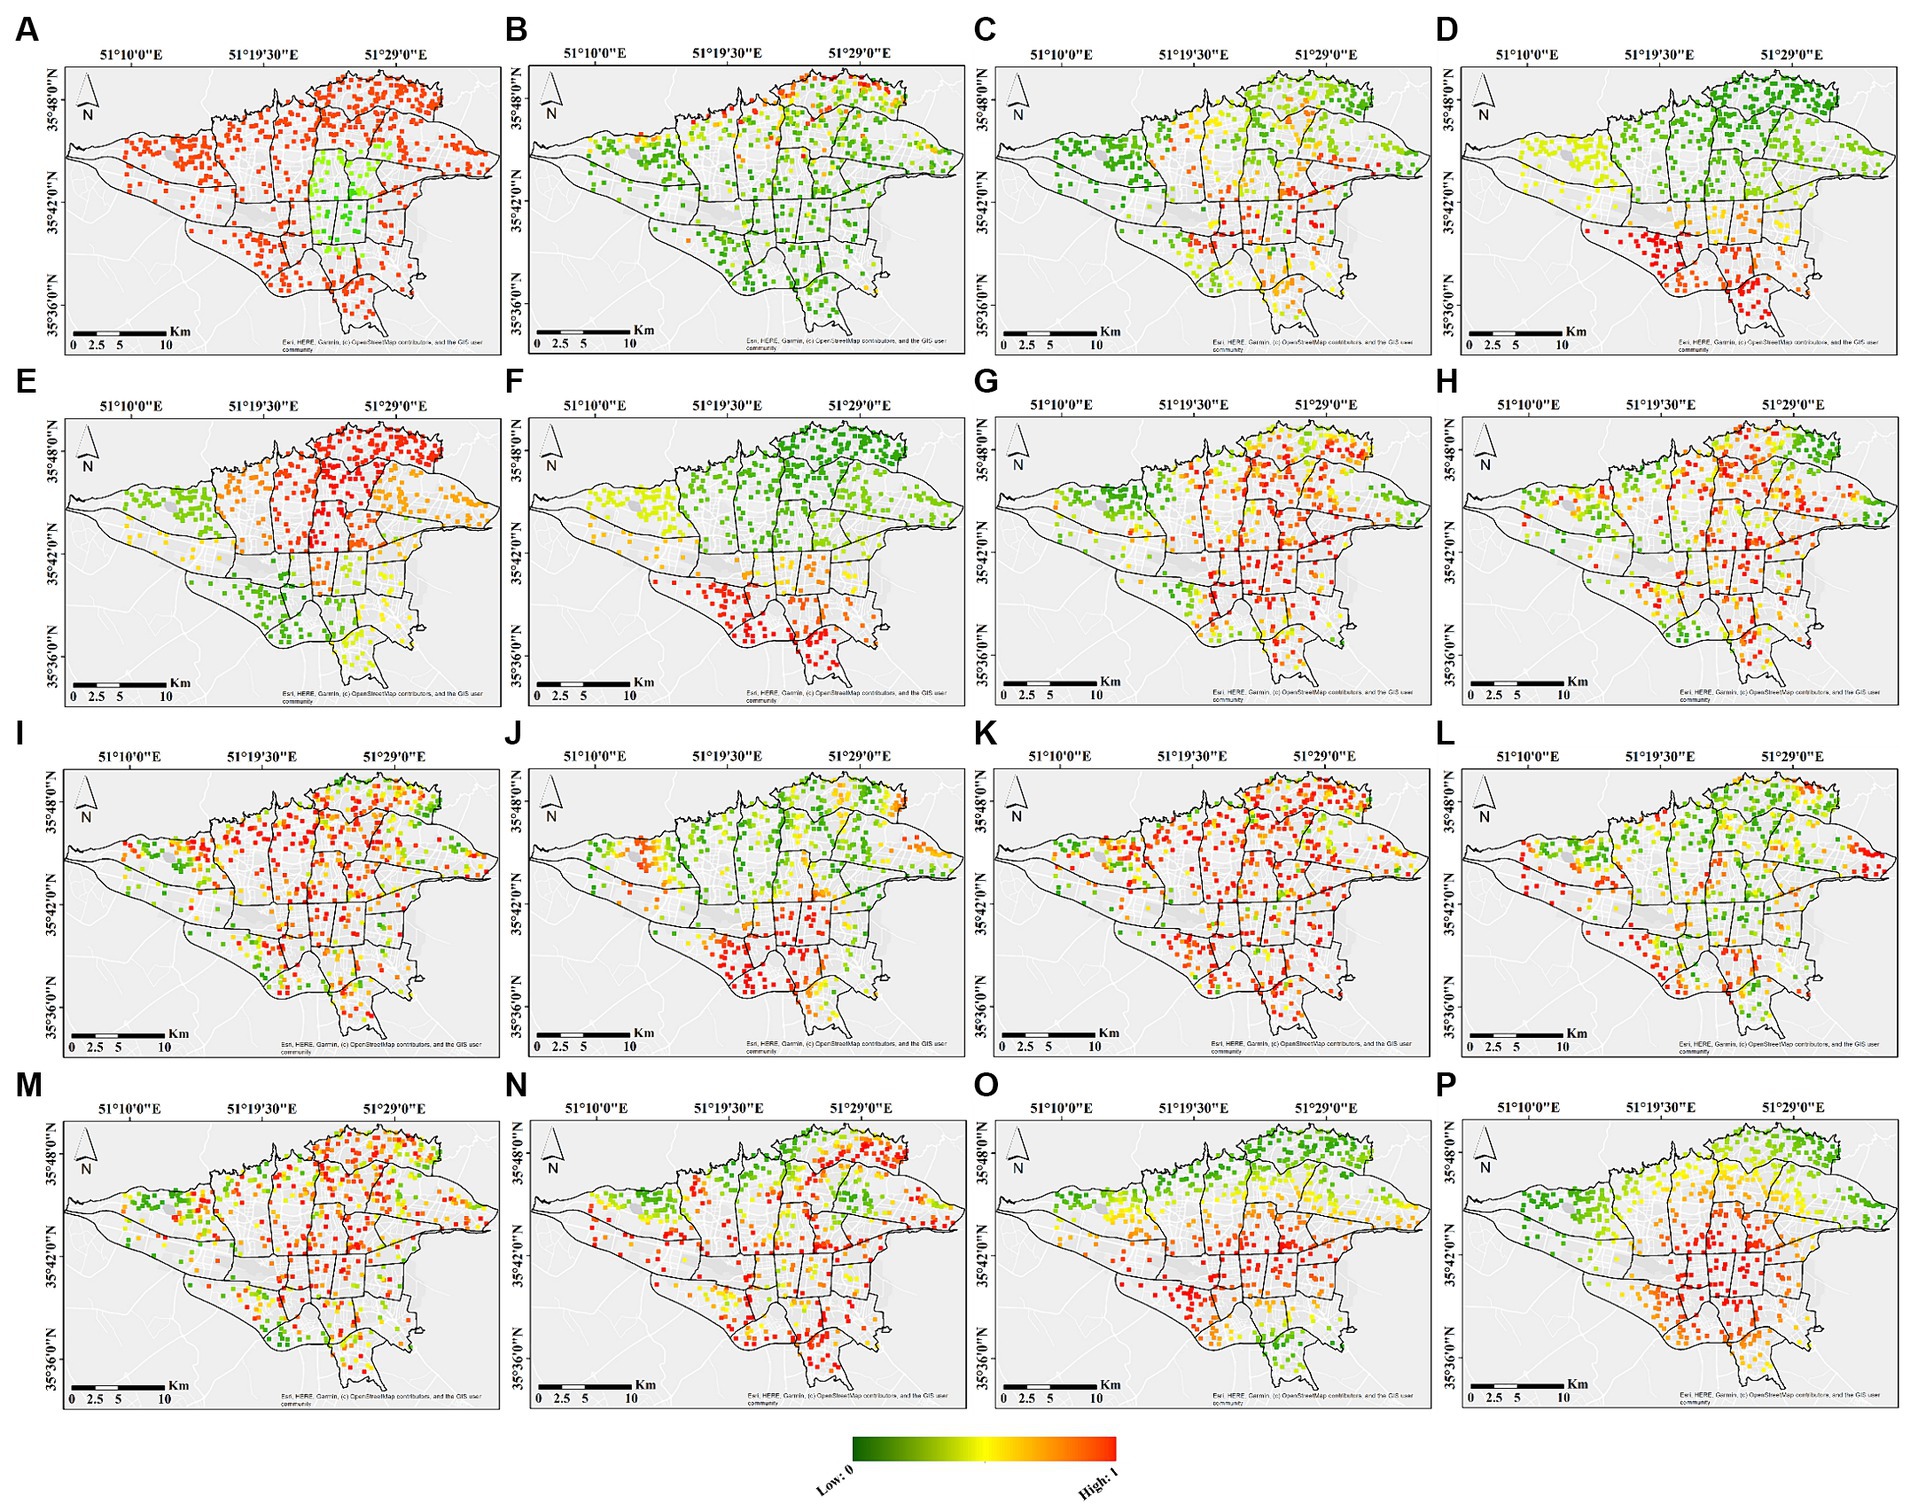
Figure 4. Map of the criteria used in determining the potential of urban vacant land for the construction of a shopping center; (A) traffic and air pollution plan, (B) slope, (C) population density, (D) rental rate, (E) per-capita income, (F) land price, (G) D.F public transport stations, (H) D.F entertainment and tourist centers, (I) D.F crowded centers, (J) D.F stream networks, (K) D.F parks, (L) D.F existing shopping centers, (M) D.F service centers, (N) D.F highway networks, (O) D.F fault lines, (P) D.F CBD.
The potential map of vacant lands in Tehran city for the construction of a shopping center under different scenarios is shown in Figure 5. Vacant lands with high and very high potential were located in the south and southeast of Tehran. On the other hand, vacant lands located in the north and northeast of Tehran had low and very low potentials.
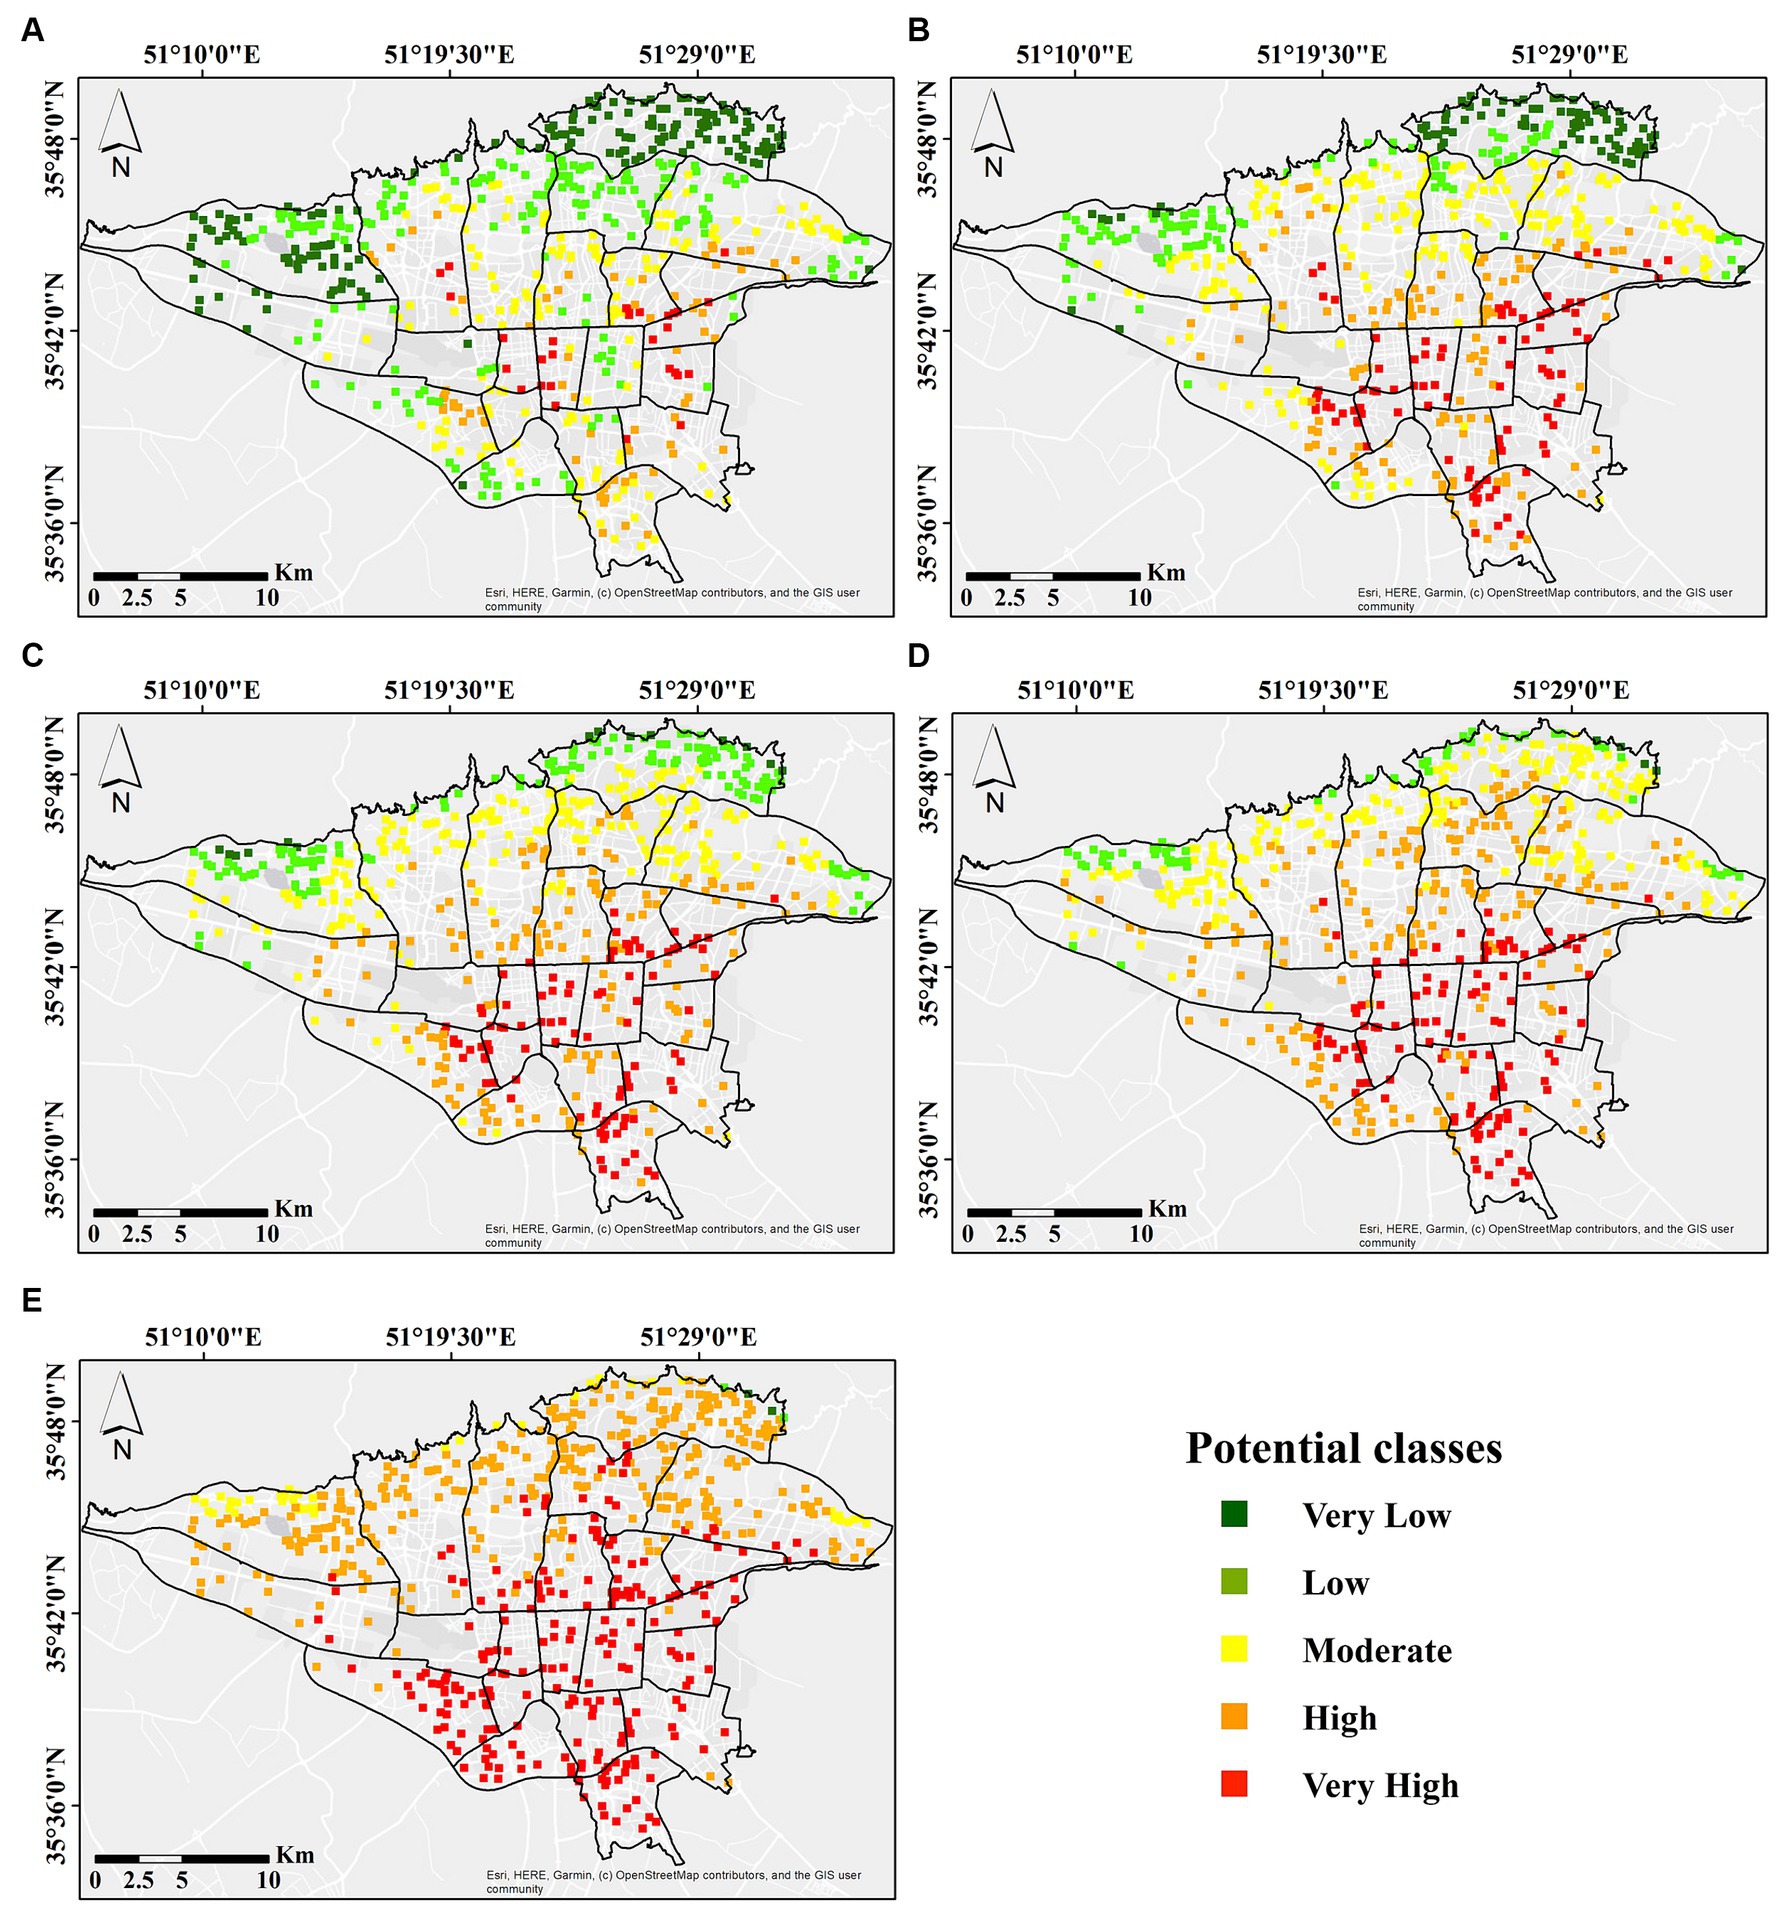
Figure 5. Potential map of Urban vacant lands for the construction of a shopping center; (A) very pessimistic, (B) pessimistic, (C) intermediate, (D) optimistic, and (E) very optimistic.
Examples of vacant lands designated as very high potential areas under a very pessimistic scenario are shown in Figure 6. These lands are located in areas with high population density, close to highways, public transportation stations, and crowded areas of the city. These lands are also suitable in terms of economic criteria such as land price, rental rate, and slope. They are outside of the traffic and pollution plan (restricted areas) and at a close distance to CBD, parks, and recreational and service areas. For investors with a very low risk tolerance, these vacant lands are the best options for building a shopping center.
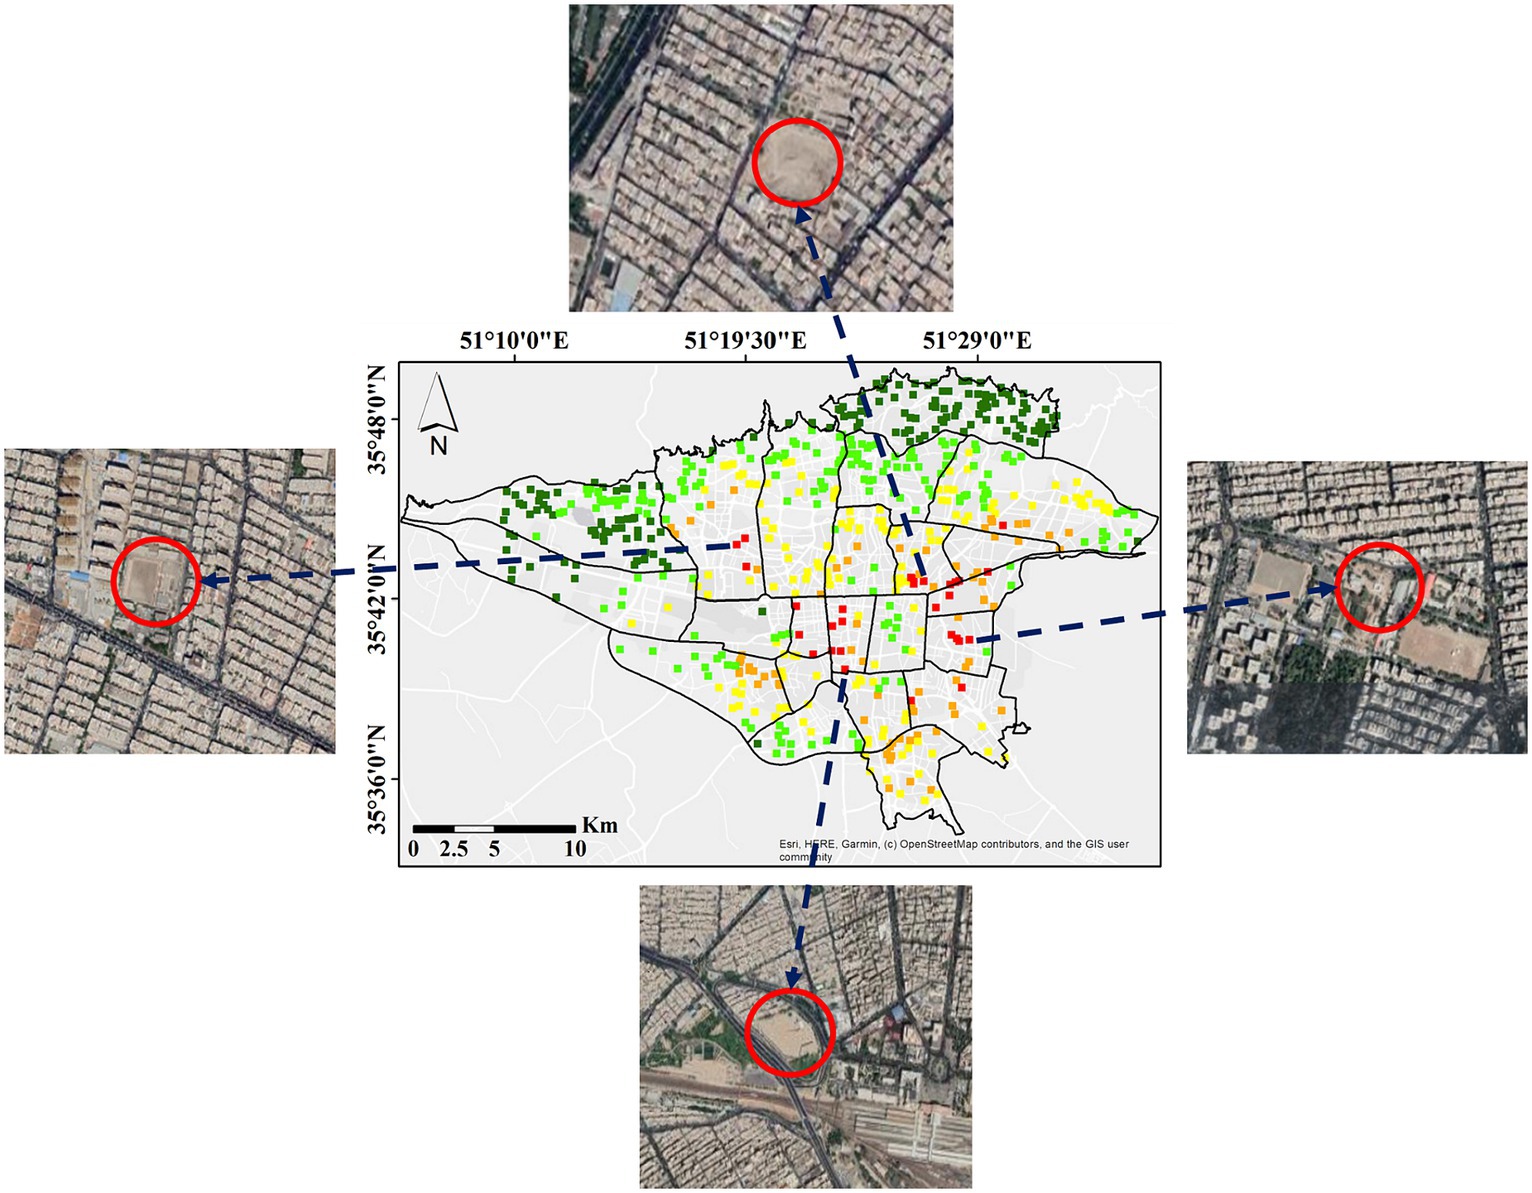
Figure 6. Samples of vacant lands designated as areas with very high potential for building a shopping center under a very pessimistic scenario.
The number of vacant lands within each potential degree class under different scenarios is presented in Figure 7. The number of vacant lands with very high potential based on very pessimistic, pessimistic, intermediate, optimistic, and very optimistic scenarios was 29, 95, 105, 122, and 224, respectively. This number was 161, 82, 14, 4, and 2 for vacant lands with very low potential. Under the very pessimistic scenario, only 5% of the vacant lands had a very high potential, while in the very optimistic scenario, this value reached 38%. The results show that with the increase in the degree of optimism, the number of vacant lands with high and very high potential increased and the number of vacant lands with low and very low potential decreased.
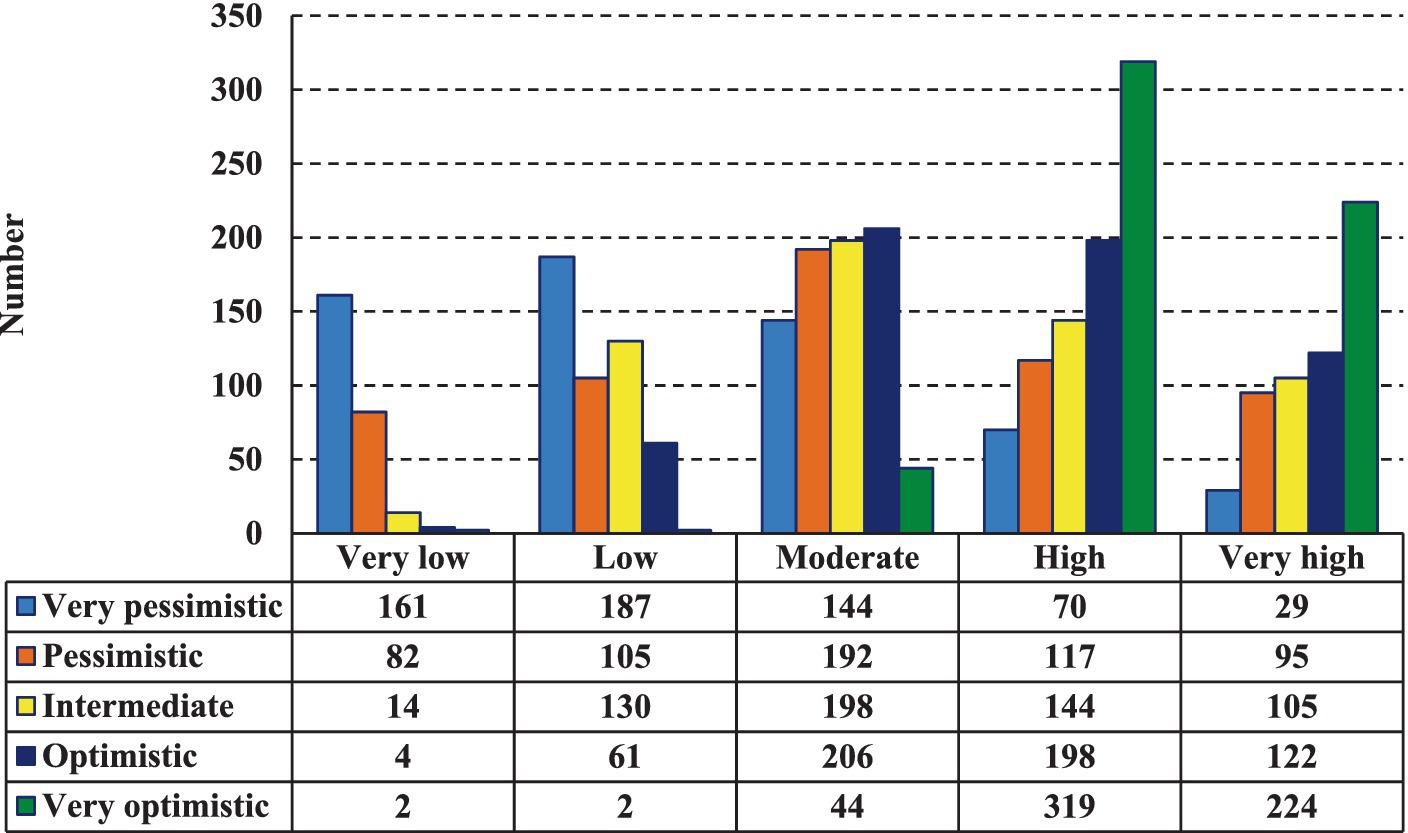
Figure 7. The number of vacant lands located in each class of potential for building a shopping center under different scenarios.
The percentage of vacant lands with a very high potential compared to the total number of vacant lands in different regions is shown in Table 5. Under a very pessimistic situation, districts 4, 5, 7, 10, 11, 14, 15, and 16 had vacant lands with a very high degree of potential. District 10 had three vacant lands, all of which have a very high potential under all five scenarios. Under the most optimistic scenario, all urban districts had high-potential vacant lands. Under this scenario, 100% of vacant lands located in districts 8, 10, 11, 12, 13, 14, 16, 17, 19, and 20 had a very high potential, while this value for districts 1 and 22 was about 1%. The lowest percentage of vacant lands with very high potential was in District 5 at about 12%. With the increase in the degree of optimism in the decision-making process, the percentage of high-potential vacant lands increased in all urban areas.
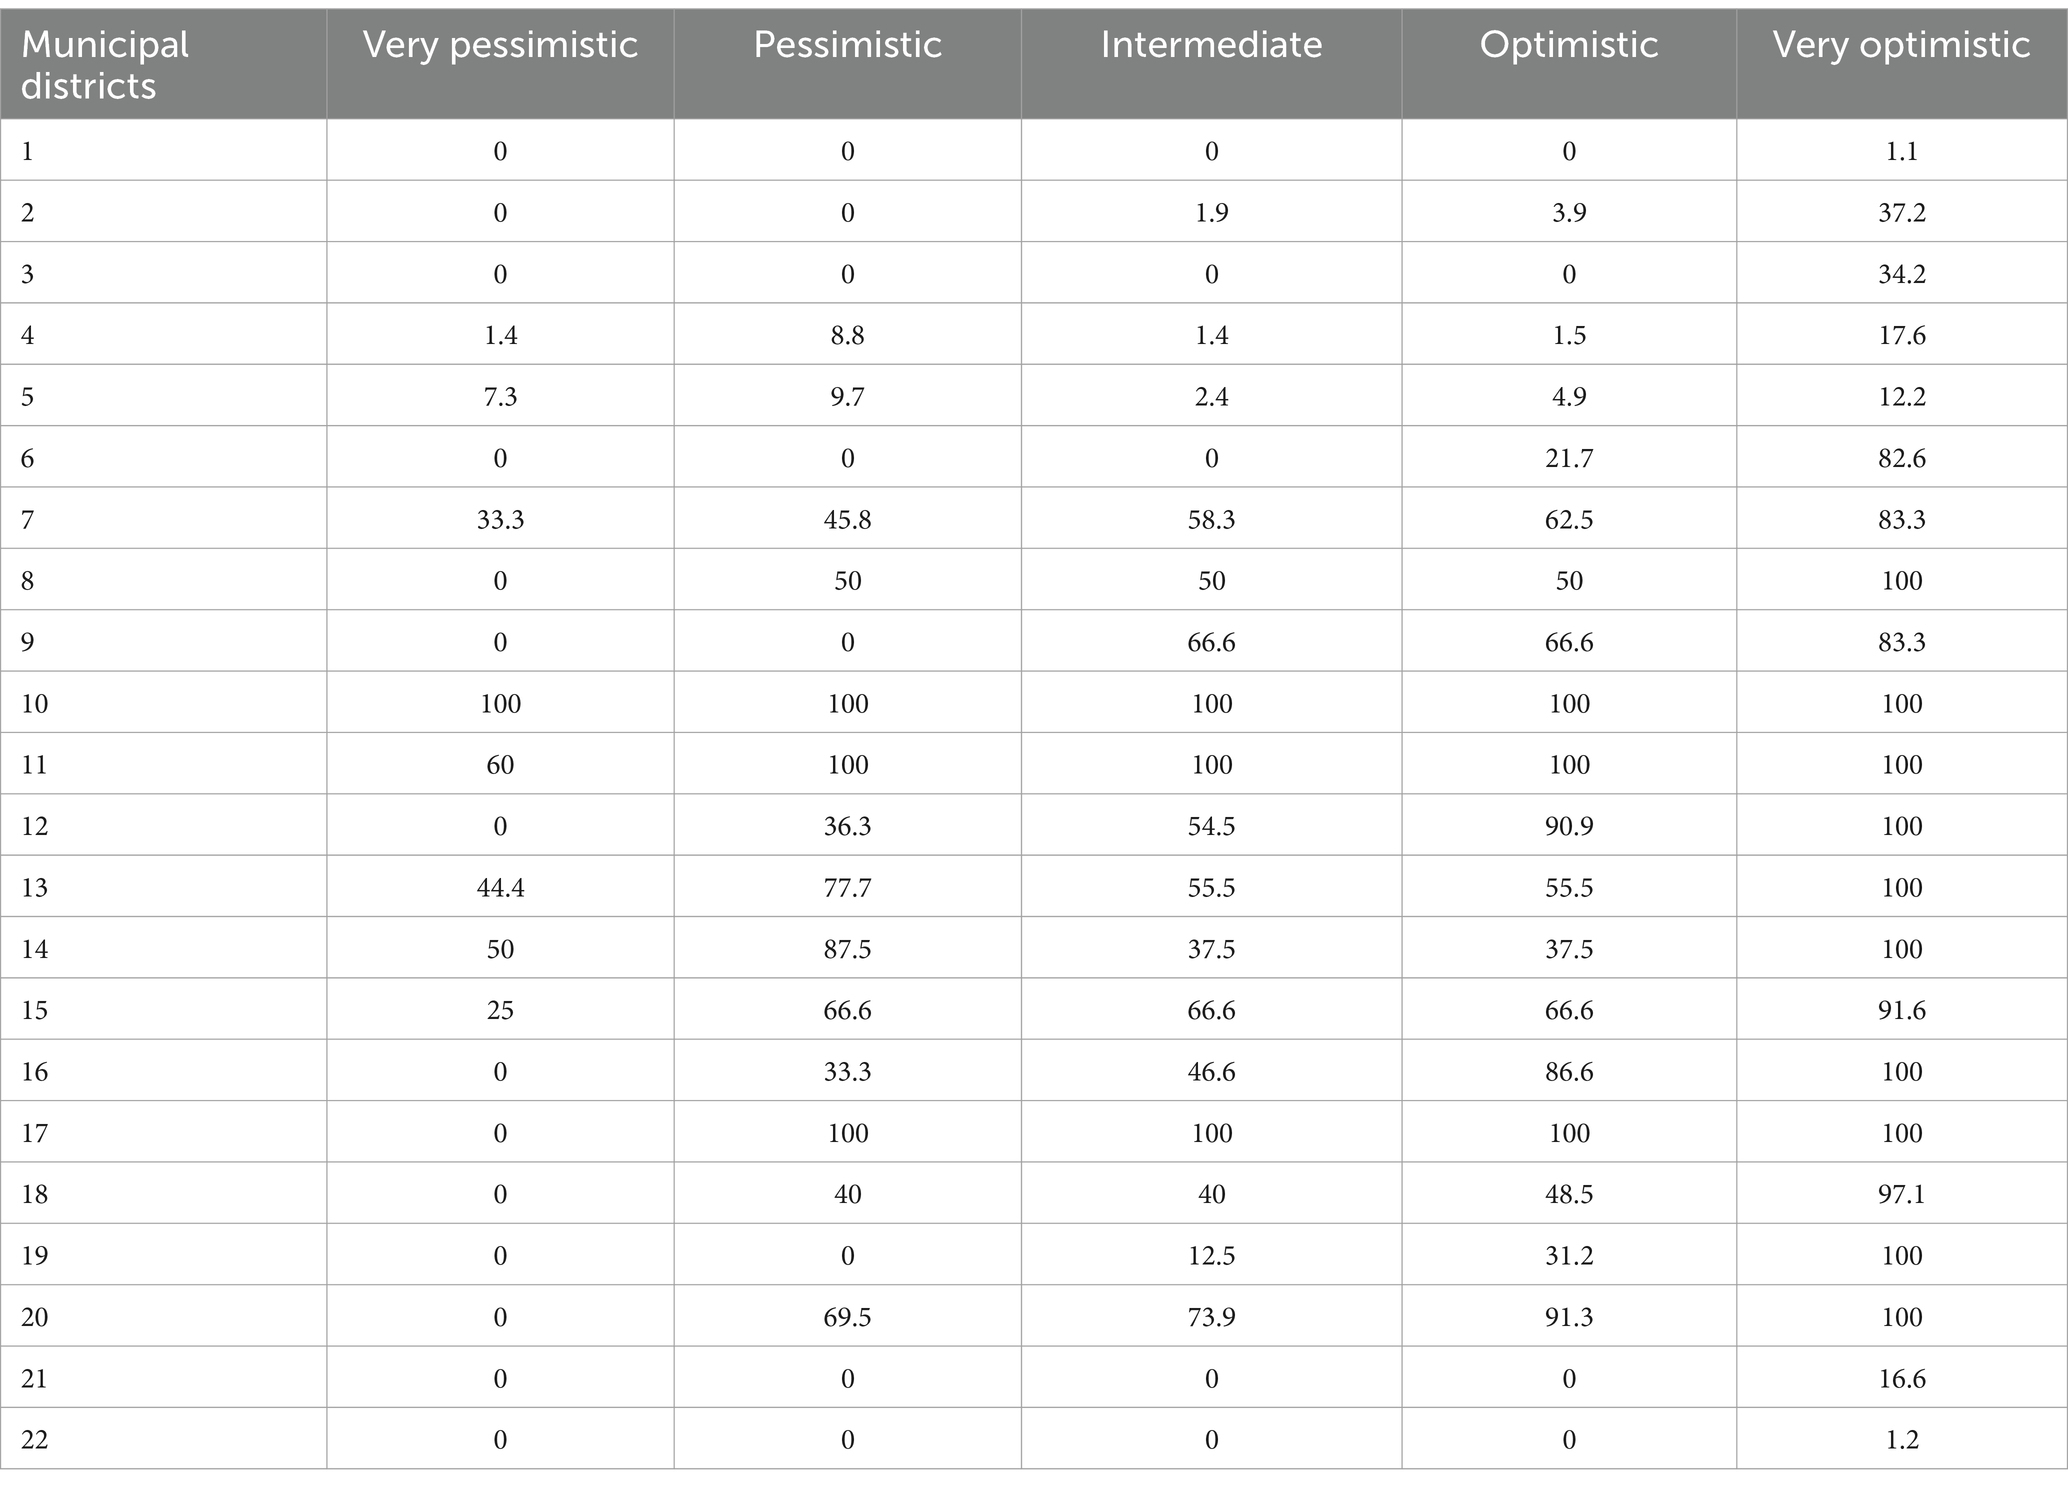
Table 5. The percentage of high-potential vacant lands compared to the total number of vacant lands for the construction of shopping centers in municipal areas under different scenarios.
The potential map of building shopping centers based on the opinions of stakeholders is shown in Figure 8. The number of 4, 73, 205, 144, and 165 vacant lands were placed in very low, low, moderate, high and very high potential classes, respectively. These results show that according to the opinion of the stakeholders, about 28% of vacant lands in Tehran has a very high potential for building shopping centers. Most of the vacant lands with very high potential are located in the central and southern areas of Tehran.
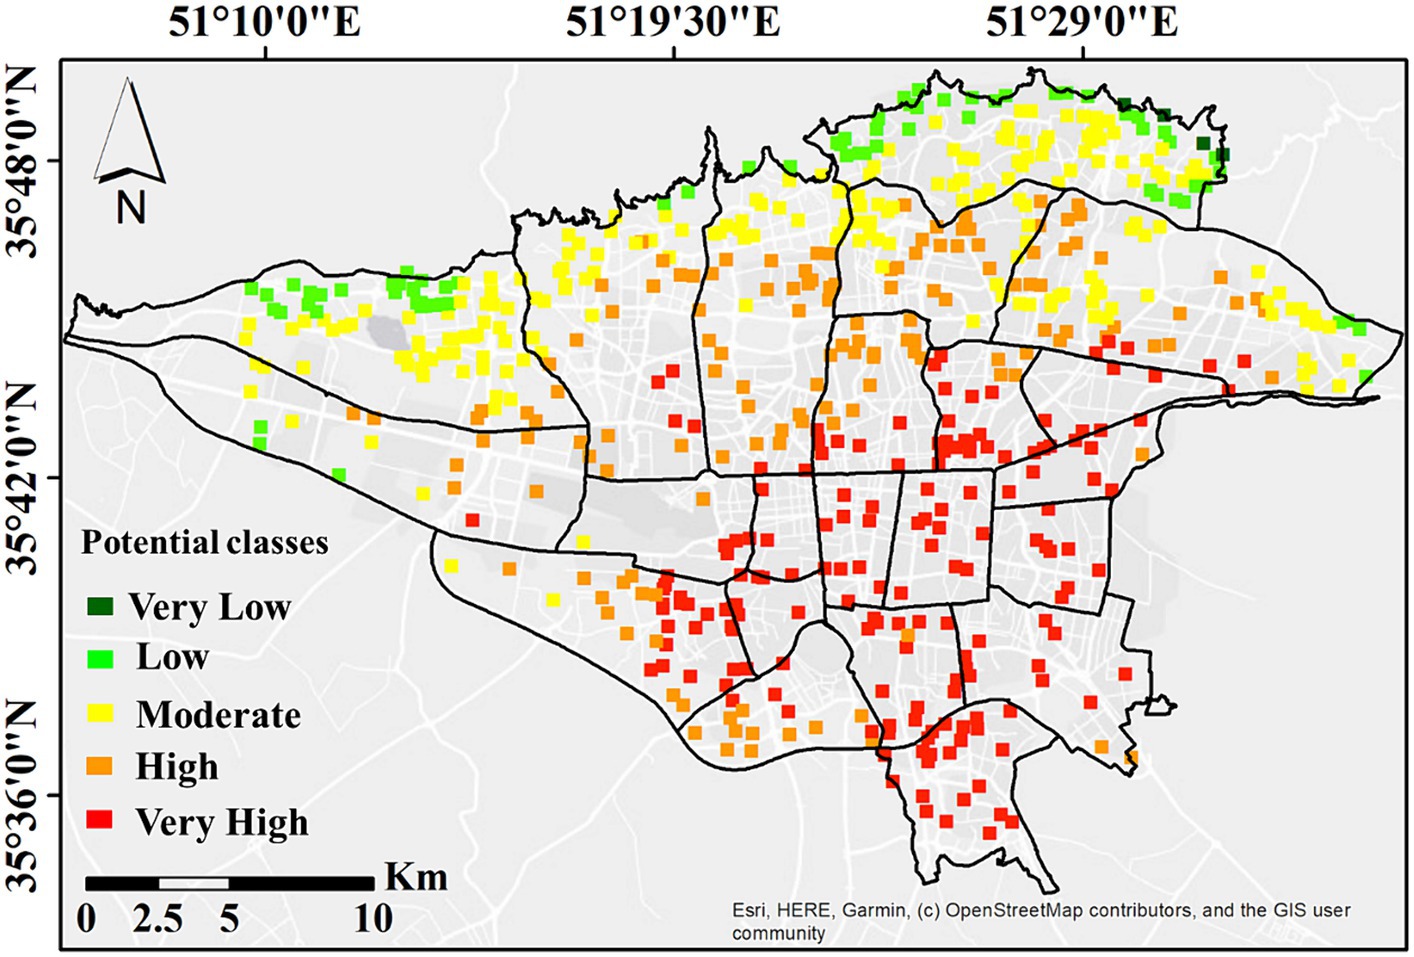
Figure 8. Map of the potential of building shopping centers based on the opinion of stakeholders.
The results of evaluating the accuracy of different OWA scenarios using the obtained map based on the opinion of the stakeholders are shown in Figure 9. The overall spatial accuracy for very pessimistic, pessimistic, intermediate, optimistic and very optimistic scenarios is 0.15, 0.52, 0.58, 0.68, and 0.72, respectively. Based on this criterion, the scenario very well has the best performance in evaluating the potential of vacant lands for building shopping centers. However, this scenario suggests a large number of vacant lands as optimal locations. In order to normalize the number of proposed vacant lands, the prediction rate was calculated. To calculate the prediction rate of overall spatial accuracy in each scenario, it was divided by the ratio of the number of vacant lands with very high potential to the total vacant lands of the study area. The prediction rates of very pessimistic, pessimistic, intermediate, optimistic and very optimistic scenarios are 0.83, 0.89, 0.90, 0.92 and 0.53, respectively. Based on this metric, the optimistic scenario has the best performance in evaluating the potential of vacant lands for building shopping centers.
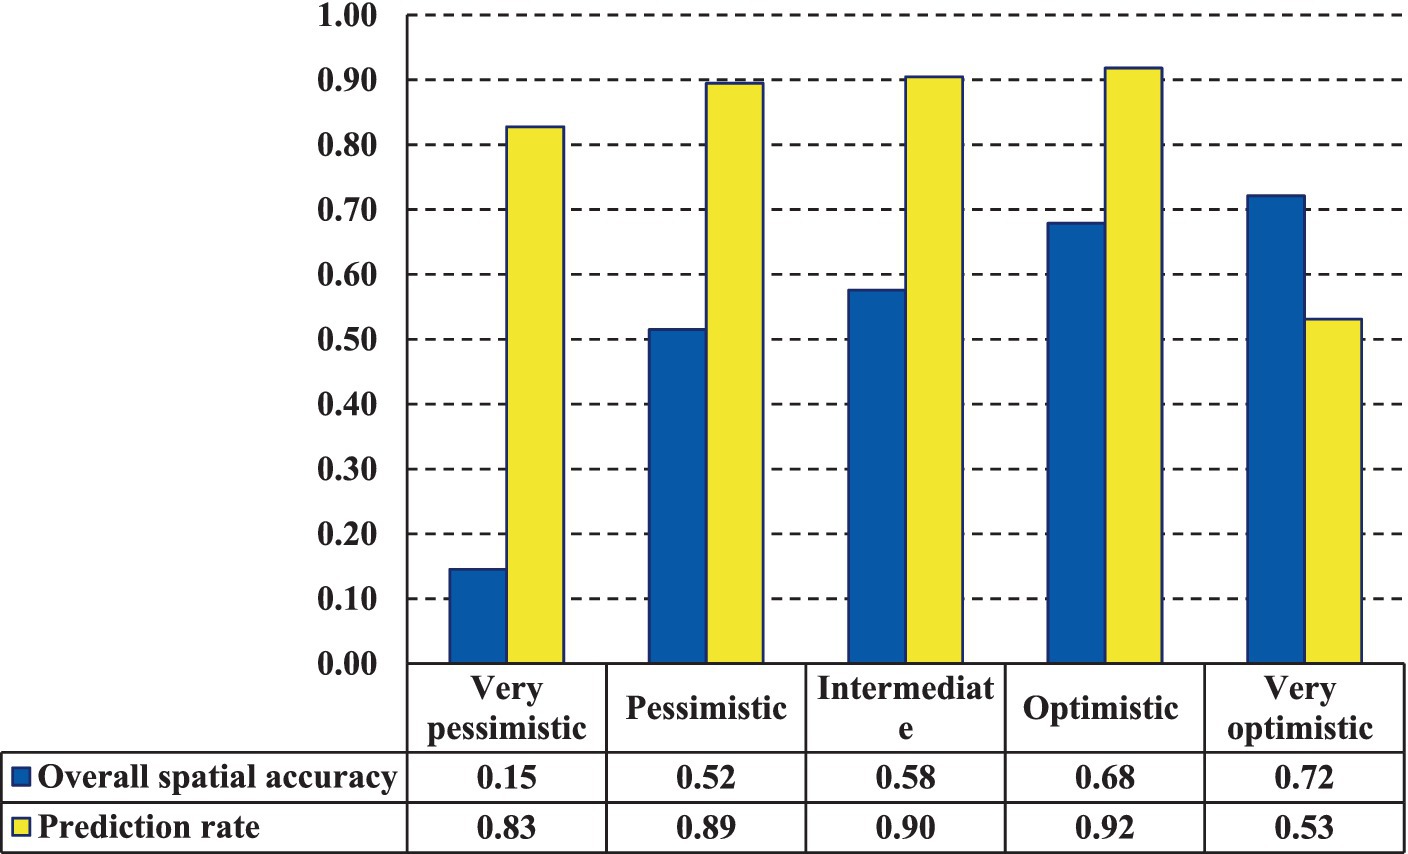
Figure 9. The results of evaluating the accuracy of different OWA scenarios using the obtained map based on the opinion of the stakeholders.
4 Discussion
In urban studies, it is worthwhile to assess the potential of urban vacant lands as unique opportunities for urban development. These lands can become strategic points with direct effects on traffic, citizen well-being, employment, and regional economy (Ghorui et al., 2020). Exploitation of these lands can improve some urban problems such as population density, traffic, and lack of space (Devi and Yadav, 2013). Shopping centers as important economic and social hubs can help create employment, attract tourists, and increase public welfare (Wang et al., 2014). According to the existing restrictions, vacant lands in cities can be great options for building shopping centers. Determining the potential of vacant lands requires a detailed and multi-criteria evaluation. By using various criteria, MCDM systems, and special algorithms, it is possible to obtain more accurate results and optimal plans for urban vacant lands. This study investigated various criteria such as traffic, population density, geographical distances, income, land price, and access to public facilities. This diversity in criteria allows for obtaining a more accurate picture of land potential.
Considering that assessing the potential of vacant lands for the construction of a shopping center is affected by various spatial criteria, the use of spatial MCDM systems plays an important role in analyzing the potential of these vacant lands. These systems combine and properly weigh criteria, making it possible to compare different locations. BWM is a popular MCDM method for weighting, with the advantage that reference comparisons select the best criterion over other criteria as well as other criteria over the worst criterion (Rezaei, 2015). This method is much simpler and more accurate and eliminates additional (secondary) comparisons (Kazemi-Beydokhti et al., 2019). However, BWM also has disadvantages, including sensitivity to changes in the weights given by experts (Wu et al., 2021). Small changes in the weights may lead to large changes in the order of priority of the criteria and thus the final decision (Yazdi et al., 2022). In addition, the process of gathering expert opinions may be time-consuming and complicated (Moradi et al., 2023). As a result, the use of BWM requires precision and specialized knowledge in the process to achieve reliable and dynamic results. Meanwhile, the OWA model, which operates based on risk in decision-making, is often used to prepare potential maps of vacant lands under different (very pessimistic, pessimistic, intermediate, optimistic, and very optimistic) risk tolerance scenarios. This model plays an important role in optimizing location decisions due to its ability to manage different risks and balance them. Previous studies have used OWA for land use suitability assessment (Luan et al., 2021; Feizizadeh et al., 2023), locating suitable areas for renewable energy power plants (Shorabeh et al., 2022; Cheng et al., 2023), risk modeling and vulnerability to natural hazards (Ghaffari Gilandeh et al., 2020; Yariyan et al., 2020), evaluating thermal comfort in the urban environment (Mijani et al., 2019), predicting the physical growth of cities (Karimi Firozjaei et al., 2020), etc. The results of these studies confirm the accuracy and flexibility of the OWA model in multi-criteria decisions.
Although spatial MCDM systems are powerful tools for land potential analysis, they also have limitations. These limitations include partial or inappropriate data, temporal changes in measures, and sensitivity to changes in measure weights. Furthermore, considering all criteria may cause a lot of complexity in the model and affect its performance. In short, the analysis of the potential of vacant lands for the construction of shopping centers using various criteria and spatial MCDM systems is an important tool for urban planning and improving urban spaces. However, it is necessary to carefully evaluate the limitations of these methods to make optimal decisions.
In this study, the preparation of maps of effective criteria in evaluating the potential of building shopping centers was faced with several challenges. Among the challenges in collecting data from different sources are the lack of a location portal for searching, evaluation and access, the lack or problems of metadata, and the lack of necessary coordination between different organizations for sharing data and location information. Also, different standards have been used in the production of the required data in the preparation of criteria maps. These standards include coordinate system, format, spatial accuracy, pixel size, method and date of data production. The different standards of the datasets used in the preparation of the criteria map cause and increase the uncertainty in the potential measurement maps for the construction of shopping centers. However, to unify some standards such as coordinate system, format, and pixel size, tools have been developed in spatial software, which are used in this study in the pre-processing stage. On the other hand, to update the results of measuring the potential of building shopping centers in the coming years, up-to-date data is needed, and accessing all these data can be challenging.
5 Conclusion
Identifying suitable areas for specific urban development purposes is one of the basic issues in regional plans and land development faced by urban planners. Assessing the potential of major commercial centers is a key step in regional development. The proper distribution of these centers in terms of political and social dimensions can drive economic growth and reduce regional inequality. Therefore, this study assessed the potential of urban vacant lands based on SMCDM for the construction of a shopping center in the 22 districts of Tehran. The results showed that accessibility criteria (such as distance from highways) have more weight and importance than other criteria for the construction of shopping centers. The southern and southeastern regions of the study area had a higher potential. The generated potential maps showed that the number of vacant lands with high and very high potential changes with the change of attitude (from very optimistic to very pessimistic). The number of vacant lands with very high potential was 224 under a very optimistic attitude and 29 under a very pessimistic attitude. A very optimistic attitude can be used when there is neither a high sensitivity nor a constraint on the allocation of resources, whereas a very pessimistic decision-making attitude can be used when there are both very high sensitivity and certain economic limitations. Results showed that of the 22 districts of Tehran, in 10 districts all vacant lands were suitable for building shopping centers under a very optimistic scenario, and only 1 district under a very pessimistic scenario.
Data availability statement
The data analyzed in this study is subject to the following licenses/restrictions: they should be collected from related organizations at personal cost and have a high volume. Requests to access these datasets should be directed to FN, bmlja3JhdmVzaC5mQHV0LmFjLmly.
Author contributions
JK: Conceptualization, Data curation, Methodology, Software, Writing – original draft. SQ: Supervision, Writing – review & editing. SR: Conceptualization, Data curation, Formal analysis, Methodology, Writing – original draft. BM: Conceptualization, Investigation, Methodology, Writing – original draft. PD: Formal analysis, Resources, Writing – original draft. SY: Software, Validation, Writing – original draft. KJ: Formal analysis, Software, Writing – original draft. RA: Investigation, Validation, Writing – original draft. FN: Data curation, Resources, Validation, Writing – original draft.
Funding
The author(s) declare that no financial support was received for the research, authorship, and/or publication of this article.
Conflict of interest
The authors declare that the research was conducted in the absence of any commercial or financial relationships that could be construed as a potential conflict of interest.
Publisher’s note
All claims expressed in this article are solely those of the authors and do not necessarily represent those of their affiliated organizations, or those of the publisher, the editors and the reviewers. Any product that may be evaluated in this article, or claim that may be made by its manufacturer, is not guaranteed or endorsed by the publisher.
References
Afsari, R., Nadizadeh Shorabeh, S., Bakhshi Lomer, A. R., Homaee, M., and Arsanjani, J. J. (2023). Using artificial neural networks to assess earthquake vulnerability in urban blocks of Tehran. Remote Sens. 15:1248. doi: 10.3390/rs15051248
Afsari, R., Nadizadeh Shorabeh, S., Kouhnavard, M., Homaee, M., and Arsanjani, J. J. (2022). A spatial decision support approach for flood vulnerability analysis in urban areas: a case study of Tehran. ISPRS Int. J. Geo Inf. 11:380. doi: 10.3390/ijgi11070380
Ali, Z., Mahmood, T., Gwak, J., and Jan, N. (2023). A novel extended Portuguese of interactive and multi-criteria decision making and Archimedean Bonferroni mean operators based on prospect theory to select green supplier with complex q-rung orthopair fuzzy information. CAAI Trans. Intell. Technol. 8, 177–191. doi: 10.1049/cit2.12185
Allah Bukhsh, Z., Stipanovic, I., Klanker, G., O’Connor, A., and Doree, A. G. (2019). Network level bridges maintenance planning using multi-attribute utility theory. Struct. Infrastruct. Eng. 15, 872–885. doi: 10.1080/15732479.2017.1414858
Arif, S., Taweekun, J., Ali, H. M., Yanjun, D., and Ahmed, A. (2021). Feasibility study and economic analysis of grid connected solar powered net zero energy building (NZEB) of shopping mall for two different climates of Pakistan and Thailand. Case Stud. Therm. Eng. 26:101049. doi: 10.1016/j.csite.2021.101049
Baki, R. (2020). Evaluating hotel websites through the use of fuzzy AHP and fuzzy TOPSIS. Int. J. Contemp. Hosp. Manag. 32, 3747–3765. doi: 10.1108/IJCHM-04-2020-0349
Boloorani, A. D., Shorabeh, S. N., Samany, N. N., Mousivand, A., Kazemi, Y., Jaafarzadeh, N., et al. (2021). Vulnerability mapping and risk analysis of sand and dust storms in Ahvaz, IRAN. Environ. Pollut. 279:116859. doi: 10.1016/j.envpol.2021.116859
Branas, C. C., South, E., Kondo, M. C., Hohl, B. C., Bourgois, P., Wiebe, D. J., et al. (2018). Citywide cluster randomized trial to restore blighted vacant land and its effects on violence, crime, and fear. Proc. Natl. Acad. Sci. 115, 2946–2951. doi: 10.1073/pnas.1718503115
Brans, J.-P., and De Smet, Y. (2016). “PROMETHEE methods” in Multiple criteria decision analysis: state of the art surveys. eds. S. Greco, M. Ehrgott, and J. Figueira (New York: Springer), 187–219.
Burayidi, M. A., and Yoo, S. (2021). Shopping malls: predicting who lives, who dies, and why? J. Real Estate Lit. 29, 60–81. doi: 10.1080/09277544.2021.1952050
Cheng, E. W., Li, H., and Yu, L. (2005). The analytic network process (ANP) approach to location selection: a shopping mall illustration. Constr. Innov. 5, 83–97. doi: 10.1108/14714170510815195
Cheng, X., Zhao, H., Zhang, Y., and Hao, X. (2023). A study on site selection of pumped storage power plants based on C-OWA-AHP and VIKOR-GRA: a case study in China. J. Energy Storage 72:108623. doi: 10.1016/j.est.2023.108623
Chou, C.-C. (2018). Application of ANP to the selection of shipping registry: the case of Taiwanese maritime industry. Int. J. Ind. Ergon. 67, 89–97. doi: 10.1016/j.ergon.2018.04.009
Deb, M. (2012). Evaluation of customer's mall preferences in India using fuzzy AHP approach. J. Adv. Manag. Res. 9, 29–44. doi: 10.1108/09727981211225635
Devi, K., and Yadav, S. P. (2013). A multicriteria intuitionistic fuzzy group decision making for plant location selection with ELECTRE method. Int. J. Adv. Manuf. Technol. 66, 1219–1229. doi: 10.1007/s00170-012-4400-0
Dutta, R., Das, N., Majumder, M., and Jana, B. (2023). Aspect based sentiment analysis using multi-criteria decision-making and deep learning under COVID-19 pandemic in India. CAAI Trans. Intell. Technol. 8, 219–234. doi: 10.1049/cit2.12144
Erdin, C., and Akbaş, H. E. (2019). A comparative analysis of fuzzy TOPSIS and geographic information systems (GIS) for the location selection of shopping malls: a case study from Turkey. Sustain. For. 11:3837. doi: 10.3390/su11143837
Feizizadeh, B., Alajujeh, K. M., and Makki, M. (2023). A scenario-based food security analysis and halophyte crop suitability assessment in dying lake environments impacted by climate change. Int. J. Appl. Earth Obs. Geoinf. 122:103425. doi: 10.1016/j.jag.2023.103425
Figueira, J. R., Greco, S., Roy, B., and Słowiński, R. (2010). “ELECTRE methods: Main features and recent developments” in Handbook of multicriteria analysis. (Berlin/Heidelberg: Springer), 51–89.
Firozjaei, M. K., Nematollahi, O., Mijani, N., Shorabeh, S. N., Firozjaei, H. K., and Toomanian, A. (2019). An integrated GIS-based ordered weighted averaging analysis for solar energy evaluation in Iran: current conditions and future planning. Renew. Energy 136, 1130–1146. doi: 10.1016/j.renene.2018.09.090
Gaillard, J. C. (2007). Resilience of traditional societies in facing natural hazards. Dis. Prevent. Manag. Int. J. 16, 522–544. doi: 10.1108/09653560710817011
Ghaffari Gilandeh, A., Sobhani, B., and Ostadi, E. (2020). Combining arc-GIS and OWA model in flooding potential analysis (case study: Meshkinshahr city). Nat. Hazards 102, 1435–1449. doi: 10.1007/s11069-020-03975-0
Ghorui, N., Ghosh, A., Algehyne, E. A., Mondal, S. P., and Saha, A. K. (2020). AHP-TOPSIS inspired shopping mall site selection problem with fuzzy data. Mathematics 8:1380. doi: 10.3390/math8081380
Gigović, L., Drobnjak, S., and Pamučar, D. (2019). The application of the hybrid GIS spatial multi-criteria decision analysis best–worst methodology for landslide susceptibility mapping. ISPRS Int. J. Geo Inf. 8:79. doi: 10.3390/ijgi8020079
Hernández, C. T., Marins, F. A. S., Rocha, P., and Duran, J. A. R. (2010). Using AHP and ANP to evaluate the relation between reverse logistics and corporate performance in Brazilian industry. Braz. J. Oper. Prod. Manag. 7, 47–62. doi: 10.13140/RG.2.1.1966.5127
Ivlev, I., Kneppo, P., and Bartak, M. (2014). Multicriteria decision analysis: a multifaceted approach to medical equipment management. Technol. Econ. Dev. Econ. 20, 576–589. doi: 10.3846/20294913.2014.943333
Jahan, A. (2012). Material selection in biomedical applications: comparing the comprehensive VIKOR and goal programming models. Int. J. Mater. Struct. Integr. 6, 230–240. doi: 10.1504/IJMSI.2012.049957
Jorge-García, D., and Estruch-Guitart, V. (2022). Comparative analysis between AHP and ANP in prioritization of ecosystem services-a case study in a rice field area raised in the Guadalquivir marshes (Spain). Eco. Inform. 70:101739. doi: 10.1016/j.ecoinf.2022.101739
Kailiponi, P. (2010). Analyzing evacuation decisions using multi-attribute utility theory (MAUT). Procedia Eng. 3, 163–174. doi: 10.1016/j.proeng.2010.07.016
Karakuş, C. B. (2023). Groundwater potential assessment based on GIS-based best–worst method (BWM) and step-wise weight assessment ratio analysis (SWARA) method. Environ. Sci. Pollut. Res. 30, 31851–31880. doi: 10.1007/s11356-022-24425-3
Karimi Firozjaei, M., Sedighi, A., and Jelokhani-Niaraki, M. (2020). An urban growth simulation model based on integration of local weights and decision risk values. Trans. GIS 24, 1695–1721. doi: 10.1111/tgis.12668
Kazemi, A., and Amiri, M. (2017). Selecting shopping center site using MADM techniques. In Paper presented at the proceedings of the international conference on education, E-Governance, Law and Business, Dubai, UAE.
Kazemi-Beydokhti, M., Abbaspour, R. A., Kheradmandi, M., and Bozorgi-Amiri, A. (2019). Determination of the physical domain for air quality monitoring stations using the ANP-OWA method in GIS. Environ. Monit. Assess. 191, 1–17. doi: 10.1007/s10661-019-7422-3
Kim, G. (2016). The public value of urban vacant land: social responses and ecological value. Sustain. For. 8:486. doi: 10.3390/su8050486
Kim, G., Newman, G., and Jiang, B. (2020). Urban regeneration: community engagement process for vacant land in declining cities. Cities 102:102730. doi: 10.1016/j.cities.2020.102730
Kirnbauer, M. C., and Baetz, B. W. (2014). A prototype community-based planning tool for evaluating site suitability for the temporary reuse of vacant lands. Int. J. Urban Sustain. Dev. 6, 221–240. doi: 10.1080/19463138.2014.899230
Koçak, H. (2010). Convex programming approach to the shopping mall (AVM) site selection problem and Sakarya. Eur. J. Soc. Sci. 13, 219–228.
Kordi, F., and Yousefi, H. (2022). Crop classification based on phenology information by using time series of optical and synthetic-aperture radar images. Remote Sens. Applicat. Soc. Environ. 27:100812. doi: 10.1016/j.rsase.2022.100812
Krohling, R. A., and Campanharo, V. C. (2011). Fuzzy TOPSIS for group decision making: a case study for accidents with oil spill in the sea. Expert Syst. Appl. 38, 4190–4197. doi: 10.1016/j.eswa.2010.09.081
Kwiecien, R., Kopp-Schneider, A., and Blettner, M. (2011). Concordance analysis: part 16 of a series on evaluation of scientific publications. Dtsch. Arztebl. Int. 108, 515–521. doi: 10.3238/arztebl.2011.0515
López, J. I. M., Kim, G., Lei, Y., Newman, G., and Suppakittpaisarn, P. (2021). An assessment method and typology for the regeneration of vacant land in Quito, Ecuador. Urban For. Urban Green. 62:127130. doi: 10.1016/j.ufug.2021.127130
Luan, C., Liu, R., and Peng, S. (2021). Land-use suitability assessment for urban development using a GIS-based soft computing approach: a case study of Ili Valley, China. Ecol. Indic. 123:107333. doi: 10.1016/j.ecolind.2020.107333
Luo, N., Yu, H., You, Z., Li, Y., Zhou, T., Jiao, Y., et al. (2023). Fuzzy logic and neural network-based risk assessment model for import and export enterprises: a review. J. Data Sci. Intell. Syst. 1, 2–11. doi: 10.47852/bonviewJDSIS32021078
Mahmood, T., Ali, Z., and Naeem, M. (2023). Aggregation operators and CRITIC-VIKOR method for confidence complex q-rung orthopair normal fuzzy information and their applications. CAAI Trans. Intell. Technol. 8, 40–63. doi: 10.1049/cit2.12146
Malcezewski, J. (2006). GIS based land-use suitability analysis: a survey of the literature. Int. J. Geogr. Inf. Sci. 20, 703–726. doi: 10.1080/13658810600661508
Malczewski, J. (2004). GIS-based land-use suitability analysis: a critical overview. Prog. Plan. 62, 3–65. doi: 10.1016/j.progress.2003.09.002
Malczewski, J. (2006). Integrating multicriteria analysis and geographic information systems: the ordered weighted averaging (OWA) approach. Int. J. Environ. Technol. Manag. 6, 7–19. doi: 10.1504/IJETM.2006.008251
Malczewski, J., Chapman, T., Flegel, C., Walters, D., Shrubsole, D., and Healy, M. A. (2003). GIS–multicriteria evaluation with ordered weighted averaging (OWA): case study of developing watershed management strategies. Environ Plan A 35, 1769–1784. doi: 10.1068/a35156
Mansourihanis, O., Maghsoodi Tilaki, M. J., Yousefian, S., and Zaroujtaghi, A. (2023). A computational geospatial approach to assessing land-use compatibility in urban planning. Land 12:2083. doi: 10.3390/land12112083
Mao, L., Zheng, Z., Meng, X., Zhou, Y., Zhao, P., Yang, Z., et al. (2022). Large-scale automatic identification of urban vacant land using semantic segmentation of high-resolution remote sensing images. Landsc. Urban Plan. 222:104384. doi: 10.1016/j.landurbplan.2022.104384
McClintock, N., Cooper, J., and Khandeshi, S. (2013). Assessing the potential contribution of vacant land to urban vegetable production and consumption in Oakland, California. Landsc. Urban Plan. 111, 46–58. doi: 10.1016/j.landurbplan.2012.12.009
Meek, M., Boobis, A., Cote, I., Dellarco, V., Fotakis, G., Munn, S., et al. (2014). New developments in the evolution and application of the WHO/IPCS framework on mode of action/species concordance analysis. J. Appl. Toxicol. 34, 1–18. doi: 10.1002/jat.2949
Mijani, N., Alavipanah, S. K., Hamzeh, S., Firozjaei, M. K., and Arsanjani, J. J. (2019). Modeling thermal comfort in different condition of mind using satellite images: an ordered weighted averaging approach and a case study. Ecol. Indic. 104, 1–12. doi: 10.1016/j.ecolind.2019.04.069
Mohamad, M. Y., Al Katheeri, F., and Salam, A. (2015). A GIS application for location selection and customers’ preferences for shopping malls in Al Ain City; UAE. Am. J. Geogr. Inf. Syst. 4, 76–86. doi: 10.5923/j.ajgis.20150402.03
Mohamad Selamat, I. A., Maruthaveeran, S., Mohd Yusof, M. J., and Shahidan, M. F. (2023). Planning tools to revitalise urban vacant land from ecological perspectives: a systematic review. Urban Sci. 7:58. doi: 10.3390/urbansci7020058
Moradi, B., Akbari, R., Taghavi, S. R., Fardad, F., Esmailzadeh, A., Ahmadi, M. Z., et al. (2023). A scenario-based spatial multi-criteria decision-making system for urban environment quality assessment: case study of Tehran. Land 12:1659. doi: 10.3390/land12091659
Nadizadeh Shorabeh, S., Hamzeh, S., Zanganeh Shahraki, S., Firozjaei, M. K., and Jokar Arsanjani, J. (2020). Modelling the intensity of surface urban heat island and predicting the emerging patterns: Landsat multi-temporal images and Tehran as case study. Int. J. Remote Sens. 41, 7400–7426. doi: 10.1080/01431161.2020.1759841
Németh, B., Molnár, A., Bozóki, S., Wijaya, K., Inotai, A., Campbell, J. D., et al. (2019). Comparison of weighting methods used in multicriteria decision analysis frameworks in healthcare with focus on low-and middle-income countries. J. Comp. Eff. Res. 8, 195–204. doi: 10.2217/cer-2018-0102
Önüt, S., Efendigil, T., and Kara, S. S. (2010). A combined fuzzy MCDM approach for selecting shopping center site: an example from Istanbul, Turkey. Expert Syst. Appl. 37, 1973–1980. doi: 10.1016/j.eswa.2009.06.080
Oubahman, L., and Duleba, S. (2021). Review of PROMETHEE method in transportation. Prod. Eng. Arch. 27, 69–74. doi: 10.30657/pea.2021.27.9
Pearsall, H., Lucas, S., and Lenhardt, J. (2014). The contested nature of vacant land in Philadelphia and approaches for resolving competing objectives for redevelopment. Cities 40, 163–174. doi: 10.1016/j.cities.2013.04.008
Rezaei, J. (2015). Best-worst multi-criteria decision-making method. Omega 53, 49–57. doi: 10.1016/j.omega.2014.11.009
Rezaei, J. (2016). Best-worst multi-criteria decision-making method: some properties and a linear model. Omega 64, 126–130. doi: 10.1016/j.omega.2015.12.001
Saaty, T. L. (2004). Decision making—the analytic hierarchy and network processes (AHP/ANP). J. Syst. Sci. Syst. Eng. 13, 1–35. doi: 10.1007/s11518-006-0151-5
Saleh, A. H., and Abdullah, M. Z. (2023). Web application system for urban best location determination based on internet of things: Case study shopping mall site selection. In Paper presented at the AIP Conference Proceedings.
San Cristóbal Mateo, J. R., and Mateo, J. R. S. C. (2012). “Multi-attribute utility theory” in Multi criteria analysis in the renewable energy industry. (London: Springer), 63–72.
Shahpari Sani, D., Heidari, M. T., Tahmasebi Mogaddam, H., Nadizadeh Shorabeh, S., Yousefvand, S., Karmpour, A., et al. (2022). An assessment of social resilience against natural hazards through multi-criteria decision making in geographical setting: a case study of Sarpol-e Zahab, Iran. Sustain. For. 14:8304. doi: 10.3390/su14148304
Shorabeh, S. N., Argany, M., Rabiei, J., Firozjaei, H. K., and Nematollahi, O. (2021). Potential assessment of multi-renewable energy farms establishment using spatial multi-criteria decision analysis: a case study and mapping in Iran. J. Clean. Prod. 295:126318. doi: 10.1016/j.jclepro.2021.126318
Shorabeh, S. N., Firozjaei, H. K., Firozjaei, M. K., Jelokhani-Niaraki, M., Homaee, M., and Nematollahi, O. (2022). The site selection of wind energy power plant using GIS-multi-criteria evaluation from economic perspectives. Renew. Sust. Energ. Rev. 168:112778. doi: 10.1016/j.rser.2022.112778
Shorabeh, S. N., Firozjaei, M. K., Nematollahi, O., Firozjaei, H. K., and Jelokhani-Niaraki, M. (2019). A risk-based multi-criteria spatial decision analysis for solar power plant site selection in different climates: a case study in Iran. Renew. Energy 143, 958–973. doi: 10.1016/j.renene.2019.05.063
Shorabeh, S. N., Varnaseri, A., Firozjaei, M. K., Nickravesh, F., and Samany, N. N. (2020). Spatial modeling of areas suitable for public libraries construction by integration of GIS and multi-attribute decision making: case study Tehran, Iran. Libr. Inf. Sci. Res. 42:101017. doi: 10.1016/j.lisr.2020.101017
Sipahi, S., and Timor, M. (2010). The analytic hierarchy process and analytic network process: an overview of applications. Manag. Decis. 48, 775–808. doi: 10.1108/00251741011043920
Song, X., Wen, M., Shen, Y., Feng, Q., Xiang, J., Zhang, W., et al. (2020). Urban vacant land in growing urbanization: an international review. J. Geogr. Sci. 30, 669–687. doi: 10.1007/s11442-020-1749-0
Taherdoost, H., and Madanchian, M. (2023). Analytic network process (ANP) method: a comprehensive review of applications, advantages, and limitations. J. Data Sci. Intell. Syst. 1, 12–18. doi: 10.47852/bonviewJDSIS3202885
Taylan, O., Bafail, A. O., Abdulaal, R. M., and Kabli, M. R. (2014). Construction projects selection and risk assessment by fuzzy AHP and fuzzy TOPSIS methodologies. Appl. Soft Comput. 17, 105–116. doi: 10.1016/j.asoc.2014.01.003
Venkata Rao, R., and Patel, B. K. (2010). Decision making in the manufacturing environment using an improved PROMETHEE method. Int. J. Prod. Res. 48, 4665–4682. doi: 10.1080/00207540903049415
Wang, Y., Li, Z., Tang, Z., and Zeng, G. (2011). A GIS-based spatial multi-criteria approach for flood risk assessment in the Dongting Lake region, Hunan, Central China. Water Resour. Manag. 25, 3465–3484. doi: 10.1007/s11269-011-9866-2
Wang, B., Xiong, H., and Jiang, C. (2014). A multicriteria decision making approach based on fuzzy theory and credibility mechanism for logistics center location selection. Sci. World J. 2014, 1–9. doi: 10.1155/2014/347619
Wesener, A. (2015). Temporary urbanism and urban sustainability after a natural disaster: transitional community-initiated open spaces in Christchurch, New Zealand. J. Urban. Int. Res. Placemaking Urban Sust. 8, 406–422. doi: 10.1080/17549175.2015.1061040
Wittstruck, D., and Teuteberg, F. (2012). Integrating the concept of sustainability into the partner selection process: a fuzzy-AHP-TOPSIS approach. Int. J. Logist. Syst. Manag. 12, 195–226. doi: 10.1504/IJLSM.2012.047221
Wu, Y., Deng, Z., Tao, Y., Wang, L., Liu, F., and Zhou, J. (2021). Site selection decision framework for photovoltaic hydrogen production project using BWM-CRITIC-MABAC: a case study in Zhangjiakou. J. Clean. Prod. 324:129233. doi: 10.1016/j.jclepro.2021.129233
Xu, Z. (2005). An overview of methods for determining OWA weights. Int. J. Intell. Syst. 20, 843–865. doi: 10.1002/int.20097
Yager, R. R. (1988). On ordered weighted averaging aggregation operators in multicriteria decision making. IEEE Trans. Syst. Man Cybern. 18, 183–190. doi: 10.1109/21.87068
Yariyan, P., Avand, M., Abbaspour, R. A., Torabi Haghighi, A., Costache, R., Ghorbanzadeh, O., et al. (2020). Flood susceptibility mapping using an improved analytic network process with statistical models. Geomat. Nat. Haz. Risk 11, 2282–2314. doi: 10.1080/19475705.2020.1836036
Yazdi, M., Adumene, S., and Zarei, E. (2022). “Introducing a probabilistic-based hybrid model (fuzzy-BWM-Bayesian network) to assess the quality index of a medical service” in Linguistic methods under fuzzy information in system safety and reliability analysis (Cham: Springer), 171–183.
Zhang, Z., Hu, B., and Qiu, H. (2021). Comprehensive assessment of ecological risk in Southwest Guangxi-Beibu bay based on DPSIR model and OWA-GIS. Ecol. Indic. 132:108334. doi: 10.1016/j.ecolind.2021.108334
Zheng, G., and Wang, X. (2020). The comprehensive evaluation of renewable energy system schemes in tourist resorts based on VIKOR method. Energy 193:116676. doi: 10.1016/j.energy.2019.116676
Zimonjić, S., Đekić, M., and Kastratović, E. (2018). Application of vikor method in ranking the investment projects. Int. J. Econ. Law 8, 125–134.
Keywords: potential, vacant lands, shopping centers, GIS-SMCDM, Tehran metropolis
Citation: Khosravian J, Qureshi S, Rostamzadeh S, Moradi B, Derakhshesh P, Yousefi S, Jamali K, Ahmadi R and Nickravesh F (2024) Evaluating the feasibility of constructing shopping centers on urban vacant land through a spatial multi-criteria decision-making model. Front. Sustain. Cities. 6:1373331. doi: 10.3389/frsc.2024.1373331
Edited by:
Brian Ricks, University of Nebraska Omaha, United StatesReviewed by:
Akshay Kale, University of Nebraska Omaha, United StatesFrancesca Torrieri, Polytechnic University of Milan, Italy
Copyright © 2024 Khosravian, Qureshi, Rostamzadeh, Moradi, Derakhshesh, Yousefi, Jamali, Ahmadi and Nickravesh. This is an open-access article distributed under the terms of the Creative Commons Attribution License (CC BY). The use, distribution or reproduction in other forums is permitted, provided the original author(s) and the copyright owner(s) are credited and that the original publication in this journal is cited, in accordance with accepted academic practice. No use, distribution or reproduction is permitted which does not comply with these terms.
*Correspondence: Salman Qureshi, c2FsbWFuLnF1cmVzaGlAZ2VvLmh1LWJlcmxpbi5kZQ==