 Rhys Goldstein
 Nastaran Shahmansouri
 Jeremy P. M. Mogk
 Sebastian Herrera
 Dianne Gault
 Frederik Brudy
 Michael Lee
 Liviu Calin
 Tomas Lay Herrera
 Dagmara Szkurlat
 Kean Walmsley*
- Autodesk Research, San Francisco, CA, United States
Various aspects of buildings and cities appear to positively influence human wellbeing, and spatial analysis offers a means of quantifying those factors so that they can be maximized during the design process. Although it is simplest to assess each design factor independently, people's everyday experience in the built environment appears to be a product of a combination of factors. We therefore propose a computational framework in which design factors pertaining to daylight, pathways, and visibility are evaluated using spatial analysis, and then the results are combined to score the tranquil, social, and explorative experiential qualities of places in habitable buildings. An implementation of the framework is applied to 20 models of residential apartments, and the resulting scores are compared to an analogous set of ratings obtained via a crowdsourced online survey. We observe that human evaluators tend to assume relatively uniform experiential qualities within each space of each apartment, whereas our algorithm often predicts a gradient of highly tranquil, social, and explorative places even within the same room. We also observe that the overall apartment ratings from the survey and the design scores from the algorithm were more strongly correlated when considering only the more experienced participants' ratings; however, a follow-up study would be needed to confirm this trend. This exploratory research contributes to a broader discussion about the importance of studying design factors in combination with one another, the challenge of validating the resulting composite metrics, and the role that theoretical best practices might play in the development of experiential space analysis tools for architects and urban designers striving to promote wellbeing.
1 Introduction
There is now considerable evidence that the design of buildings and cities affects the health and wellbeing of the people who inhabit them (Colenberg et al., 2021; Ige-Elegbede et al., 2022; St-Jean et al., 2022). This evidence includes recent studies associating design-related factors—the presence of daylight, visibility of outdoor areas and natural materials, accessibility of outdoor areas and shared amenities, choice of furniture and decor, environmental conditions, and overall aesthetics of a space—with various measures of wellbeing (Altaf et al., 2022; Douglas et al., 2022; Srivastava et al., 2024). There is also now a diversity of spatial analysis techniques that can be used to quantify many of these design factors, particularly those involving daylight (Jones et al., 2012; Danell et al., 2020; Tsang et al., 2022) or visibility and accessibility (Haq, 2019; Schwartz, 2021; Azadi et al., 2024). Using these analyses, models of proposed buildings and neighborhoods could potentially be scored on the factors that studies show to correlate most strongly with wellbeing. Architects and urban designers could then refine their designs, or optimize them using a generative design process (Gagne and Andersen, 2012; Nagy et al., 2017; Ekici et al., 2019), to achieve higher scores for these factors and hopefully improve people's quality of life.
As outlined above, it is becoming practical to choose design factors based on their empirical relationship to wellbeing, and to then quantify and maximize those factors during the design process. A potential limitation of this strategy, however, is that the value of each design factor is typically assessed independently of other design factors. It is true that some factors, such as the presence of natural elements, have been linked to health and wellbeing in a variety of contexts (Gillis and Gatersleben, 2015), and there is a strong case for developing independent metrics for these factors (Bianchi et al., 2024). Nevertheless, to provide architects and urban designers with deeper insights into the possible effects of their proposals on health and wellbeing, it may be necessary to quantify design factors in combination with one another rather than independently. The idea of assessing combinations of factors is supported by the following observations:
1. Wellbeing is a multifaceted concept that relates to human experience (Altomonte et al., 2020), and people's everyday experience in the built environment appears to be the product of a combination of factors (Peri Bader, 2015; Lee and Kim, 2020; Kirsh, 2023). For example, people experience tranquility not when they are (a) free of distraction, (b) sitting in a half-hidden area, or (c) surrounded by nature, but rather when all three conditions are met. Other kinds of experiences require different combinations of factors to be present.
2. Some design factors appear to be desirable in certain places, yet undesirable in others. Peaceful activities like reading may be enhanced by (a) a degree of enclosure and (b) a separation from major pathways, yet these same factors may discourage social interaction. A score for either of these factors might therefore show little overall correlation with wellbeing, yet a score that combines these factors with others may show that they are important in the right context.
3. In addition to satisfying objectively measurable, performance-based criteria such as the requirements found in the WELL Standard (IWBI, 2015), there appears to be an expectation that well-designed buildings and neighborhoods exhibit some form of overall aesthetic, balance, coherence, harmony, or wholeness that pertains to how spaces and elements “fit” with one another and the surrounding environment (Alexander, 1979; Jakupi, 2016; Hazbei and Cucuzzella, 2021). In a recent study that asked participants to rate their homes and offices on temperature, noise, privacy, and several other attributes, the “overall aesthetics” rating was found to be the top predictor of work performance (Srivastava et al., 2024). A shift in focus from individual factors to combinations of factors might help researchers characterize this notion of overall harmony, and better understand its importance.
The aim of our research is to take a first step toward (1) quantifying combinations of design factors using spatial analysis, and (2) using the resulting scores to predict the experiential qualities of places within proposed or existing buildings or urban developments. Experiential qualities are typically characterized by moods or feelings such as “gloomy, tense, cheerful, melancholic, serene, cozy, inviting” (Van Oosterwyck, 2018). However, we interpret an experiential quality not as the mood or feeling it is named after, but rather the tendency for a place to evoke that mental state over the course of everyday life. This tendency depends on people's psychological response to the appearance of the place as well as any non-visual stimuli present at that location (Coburn et al., 2020; Gregorians et al., 2022; Alamirah et al., 2022). It also depends on the type, frequency, and duration of individual and group activities that will likely occur there, which in turn depends on how that place is situated within a building or community. Experiential qualities have previously been measured using onsite surveys (Breiby and Slåtten, 2018; Zamanifard et al., 2019). These surveys employ multiple questions to score each experiential quality, which is consistent with the observation that everyday experience is the product of a combination of factors. Our method of measuring experiential qualities is similar, except that instead of combining participants' responses to multiple survey questions, we combine the results of multiple spatial analyses. Although it should be possible to adopt a data-driven approach and derive these metrics from people's subjective evaluations of scenes (Wiener and Franz, 2005; Gath-Morad et al., 2024), we rely on theoretical best practices as a starting point while envisioning the future incorporation of behavioral, experiential, and wellbeing data.
To develop a theory-driven approach for scoring experiential qualities using spatial analysis, we propose, implement, and scrutinize a computational framework centered on the principle that habitable buildings should accommodate everyday activities by providing a mix of tranquil, social, and explorative places. These three proposed experiential qualities, and the combination of design factors that compose each, were chosen by identifying common themes across a selection of architectural design guides. To implement the framework, we (1) selected and refined a set of 3D apartment models from the Swiss Dwellings dataset (Standfest et al., 2022), (2) computed daylight and pathway density fields using a voxel-based analysis tool (Goldstein et al., 2023), (3) used the density fields to calculate place scores at various locations in the apartments, including scores for the individual design factors as well as a composite score for each experiential quality, and (4) aggregated the tranquil, social, and explorative place scores to obtain design scores for each apartment, including an overall balanced design score. We also conducted a crowd sourced online survey to obtain an analogous set of ratings from participants with backgrounds related to architecture. By comparing the algorithmic scores to the survey ratings in an exploratory fashion, we scrutinize the proposed experiential space analysis methodology and gain insights into both computational and crowd sourcing approaches for evaluating architectural models.
2 Proposed framework
This section introduces a computational framework centered around three experiential qualities: tranquil, social, and explorative. At this stage in the overall methodology, the computations that score the three qualities are described at a high level with emphasis on key principles rather than mathematical details. Different implementations of the framework will therefore yield different sets of scores for the same built environment, though the scores should exhibit similar patterns. After outlining the scope of the framework and the works that influenced it, we describe the three experiential qualities and explain how each can be scored as a composition of simpler factors amenable to spatial analysis.
2.1 Scope
The ultimate goal of the framework is to help practicing architects promote psychological and social wellbeing in habitable buildings by applying a set of spatial analyses in their projects as early as the schematic design phase. This objective determines the framework's scope, which we clarify by interpreting and elaborating on the following terms:
• Psychological and social wellbeing refers to people's quality of life over a period of several months or years, with an emphasis on their mental health, their tendency to experience positive emotions while engaging in everyday activities, and the frequency and quality of their interactions with family members, friends, neighbors, and peers (Watson, 2018; Colenberg et al., 2023). Frameworks designed to promote wellbeing often include a set of wellbeing indicators measured through self-reporting, biometrics, or behavioral observation (Douglas et al., 2022). While the proposed framework does not measure wellbeing, the goal of promoting wellbeing guided our selection of design factors and experiential qualities.
• Habitable buildings refers to “everyday” buildings in which people live, socialize, engage with their communities, or work in a context where they are relatively free to move around and take breaks when desired. Such buildings include houses, apartments, long-term care homes, libraries, community centers, child-friendly museums, typical offices, and most college and university campus buildings. Large outdoor areas like shopping streets and parks, crowded facilities like transportation hubs and popular tourist attractions, and process-driven facilities like factory floors and hospital emergency departments are not in scope.
• Space analysis involves the use of geometrical operations to gain insights into proposed or existing architectural or urban environments. The proposed framework employs spatial analyses related to daylight, walking and wheeling pathways, degrees of openness or enclosure, and visual and physical proximity. With a focus on near-range geometry, the framework does not factor in the aesthetics of distant views, the intended function of each room, or the adequacy of a building's HVAC system.
• Schematic design refers to the relatively early design phase at which architects begin producing spatial design proposals for building interiors and exteriors. We envision the proposed analyses being used while laying out spaces, interior and exterior walls and glazing, doorways, staircases, balconies, patios, courtyards, and other major features of habitable buildings. Fixtures such as kitchen cabinets should ideally be included in the analysis, while movable elements such as furniture and plants could potentially be included. Building layout is an aspect of the built environment that has been linked to both psychological and social wellbeing (Colenberg et al., 2021).
2.2 Influencing works
In choosing which design factors to measure using spatial analysis, we strove to set aside conventional metrics and rely as fully as possible on a review of best architectural practices within the framework's scope. Early in the process we identified two trends to serve as an initial direction for the investigation: (1) the link between biophilic design and wellbeing (Gillis and Gatersleben, 2015), and (2) the idea of introducing social cohesion into computational design (Kamalmaz, 2022). After reviewing numerous books, papers, reports, websites, videos, and standards, we subjectively singled out the following works as representative of the principles and schools of thought that influenced the design of the framework:
• A Pattern Language (Alexander et al., 1977) is a classic text providing extensive observations on how to design and construct towns and buildings with the aim of making people “feel alive and human”. The book is structured around 253 numbered “patterns” of varying scale, such as SMALL PUBLIC SQUARES (61), LIGHT ON TWO SIDES OF EVERY ROOM (159), and PAVING WITH CRACKS BETWEEN THE STONES (247), that draw inspiration from traditional rather than modernist examples of real-world architecture. We found that the authors' strong preferences and attention to detail eased the task of identifying common themes, which we could then compare with other sources of design advice.
• The Practice of Biophilic Design (Kellert and Calabrese, 2015) is one of several introductory references that espouse the physical, psychological, and social benefits of incorporating nature into the built world, whether (1) directly in the form of environmental features such as daylight and indoor plants, (2) indirectly in the form of elements representing nature such as wood finishing and nature-inspired artwork, or (3) by recreating the spatial characteristics of the natural habitats in which humans evolved. We also made use of 14 Patterns of Biophilic Design (Terrapin Bright Green, 2014), a report that presents biophilic design principles as a list of patterns similar to that of A Pattern Language.
• Design Guide for Long Term Care Homes (Wrublowsky, 2018) is a comprehensive report on how to design personal care homes that, in addition to providing shelter and protection, contribute to residents' quality of life and sense of purpose. Though focused on eldercare, the themes and recommendations in this report overlap significantly with those in the more general references above. We also made use of senior housing design guides striving to promote psychological and social wellbeing in the context of the COVID-19 pandemic and its aftermath (MASS Design Group, 2020; Verderber, 2022).
2.3 Experiential qualities of places
An experiential quality of a place is the tendency of that place to give rise to an experience in a real-world context. Broadly speaking, that evoked experience can be positive or negative, physical or psychological, fleeting, or sustained. In the proposed framework, our focus is on positive psychological experiences—best described as moods or feelings—that last roughly as long as a person spends time in that place.
In the current context, a place is an area sufficiently small that its experiential qualities are more-or-less uniform throughout. We argue that spaces with names, such as a “town square” in a city or a “living room” in a residence, should usually be treated not as a single place but rather as a collection of places, since the circulation routes, gathering areas, and quiet corners within with these larger spaces have different spatial characteristics and may give rise to different experiences. For example, a square-shaped living room may be treated as having 4, 9, or 16 places, depending on its size.
The three experiential qualities of the proposed framework are based on a principle derived from the influencing works, which is that habitable buildings should provide a mix of tranquil, social, and explorative places. The meaning of these experiential qualities can be inferred from a set of reference examples as well as general descriptions that associate each quality with certain types of experiences and activities (Figure 1). Despite the wide range of everyday activities people undertake in habitable buildings, the premise of the framework is that almost any such activity is best accommodated by either a tranquil, social, or explorative place.

Figure 1. A reference example and general description for each of the three experiential qualities.
2.4 Composition of spatial metrics
The spatial metrics in this framework attempt to score various locations in a model of a habitable building on how tranquil, social, and explorative the corresponding real-world places will likely be over the course of everyday life. This scoring challenge is tackled using a compositional approach based on the observation that everyday experience is a product of a combination of factors. Instead of directly crafting a series of geometric operations that result in tranquil, social, and explorative scores, each of these qualities is decomposed into design factors that have a simpler and more obvious spatial interpretation (Figure 2). These factors are evaluated using spatial analysis, and the resulting place scores are combined to yield composite scores for each experiential quality. The remainder of this section describes the factors that contribute to the Tranquil, Social, and Explorative place scores, as well as the design scores that aggregate the location-specific results.
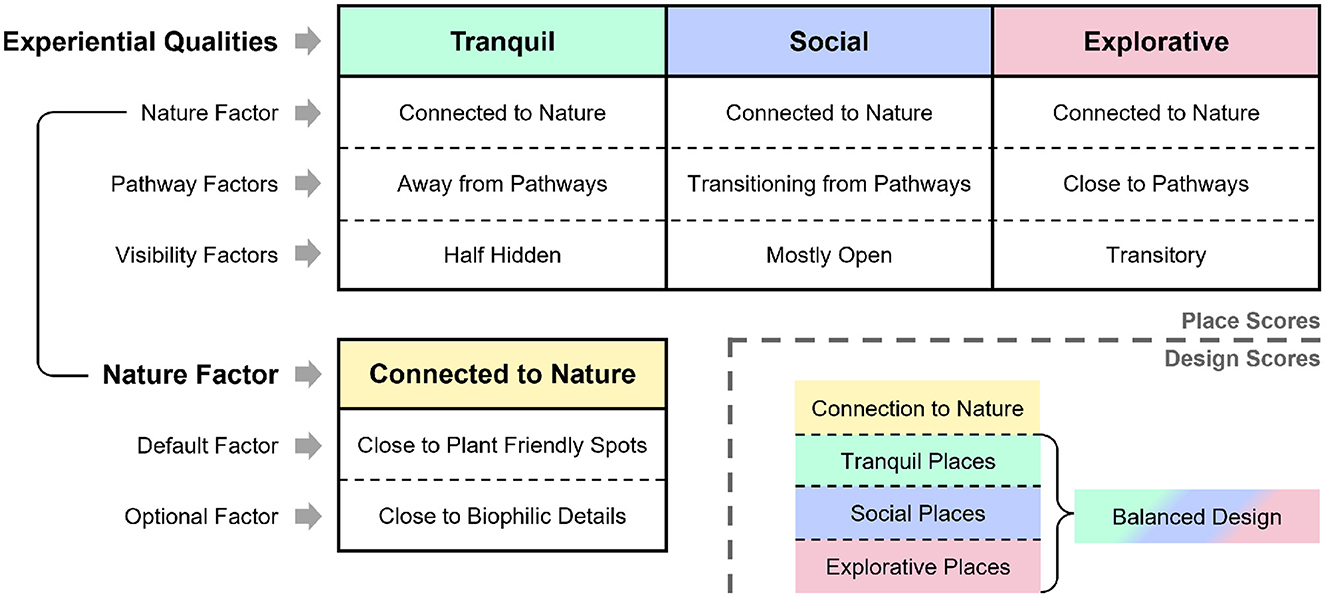
Figure 2. Composition of the proposed metrics. The upper table of place scores indicates how the three experiential qualities are each composed of three factors. The lower left table of place scores indicates how the nature factor is itself composed of two factors. The place scores can be aggregated to produce five overall design scores, shown at the bottom right.
The nature factor, Connected to Nature, is the only factor in the framework that contributes to all three experiential qualities. It is also the only factor that is itself a combination of factors. The two components of Connected to Nature are described below:
• Close to plant friendly spots strives to measure the closeness of a place to spots where plants could potentially thrive. It is assumed that such spots should be daylit, so this factor addresses the widespread endorsement of natural light. It is also assumed that these spots must be accessible so that the plants can be watered and attended to, though ideally they would not be placed in the middle of a frequently traveled pathway where they might disrupt people's movement. The Close to Plant Friendly Spots score is primarily influenced by the idea of providing a direct experience of nature, as described in The Practice of Biophilic Design and similar works.
• Close to biophilic details is similar to Close to Plant Friendly Spots, except that it (a) measures closeness to actual plants instead of the potential for plants, and (b) includes other biophilic elements such as natural and nature-inspired materials, colors, and decor. This factor rewards efforts to provide both a direct and indirect experience of nature as described in The Practice of Biophilic Design. The use of wood in the Tranquil reference example (Figure 1), the green panel on the back wall in the Social example, and the patterning in the door in the Explorative example could all be considered biophilic elements. However, since these details may not be modeled during the schematic design phase, Close to Biophilic Details should be considered an optional component of the framework.
The pathway factors can be conceptualized as partitioning a habitable environment into three types of places: (1) those away from frequently traveled pathways, which are ideally tranquil; (2) those transitioning from pathways, which are ideally social; and (3) those close to pathways, which are ideally explorative. However, instead of creating discrete regions, the computation should produce a relatively smooth gradient from frequently traveled to less traveled areas, similar to INTIMACY GRADIENT (127) from A Pattern Language. The three pathway factors are described below:
• Away from pathways measures the degree to which a place is separated from frequently traveled routes, suggesting fewer disturbances from passersby and therefore contributing to a higher Tranquil place score. In the context of this framework, a “pathway” should be interpreted not as a space that would be designated as a circulation area, but rather an area that pedestrians would frequently pass through on a typical day. For example, although a tranquil sitting place may reside beside a walking path (Figure 1), the analysis should only treat the route as a pathway if its placement within the larger environment suggests that it will be frequently traveled.
• Transitioning from pathways measures the degree to which a place is situated off to one side of a frequently traveled route, giving passersby the opportunity to join those in the space and therefore contributing to a higher Social place score. The idea of having circulation paths run tangent to gathering areas is strongly recommended in COMMON AREAS AT THE HEART (129) from A Pattern Language, and reiterated in THE FLOW THROUGH ROOMS (131) and CORNER DOORS (196). A similar principle can be found in Design Guide for Long Term Care Homes: “Activity spaces are kept open to circulation paths so that residents can see what's going on and more easily get involved.”
• Close to pathways measures the degree to which a place is on a frequently traveled route. In many habitable buildings, particularly office environments, people spend only a small fraction of their time traveling from one place to another. Nevertheless, the need for a positive experience during these brief transition periods is given considerable attention in the design guides that influenced this framework. We include the Close to Pathways score so that it can be combined with other factors that collectively evoke this positive experience, which we named “explorative” for lack of an established term.
The visibility factors characterize the mix of openness and enclosure surrounding a place. The analysis should account for both visual and physical obstacles as different forms of enclosure, with clear glazing treated as a physical obstacle but not as a visual obstacle. The three visibility factors are described below:
• Half hidden characterizes the degree to which a place is sheltered by some form of enclosure on at least one side, yet mostly open in another direction. Balancing a person's desire to be aware of their surroundings with their aversion to feeling exposed, this type of setting promotes a feeling of security and therefore contributes to a higher Tranquil place score. A balance of openness and enclosure is a recurring theme in A Pattern Language, with relevant patterns including HALF-HIDDEN GARDEN (111), HIERARCHY OF OPEN SPACE (114), and HALF-PRIVATE OFFICE (152) among others. The concept of “prospect and refuge” from The Practice of Biophilic Design is also related.
• Mostly open characterizes the degree to which a place is either open or slightly enclosed, but not highly enclosed. Since excessive enclosure could make a place uncomfortable for multiple people to occupy at the same time, the Mostly Open factor contributes to a higher Social place score.
• Transitory characterizes the degree to which a person's surroundings change as they move along a frequently traveled route. Contributing to a higher Explorative place score, this factor is closely related to the concept of “Mystery” in 14 Patterns of Biophilic Design: “Mystery characterizes a place where an individual feels compelled to move forward to see what is around the corner; it is the partially revealed view ahead.” In addition to this aesthetic quality, pathways with uniqueness and variety may help people experiencing cognitive impairment remember how to get where they are going and recognize when they have arrived. “Spatial situations and places should not be repeated,” according to Design Guide for Long Term Care Homes. Similar themes also appear in ENTRANCE TRANSITION (112), SHORT PASSAGES (132), and ZEN VIEW (134) from A Pattern Language.
All of the place scores should be evaluated at every place in a proposed design, which may consist of an entire habitable building or part of a building. Although these place scores are intended to provide useful insights in their own right when displayed upon a floor plan or 3D model, it is also possible to aggregate them into a set of design scores representing the overall quality of the entire design:
• Connection to nature aggregates the Connected to Nature scores of the evaluated places into a single overall score. It is worth noting that the proposed framework uses descriptive phrases like “connected to nature” for place scores, and noun phrases like “connection to nature” for design scores.
• Tranquil places, Social places, and Explorative places approximate the degree to which a suitable proportion of places have high Tranquil, Social, or Explorative scores, respectively.
• Balanced design approximates the degree to which there is a suitable balance of places with high Tranquil, Social, and Explorative scores, meaning that a diversity of everyday activities will likely be accommodated. Ideally, the Balance Design score should also reflect a notion of harmony in the layout of a building that might further promote the wellbeing of its inhabitants.
3 Materials and methods
Here we outline our implementation of the experiential space analysis framework proposed in Section 2. Any independent effort to implement the framework will end up differing in the mathematical details of the scoring algorithm, the types of buildings used for testing, and other aspects of the approach. Nevertheless, the basic methodology involves preparing a dataset of habitable building models, computing density fields for pathways and daylight, and calculating the place scores and design scores defined in Section 2.4. The process should also involve identifying or collecting at least one dataset from an alternative methodology that can be used to scrutinize the algorithm's scores. In our case, we collected a dataset of conventional and experiential ratings via a crowdsourced online survey.
3.1 Dataset
A dataset of habitable building models is needed to calibrate and test the algorithm that performs the spatial analyses and outputs the scores proposed in Section 2.4. We used the Swiss Dwellings dataset (Standfest et al., 2022), which contains 3D geometry for over 45,000 apartments based on existing plans of roughly 3,100 buildings. To support an exploratory comparison of the algorithm's scores with ratings from the survey, we curated a diverse set of 20 apartments from this dataset (Figure 3). Although the proposed framework is intended for a wider range of habitable buildings including detached houses, offices, and community centers, the Swiss Dwellings apartments provided a diversity of floor layouts and served as a reasonable starting point for experimentation.
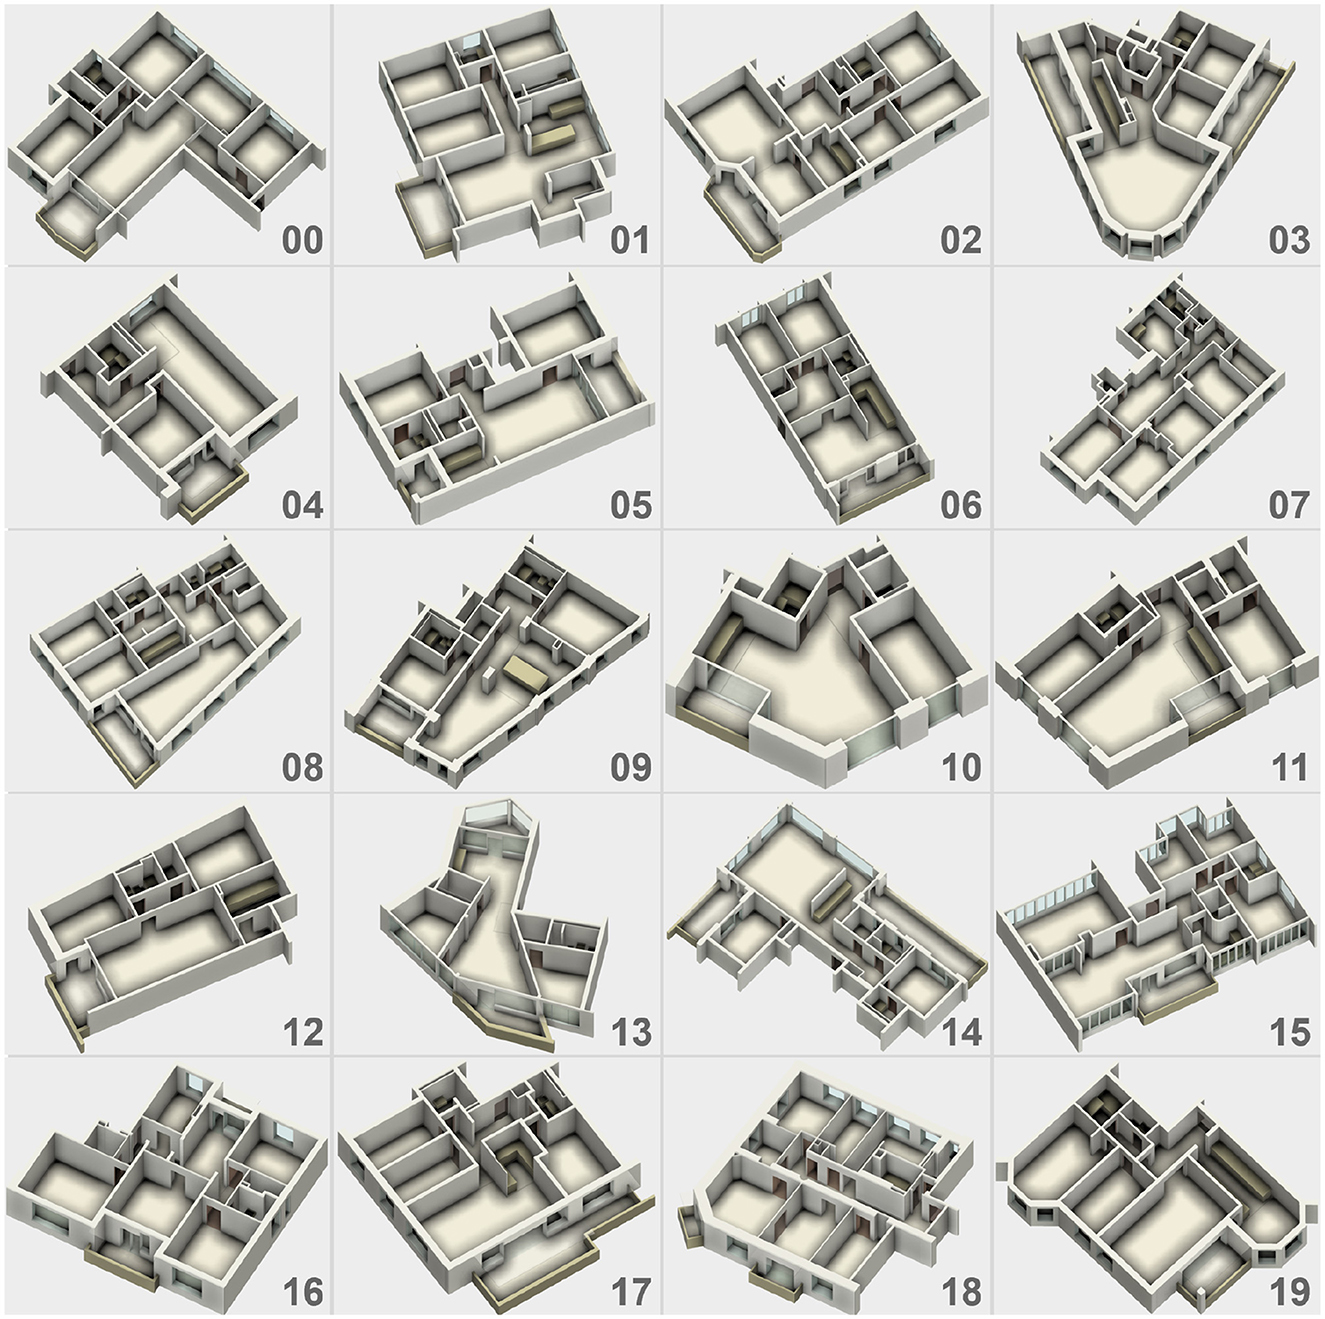
Figure 3. The 20 apartments curated from the Swiss Dwellings dataset to be scored by the algorithm and evaluated by survey participants. The projections have been independently scaled such that small apartments like 04 and 10 are “zoomed in” relative to large apartments like 15 and 18. The ratings and scores can be found in Table 2.
For each apartment investigated, several categories of elements were extracted from the dataset to produce a 3D model for analysis (Figure 4). These categories included (1) floors; (2) walls; (3) doors, some of which were labeled as entrance doors; (4) windows; (5) coarse representations of permanent fixtures including balcony railings, kitchen cabinets, bathroom sinks, toilets, bathtubs, and shower stalls; (6) ceilings; and (7) balcony coverings, based on the assumption that each balcony is shaded by an identical balcony above. The Swiss Dwellings dataset does not specify whether each door is opaque or glazed, or whether the element is in fact an open doorway with no door at all. To minimize the risk of underestimating daylight, we assumed any door adjacent to a balcony, terrace, or loggia to be glazed. Entrance doors and doors adjacent to bathrooms, bedrooms, or storerooms were assumed to be opaque. Any other door element was assumed to be an open doorway between common areas.
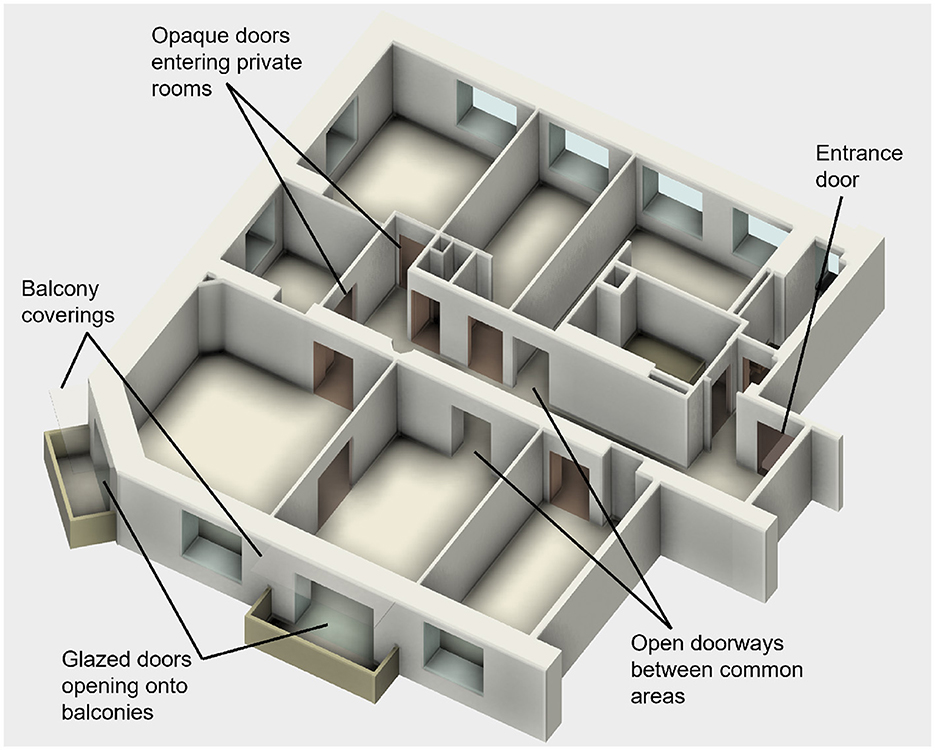
Figure 4. A 3D apartment model from the Swiss Dwellings dataset (apartment 18 within the curated set). The annotations highlight aspects of the dataset about which assumptions were made. The balcony coverings are shown as faint translucent elements, both here and in several other figures, though they were treated as opaque in the analysis and shown as opaque in the online survey. To provide survey participants with clear visuals, we cleaned the models by trimming off small pieces of adjacent apartment units.
3.2 Density fields
Once the building geometry is available in a suitable form, the first significant task in computing the proposed experiential quality scores is to produce density fields for daylight and pathways. These 3D fields fill a portion of the building's accessible space above the floor, around the walls, and around and above fixtures (Figure 5). Daylight density approximates the degree to which indirect sunlight will tend to pass through a volume of space. For the apartment models, high levels of daylight density occur close to windows, and even higher levels arise on the outdoor balconies. Pathway density approximates the degree to which people will tend to pass through a volume of space as they move from one place to another. Regions of high pathway density often coincide with corridors and other designated circulation areas, but they can also flow along the outer edges of rooms or cross directly through open spaces.
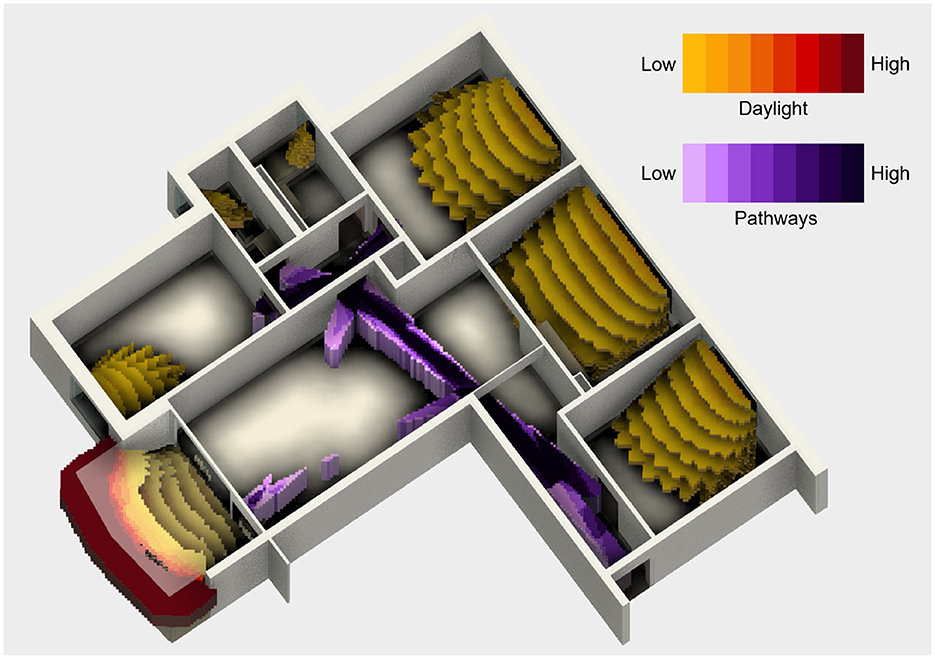
Figure 5. Voxel-based daylight and pathway density fields shown within the initial polygon-based geometry of an apartment model (apartment 00).
To produce the density fields, we first converted the building geometry into a set of binary voxel models. These voxel models are regular 3D grids of box-shaped 3D pixels called voxels, where each voxel is either empty or filled. We used voxels measuring 6.25 cm along the horizontal axes and 25 cm vertically, and we created a separate voxel model for each category of elements listed in Section 3.1. While it is possible to operate directly on the polygons of the initial building geometry (Schwartz, 2021), voxel models provide a uniform representation for both visibility and accessibility analyses (Azadi et al., 2024). We employed a tool called Voxel-based Architectural Space Analysis (VASA), which supplies the Dynamo visual programming environment with voxel model operations that can be chained together to craft complex algorithms (Goldstein et al., 2023).
To produce the daylight density field, all voxel models representing opaque building elements were merged into a single visual voxel model. Visibility analyses were then performed in 102 downward-angled directions with zenith angles ranging from 0 to 60 degrees and azimuthal angles equally distributed over 360 degrees, resulting in 102 overlapping voxel models representing potentially daylit regions of 3D space. The daylight density model was then generated as a 3D histogram of these voxel models. The lowest daylight density level included voxels visible from at least 3 of the 102 directions, whereas the highest level included voxels visible from at least a quarter of the directions. Future implementations of the proposed framework could incorporate more sophisticated daylight calculations accounting for sun position, cloud cover, surrounding context, and reflections off surfaces (Ayoub, 2019).
To produce the pathway density field, all voxels models representing barriers to travel were merged into a single physical voxel model. Shortest paths were then calculated between a set of source points, the points from which distance fields are computed (Danielsson and Lin, 2003), and a set of sample points, the points from which paths are generated by following each distance field back to its source. All of these points were obtained using the sample point generation feature provided by the VASA package, which reduces the risk of low-resolution sampling by roughly aligning points with nearby walls rather than the axes of the coordinate system. The source points were spaced roughly 3 m apart and the sample points were spaced roughly 1.5 m apart. Each path was itself represented as a voxel model, expanded horizontally to a diameter of roughly 7 voxels (43.75 cm) to ensure sufficient overlap with other paths, and expanded vertically to height of 5 voxels (1.25 m) to encompass most of a moving person's volume. The pathway density field was then generated as a histogram of all of these voxelized and expanded paths, though we found that this technique required carefully selected thresholds and a slight trimming of the paths to produce a clean result. The pathway density field resembles the output of a betweenness centrality analysis (Freeman, 1977), which has previously been applied to the Swiss Dwellings models (Standfest, 2022).
Future implementations of the framework could account for movable furniture and other interior design elements, which would restrict areas of high daylight density while narrowing and concentrating areas of high pathway density. An interesting strategy would be to employ modern AI technology to generate a diverse set of plausible interior design configurations. The full analysis could then be run for each configuration, and the results could be aggregated to produce a single set of scores. Some architects may still prefer to analyze unfurnished layouts, in which case the lack of furniture should be considered as a source of error when interpreting the results.
3.3 Place scores
Once the daylight and pathway density fields are available, the place scores specified in Section 2.4 can be calculated. We implemented all of the place scores except the optional Close to Biophilic Details, since the Swiss Dwellings models do not include plants, material finishes, nature-inspired decor, or other elements needed to compute this factor. To determine which places would be evaluated in each apartment, we repurposed the sample points generated at roughly 1.5 m spacing for the pathway density field.
The spatial analysis techniques described below were used to calculate the place scores for the seven factors that compose the three experiential qualities. Analogous techniques were first pioneered by the Space Syntax community (Hillier et al., 1976), though with a focus on seeking mathematically elegant theories of society (Hillier et al., 1993; Haq, 2019). By contrast, we were willing to employ complex chains of operations to produce scores that reflected the principles derived from the influencing works. All geometric operations were performed by applying VASA's voxel-based algorithms using the same 3D grid that was employed to compute the density fields.
1. Two regions were computed for each place: (1) the region visible to a person at that point, also known as an isovist (Turner et al., 2001), but within a prescribed radius; and (2) the region accessible to the person within a given walking or wheeling distance. We limited these regions to 6 m from the sample point for all factors except Close to Pathways, where a limit of 3 m was used. The visible regions were computed from viewpoints located 4 voxels (1 m) above those containing the floor, a compromise between sitting and standing eye levels for people of different ages and heights. Almost all calculations were repeated for both types of regions, after which the two resulting scores were averaged into one. In most cases, the visual score obtained from the visible region was given twice the weight of the physical score obtained from the accessible region. For Close to Plant Friendly Spots, the weighting was 3:1 in favor of the visual score. For Half Hidden and Mostly Open, the accessible region was replaced with a region both visible and accessible.
2. For each place and associated region, a single number was obtained by performing an integration across the region's visible and/or accessible voxels. The daylight density field was integrated to compute the Close to Plant Friendly Spots factor, the pathway density field was integrated to compute the three pathway factors, and the region itself was integrated to compute the three visibility factors. In the vertical direction, voxels were weighted according to the list of coefficients , prioritizing voxels near eye level over those near the ceiling or floor. In the radial direction, voxels were weighted according to various falloff functions, the default being with r representing the radial distance that ranges from 0 to rmax (6 m, in most cases).
3. For Close to Plant Friendly Spots, Close to Pathways, and Mostly Open, the number obtained through integration was converted into a score by applying an arbitrary multiplier, truncating the result to keep it between 0 and 1, and applying the default scoring function f defined in Equation 1. Away from Pathways was also computed in this manner, but the output was reversed so that higher pathway density would result in lower scores. The purpose of f was to ensure smoothly varying scores that level out at the high and low ends of the scale.
4. For Transitioning from Pathways, the average gradient of the pathway density field was computed across each visible or accessible region. The resulting gradient score was combined with the reversed Close to Pathways score to favor places beside a pathway yet not directly in the pathway.
5. For Half Hidden, the Mostly Open score was transformed so that the peak value would lie between the fully enclosed and fully open ends of the spectrum. The result was then combined with a score derived from the gradient of the visible region, reflecting the principle that a person's view should be skewed toward one direction.
6. Transitory was the most complex factor to implement, requiring the generation of a connectivity graph in which each place is connected to all other places within a 6 m walking distance. Since the principle behind this factor is that a person's surroundings should change as they move through an environment, the key step was to compute the difference in the geometries of the visible regions for every pair of neighboring places. These differences were weighted based on proximity, prioritizing pairs of places connected by frequently traveled pathways and not separated by doors. Similar computations have been proposed to measure a factor called “revelation” in previous work (Wiener and Franz, 2005).
The above calculations involved a number of multipliers and other arbitrary parameters that had to be calibrated to ensure that the place scores reflected the principles derived from the influencing works, and that they were reasonably distributed between 0 and 1. The calibration was performed by examining the place scores generated within certain areas of some of the apartments where the building geometry was relatively simple, and where this geometry clearly exemplified or contradicted the intent of at least one of the factors (Figure 6). For example, since long and narrow double-loaded corridors are known to contradict the principle that motivated the Transitory factor, the parameters of the Transitory calculations were adjusted to scale down the scores in these types of spaces. At the same time, it was important that the Transitory scores not be scaled down to such a degree that there would be no high-scoring places in any of the evaluated apartments.
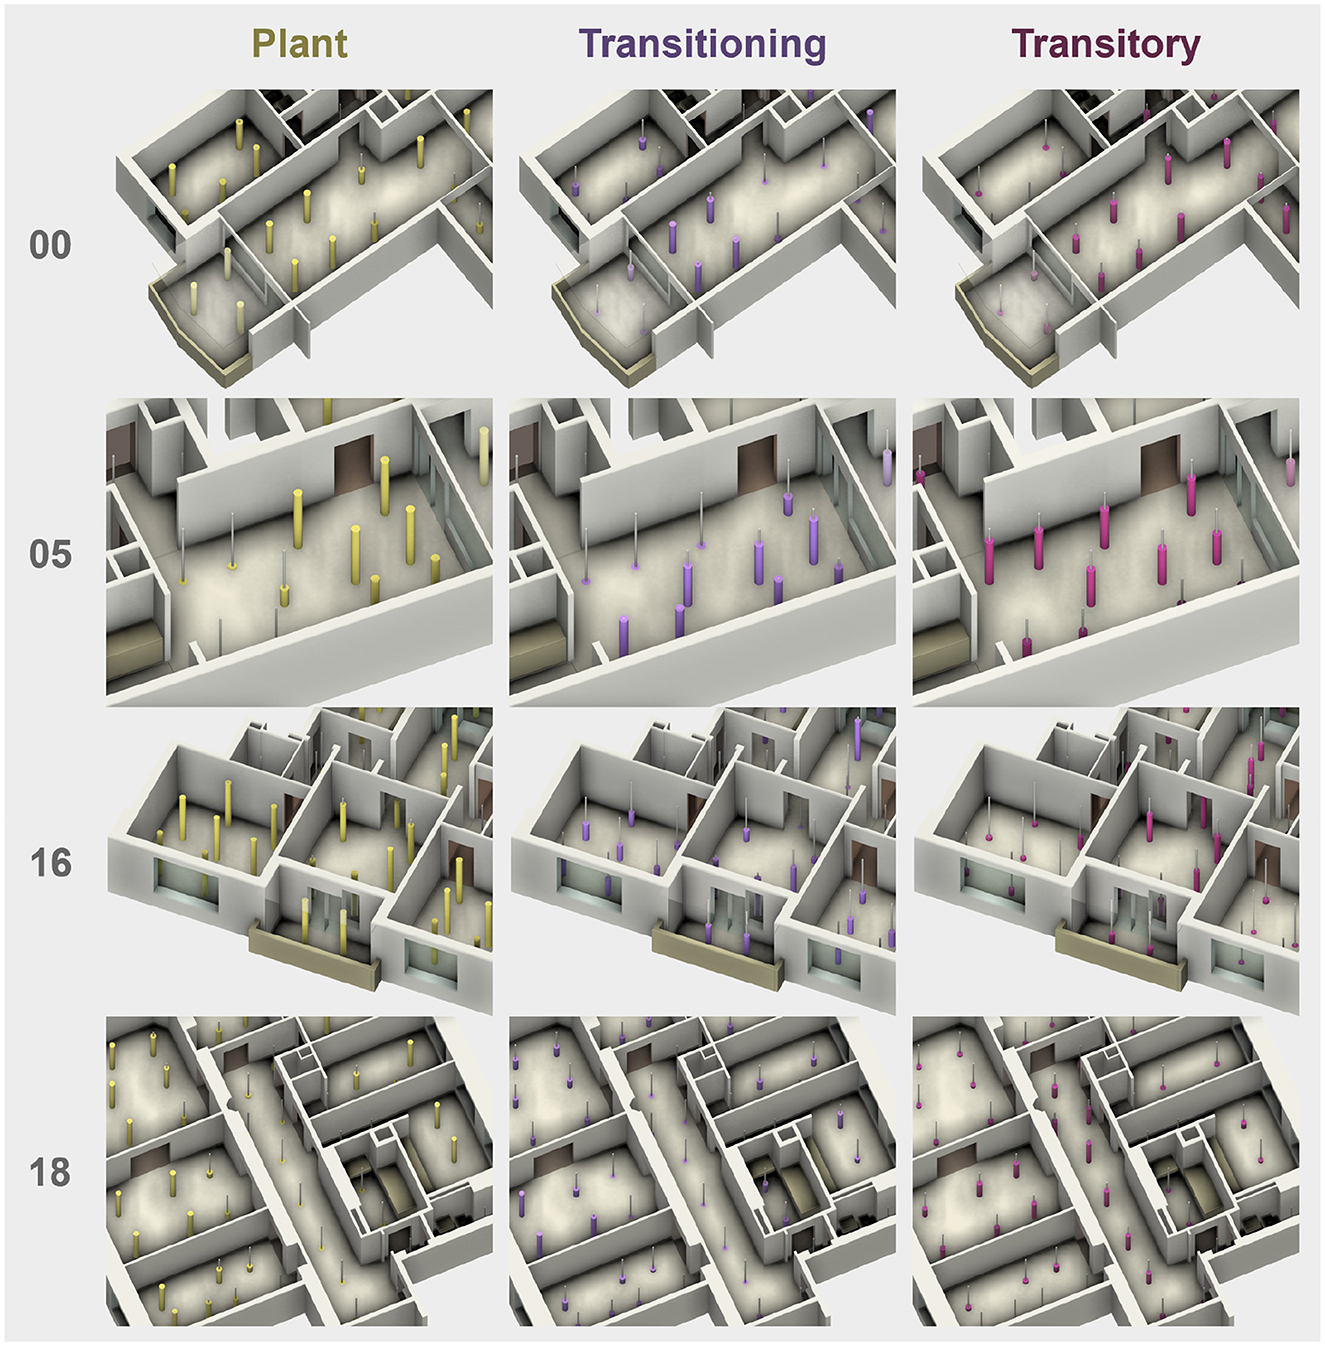
Figure 6. Visualization of selected place scores in some of the spaces that were found useful for calibration. For example, the Close to Plant Friendly Spots (Plant) results were scaled up to yield high scores in places with at least a modest amount of daylight nearby, yet also scaled down to ensure a somewhat gradual falloff from the glazed sides of the rectangular living rooms in apartments 00 and 05. The Transitioning from Pathways (Transitioning) results were scaled up to yield high scores opposite a pathway in the living room of apartment 05, yet also scaled down to prevent excessively high scores in the bedrooms of apartment 16. The Transitory results were scaled up to ensure at least a few high scores in a number of the apartments, yet also scaled down to prevent excessively high scores along the double-loaded corridor of apartment 18.
The place scores for the three experiential qualities were calculated by combining the place scores for the various factors according to the composition proposed in Section 2.4. The composite scoring functions are specified in Equation 2, where for place i, the Tranquil (tranquili), Social (sociali), and Explorative (explorativei) scores are obtained by applying the default scoring function of Equation 1 to a weighted average of the scores for Close to Plant Friendly Spots (planti), Away from Pathways (awayi), Transitioning from Pathways (transitioningi), Close to Pathways (closei), Half Hidden (halfi), Mostly Open (mostlyi), and Transitory (transitoryi), raised to the power of some exponent. The weighting coefficients emphasize certain factors over others, prioritizing Close to Plant Friendly Spots, Transitioning from Pathways, and Transitory as the most significant components of Tranquil, Social, and Explorative places, respectively. Close to Pathways was assigned a low weight since the factor was somewhat integrated into the Transitory scores.
The weighted averages in Equation 2 are reduced when raised to the power of 2.00, 1.75, or 1.50, increasing the importance of having multiple factors present when striving to achieve a high score for an experiential quality. Interviews with architects and interior designers suggested that tranquil experiences demand the presence of certain factors to a greater extent than the other qualities, whereas explorative experiences can be achieved in a wider variety of ways. We chose the three exponents to reflect this belief.
3.4 Design scores
The final step in the implementation of the scoring algorithm is to aggregate the place scores to produce the overall design scores proposed in Section 2.4. Since the only component of Connected to Nature we implemented was Close to Plant Friendly Spots, the average of these place scores serves a role similar to the Connection to Nature design score. The remaining design scores—Tranquil Places (tranquil), Social Places (social), Explorative Places (explorative), and Balanced Design (balanced)—are formalized by the optimization problem in Equation 3.
The key concept underlying this formulation is that a habitable building need not be tranquil, social, and explorative everywhere, but should rather exhibit a certain proportion of places that score highly on each of these qualities. Visual inspection of the apartments with high place scores suggested that roughly half of places should be highly Tranquil, a quarter of places should be highly Social, and a fifth of places should be highly Explorative. Lacking any definitive recommendation on the ideal proportion of tranquil, social, and explorative places, we decided to adopt these simple fractions. The remaining 5% of places was ignored, as we assumed most habitable buildings include a small amount of storage or utility space that need not diminish the overall scores.
The optimization problem in Equation 3 states that the places in a building should be apportioned into tranquil, social, and explorative buckets such that (a) each bucket ends up with the prescribed proportion of places; (b) the average place score in each bucket becomes the associated design score, either Tranquil Places, Social Places, or Explorative Places; (c) the average of these three design scores becomes the Balanced Design score; and (d) the Balanced Design score is maximized. To enhance the robustness of the optimization, each place is permitted to be chopped into parts so that one fraction may contribute to one bucket while other fractions contribute to other buckets. The optimization procedure is best carried out using an established technique such as simulated annealing (Kirkpatrick et al., 1983). For this investigation, however, we felt it sufficient to solve Equation 3 by apportioning places in a sequential manner based on a heuristic.
Unlike the place scores, where we found it necessary to engage in an iterative calibration process informed by the principles of the framework, the design scores were produced according to a strict sequence of steps: first, a complete set of place scores for the 20 apartments was deemed final and not subsequently changed; second, the optimization problem was decided upon and not subsequently changed; third, the design scores were computed. By following these steps, we deliberately prevented ourselves from observing the design scores of the various apartments and then adjusting those scores via further calibration to better reflect our personal preferences. A few of the design scores ended up surprising us, but the formula in Equation 3 was never altered in response. The final set of design scores can be found in Section 4.2.
It is worth noting that the apartments receiving the highest Balanced Design scores invariably exhibited a gradient of high place scores. This gradient consisted of high tranquil place scores toward the outside of the apartment, blending into one or two clusters of high social scores further in, blending into a single cluster of high explorative scores that we refer to as the apartment's explorative center. For example, the Tranquil, Social, and Explorative place scores of the three highest scoring apartments strongly featured this gradient, whereas the lowest scoring apartment was among several that lacked the social and explorative components of this pattern (Figure 7). We also noticed that while the explorative center often coincides with a central circulation area, it is sometimes skewed toward one side of the apartment, and sometimes appears in the living room, the dining room, or even the kitchen.
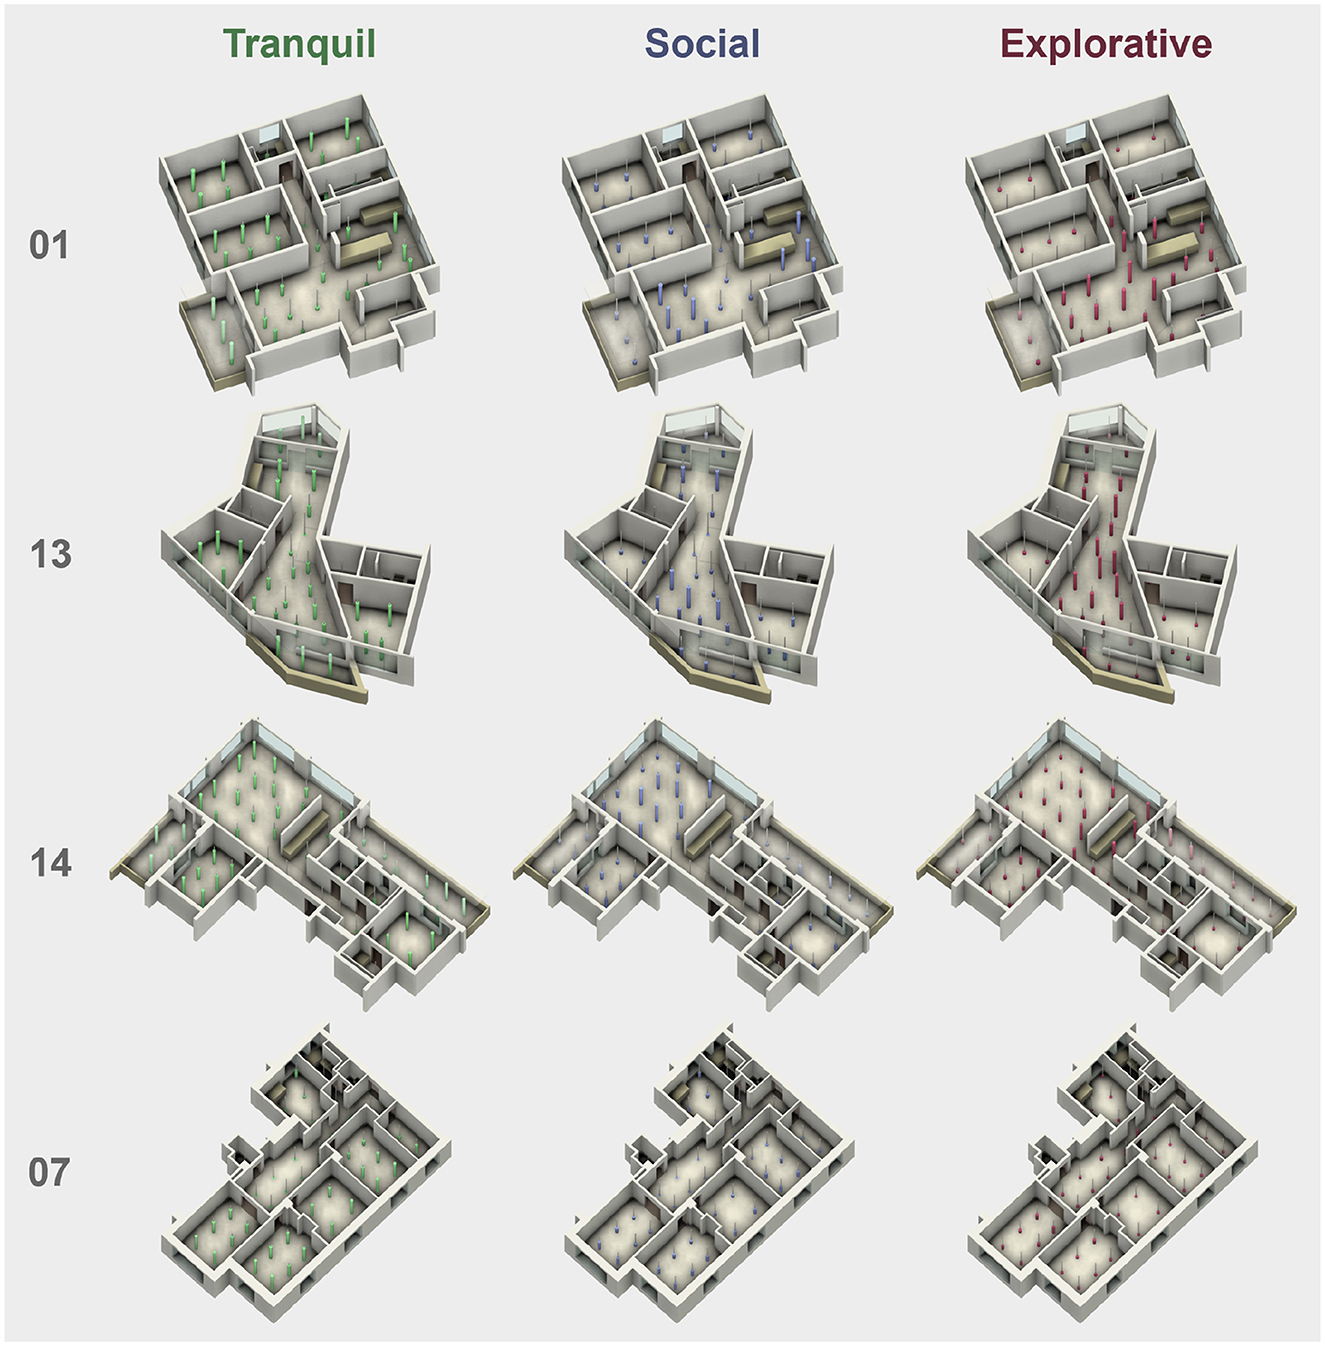
Figure 7. Visualization of Tranquil, Social, and Explorative place scores for the three apartments that scored the highest for Balanced Design (apartments 01, 13, and 14), and the apartment that scored the lowest (apartment 07). As in these examples, high scoring apartments tend to feature a gradient transitioning from high Tranquil, to high Social, to high Explorative place scores. Low scoring apartments tend to lack part of this gradient, such as the centrally located social or explorative clusters of high scores.
3.5 Survey
Although interesting observations can be made by visualizing the algorithm's scores on their own, a complete implementation of experiential space analysis should include a comparison with at least one analogous set of scores obtained by a different method. One such method could be to select a small number of professional designers to rate the building models and explain their reasoning. A more resource-intensive method could be to recruit participants who live, work, or frequently spend time in the evaluated buildings, and record various indicators of their short-term moods and long-term wellbeing. Inspired by previous crowd sourced studies characterizing human experience in built environments (Ergan et al., 2018; Coburn et al., 2020; Altaf et al., 2022), we opted for an online survey capable of generating a statistically significant sample of ratings without radically increasing the scale of this research. To prevent the survey results from influencing the algorithm, we ensured that the algorithm's scores were completely finalized before collecting any ratings from survey participants. All ratings were made using a 5-point Likert scale with options labeled “Very Poor,” “Poor,” “Neither Poor nor Good,” “Good,” and “Very Good,” which we later translated into numbers from 1 to 5. The survey progressed through the following segments:
1. Each participant rated five 3D models selected randomly from the full set of 20 apartments. The models appeared as shown in the figures of this paper (Figure 4), and participants were encouraged to rotate, pan, and zoom in or out on these models to get a better view. At this stage, the models were rated according to three criteria: Functionality, Aesthetics, and Overall Rating. The purpose of this initial part of the survey was to collect a set of conventional ratings from participants before they were exposed to the proposed framework.
2. The experiential qualities of the framework were introduced via a series of pages throughout which each participant was asked to rate a total of ten first-person images of indoor and outdoor built environments. The ten images were selected randomly from a set of 100 that we curated from the stock photo service iStock and accessed for use via a subscription. Participants rated the images on the three experiential qualities: Tranquil, Social, and Explorative. They were given a general description of each quality (Figure 1), but no reference examples or contributing design factors were provided. Though not part of the main comparison between algorithm and survey results, the image ratings and associated discussion can be found in the Supplementary material.
3. After being introduced to the experiential qualities, each participant was shown the same five 3D models they had previously evaluated on the conventional metrics, and re-evaluated them on the four criteria mirroring our algorithm's design scores: Tranquil Places, Social Places, Explorative Places, and Balanced Design.
4. Each participant then viewed a series of five 3D models in which a 3D marker pinpointed a single location to be rated. These five locations were selected randomly from a set of 20 places, distributed within two relatively complex apartments, that we had chosen for comparing the algorithm's place scores to the participants' ratings (Figure 8). Participants rated each location on the three qualities: Tranquil, Social, and Explorative.
5. The final page contained questions about participants' experience taking the survey, their professional background, and, optionally, their age and gender.
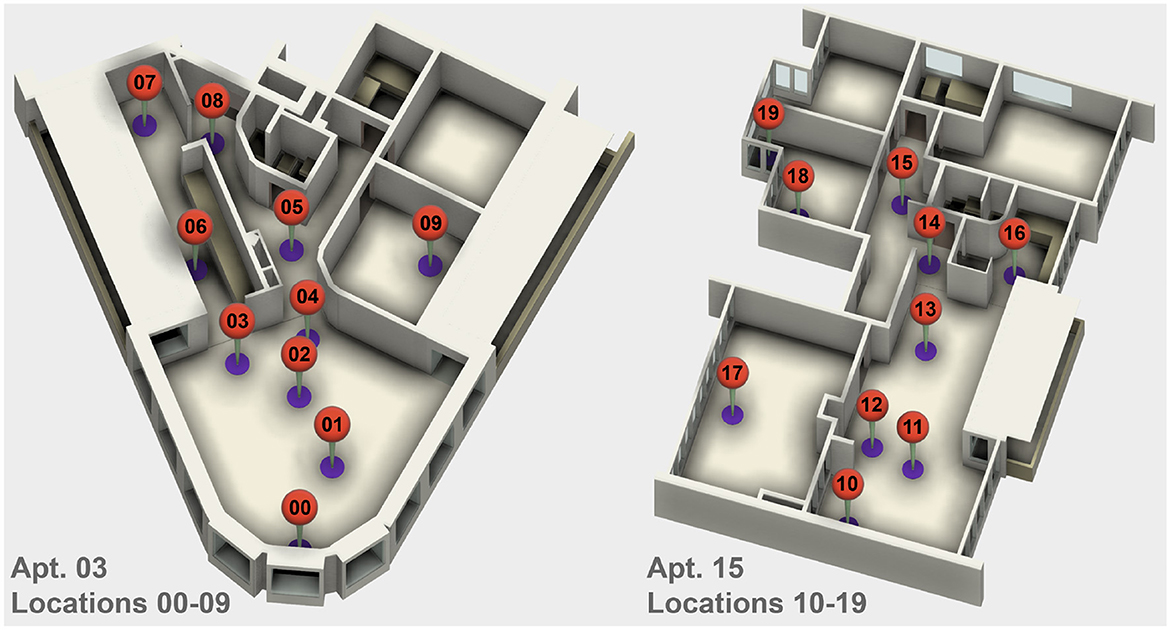
Figure 8. The 20 locations evaluated by survey participants for comparison with the algorithm's place scores. The ratings and scores can be found in Table 1.
To provide participants with 3D model visualization and interaction capabilities, we produced a custom-made survey tool. Our survey was built as a Node.js web app employing the Next.js React framework and the SurveyJS library. We embedded the Autodesk Platform Services Viewer to display the 3D models. It would have been possible to use existing survey tools by presenting static 2D images of the apartments. However, we felt that providing interactive 3D models would help participants fully visualize the apartment geometry, which served as the common denominator between the crowd sourcing and algorithmic approaches. The 3D viewer also allowed us to track effort and engagement with the survey by recording rotate, pan, and zoom interactions.
We used the online crowd sourcing platform Prolific to recruit 225 respondents listed as having an educational background that included the subject “Architecture.” We had considered comparing the ratings of architects and non-architects, since previous studies have found that the two groups attend to different attributes of apartment floor plans (Ishikawa et al., 2011), express different preferences for floor plans (Boumová and Zdráhalová, 2016), and respond differently to images of buildings and building interiors (Brown and Gifford, 2001; Vartanian et al., 2023). However, we were concerned that individuals less habituated to architectural representations might have struggled to interpret the 3D models, in which case their ratings might not have been meaningful. This concern is somewhat supported by previous research (Bates-Brkljac, 2013; Bazzaro et al., 2018), and could be investigated in a future study dedicated to 3D model interpretation. To further promote data quality, we (1) required respondents to have been approved for at least 95% of at least 5 previous Prolific studies; (2) excluded one of the 225 respondents due to a suspected device compatibility error; (3) excluded 32 of the remaining respondents who failed either of two attention checks while filling out the survey; and (4) excluded 10 of the remaining respondents who exhibited any 2 of the following 3 signs of insufficient effort responding:
• The minimum time they took to complete a page of model ratings was in the bottom 10%.
• They gave identical ratings to all 5 models for more than 3 out of 10 rating categories.
• They gave the same rating for Tranquil, Social, and Explorative for more than 6 out of 10 models.
The final sample of 182 participants included residents of 26 countries spanning 6 continents, according to demographic data from Prolific. Notwithstanding the eligibility criteria, 157 participants reported via the survey that they had either professional experience or formal training in architecture; another 14 reported experience or training in interior design, landscape design, or urban design; and the remaining 11 reported a mix of backgrounds that in most cases included some form of design or engineering. The gender breakdown within the sample was 96 women, 82 men, and 4 non-binary participants. The age breakdown was 160 participants aged 18–35, and 22 participants aged 35–55.
3.6 Comparison of algorithm and survey results
Different approaches can be used to compare an experiential space analysis algorithm's scores to an analogous set of crowdsourced ratings. Rather than regard the survey results as a baseline or ground truth upon which to evaluate the algorithm, our aim was to place both methodologies on equal footing while avoiding any preconceived assumptions about which set of results might better reflect people's real-life activities and experiences. We sought to gain insights by observing where the computational and crowd sourcing approaches yielded similar patterns, and where these patterns appeared to differ.
Our first method of analysis was a direct comparison of the algorithm's scores and the participants' ratings, first for the 20 selected locations and then for the 20 curated apartments. For each location and apartment, we averaged the survey ratings supplied by individual participants to obtain a single rating for each category. The standard deviations hovered around 1.0 for all average ratings in all categories, a high level of variability considering that uniformly distributed ratings would have yielded standard deviations of roughly 1.4. The standard errors were around 0.15. Though initially computed between 0 and 1, all scores produced by the algorithm were linearly mapped onto a 1–5 scale to match the Likert ratings collected via the survey. For the apartment results, we prioritized (1) the Overall Rating from the survey, (2) both survey ratings and algorithm scores for the three experiential qualities and Balanced Design, and (3) the average value of the Close to Plant Friendly Spots place scores, which we interpret as an overall daylight or Connection to Nature score. We did not closely scrutinize the Functionality and Aesthetics ratings, which were included in the survey mostly to steer participants toward thinking about the experience of occupants rather than cost, constructability, code compliance, or other professional considerations.
Next, we generated and examined matrices of Pearson correlation coefficients quantifying the strength of any linear relationship between the survey and algorithm results. For the 20 locations, correlations were computed between (a) the average survey ratings for Tranquil, Social, and Explorative, and (b) the three experiential quality place scores and the seven contributing design factor place scores. For the 20 apartments, correlations were computed between (a) the average survey ratings for each category, and (b) the Tranquil, Social, and Explorative Places design scores, the Balanced Design scores, and the average values of each apartment's place scores for all seven contributing factors. Given the sample size of 20 for both locations and apartments, correlation coefficients <0.38 have one-sided p-values > 0.05, suggesting questionable significance, whereas correlations of at least 0.52 have p-values < 0.01, suggesting high significance.
Finally, we took a closer look at the relationship between apartment ratings and scores across different levels of participant expertise. For this phase of the analysis, we considered only (1) the average Overall Rating results from the survey, and (2) both the Balanced Design and the average Close to Plant Friendly Spots scores from the algorithm. The Overall Rating results were of interest because they were obtained from participants before they were introduced to the Tranquil-Social-Explorative evaluation framework, which would likely have influenced subsequent ratings. We were curious whether the correlation between Overall Rating from the survey and Balanced Design from the algorithm would increase when considering only participants with higher degrees of relevant architectural experience. To gauge this experience, we used the question at the end of the survey that asked, “How many years of professional experience do you have designing residential apartments?” Of the 182 total participants, a subset of 116 that we refer to as practitioners reported having some apartment design experience, albeit possibly less than a year. Of these practitioners, a subset of 71 we refer to as experts reported having at least one year of experience. These groups were chosen post-hoc, since prior to the survey we did not know which survey questions and response thresholds would provide suitable sample sizes within each subset.
4 Results
4.1 Comparison of location results
The direct comparison of the algorithm's place scores with the location ratings from the survey revealed a degree of similarity between the two sets of results, though the scores and ratings differed in several regards (Table 1). First, the average survey ratings spanned a narrower range of values than the algorithm's scores, the latter of which ranged from 1.0 to 5.0 in some cases. More notably, whereas the algorithm's place scores exhibited a pronounced spatial gradient from Tranquil to Social to Explorative across the main common area in both apartments, these gradients were relatively subtle for the Tranquil survey ratings and barely noticeable for the Social and Explorative survey ratings. For example, the algorithm produced Social scores increasing from 1.6 to 5.0 for locations 00 through 02, which stretch from the periphery to the center of the common space of apartment 03. By contrast, the survey yielded nearly identical Social ratings for these three places. A slight exception to this pattern was evident at locations 03 and 04, which received lower Social ratings despite being in the same room, but these places were situated directly in front of passageways. For apartment 15, the Social and Explorative survey ratings each varied by only 0.2 for locations 10 through 13 in the main living space, despite a much wider distribution of scores from the algorithm.
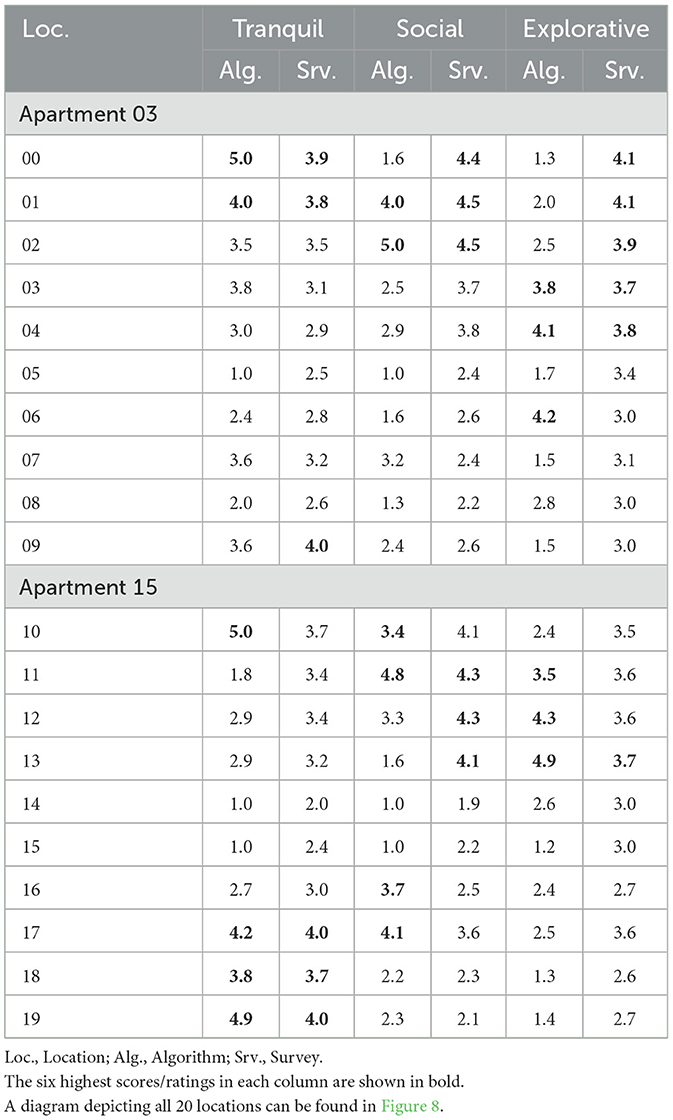
Table 1. Algorithm and survey results for the 20 selected locations.
The correlation matrix for the location results exhibited several noteworthy patterns (Figure 9). The participants' average Tranquil location ratings were highly correlated with the algorithm's Tranquil place scores (r = 0.87) as well as the algorithm's scores for two of the three contributing factors: Close to Plant Friendly Spots (r = 0.73) and Away from Pathways (r = 0.80). However, the Tranquil survey ratings were not significantly correlated with the third contributing factor, Half Hidden (r = 0.24). The participants' average Social and Explorative ratings were most strongly correlated with the Mostly Open place scores (r = 0.92 and 0.84, respectively). There were also significant correlations between the average Social ratings and the other two contributing factors, Close to Plant Friendly Spots (r = 0.49) and Transitioning from Pathways (r = 0.43). Combining all three factors produced Social place scores that correlated with the Social survey ratings (r = 0.60), but not to the same degree as the Mostly Open factor on its own.
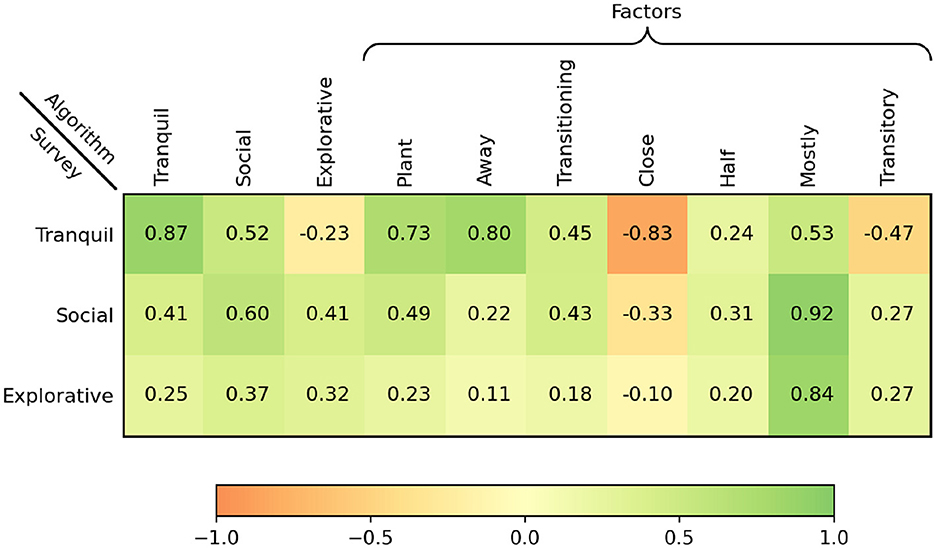
Figure 9. Matrix of correlation coefficients comparing the three average survey ratings to the algorithm's place scores for the 20 evaluated locations. The place scores include the three experiential qualities as well as the seven contributing design factors.
4.2 Comparison of apartment results
The direct comparison of algorithm scores and survey ratings for the apartments revealed some degree of similarity between the two sets of results, though there were several apartments for which the participants' average ratings and the algorithm's scores substantially differed (Table 2). Apartment 14 received relatively high algorithmic scores and crowdsourced ratings on a wide range of categories, whereas apartments 06, 07, and 12 received both low survey ratings and low algorithm scores. However, whereas apartments 01 and 13 received the highest Balanced Design scores from the algorithm (4.4), the survey ratings were high for apartment 01 yet low for apartment 13. Participants gave apartment 10 a high Social Places rating (3.9), whereas the algorithm gave it the lowest score in that category (1.7). Participants gave apartment 18 a high rating for Explorative Places (3.7), whereas the algorithm's score was low (2.2).
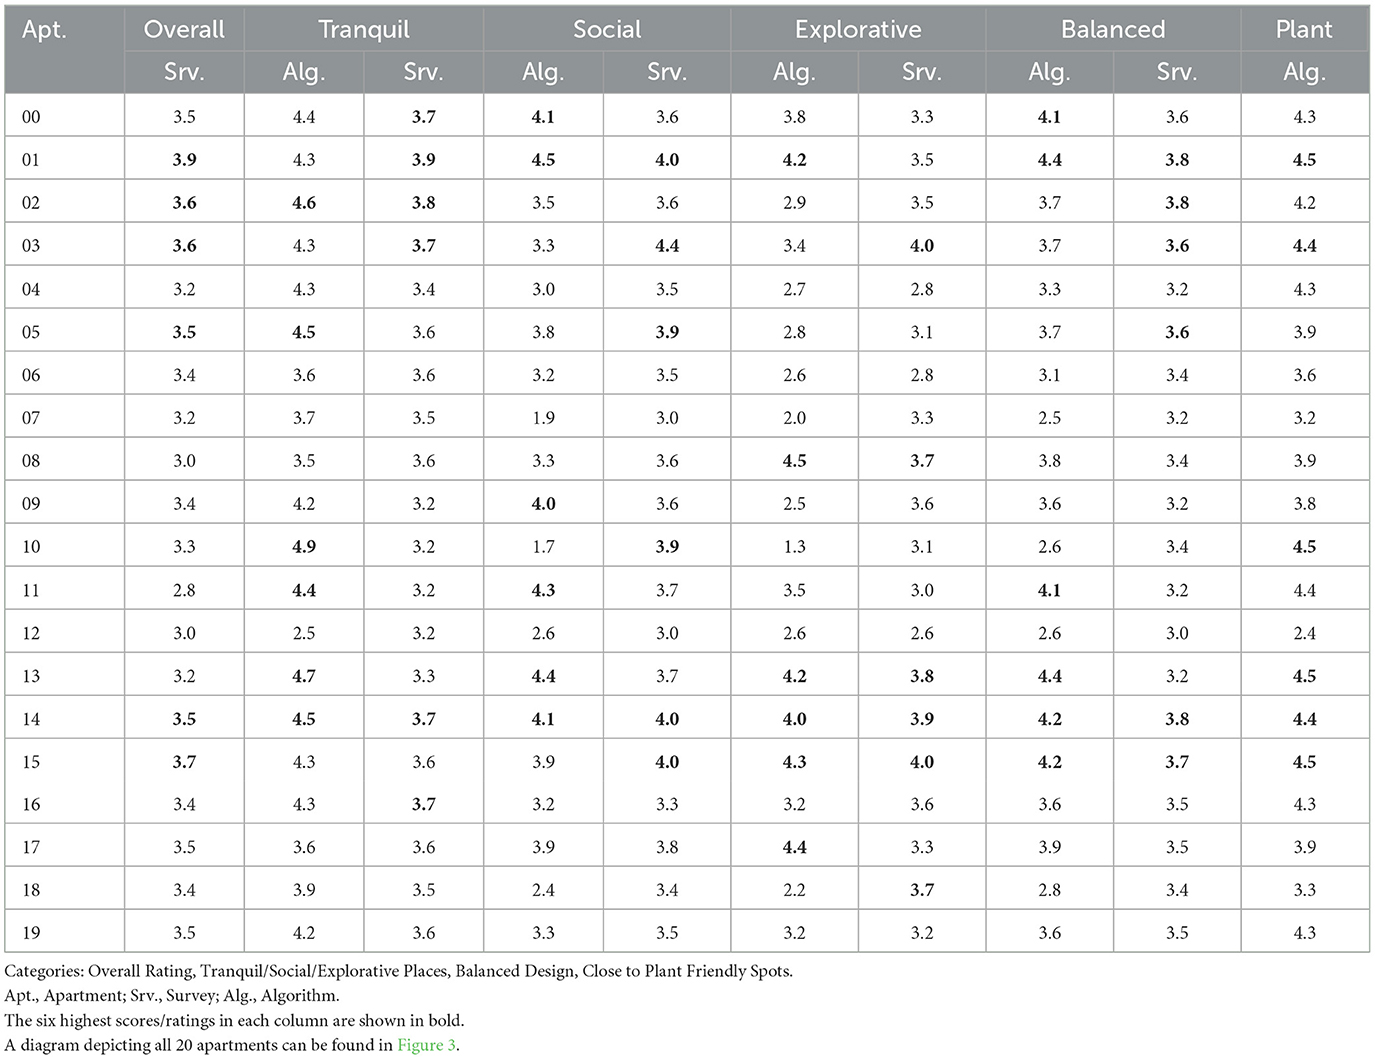
Table 2.Algorithm and survey results for the 20 curated apartments.
The correlations between the apartment results are presented in two matrices (Figure 10), the first of which includes the coefficients associated with the conventional survey ratings: Functionality, Aesthetics, and Overall Rating. This matrix shows essentially no correlation between the average ratings for Functionality and any of the scores produced by the algorithm. The Aesthetics ratings did correlate with some of the scores, particularly the average score for Close to Plant Friendly Spots (r = 0.62). The correlation between the Overall Rating results from the survey and the Balanced Design scores from the algorithm was barely significant (r = 0.38).
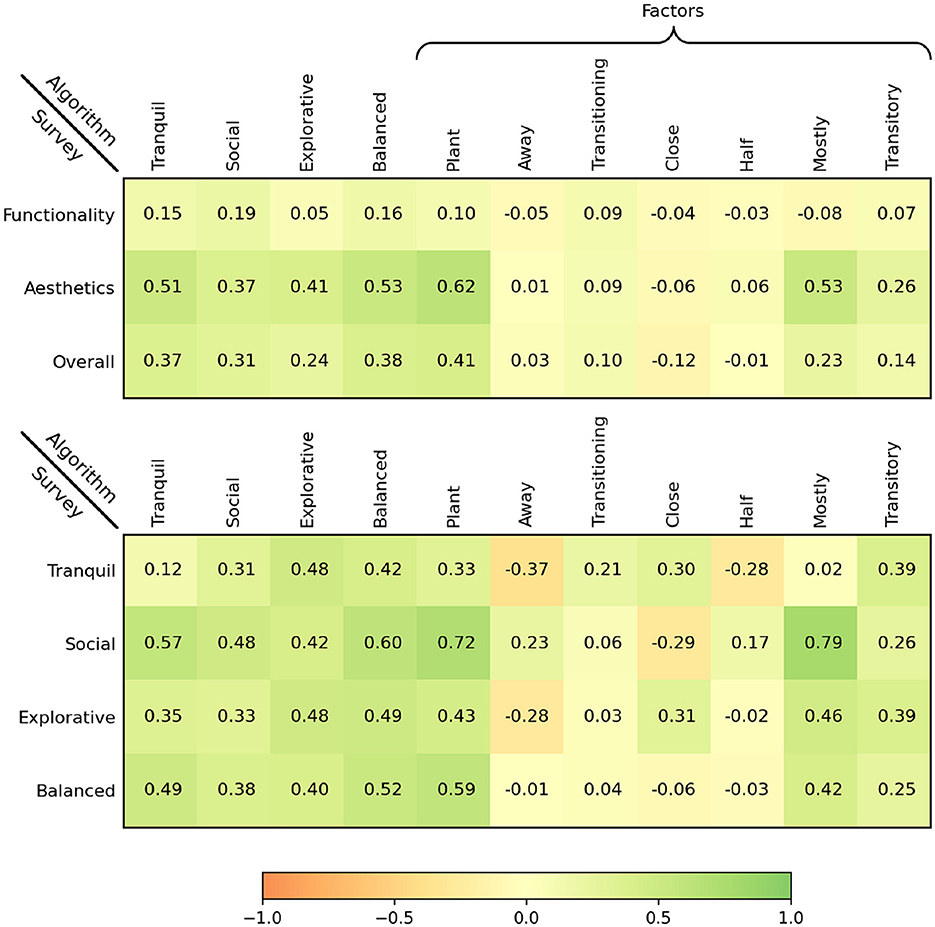
Figure 10. Matrices of correlation coefficients between the average survey ratings and the algorithm's four design scores, as well as the average value of the place scores for each type of factor. The upper matrix includes the coefficients for the three conventional survey ratings. The lower matrix includes the coefficients for the four experiential survey ratings.
The second matrix includes the correlation coefficients associated with the experiential survey ratings: Tranquil Places, Social Places, Explorative Places, and Balanced Design. Had there been a high degree of alignment between the results of the survey and the algorithm, we would have expected the coefficients to be noticeably high along the diagonal where the categories match. This pronounced diagonal is not evident. The Tranquil Places survey rating correlated most strongly with the Explorative Places design scores (r = 0.48), and did not significantly correlate with the Tranquil Places design scores from the algorithm (r = 0.12). Layouts in which the main common area appeared to take up a large fraction of the floor space, such as apartments 04, 09, and 10, were among those that received noticeably low Tranquil survey ratings compared with the algorithmic scores. The survey ratings for Social Places, Explorative Places, and Balanced Design correlated with the associated design scores (r = 0.48, 0.48, and 0.52, respectively), but these correlations were not pronounced compared to other nearby coefficients in the matrix.
4.3 Comparison of experience levels
Scatter plots relating the Overall Rating from the survey to the Balanced Design and Close to Plant Friendly Spots scores from the algorithm exhibited signs of a potential relationship between participants' expertise and the tendency of their ratings to align with the algorithm's scores (Figure 11). Specifically, while the correlation between the survey ratings and the algorithm's Balanced Design scores was minimal when all 182 participants were included (r = 0.38), the correlation increased when considering only practitioners (r = 0.53), and further increased when considering only experts (r = 0.58). By contrast, the survey ratings correlated minimally with the average Close to Plant Friendly Spots scores for the participants, practitioners, and experts (r = 0.41, 0.43, and 0.43, respectively). Participants with more self-reported experience showed greater appreciation for apartments 08, 11, and 13, which appear as outliers in the plot relating Overall Rating to Balanced Design for all participants. Notwithstanding the large statistical errors for the smaller subgroups, which complicates the interpretation of many of the apartment ratings, the more experienced participants awarded considerably higher ratings to apartment 13, the model that the algorithm scored highest for Balanced Design.
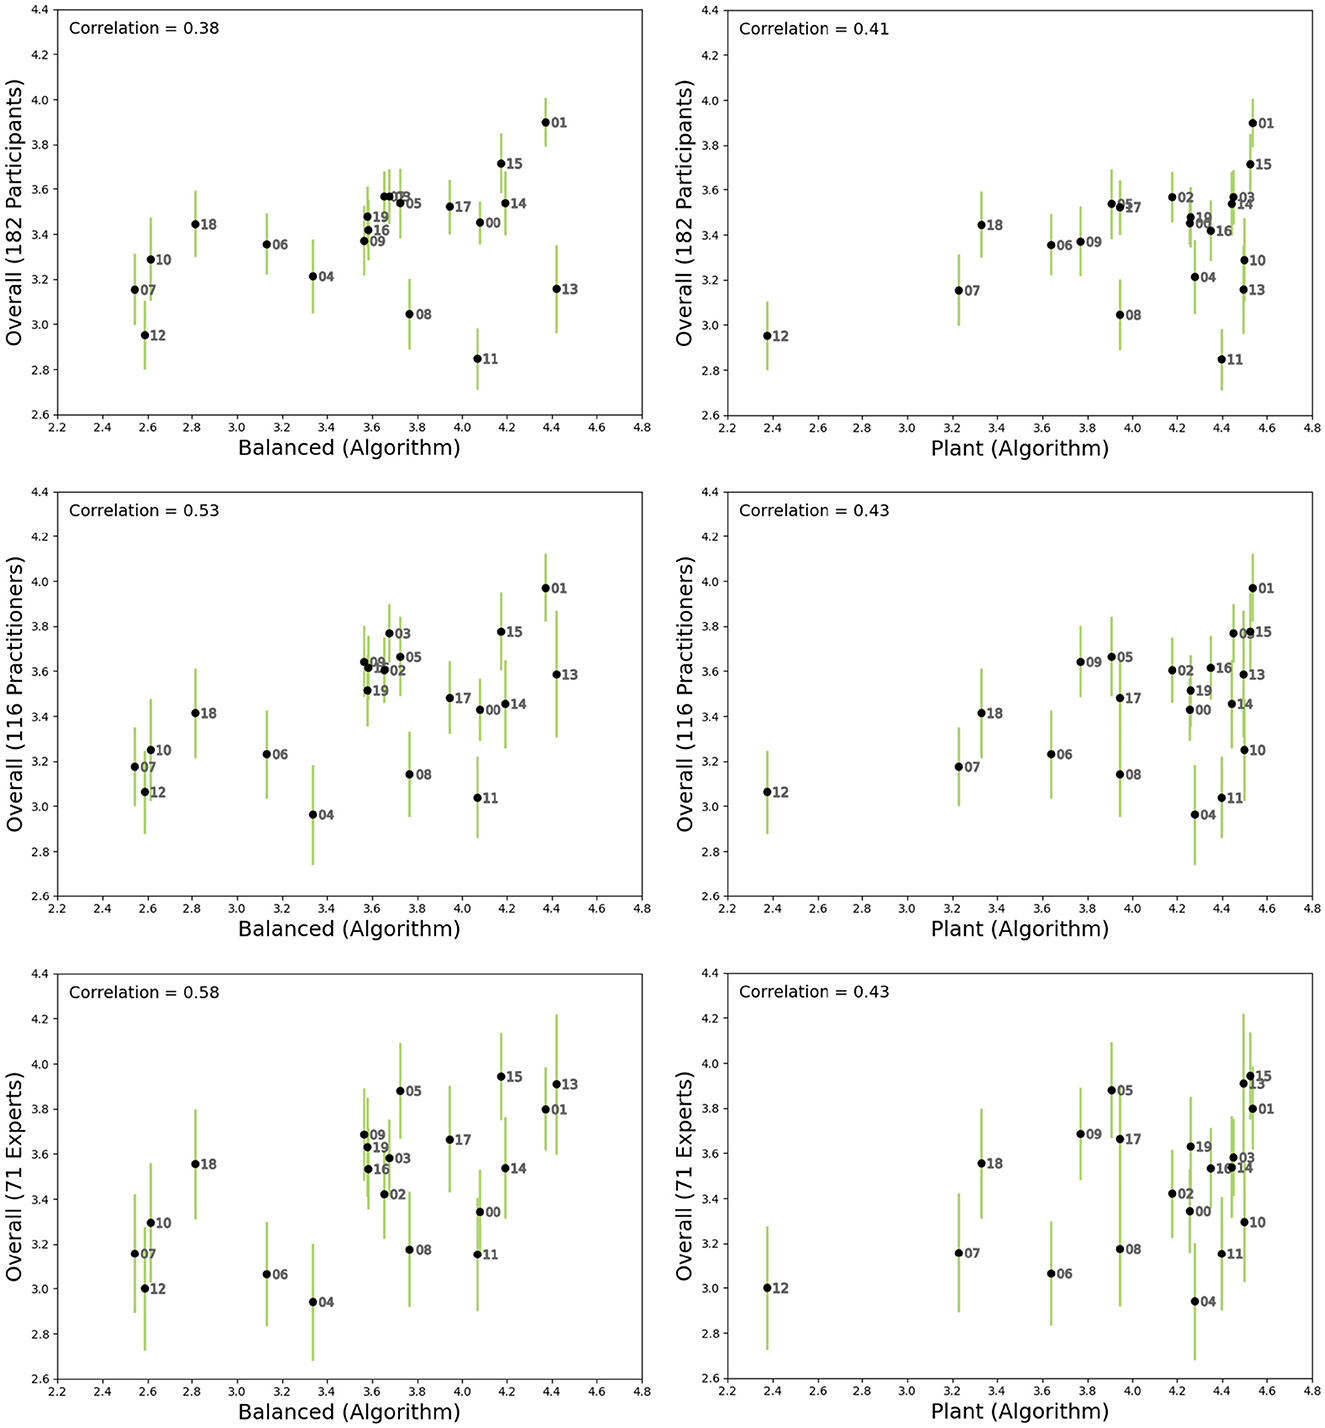
Figure 11. Overall Rating scores from the survey plotted against the Balanced Design and averaged Close to Plant Friendly Spots scores from the algorithm. The survey ratings are averages across all participants (top row), a subset of the participants who indicated some professional experience designing residential apartments (middle row), and a smaller subset who indicated at least 1 year of apartment design experience (bottom row). The error bars show the standard errors, which increase as the sample size is reduced.
5 Discussion
5.1 On the interpretation of experiential qualities
The literature contains various frameworks similar to ours in that they characterize architectural settings using a small set of experience-related dimensions, yet different in their application, their methodology, and how their dimensions should be interpreted. Similar to our Tranquil, Social, and Explorative “experiential quantities,” others have proposed Restorativeness, Stress and Anxiety, Aesthetics and Pleasure, and Motivation as four “categories of human experience” (Ergan et al., 2018); Coherence, Hominess, and Fascination as three “psychological dimensions of architectural experience” (Coburn et al., 2020); and Safety, Interaction, and Distraction as three “cognitive appraisals” (Gath-Morad et al., 2024). While these frameworks differ from ours in that they rely on subjective evaluations of scenes, many of them include dimensions that appear to belong to the same umbrella of moods, feelings, or atmospheres (Kirsh, 2023). For example, our Tranquil quality is likely related to Restorativeness, (Low) Stress and Anxiety, Hominess, Safety, and (Low) Distraction. Our Social quality is likely related to Interaction. Our Explorative quality is likely related to Fascination. Even in cases where multiple frameworks include experiential qualities or dimensions with nearly synonymous names, these categories may differ in how they relate to human activities and spatial context.
Whereas psychological dimensions characterize people's responses to a place (Coburn et al., 2020; Gregorians et al., 2022), the experiential qualities of our framework characterize the place itself, and do so in a way that encompasses both the way people may feel and the activities they may perform. When our algorithm generates high Tranquil place scores in certain areas of an apartment, it does not imply that a person's mental state will instantly transition to one of calmness and serenity every time they set foot in one of those areas. Rather, the intended interpretation is that, all else being equal, inhabitants of an apartment with high Tranquil place scores will likely engage in peaceful activities more frequently, favor the higher scoring Tranquil places for those activities, and experience more positive emotions in general during those times. Similarly, a high Social place score suggests that shared activities involving family or friends will occur more frequently, and with greater satisfaction, in that place than in places with low Social scores.
Though similar to atmospheres in that they characterize a setting rather than a mental state (Kirsh, 2023), our experiential qualities are more clearly dependent on the spatial context of that setting within the larger environment. For example, if an annual party is occurring in a large, beautiful room in an isolated corner of an office, that room can be said to have a social atmosphere at that moment in time. But because the room is in the corner of the office, where it is unlikely to attract passersby on a typical day, our framework suggests that the room might lack places that are highly social in terms of their experiential qualities. Another difference is that an atmosphere usually pertains to a space as a whole, whereas an experiential quality is intended to vary from place to place within a room that supports diverse activities. By presenting architectural models, our survey allowed participants to observe how each marked location was situated within the surrounding room as well as the entire apartment, and to consider this spatial context when rating the experiential qualities of that place. This contrasts with previous work in which experiential qualities were evaluated using rendered scenes (Franz et al., 2005; Ergan et al., 2018; Gath-Morad et al., 2024), though incorporating virtual navigation capabilities may allow participants to discover how each place is situated in its environment (Wiener and Franz, 2005).
5.2 On the evaluation of architectural models
Based on the results presented in Section 4, there appear to be fundamental differences in how architectural models are evaluated by an experiential space analysis algorithm and by people with an architecture-related background who have been asked to rate the same experiential qualities. When interpreting the results, it is important to remember that the survey ratings varied considerably from one participant to the next, and hence the average ratings do not resemble those of a typical professional or experienced individual. It is also worth considering that, while most of the participants had a strong background in architecture, a desire to complete the survey quickly may have led to rushed evaluations. Nevertheless, the location results in Section 4.1 suggest that participants assumed relatively uniform experiential qualities within each space, especially for the Social and Explorative qualities. It is possible that preconceptions about room types, such as a notion that living and dining rooms are social spaces, may have influenced this pattern. For the Tranquil quality, a tendency for participants to evaluate each room as whole may explain the low correlation with Half Hidden, a factor we associate with partially enclosed refuges on the periphery of social spaces. In contrast to human evaluators, the algorithm has no notion of a “space,” and will often predict a gradient of highly tranquil, social, and explorative places even within the same room.
It was noted in Section 4.2 that when rating an entire apartment, participants produced Tranquil Places ratings exhibiting no significant correlation with the corresponding design scores produced by the algorithm. A possible explanation is that the algorithm computes its Tranquil Places design scores in a manner that would be time-consuming for a person to emulate, as it would involve evaluating and aggregating the tranquil quality of various places in bedrooms and along the periphery of common rooms. Instead, many of the participants may have performed a quicker assessment by assuming the common rooms to be uniformly social, and evaluating Tranquil Places as the proportion of floor space in alternative rooms. Yet regardless of whether this theory is true, a substantial change to the design of the survey is likely needed to detect deeper similarities and differences between the combinations of design factors that influence human evaluators and the presented algorithm when inferring experiential qualities from architectural models.
Despite the challenge of crowd sourcing experiential ratings using architectural models, the conventional ratings exhibited an interesting trend. As observed in Section 4.2, the Overall Rating results from the survey correlated more strongly with the Balanced Design results from the algorithm when considering participants with more self-reported experience designing residential apartments. We would expect to see such a trend if habitable buildings possess varying degrees of overall harmony, as discussed in Section 1, and if both the algorithm and the more experienced participants are able to detect this harmony to a degree. The fact that the Close to Plant Friendly Spots metric did not exhibit the same pattern suggests that something might have been gained by combining factors. However, it is important to note that a few of the more unusual apartments had an outsized influence on the observed trend. Examples include apartments 08 and 11, (Figure 12) which feature peculiar topological relationships, as well as the top-scoring yet oddly shaped apartment 13 (Figure 7). The observed relationship between participant experience and agreement with the algorithm could be formally tested in a follow-up study involving (1) a larger set of apartments that were not used to calibrate the algorithm, (2) participant expertise categories determined in advance of the study, and (3) a test statistic capturing the strength of the trend, also determined in advance of the study. While such an investigation could boost confidence in the proposed method, correlations between experts' ratings and the algorithm's scores may reflect a possibility that both have been influenced by similar design principles and schools of thought; such an alignment does not necessarily imply an ability to predict the effect of an environment on wellbeing.
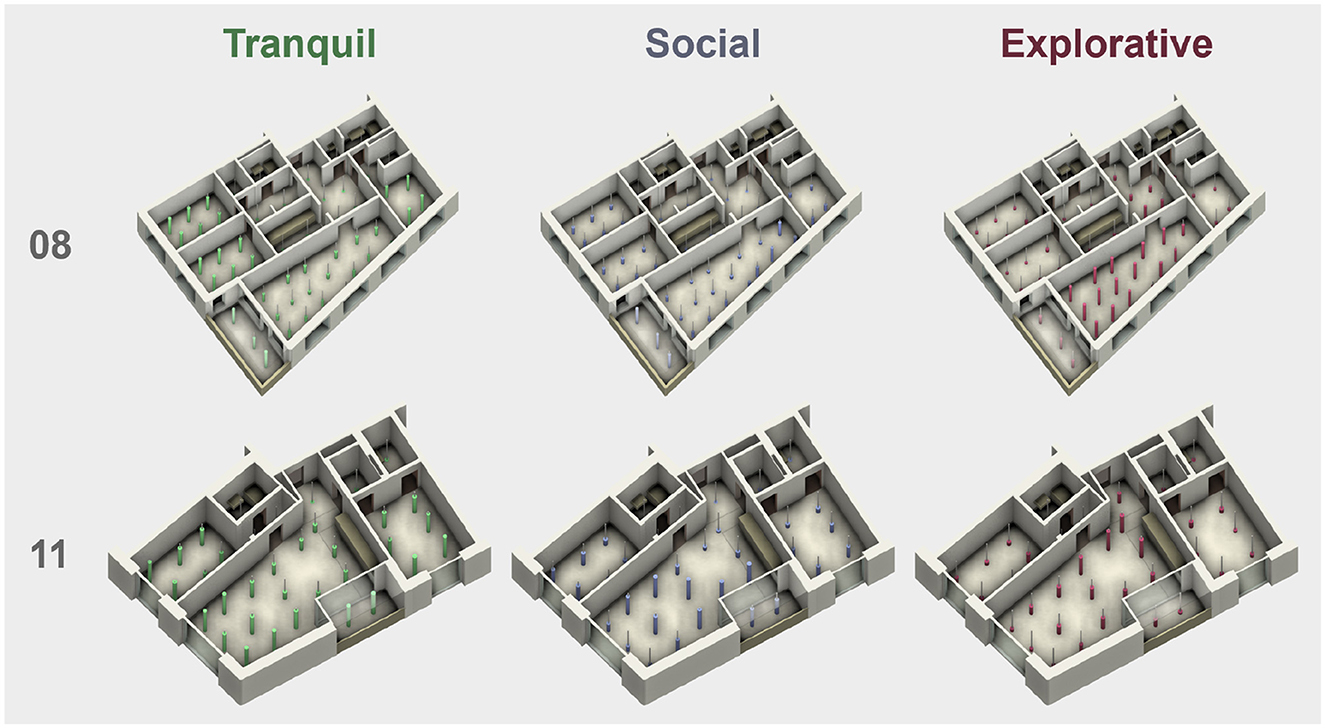
Figure 12. Visualization of Tranquil, Social, and Explorative place scores for two apartments featuring peculiar topological relationships. The kitchen in apartment 08 is visually separated from the daylit common room. The bathrooms in apartment 11 are accessible only via its two bedrooms. Both apartments received noticeably low Overall Rating evaluations from survey participants despite moderate to high Balanced Design scores from the algorithm.
5.3 Toward the prediction of experience and wellbeing
Experiential space analysis can be viewed as part of a larger scientific endeavor to predict the impact that the design of a building or city will have on people's everyday experiences and long-term wellbeing. A key challenge in this endeavor is how to obtain experiential and wellbeing data at the necessary scale. Spatial analysis metrics derived from isovists have previously been compared to participants' subjective evaluations of places in buildings (Wiener and Franz, 2005; Fisher-Gewirtzman, 2012; Gath-Morad et al., 2024), a line of research that could lead to data-driven experiential space analysis tools. Our theory-driven methodology allows progress to be made using selected best practices in lieu of data, though high-quality experiential datasets are ultimately needed to fine tune and validate any handcrafted algorithms. To create datasets providing subjective evaluations of experiential qualities, a pragmatic approach is to conduct onsite surveys in which each quality is scored using a combination of questions (Breiby and Slåtten, 2018; Zamanifard et al., 2019). Other datasets may avoid surveys altogether, inferring the quality of a built environment from discrete actions such as paying a certain rental price (Turan et al., 2021; Standfest, 2022), or posting a positive or negative online review (Zhang et al., 2023). In addition to the recent studies cited in Section 1, data collection methods for assessing long-term wellbeing include in-depth interviews (Molina, 2021), controlled crossover studies (Woo et al., 2021), mixed methods post-occupancy evaluations (Zallio and Clarkson, 2022), and longitudinal surveys (Altaf et al., 2023; Bianchi et al., 2023).
The main implication of our work for data collection efforts is the possible need to consider combinations of factors when investigating links to health and wellbeing. Unfortunately, this would seem to require even greater amounts of data than what is already necessary to relate individual factors to wellbeing for a representative sample of people worldwide. To illustrate, consider a hypothetical study involving 9 measurable design factors. There happens to be 280 ways to group those factors into 3 sets of 3. To determine which groupings of factors best predict outcomes, suppose that metrics resulting from all 280 combinations are correlated with 3 wellbeing indicators. In that case, an extraordinary amount of data would be required to ensure that none of the 280 × 3 = 840 possible correlations are spurious. The challenge is compounded by the arbitrary nature of composition formulas like Equation 2, suggesting that multiple formulas should be tested for each combination of factors. We submit that this combinatorial problem might discourage the pursuit of empirical data pertaining to composite metrics, a form of evidence that may be necessary to truly validate or possibly refute best known practices for architecture and urban design.
A practical way to make progress may be to compare several predetermined sets of design factors rather than all possible combinations. In a recent online study (Zijlstra et al., 2024), participants who had experienced hospitalization were randomly assigned to one of four virtual settings: (1) a control condition modeled after a real-life hospital room; (2) a Golden Ratio variation based on a classical geometry-inspired design principle; (3) a Feng Shui variation based on a classical Chinese form of geomancy; and (4) an Evidence-Based Design variation grounded in contemporary scientific studies. Each variation introduced as many as 15 design changes relative to the control. It was found that participants exposed to either the contemporary Evidence-Based Design variation or the classical Feng Shui variation experienced less anxiety, whereas no difference was found between the classical Golden Ratio variation and the control. Datasets collected in a similar manner might aid in the study of experiential space analysis frameworks.
5.4 Toward the practical application of experiential space analysis
As stated in Section 2.1, the goal of the framework is to help practicing architects promote psychological and social wellbeing in habitable buildings. This practical objective of improving the built environment differs somewhat from the scientific endeavor of predicting experiences and outcomes. From a scientific standpoint, one might ask whether the real-life inhabitants of apartments 03 and 15 experience their homes in a way that is more consistent with the location ratings from the survey or the place scores from the algorithm (Figure 13). From a practical standpoint, however, one must ask what design changes an architect would consider in light of the algorithm's scores, and whether those changes improve the apartments. For example, the algorithm gave apartment 03 low Social and Explorative scores relative to survey participants, a result of the pathway density field being concentrated in narrow passageways separated from the large daylit space. An architect might respond with a change to the layout, such as moving the kitchen into the common space, in an effort to alter circulation patterns and increase the scores. Apartment 15 received high scores from the algorithm, but the dining room was scored as Explorative whereas an architect might intend it to be Social. Moving the balcony might produce higher Social scores in the dining room and higher Explorative scores in the living room. These types of metric-inspired design modifications, and their implications, could be investigated in future work focusing on the application of the metrics.
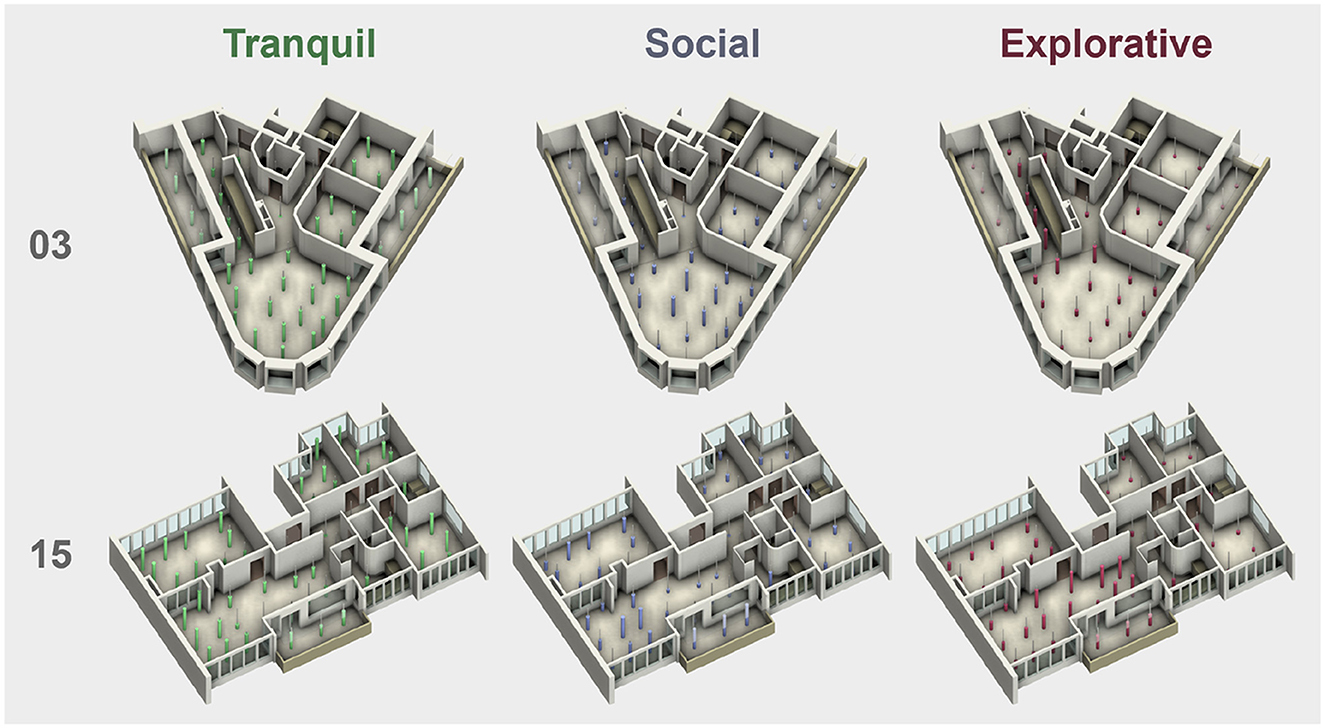
Figure 13. Visualization of Tranquil, Social, and Explorative place scores for the two apartments used to compare crowd sourced and algorithmic location results (apartments 03 and 15). These types of visualizations are intended to inspire design modifications that might increase the place scores in general, or change the way tranquil, social, and explorative places are distributed throughout the building layout.
A key difference between experiential space analysis and typical spatial analyses is the manner in which a set of metrics promotes a balance of design factors. Particularly in the context of generative design (Gerber and Lin, 2014; Nagy et al., 2017), this balance is typically pursued by selecting a set of metrics that represent competing objectives and must therefore oppose one another. For example, a metric representing daylight and another representing spaciousness might fail to create this opposition, since both objectives can be satisfied by removing all interior walls and opting for a 100% glazed facade. But when an opposing metric representing low distraction is also included in the design workflow, a diversity of layouts can be generated to explore trade-offs among objectives. An advantage of this approach is that combinations of design factors need not be chosen in advance, as they were in our methodology. However, it has been pointed out that design objectives can be seen as reconcilable rather than competing (Alexander, 1979), and that a philosophy based on reconciling objectives could be introduced into generative design (Kamalmaz, 2022).
With experiential space analysis, the concept of balance is incorporated into the metrics themselves. To achieve a high Half Hidden score, for example, a degree of openness must be balanced with a degree of enclosure. More importantly, the Tranquil Places, Social Places, and Explorative Places design scores are average values associated with different groupings of a building's places, and can therefore be viewed as representing complementary rather than competing objectives. Apartment 01 is an example of a layout that reconciles any potential conflict between tranquility, sociability, and explorativity, based on the high scores it received from the algorithm (Figure 7). Incidentally, this apartment also received the highest Overall Rating from the full sample of survey participants. Unlike a typical application of generative design, where the main steps involve generating non-dominated design options and exploring how some designs trade one high score for another, experiential space analysis encourages designers to find modifications that simultaneously improve multiple experiential metrics. These potential modifications can be produced manually or with any amount of design generation.
While this work has focused on habitable buildings, a similar framework could be developed to help urban designers promote wellbeing in neighborhoods and communities. Such a framework could incorporate adapted versions of some of the same experiential qualities and factors we proposed for buildings. For example, the Social factor we named Transitioning from Pathways appears closely related to the following urban design advice: “Create neighborhood squares adjacent to neighborhood through streets, and at nodes where commercial activities are present or likely.” (Salingaros, 2021). On the other hand, weather and vehicle traffic significantly impact people's outdoor experiences, and should probably be factored into any analysis of experiential qualities at the community scale. A growing interest in biophilia and social cohesion has motivated a diversity of studies that could inform a composition of spatial metrics for urban design projects (O'Sullivan et al., 2023; Sonta and Jiang, 2023; Rehman et al., 2024).
6 Conclusion
We demonstrated experiential space analysis, a computational design methodology that strives to predict the experiential qualities of places in an architectural model by decomposing those qualities into factors with simpler and more obvious spatial interpretations. Our methodology begins with a proposed framework in which three experiential qualities—Tranquil, Social, and Explorative—can be evaluated at various places in a habitable building by scoring a nature factor, three pathway factors, and three visibility factors, and combining the results. The experiential quality place scores can then be aggregated to produce a set of design scores, including an overall Balanced Design score intended to capture the harmony of a building's layout as well as its likelihood of accommodating a diversity of everyday activities.
The framework was implemented and applied to a set of 20 residential apartments from the Swiss Dwellings dataset, and the scores produced by the algorithm were compared with an analogous set of ratings that we crowd sourced using an online survey. We observed that when evaluating 3D architectural models, survey participants tended to assume relatively uniform experiential qualities within each space of each apartment. By contrast, our algorithm often produced a gradient of highly tranquil, social, and explorative scores, even within the same room. We also observed that participants with more experience designing residential apartments provided initial assessments more strongly correlated with the algorithm's Balanced Design scores. Though consistent with the idea that building layouts possess an overall harmony that should be detectable in experts' ratings and experiential space analysis results, the exploratory nature of our investigation means that a follow-up study would be needed to confirm the observed trend.
This research raises two questions concerning the prediction of human experience and wellbeing in architectural and urban design practice. First, is it sufficient to quantify and optimize individual design factors that have been empirically linked to wellbeing, or is there something to be gained by combining design factors in an effort to predict the experiential qualities of places in buildings or urban developments? Second, given the extraordinary amount of empirical data that may be needed to associate combinations of design factors with improved wellbeing, is there value in using theoretical best practices as a basis for experiential space analysis tools? We submit that compared with conventional, single-factor analyses, professional designers may be able to derive new kinds of insights from the theory-driven, composite metrics presented in this paper. However, architects must understand how certain schools of thought have influenced the design and implementation of the algorithm, and take the limitations of this methodology into consideration when exploring design modifications based on the resulting scores. Regardless of whether the computational framework is derived from our selection of influencing works or grounded in psychological theories, neuroaesthetics (Chatterjee and Vartanian, 2014), Space Syntax, Evidence-Based Design (Ulrich et al., 2008), or even classical approaches such as Feng Shui, we envision a paradigm in which theoretical best practices are used as a starting point to encourage the study of combinations of factors. Behavioral, experiential, and wellbeing datasets can then be incorporated into the spatial analysis methodology over time.
Data availability statement
The datasets presented in this study can be found in online repositories. The names of the repository/repositories and accession number(s) can be found in the article/Supplementary material.
Ethics statement
The studies involving humans were approved by the HCI and Visualization Ethics Review Team, Autodesk Research. The studies were conducted in accordance with the local legislation and institutional requirements. The participants provided their written informed consent to participate in this study.
Author contributions
RG: Conceptualization, Writing – original draft, Writing – review & editing, Formal analysis, Investigation, Methodology, Project administration, Software, Validation, Visualization, Data curation. NS: Conceptualization, Writing – original draft, Writing – review & editing, Formal analysis, Investigation, Methodology, Visualization. JM: Conceptualization, Formal analysis, Investigation, Methodology, Visualization, Writing – original draft, Writing – review & editing. SH: Conceptualization, Investigation, Visualization, Writing – review & editing. DG: Conceptualization, Project administration, Supervision, Writing – review & editing. FB: Investigation, Validation, Visualization, Writing – review & editing. ML: Data curation, Investigation, Software, Visualization, Writing – review & editing. LC: Methodology, Software, Writing – review & editing. TL: Writing – review & editing, Resources, Supervision, Visualization. DS: Investigation, Project administration, Supervision, Visualization, Writing – review & editing. KW: Software, Supervision, Writing – review & editing.
Funding
The author(s) declare that no financial support was received for the research and/or publication of this article.
Acknowledgments
We thank Muhammad Ammar for developing most of the functionality of the custom-made survey tool that allowed participants to explore and rate 3D architectural models. We also thank Theoni Varoudaki for advising us on the design of the survey as well as best crowd sourcing practices. Finally, we thank the many researchers, designers, and software experts at Autodesk who provided valuable feedback on the framework, algorithm, and survey. The authors of course take full responsibility for any shortcomings of this work.
Conflict of interest
The authors declare that the research was conducted in the absence of any commercial or financial relationships that could be construed as a potential conflict of interest.
Generative AI statement
The author(s) declare that no Gen AI was used in the creation of this manuscript.
Correction note
This article has been corrected with minor changes. These changes do not impact the scientific content of the article.
Publisher's note
All claims expressed in this article are solely those of the authors and do not necessarily represent those of their affiliated organizations, or those of the publisher, the editors and the reviewers. Any product that may be evaluated in this article, or claim that may be made by its manufacturer, is not guaranteed or endorsed by the publisher.
Supplementary material
The Supplementary Material for this article can be found online at: https://www.frontiersin.org/articles/10.3389/frsc.2025.1530431/full#supplementary-material
References
Alamirah, H., Schweiker, M., and Azar, E. (2022). Immersive virtual environments for occupant comfort and adaptive behavior research' a comprehensive review of tools and applications. Build. Environ. 207:108396. doi: 10.1016/j.buildenv.2021.108396
Alexander, C., Ishikawa, S., and Silverstein, M. (1977). A Pattern Language. New York: Oxford University Press.
Altaf, B., Bianchi, E., Douglas, I. P., Douglas, K., Byers, B., Paredes, P. E., et al. (2022). Use of crowdsourced online surveys to study the impact of architectural and design choices on wellbeing. Front. Sustain. Cities 4:780376. doi: 10.3389/frsc.2022.780376
Altaf, B., Bloomfield, L. S., Karzai, D. N., Sawe, N. A., Murnane, E. L., Bencharit, L. Z., et al. (2023). Time perception during the pandemic: a longitudinal study examining the role of indoor and outdoor nature exposure for remote workers. Build. Environ. 243:110644. doi: 10.1016/j.buildenv.2023.110644
Altomonte, S., Allen, J., Bluyssen, P. M., Brager, G., Heschong, L., Loder, A., et al. (2020). Ten questions concerning well-being in the built environment. Build. Environ. 180:106949. doi: 10.1016/j.buildenv.2020.106949
Ayoub, M. (2019). 100 years of daylighting: a chronological review of daylight prediction and calculation methods. Solar Energy 194, 360–390. doi: 10.1016/j.solener.2019.10.072
Azadi, S., Bai, N., and Nourian, P. (2024). Ergonomics of spatial configurations: a voxel-based modelling framework for accessibility and visibility simulations. Front. Built Environ. 9:1300843. doi: 10.3389/fbuil.2023.1300843
Bates-Brkljac, N. (2013). Differences and similarities in perceptions of architectural representations: expert and non-expert observers. J. Archit. Plann. Res. 30, 91–107.
Bazzaro, F., Charrier, M., Chevriau, S., Rouxel, T., and Sagot, J.-C. (2018). Impact of architectural representation on users' feelings: from 2D plans to virual models and physical prototypes. J. Archit. Plann. Res. 35, 244–257.
Bianchi, E., Bloomfield, L. S. P., Bencharit, L. Z., Altaf, B., Sawe, N. A., Murnane, E. L., et al. (2023). A study of the role of indoor nature on solidarity and group identity during remote work. Build. Environ. 245:110909. doi: 10.1016/j.buildenv.2023.110909
Bianchi, E., Tavakoli, A., and Billington, S. L. (2024). Using computer vision and parametric design software to quantify nature dose in indoor built environments. Comput. Civil Eng. 2023, 93–101. doi: 10.1061/9780784485248.012
Boumová, I., and Zdráhalová, J. (2016). The apartment with the best floor plan layout: architects versus non-architects. Crit. Housing Anal. 3, 30–41. doi: 10.13060/23362839.2016.3.1.264
Breiby, M. A., and Slåtten, T. (2018). The role of aesthetic experiential qualities for tourist satisfaction and loyalty. Int. J. Cult. Tour. Hospit. Res. 12, 1–14. doi: 10.1108/IJCTHR-07-2017-0082
Brown, G., and Gifford, R. (2001). Architects predict lay evaluations of large contomporary buildings: whose conceptual properties? J. Environ. Psychol. 21, 93–99. doi: 10.1006/jevp.2000.0176
Chatterjee, A., and Vartanian, O. (2014). Neuroaesthetics. Trends Cogn. Sci. 18, 370–375. doi: 10.1016/j.tics.2014.03.003
Coburn, A., Vartanian, O., Kenett, Y. N., Nadal, M., Hartung, F., Hayn-Leichsenring, G., et al. (2020). Psychological and neural responses to architectural interiors. Cortex 126, 217–241. doi: 10.1016/j.cortex.2020.01.009
Colenberg, S., Appel-Meulenbroek, R., Herrera, N. R., and Keyson, D. (2023). Interior designers' strategies for creating social office space. Ergonomics 67, 995–1007. doi: 10.1080/00140139.2023.2270788
Colenberg, S., Jylhá, T., and Arkesteijn, M. (2021). The relationship between interior office space and employee health and well–being–a literature review. Build. Res. Inf. 49, 352–366. doi: 10.1080/09613218.2019.1710098
Danell, M., Ámundadóttir, M. L., and Rockcastle, S. (2020). “Evaluating temporal and spatial light exposure profiles for typical building occupants,” in Symposium on Simulation for Architecture and Urban Design (SimAUD), 1–8.
Danielsson, P.-E., and Lin, Q. (2003). “A modified fast marching method,” in Image Analysis, 1154–1161. doi: 10.1007/3-540-45103-X_151
Douglas, I. P., Murnane, E. L., Bencharit, L. Z., Altaf, B., dos Reis Costa, J. M., Yang, J., et al. (2022). Physical workplaces and human well-being: a mixed-methods study to quantify the effects of materials, windows, and representation on biobehavioral outcomes. Build. Environ. 224:109516. doi: 10.1016/j.buildenv.2022.109516
Ekici, B., Cubukcuoglu, C., Turrin, M., and Sariyildiz, I. S. (2019). Performative computational architecture using swarm and evolutionary optimisation: a review. Build. Environ. 147, 356–371. doi: 10.1016/j.buildenv.2018.10.023
Ergan, S., Shi, Z., and Yu, X. (2018). Towards quantifying human experience in the built environment: a crowdsourcing based experiment to identify influential architectural design features. J. Build. Eng. 20, 51–59. doi: 10.1016/j.jobe.2018.07.004
Fisher-Gewirtzman, D. (2012). “3D models as a platform for urban analysis and studies on human perception of space,” in Usage, Usability, and Utility of 3D City Models, 01001. doi: 10.1051/3u3d/201201001
Franz, G., von der Heyde, M., and Bülthoff, H. H. (2005). An empirical approach to the experience of architectural space in virtual reality' exploring relations between features and affective appraisals of rectangular indoor spaces. Autom. Constr. 14, 165–172. doi: 10.1016/j.autcon.2004.07.009
Freeman, L. C. (1977). A set of measures of centrality based on betweenness. Sociometry 40, 35–41. doi: 10.2307/3033543
Gagne, J., and Andersen, M. (2012). A generative facade design method based on daylighting performance goals. J. Build. Perfor. Simul. 5, 141–154. doi: 10.1080/19401493.2010.549572
Gath-Morad, M., Egli, S., Grübel, J., Steemers, K., Hólscher, C., and Hólscher, L. (2024). Designing affective workplace environments: the impact of typology, contour, ceiling and partition height on cognitive and aesthetic appraisal. Build. Environ. 265:111928. doi: 10.1016/j.buildenv.2024.111928
Gerber, D. J., and Lin, S.-H. E. (2014). Designing in complexity: simulation, integration, and multidisciplinary design optimization for architecture. Simulation 90, 936–959. doi: 10.1177/0037549713482027
Gillis, K., and Gatersleben, B. (2015). A review of psychological literature on the health and wellbeing benefits of biophilic design. Buildings 5, 948–963. doi: 10.3390/buildings5030948
Goldstein, R., Walmsley, K., Morris, N., and Tessier, A. (2023). “Algorithms for voxel-based architectural space analysis,” in Annual Modeling and Simulation Conference (ANNSIM), 508–519.
Gregorians, L., Velasco, P. F., Zisch, F., and Spiers, H. J. (2022). Architectural experience: clarifying its central components and their relation to core affect with a set of first-person-view videos. J. Environ. Psychol. 82:101841. doi: 10.1016/j.jenvp.2022.101841
Haq, S. (2019). Where we walk is what we see: foundational concepts and analytical techniques of space syntax. HERD 12, 11–25. doi: 10.1177/1937586718812436
Hazbei, M., and Cucuzzella, C. (2021). Coherence of interior and exterior formal qualities in parametrically designed buildings. Int. J. Des. Eng. 10, 10–28. doi: 10.1504/IJDE.2021.113249
Hillier, B., Leaman, A., Stansall, P., and Bedford, M. (1976). Space syntax. Environ. Plan. B 3, 147–185. doi: 10.1068/b030147
Hillier, B., Penn, A., Hanson, J., Grajewski, T., and Xu, J. (1993). Natural movement: or, configuration and attraction in urban pedestrian movement. Environ. Plann. B 20, 29–66. doi: 10.1068/b200029
Ige-Elegbede, J., Pilkington, P., Orme, J., Williams, B., Prestwood, E., Black, D., et al. (2022). Designing healthier neighbourhoods: a systematic review of the impact of the neighbourhood design on health and wellbeing. Cities Health 6, 1004–1019. doi: 10.1080/23748834.2020.1799173
Ishikawa, T., Nakata, S., and Asami, Y. (2011). Perception and conceptualization of house floor plans: an experimental analysis. Environ. Behav. 43, 233–251. doi: 10.1177/0013916509356874
IWBI (2015). The WELL Building Standard, Version 2.0. Available online at: https://www.wellcertified.com (accessed November 1, 2024).
Jakupi, A. B. (2016). Landscape architecture as environmental harmony. Int. J. Contemp. Archit. 3, 43–50.
Jones, N. L., Greenberg, D. P., and Pratt, K. B. (2012). Fast computer graphics techniques for calculating direct solar radiation on complex building surfaces. J. Build. Perfor. Simulat. 5, 300–312. doi: 10.1080/19401493.2011.582154
Kamalmaz, S. (2022). Co-Generative: A Generative Design Paradigm for Fostering Regenerative Communities. OCAD University.
Kellert, S. R., and Calabrese, E. F. (2015). The Practice of Biophilic Design. Available online at: www.biophilic-design.com/ (accessed November 1, 2024).
Kirkpatrick, S., Gelatt, C. D., and Vecchi, M. P. (1983). Optimization by simulated annealing. Science 220, 671–680. doi: 10.1126/science.220.4598.671
Kirsh, D. (2023). Atmosphere, mood, and scientific explanation. Front. Comput. Sci. 5. doi: 10.3389/fcomp.2023.1154737
Lee, L. N., and Kim, M. J. (2020). A critical review of smart residential environments for older adults with a focus on pleasurable experience. Front. Psychol. 10:3080. doi: 10.3389/fpsyg.2019.03080
MASS Design Group (2020). Designing Senior Housing for Safe Interaction. Available online at: https://massdesigngroup.org/sites/default/files/multiple-file/2020-07/Designing%20Senior%20Housing%20for%20Safe%20Interaction.pdf (accessed November 1, 2024).
Molina, G. (2021). Exploring, Modelling, and Simulating the Feeling of Comfort in Residential Settings [PhD thesis]. Wellington: Victoria University of Wellington.
Nagy, D., Lau, D., Locke, J., Stoddart, J., Villaggi, L., Wang, R., et al. (2017). “Project discover: an application of generative design for architectural space planning,” in Symposium on Simulation for Architecture and Urban Design (SimAUD), 1–8.
O'Sullivan, K., Shirani, F., Hale, R., Pidgeon, N., and Henwood, K. (2023). Identity, place narrative and biophilic urban development: connecting the past, present and future for sustainable liveable cities. Front. Sustain. Cities 5:1139029. doi: 10.3389/frsc.2023.1139029
Peri Bader, A. (2015). A model for everyday experience of the built environment: the embodied perception of architecture. J. Archit. 20, 244–267. doi: 10.1080/13602365.2015.1026835
Rehman, Z., Zubair, M., Hafiz, D. O., and Manzoor, S. A. (2024). Biodiversity and quality of urban green landscape affect mental restorativeness of residents in Multan, Pakistan. Front. Sustain. Cities 5:1286125. doi: 10.3389/frsc.2023.1286125
Salingaros, N. A. (2021). Rules for urban space: Design patterns create the human scale. J. Urban Res. Dev. 2, 4–16.
Schwartz, M. (2021). Human centric accessibility graph for environment analysis. Autom. Constr. 127:103557. doi: 10.1016/j.autcon.2021.103557
Sonta, A., and Jiang, X. (2023). Rethinking walkability: exploring the relationship between urban form and neighborhood social cohesion. Sustain. Cities Soc. 99:104903. doi: 10.1016/j.scs.2023.104903
Srivastava, C., Murnane, E. L., Billington, S. L., and Samuelson, H. W. (2024). Impact of workplace design on perceived work performance and well-being: home versus office. J. Environ. Psychol. 95:102274. doi: 10.1016/j.jenvp.2024.102274
Standfest, M. (2022). “Reducing bias for evidence-based decision making in design,” in Towards Radical Regeneration, 122–132. doi: 10.1007/978-3-031-13249-0_11
Standfest, M., Franzen, M., Schröder, Y., Gonzalez Medina, L., Hernandez, Y. V., Buck, J. H., et al. (2022). Swiss dwellings: a large dataset of apartment models including aggregated geolocation-based simulation results covering viewshed, natural light, traffic noise, centrality and geometric analysis (3.0.0) [Data set]. Zenodo. doi: 10.5281/zenodo.7788422
St-Jean, P., Clark, O. G., and Jemtrud, M. (2022). A review of the effects of architectural stimuli on human psychology and physiology. Build. Environ. 219:109182. doi: 10.1016/j.buildenv.2022.109182
Terrapin Bright Green (2014). 14 Patterns of Biophilic Design: Improving Health and Well-being in the Built Environment. Available online at: https://www.terrapinbrightgreen.com/report/14-patterns (accessed November 1, 2024).
Tsang, E. K. W., Li, D. H. W., and Li, S. (2022). Predicting daylight illuminance for 15 CIE standard skies using a simple software tool. Front. Sustain. Cities 4:792997. doi: 10.3389/frsc.2022.792997
Turan, I., Chegut, A., Fink, D., and Reinhart, C. (2021). Development of view potential metrics and the financial impact of views on office rents. Landsc. Urban Plan. 215:104193. doi: 10.1016/j.landurbplan.2021.104193
Turner, A., Doxa, M., O'Sullivan, D., and Penn, A. (2001). From isovists to visibility graphs: a methodology for the analysis of architectural space. Environ. Plan. B 28, 103–121. doi: 10.1068/b2684
Ulrich, R. S., Zimring, C., Zhu, X., DuBose, J., Seo, H.-B., Choi, Y.-S., et al. (2008). A review of the research literature on evidence-based healthcare design. HERD 1, 61–125. doi: 10.1177/193758670800100306
Van Oosterwyck, D. (2018). Experiential Qualities in Architecture [PhD thesis]. Antwerp: Faculty of Design Sciences, University of Antwerp.
Vartanian, O., Navarrete, G., Palumbo, L., and Chatterjee, A. (2023). Individual differences in preference for architectural interiors. J. Environ. Psychol. 77:101668. doi: 10.1016/j.jenvp.2021.101668
Verderber, S. (2022). Reimagining Long-Term Care Architecture in Post-Pandemic Ontario–and Beyond. Centre for Design + Health Innovation, University of Toronto.
Watson, K. J. (2018). Establishing psychological wellbeing metrics for the built environment. Build. Serv. Eng. Res. Technol. 39, 232–243. doi: 10.1177/0143624418754497
Wiener, J. M., and Franz, G. (2005). “Isovists as a means to predict spatial experience and behavior,” in Spatial Cognition IV. Reasoning, Action, Interaction, 42–57. doi: 10.1007/978-3-540-32255-9_3
Woo, M., MacNaughton, P., Lee, J., Tinianov, B., Satish, U., and Boubekri, M. (2021). Access to daylight and views improves physical and emotional wellbeing of office workers: a crossover study. Front. Sustain. Cities 3:690055. doi: 10.3389/frsc.2021.690055
Zallio, M., and Clarkson, P. J. (2022). The inclusion, diversity, equity and accessibility audit. a post-occupancy evaluation method to help design the buildings of tomorrow. Build. Environ. 217:109058. doi: 10.1016/j.buildenv.2022.109058
Zamanifard, H., Alizadeh, T., Bosman, C., and Coiacetto, E. (2019). Measuring experiential qualities of urban public spaces: users' perspective. J. Urban Design 24, 340–364. doi: 10.1080/13574809.2018.1484664
Zhang, F., Seshadri, K., Pattupogula, V. P. D., Badrinath, C., and Liu, S. (2023). Visitors' satisfaction towards indoor environmental quality in australian hotels and serviced apartments. Build. Environ. 244:110819. doi: 10.1016/j.buildenv.2023.110819
Keywords: spatial analysis, experiential qualities, social cohesion, biophilic design, pathfinding, visibility, crowdsourced online surveys
Citation: Goldstein R, Shahmansouri N, Mogk JPM, Herrera S, Gault D, Brudy F, Lee M, Calin L, Lay Herrera T, Szkurlat D and Walmsley K (2025) Experiential space analysis: scoring tranquil, social, and explorative places in habitable buildings. Front. Sustain. Cities 7:1530431. doi: 10.3389/frsc.2025.1530431
Received: 18 November 2024; Accepted: 29 May 2025;
Published: 24 June 2025; Corrected: 25 June 2025.
Edited by:
Nishant Raj Kapoor, Academy of Scientific and Innovative Research (AcSIR), IndiaReviewed by:
Sandeep Budde, University of Alberta, CanadaSuranjan Majumder, University of North Bengal, India
Copyright © 2025 Goldstein, Shahmansouri, Mogk, Herrera, Gault, Brudy, Lee, Calin, Lay Herrera, Szkurlat and Walmsley. This is an open-access article distributed under the terms of the Creative Commons Attribution License (CC BY). The use, distribution or reproduction in other forums is permitted, provided the original author(s) and the copyright owner(s) are credited and that the original publication in this journal is cited, in accordance with accepted academic practice. No use, distribution or reproduction is permitted which does not comply with these terms.
*Correspondence: Kean Walmsley, a2Vhbi53YWxtc2xleUBhdXRvZGVzay5jb20=