 Živa Ravnikar
 Alfonso Bahillo
 Barbara Goličnik Marušić
- 1Urban Planning Institute of the Republic of Slovenia (UIRS), Ljubljana, Slovenia
- 2Department of Signal and Communications Theory and Telematic Engineering, Universidad de Valladolid, Valladolid, Spain
This study advances urban planning and climate adaptation science by employing Information and Communication Technologies (ICT) for a detailed assessment of urban microclimate and user comfort in Ljubljana, Slovenia. The research addresses a significant gap in urban environmental assessments by providing real-time, fine-granularity data to support urban planners in tackling comfort-related issues at the street level. Using a previously developed microclimate and user-comfort street assessment protocol, the study conducts an in-depth case analysis of five distinct streets in Ljubljana. Data on temperature, noise, humidity, and air quality were collected using ICT tools and analyzed with Geographic Information System (GIS) technology to map and identify zones with varying comfort levels. The methodology systematically analyses these data, allowing for descriptive and cumulative mapping of comfortable, uncomfortable, and extreme uncomfortable zones across diverse urban morphologies, including historic, contemporary, high-density, and low-density areas. By identifying microclimate and user-comfort issues, the study provides insights into site-specific conditions and reveals differences in conditions based on the type of urban pattern. On all five streets, we identified the presence of uncomfortable temperature and noise conditions. Street 1, Zone I is the most critical area, with extremely uncomfortable conditions for 24%−81% of the time and uncomfortable conditions for 68%−89% of the time. The findings demonstrate that environmental conditions can vary considerably between individual streets, within compact urban areas of Ljubljana. This underlines the value of spatially distributed data collection as a necessary complement to traditional monitoring systems, which are typically limited to only a few fixed locations used by the city. The confirmation of the hypothesis “Detailed microclimate and user comfort related data gathered by the ICT and GIS based protocol for street assessment can significantly assist urban planners in better recognition and interpretation of microclimate- and user comfort-related issues in urban environments” establishes the primary contribution of this research. This study offers a transparent, replicable method that urban planners can use to assess environmental conditions and make informed decisions for improving urban quality.
1 Introduction
Microclimate and user-comfort parameters, as site-specific conditions affecting human comfort, remain underutilized in urban planning and environmental research. Current studies, while often covering valuable microclimatic aspects relevant to urban planning (Liu et al., 2022; Ysebaert et al., 2021; Xu et al., 2023), lack an integrated approach that equips urban planners with the necessary methods to comprehensively assess city streets and identify areas requiring targeted interventions (Ravnikar et al., 2023). Despite advancements in simulation tools (Cheng et al., 2022; Lai et al., 2022; Zhao et al., 2024), which enable a better understanding of the relationships between built and natural environments and their impact on human comfort, comprehensive approaches based on real-world data are still needed in urban planning practice and research. Precise and real-time environmental data capture conditions as they are actually experienced by users, offering a more accurate and context-specific representation of environmental comfort in urban areas, and helping to identify micro-scale issues that simulations might overlook. The absence of such bottom-up approaches hinders cities' ability to accurately identify environmental challenges at the street level, which is a critical prerequisite for developing targeted, effective interventions that enhance urban environments. Acknowledging these gaps, our study applies an Information and Communication Technologies (ICT) and Geographic Information System (GIS)-based street assessment protocol developed by Ravnikar et al. (2023) to a case study in Ljubljana, Slovenia. The protocol systematically evaluates microclimate and user comfort, enabling the identification of zones with frequent unpleasant conditions and highlighting environmental challenges requiring attention. The study explores the potential of this approach for assessing spaces in terms of temperature, humidity, noise, and air quality by implementing the protocol on five different streets belonging to five characteristic urban patterns in the city. This study follows a dual approach: firstly, collecting detailed microclimate and user-comfort related data using the ICT, and secondly, conducting a descriptive analysis using GIS, a map-based medium, to interpret and address microclimate- and user comfort-related issues identified by data analysis. As already mentioned, methodologically, the core of this paper is the implementation of a microclimate and user-comfort related street assessment protocol (Ravnikar et al., 2023), recognized for its effectiveness in acquiring precise data for urban planning. The case study builds upon it and results in the refinement of the protocol, enhancing its analytical capabilities and evaluating its utility, particularly for identifying microclimate and user comfort related aspects and issues, which represent the first step toward improving human comfort and usability of urban spaces. The method offers explicit and transparent guidelines, proposing specific steps that urban planners/researchers can follow to evaluate the microclimate and user-comfort related conduciveness in public spaces concerning factors such as air temperature (°C), relative humidity (%), noise level (dBA), and air quality [PM 2.5 (μg/m3)]. In conclusion, this approach highlights the essential role of precise, ICT-enabled data collection and analysis in urban planning, setting a robust foundation for future initiatives aimed at improving urban environments. To sum up, the main contributions of this study include the development of a dataset with real-time, fine-granularity data that characterizes user-related comfort conditions in Ljubljana, capturing critical environmental parameters of user-related comfort conditions. Additionally, the study introduces a systematic data evaluation framework, which focuses on analyzing individual parameters and defining zones that indicate varying levels of comfort. Furthermore, the study focuses on simultaneous parameter analyses and defines zones indicating microclimate- and user comfort-related issues. This research ultimately provides urban planners and city managers with actionable insights, empowering them with an approach to effectively address urban planning issues and enhance the overall quality of urban spaces.
2 Background
Microclimate and user comfort conditions in urban areas are influenced by weather and various urban settings. Variations in building heights, street widths, vegetation, and surface materials interact to affect temperature, humidity, wind patterns, and air quality (Li et al., 2022, 2024; De Groeve et al., 2024; Tian et al., 2024). This interaction of urban design elements creates distinct microclimate variations across different areas, significantly influencing human comfort and the usability of spaces (Nikolopoulou and Lykoudis, 2007; Gehl, 2011; Antoniou et al., 2024). According to Barry (1970), microclimate conditions can vary between 1 and 100 meters, allowing for a diverse range of environmental conditions within a relatively compact geographical area. The localized climate phenomenon leads to unique issues and opportunities in urban planning. Although cities collect environmental data through fixed-position measurement stations, these do not allow for an understanding of site-specific conditions within the urban fabric. As highlighted by Ravnikar et al. (2023), understanding precise, locally influenced environmental conditions and incorporating microclimate and user-comfort considerations into urban planning is essential. Identifying these detailed conditions is a crucial first step in enhancing human comfort. Therefore, spatial and temporal resolution is important, and data must be in a format that urban planners can work with—geolocated data in the form of maps (Ravnikar et al., 2023). To analyze the microclimate characteristics of places, the analysis must include the following parameters: air temperature (°C), solar radiation (W/m2), surface temperature (°C), relative humidity (%), and wind speed (m/s). According to the literature, these factors significantly affect microclimate conditions and human comfort in urban areas (Ragheb et al., 2016; Bherwani et al., 2020; Sun et al., 2023). Additionally, in addressing the user-comfort aspect, it is also important to pay attention to the level of noise (dBA) and air quality, including PM 1.0, PM 2.5, PM 10.0 (μg/m3), and CO2 levels. As these factors as well significantly affect the comfort of spaces (Day, 2007; Guan et al., 2020; Miao et al., 2022; MacCutcheon, 2021). In addition to considering these parameters individually, it is essential to account for their synergistic effects, as their combined influence can significantly intensify human discomfort. For example, the combination of high temperatures and elevated humidity levels has been shown to greatly reduce the body's ability to dissipate heat through evaporative cooling, thereby increasing the risk of heat stress (Bu et al., 2024; Huang et al., 2021). Similarly, simultaneous exposure to noise and heat can exacerbate both physiological strain and psychological stress responses (Jafari et al., 2019; Golmohammadi and Darvishi, 2020). Moreover, poor air quality combined with elevated temperatures has been linked to higher rates of respiratory illness and mortality (European Environment Agency, 2023). Recognizing these combined effects is essential for developing assessments of urban comfort, as isolated parameter analysis may underestimate the true environmental burden experienced by individuals.
The inclusion of microclimate and user-comfort aspects in the planning process enables planners to assess places, identify potential issues, and propose solutions that enhance human comfort and the usage of space. However, Ravnikar et al. (2023) concluded that despite progress in developing new and innovative methods for gathering microclimate-related data, the review of existing techniques for mapping microclimates has revealed a significant knowledge gap in accurately determining microclimatic conditions at the pedestrian scale.
In this paper, we explore the potential of mapping microclimate and user-comfort in the context of smart cities, particularly through the collection of real-time data using ICT tools. The deployment of dense networks of IoT sensors and other ICT tools marks a transformative shift in how we monitor and manage urban environments (Mitro et al., 2022; Esfandi et al., 2024; Ullah et al., 2024). Integrating these technologies into regular urban management practices presents a significant opportunity to enhance the precision of environmental monitoring and urban planning strategies, thereby optimizing urban living conditions and sustainability efforts. For instance, the ability to continuously monitor and analyze environmental conditions via smart ICT systems allows for dynamic responses to environmental changes. Real-time data can activate systems that alert users when air quality is poor (Park et al., 2021), sensors measuring the heat island effect can inform urban planners where interventions are needed (Zhang and Yuan, 2023), and IoT systems for water-use efficiency can automate irrigation (Obaideen et al., 2022). Additionally, IoT-based sensors for flood monitoring and mapping (Arshad et al., 2019) can facilitate timely responses to flooding, thus ensuring optimal living conditions.
2.1 Hypothesis
Detailed microclimate and user comfort related data gathered by the ICT and GIS based protocol for street assessment can significantly assist urban planners in better recognition and interpretation of microclimate- and user comfort-related issues in urban environments. This research aims to demonstrate how such technological integration can enhance urban planning by providing detailed insights into environmental conditions variations and possible issues.
3 Method
This study follows a case study approach, employing a protocol for gathering and analyzing microclimate and user-comfort related data. The methodology is based on map-making and map-interpreting comfort related data to evaluate streets in terms of possible urban planning issues.
Firstly, the methodology follows a Ravnikar's et al. (2023) protocol for street assessment and performs the steps for data collection as well as designing a measurement campaign on five streets in five urban areas in Ljubljana, Slovenia. Secondly, an evaluation framework is established, based on data clustering, to create an inventory of comfort and to identify microclimate and user-comfort issues relevant for urban planning.
Detailed information regarding the protocol and the device used to collect the data is available in Ravnikar et al. (2023) (Section 3.2), and the data that support the findings of this study are publicly available from Zenodo at https://zenodo.org/records/10932142 (Ravnikar, 2024).
3.1 Protocol for microclimate and user-comfort related street assessment
The device was used to measure performance while attached to the bike. According to Ravnikar et al. (2023), the protocol follows four key steps: defining the area and the period of measurement; selecting the parameters to be measured and evaluated; determining the measurement time intervals; and analyzing the collected data. The final step focuses on examining comfort across streets while simultaneously analyzing the overall comfort rating to identify environmental issues. In this study, we present this step separately in Section 3.2—Evaluation Framework for Data Analysis—as we have refined it compared to the original protocol by introducing a more detailed zoning process that aggregates locations based on the frequency of comfort condition occurrences. This refinement begins with Step 3.2.3 and was necessary due to the larger volume of data collected, which required a more structured approach for evaluating zones—not only based on the presence of multiple simultaneous environmental challenges, but also considering the criticality derived from the frequency of uncomfortable conditions. This method allows for a more comprehensive and precise classification of zones, considering both the simultaneity of environmental effects and the prevalence of various comfort conditions.
3.1.1 The measuring area and time-period
The city of Ljubljana has ~293,820 inhabitants, and is known for its continental climate, characterized by cold winters and warm summers.
To cover versatile microclimate and user-comfort conditions, relevant selected streets or places are to be chosen within representative urban morphologies. Also, the entire observation/measuring period is to be defined regarding the main focus of the study and relevant research questions. It is recommended to cover an enclosed time period that corresponds with the issue of the research.
Accordingly, in the case of Ljubljana, five streets, spanning from 220 m to 1,800 m, with different morphological characteristics, are selected for in-depth analysis (Figure 1). The first street is characterized by a relatively compact urban pattern with areas of both low-density and high-density urban configurations combined by natural morphological features such as urban tree lines and small sized green spaces (mostly linear) (Table 1). The second street is characteristic of a low-density urban pattern, where the most common morphological features include linear green spaces along the street, small sized compact green area, and private gardens with individual trees providing shade to the street. The third street is defined entirely as open space, characteristic of an urban forest representing a natural morphological feature, including natural terrain and dense, high vegetation. The fourth street transitions to densely built-up urban pattern, where besides the large presence of paved surfaces, the natural morphological elements consisting of linear green spaces, including lined urban trees and compact green spaces, occur. Finally, the fifth street is characterized by a densely built-up historic urban pattern and is located in the historic city center. Minimum natural morphological features are present: river, compact green space, and line of trees along the river.
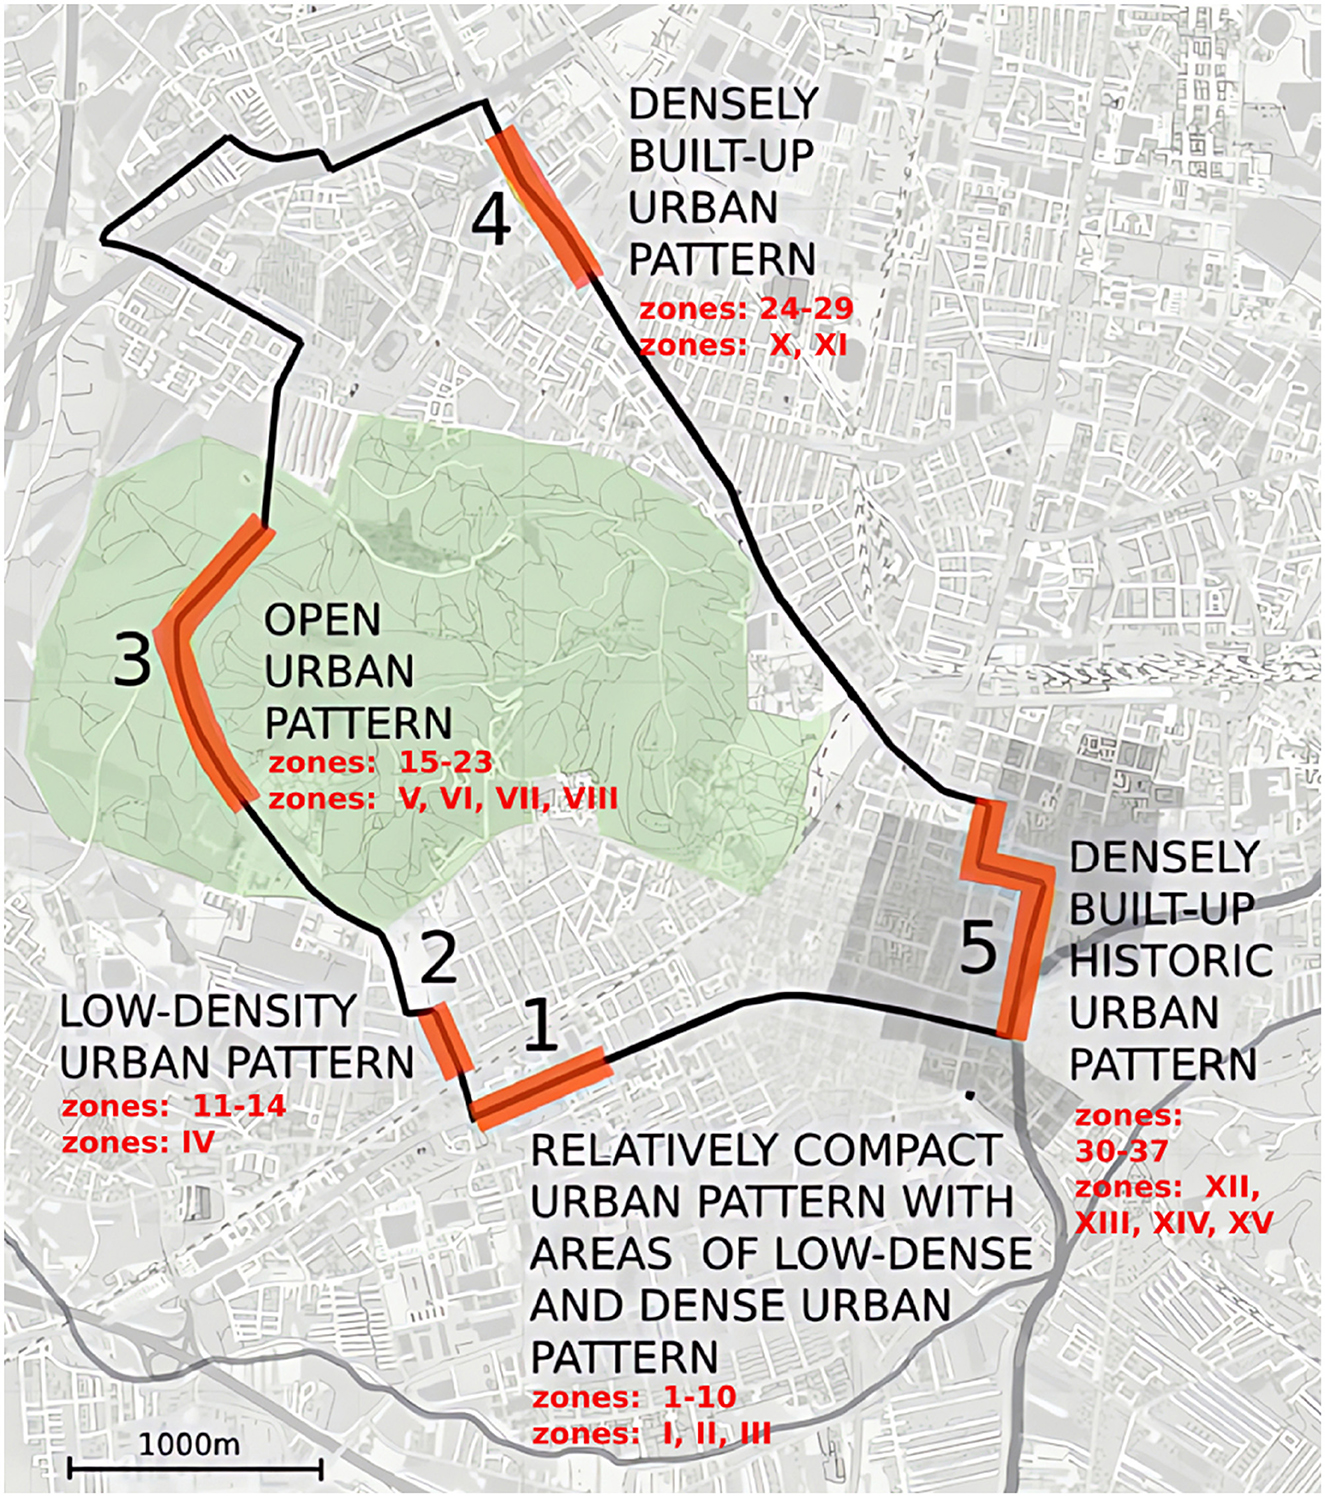
Figure 1. A layout of five selected streets within the five characteristic urban patterns of the city of Ljubljana (Slovenia) along with corresponding zones indicating varying levels of comfort (expressed with number) and zones indicating microclimate- and user comfort-related issues presented (expressed with Roman number).
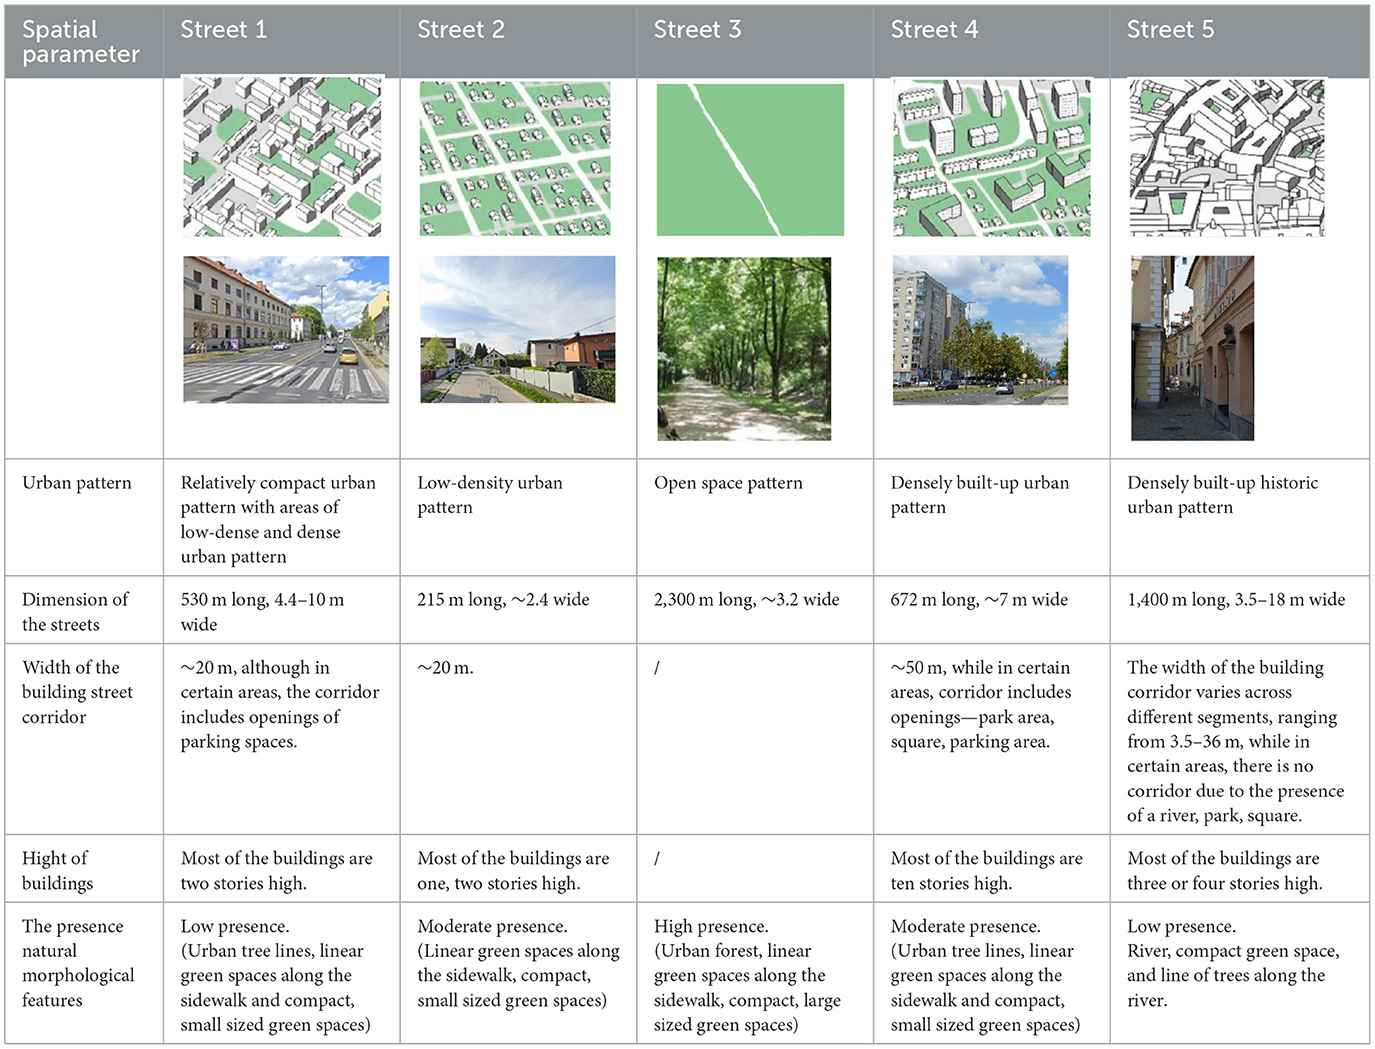
Table 1. Spatial characteristics of pilot cases.
The time-period was set up in August 2022, to cover the period when temperatures due to summer season are expected to be high (and the maximum values regarding the temperature can be collected), and where due to holiday season (less traffic) traffic-caused noise was expected to be lower (to cover, easily bearable conditions regarding noise). The campaign was scheduled to run daily, excluding rainy days (summer storms), covering morning and afternoon sessions of the day. It resulted in 37 data collection sessions over 23 days, with 23 in the afternoon and 14 in the morning. While the data collection was limited to August, to demonstrate the type and approach toward the analysis to inform urban planning and design about the potential of various microclimate- and user comfort-related data for urban planning, a comprehensive analysis would benefit from incorporating data across various months, to adequately cover the behavior of each parameter over the year or season.
3.1.2 Parameters to be measured and evaluated
To cover the parameters relevant for human comfort in urban environments, it is crucial to define those that reflect on the phenomena studied and if possible, also to be comparable data available from eventual stationary sources of microclimate or other place quality related data. According to the literature, the most common are air temperature, solar radiation, humidity, also wind velocity, air quality, and level of noise. Some very detailed studies may focus also on more subjective parameters such as human perception and place attachment, or even typology of activities and clothing worn by that.
However, this paper, using the data collected for setting up the protocol for street assessment (Ravnikar et al., 2023), uses the basic parameters that are provided by the device which hardware consists of sensors for the simultaneous collection of environmental data of air temperature (°C), relative humidity (%), noise level (dBA), and air quality [PM 2.5 (μg/m3)]. Despite this, these parameters represent a basic set of parameters measured for quality of living in urban environment and are therefore considered as sufficient to analyze a city's microclimate- and user comfort-related conditions, and to assess the potential of this approach for user-comfort interpretation in urban planning based on the collection of these real-time data. Yet, the procedure can easily be expanded to include new and relevant parameters if needed.
3.1.3 Time intervals
Time intervals are defined to capture the required environmental conditions on pilot cases. They may require either minimum or maximum values, or any significant values in line with the research focus.
This study was focused in the conditions on the street in the usually used for commuting (morning, afternoon). To capture the air quality and noise pollution, as well as the heightened afternoon temperatures in these peak times, the intervals were set from 7:30 to 9:00 a.m. and from 3:00 to 5:30 p.m. During these intervals, the tool used facilitated data collection at five-second intervals, providing a high level of data temporal resolution (for more see Ravnikar et al., 2023).
In the further steps (data analysis), morning and afternoon sessions are analyzed together, as the primary focus of this study is to evaluate overall commuter comfort throughout the day by using the same path in both the morning and afternoon. By combining data from both periods, we aim to capture a comprehensive picture of comfort levels over an entire day, rather than isolating conditions to one time. This approach helps urban planners identify locations with persistent issues. However, the method can be adjusted to focus on time-specific variations if needed, allowing for separate analyses of morning and afternoon conditions.
3.2 Evaluation frame for data analysis
The evaluation framework is set up to perform the analysis of comfortable, uncomfortable, and extremely uncomfortable conditions and to indicate possible microclimate and user-comfort issues for urban planning.
The first steps (3.2.1 and 3.2.2) are related to data clustering which start with data transfer from the ICT device equipped with sensors for collecting data about air temperature, relative humidity, noise level, and particulate matter, to its aggregation against specific comfort level and single as well as multiple parameters evaluation. To enhance data precision further, we calibrated the collection speed to 7 km/h, so the device took measurements at 5-s intervals, where regarding the speed of cycling, measurements were taken every 10 m. Subsequently, an inventory of comfort conditions is conducted (Section 3.2.3) and spatial zones (expressed by numbers) are allocated reflecting the full range of comfort levels (Section 3.2.4). Finally, an evaluation of conditions related to microclimate and user comfort is performed (Section 3.2.5), and the final zones are formed, represented by Roman numerals (Section 3.2.6).
3.2.1 Data preparation
The data is initially stored on a SD card within the ICT device hardware, therefore transfer of the datasets from the SD card to GIS software represents the initial step of the analysis and evaluation process. This transfer is necessary to utilize the powerful analytical capabilities of GIS, allowing for the integration, manipulation, and visualization of spatial and temporal microclimate- and user comfort-related data.
As part of the data preparation process, data aggregation and data mining techniques are needed. Given the quantity of dataset obtained from any device, the objective is to identify patterns in the occurrence of microclimate- and user comfort-related conditions, and to interpret these occurrences in terms of human comfort levels and identifying possible microclimate- and user comfort-related aspects. GIS environment allows a systematic aggregation of the data by grouping them according to specific parameters such as time, date, location, type of microclimatic parameter, level of comfort, and its occurrence rate in a place.
3.2.2 Data clustering to identify human comfort zones
To interpret data through the lens of human comfort, the analyses consider a range of conditions that people perceive as comfortable, uncomfortable, and extremely uncomfortable. A thorough literature review is necessary to identify the thresholds that define intervals indicating ranges of comfort for each parameter. For the European context, the classifications of comfort values for temperature are as follows (SimScale, 2025; Roshan et al., 2019; Sánchez Jiménez and Ruiz de Adana, 2024).
• Comfortable: 18–25°C
• Uncomfortable: 25–35°C
• Extremely uncomfortable: above 35°C
Considering noise, the classification is based on the Environmental Noise Guidelines, using following threshold intervals: WHO (2022, 1999).
• Comfortable: 0–53 dBA
• Uncomfortable: 53–70 dBA
• Extremely uncomfortable: above 70 dBA
Air-quality intervals are also based on the World Health Organization's air-quality guideline values (WHO, 2021) and are stratified as follows:
• Comfortable: 0–20 μg/m3
• Uncomfortable: 20–25 μg/m3
• Extremely uncomfortable: above 25 μg/m3
Humidity was addressed in line with the general recommendations for indoor and outdoor humidity in European climates and is considered as follows:
• Comfortable: 0%−30%
• Uncomfortable: 30%−60%
• Extremely uncomfortable: above 60%
Having defined the intervals of comfort levels for each parameter, GIS based maps legends are adequately suggested: green representing comfortable values, orange representing uncomfortable values, and red representing extremely uncomfortable values (see Figure 2). Additionally, to better contextualize and understand the linkage between comfortable conditions, environmental data, and spatial elements, it is recommended that the base layer of satellite images is also a part of geolocated information on a map. Additional layers such as detailed vegetation plans can be also beneficial so streets can be analyzed in terms of presence of natural morphological features.
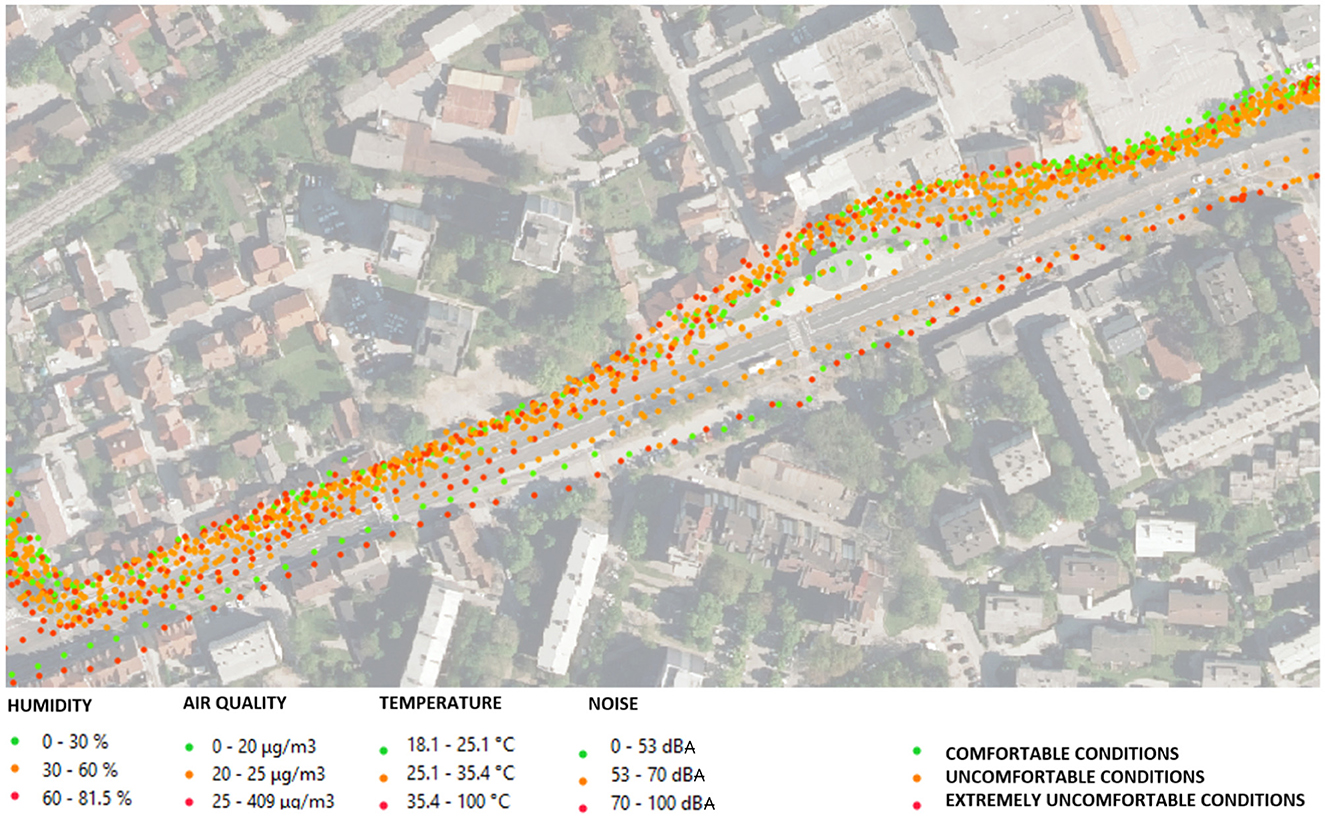
Figure 2. Legend for interpreting environmental data in relation to human comfort values. Different colors indicate varying levels of comfort, based on a threshold classification of comfort ranges. As an example, the illustration presents 37 measurement sessions (23 in the afternoon and 14 in the morning), recorded over 23 days on Street 1, where all three comfort levels were observed: comfortable (green), uncomfortable (orange), and extremely uncomfortable (red).
3.2.3 Identifying comfort zones: single-parameter mapping of individual comfort levels
This step involves creating an inventory of comfort conditions for each pilot case, where locations are analyzed independently based on a single parameter and categorized into autonomous comfort levels: comfortable, uncomfortable, and extremely uncomfortable (see Figure 3). The process begins by mapping locations where comfortable conditions frequently occur during 37 data collection sessions conducted over 23 days. To achieve this, data from individual sessions reflecting comfortable conditions are overlapped. In areas where the data is graphically concentrated on the map—indicating a frequent occurrence of comfort—the zones are formed using hand-drawn polygons in GIS software. The zoning process used to define zones with uncomfortable and extremely uncomfortable conditions followed the same approach. “Frequent occurrence” term refers to conditions that are present at least 20% of the time across the 37 measuring sessions. This threshold is defined regarding the percentage of the total measurement sessions, ensuring the reliability of the case. In this pilot study, a minimum threshold of 20% was set, meaning that only conditions occurring in at least 7 individual sessions over the entire measurement period are considered significant. This relatively low threshold was chosen to enable a detailed examination of variations in environmental condition patterns, allowing urban planners and researchers to develop specific inventories of comfort conditions. However, the threshold for identifying microclimate- and user comfort-related issues on streets, as presented in the 3.2.5 step, is set at a higher level.
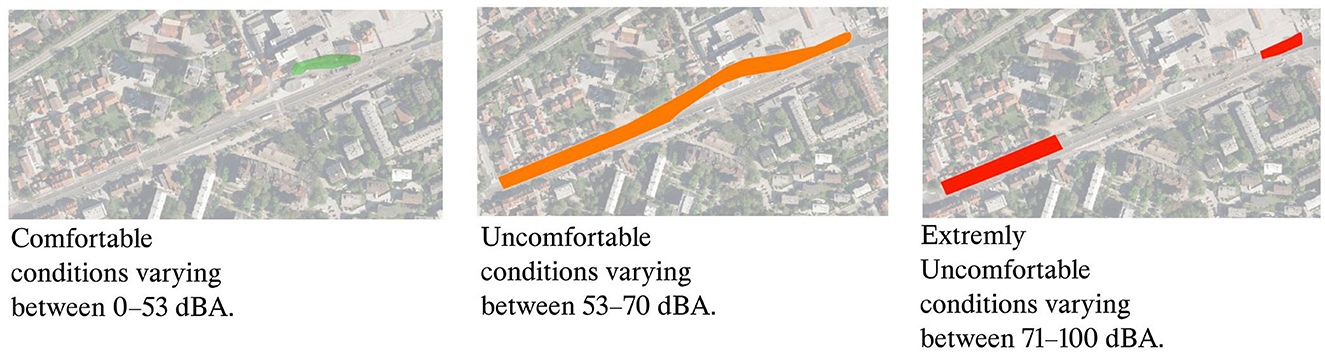
Figure 3. Example of zone definition, indicating areas where a specific level of comfort for a selected parameter is frequently present in space (i.e., for more than 20% of the time measured). The illustration specifically refers to noise conditions, showing where different comfort levels—comfortable (green), uncomfortable (orange), and extremely uncomfortable (red)—occur frequently enough to define distinct spatial zones.
3.2.4 Identifying the spectrum of comfort: single-parameter analysis
Cumulative maps for individual parameters are developed to reveal the full spectrum of comfort across the observed streets. This is accomplished by overlapping single comfort level maps defined in the previous step (see Section 3.2.3). The overlapping process of maps generates new zone formation (expressed numerically 1–37), where due to the intersection of zones with individual comfort levels, new zones indicate a complete range of comfort levels (see the Figure 4). The overlapping process is done without any hierarchy, meaning a single zone can simultaneously reflect all three comfort levels—comfortable, uncomfortable, and extremely uncomfortable. The purpose of this overlapping is to ensure that no comfort level is prioritized over another, allowing multiple comfort conditions to coexist within the same spatial area. This coexistence of comfort levels at the same locations is possible because the environmental conditions recorded at each location (measurements taken every 10 m) can vary significantly. This variability highlights the dynamic nature of the urban environment, where microclimatic differences and localized influences result in diverse comfort levels within a short distance.
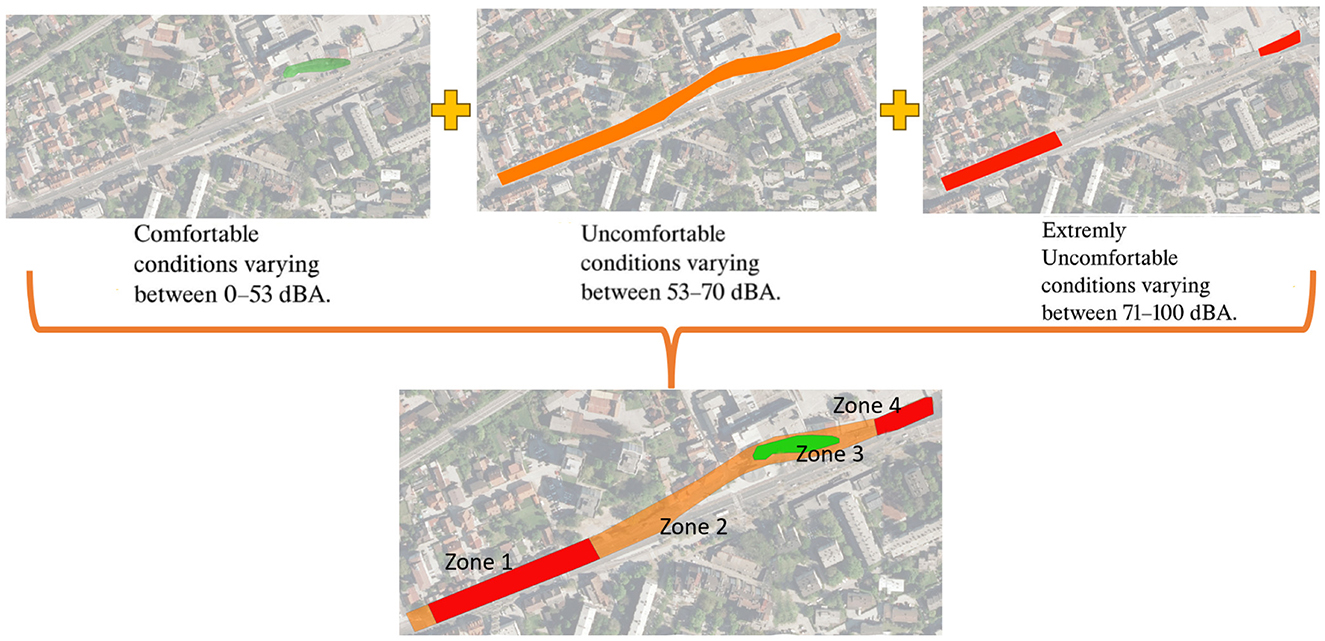
Figure 4. The figure presents the zoning process based on the overlap of individual comfort maps, resulting in spatial zones that reflect the overall comfort spectrum.
Further, a statistical analysis is conducted to calculate the percentage occurrence of each comfort level within each zone. This analysis is graphically represented by multiple rings, with different colors (see Figure 5) indicating the most frequently observed comfort levels: red for “extremely uncomfortable,” orange for “uncomfortable,” and green for “comfortable” conditions. These rings are based on percentage occurrence of data from 37 measurement sessions. Importantly, the percentages within a single zone do not sum to 100%, as each comfort level can independently range from 0%−100%, depending on how frequently each condition was present.
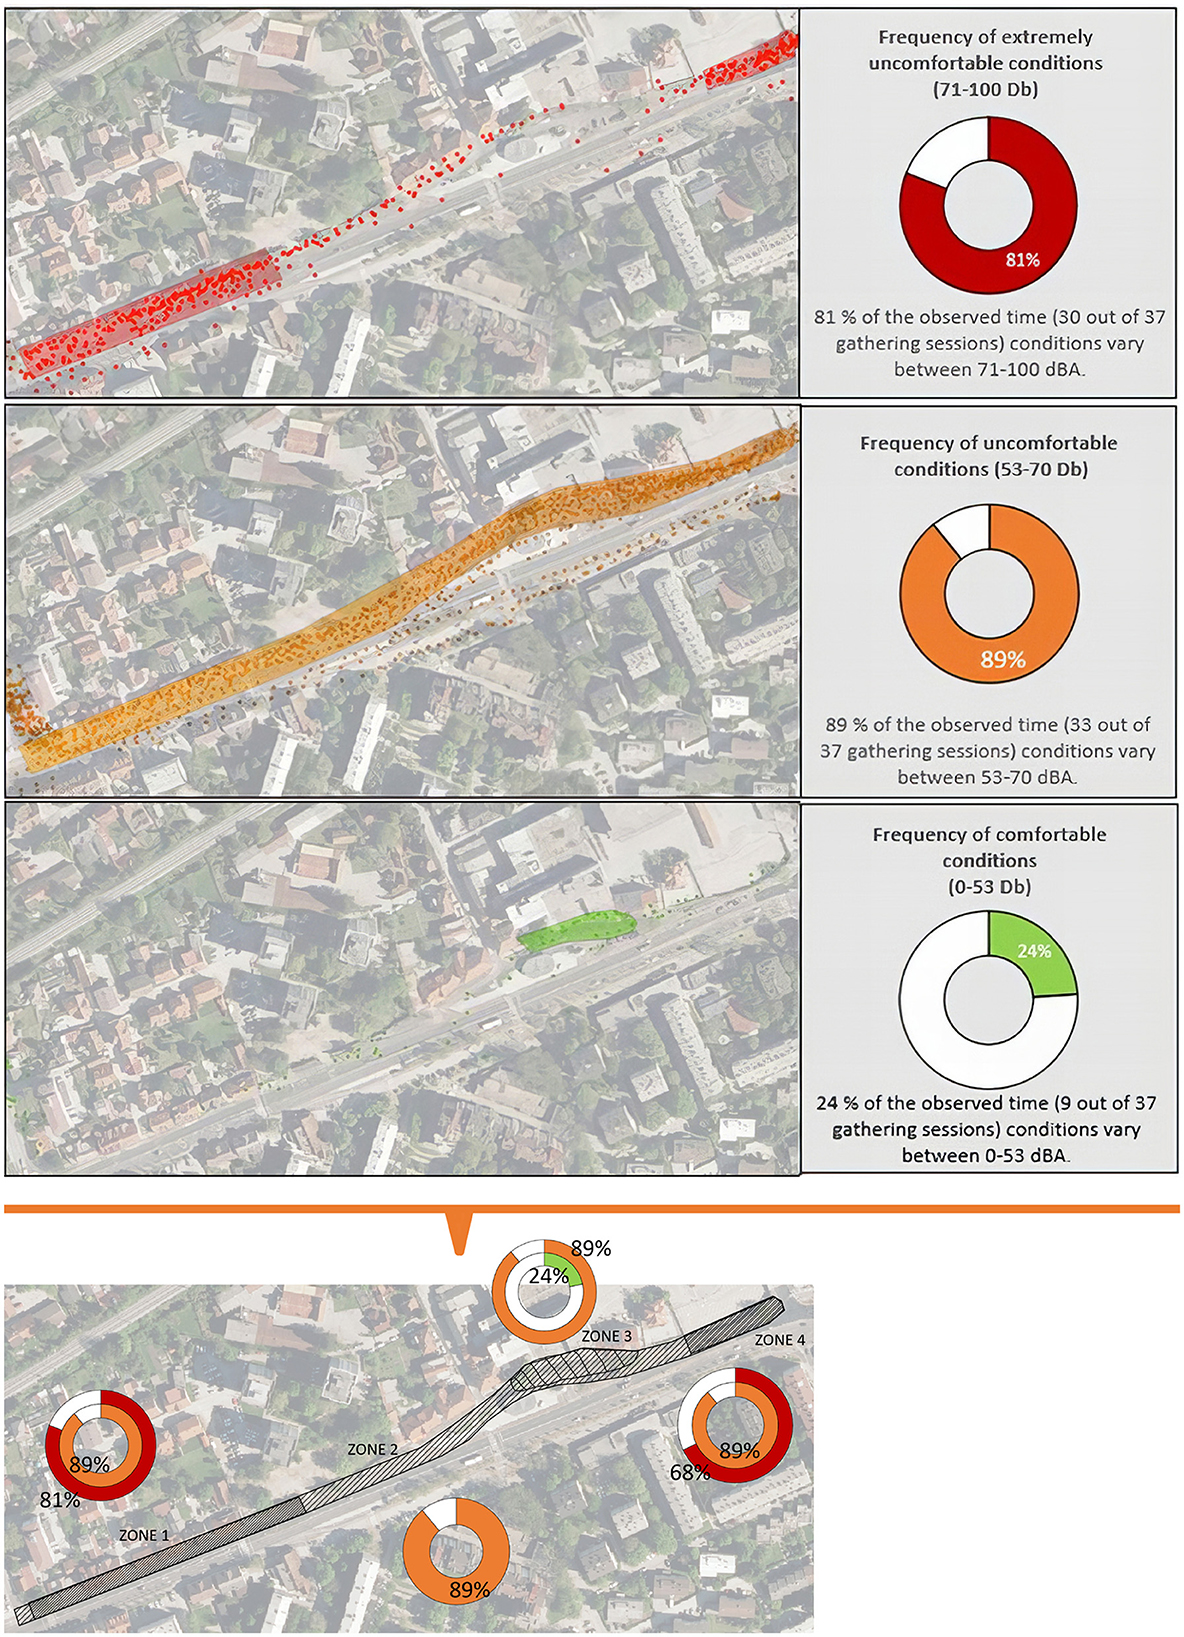
Figure 5. Street 1, where zone formations (Zones 1, 2, 3, and 4) were generated by overlapping individual noise comfort levels, illustrates a spectrum of comfort. For each zone, a donut chart illustrates the frequency of different comfort levels, derived from statistical analysis of data collected across 37 measurement sessions. The colored rings represent different levels of comfort: comfortable (green), uncomfortable (orange), and extremely uncomfortable (red). These percentages are calculated independently for each comfort level and may range from 0% to 100%, meaning that the segments within a single donut chart do not necessarily sum to 100%. This representation enables the identification of the most frequently observed comfort conditions in each zone.
Considering the described approach, it is possible to compare streets based on the presence of specific comfort levels. However, when performing such a comparison, it is crucial to take into account the varying dimensions of individual zones within each street, as these differences can significantly influence the interpretation of comfort level distribution.
3.2.5 Identifying microclimate- and user comfort-related issues (simultaneous parameter analysis)
This step is performed by a new process of spatial overlapping of zones, which are designated by Roman numerals I–XV (see Figure 6). The process includes an analysis of all zones where uncomfortable conditions are present more than 50% of the time, and extreme conditions from 1% onwards, indicating environmental issues. Comfort zones were excluded from consideration. The overlay was performed simultaneously for all parameters, meaning new zones are offering information about the frequency of discomfort and the type of parameter to which the discomfort refers (see Section 4.3).
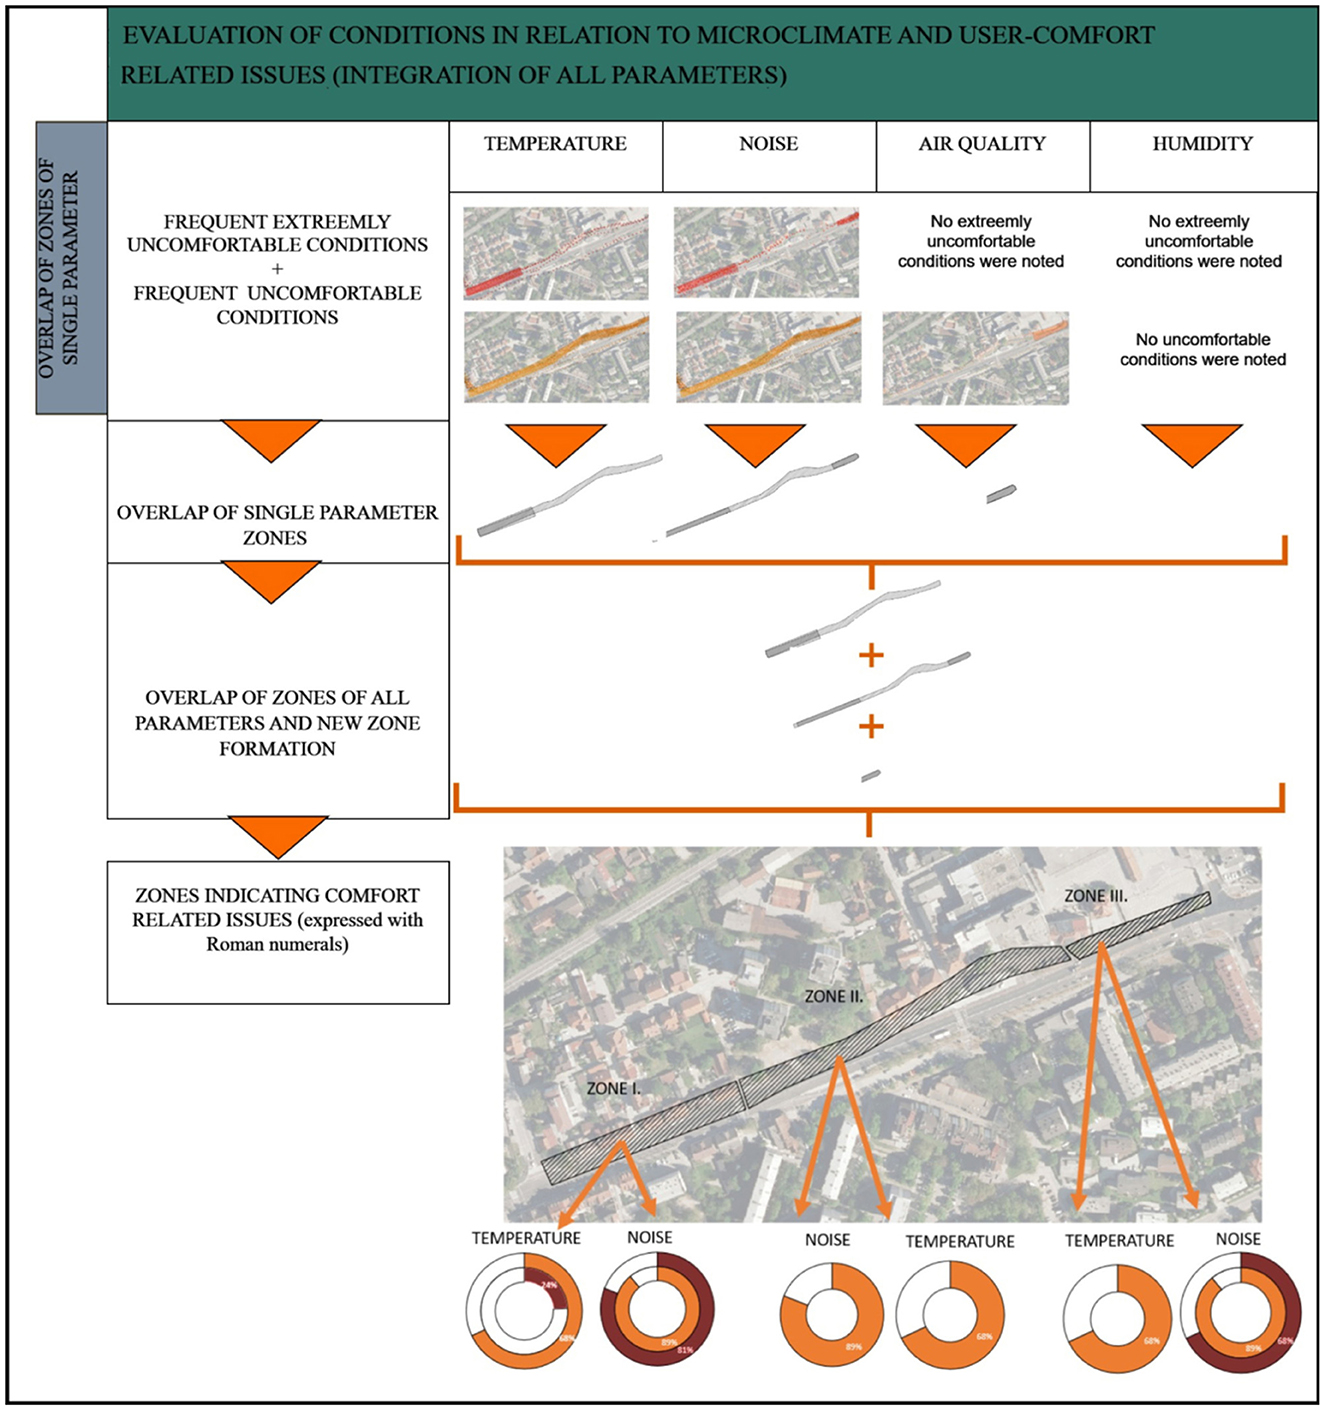
Figure 6. The process of identifying critical zones through the spatial overlap of single-parameter discomfort zones for temperature, noise, air quality, and humidity. Only areas with frequent uncomfortable conditions (occurring more than 50% of the time) and extreme discomfort (from 1% occurrence onward) were included, while comfortable zones were excluded. The integration of all parameters resulted in the formation of new zones, delineated with Roman numerals (I–III in this example) and marked with dashed boundaries on the map. In addition, the lower part of the figure indicates the intensity and type of discomfort contributing to each zone.
3.2.6 Assessment of criticality of zones considering multiple discomfort parameters and frequency of occurrence
The next step is to assess the criticality of zones in terms of the issue present. First, we evaluated the number of uncomfortable parameters present in each zone. To reflect the compounded impact of multiple simultaneous discomfort factors, we introduced a rule that accounts for their combined effect. This ensures that zones affected by multiple parameters are recognized as more environmentally critical. Accordingly, the criticality categorization assigns lower categories to zones with only one uncomfortable parameter, and higher categories to those with several, based on the premise that multiple discomforts typically indicate greater environmental burden, for example, the combination of high temperatures and elevated concentrations of fine particulate matter (PM 2.5) significantly increases the risk of respiratory diseases and mortality (European Environment Agency, 2023). From a thermophysiological perspective, conditions involving both heat and high relative humidity are particularly critical, as they hinder effective evaporative cooling. When environmental stressors exceed the body's thermoregulatory capacity, various heat-related illnesses, including heat stroke, may occur (Centers for Disease Control and Prevention, 2024). In addition to physiological impacts, psychophysiological effects must also be considered. Simultaneous exposure to heat and noise, for instance, intensifies both physiological and psychological stress responses (Bodytrak, 2024; Jafari et al., 2019; Golmohammadi and Darvishi, 2020). Even in the absence of direct synergistic effects—such as between noise and humidity—cumulative exposure can still elevate perceived stress levels. Particularly concerning is the combination of noise and PM 2.5, which represents a typical case of environmental double stress with direct and compounded health effects (Babisch et al., 2014).
Due to the complexity of the interactions between parameters and the difficulty of determining an absolute hierarchy of combinations, we have introduced a simplified criticality assessment in this study. Category 4 criticality: a single environmental challenge is present; Category 3 criticality: two simultaneous challenges are present; Category 2 criticality: three simultaneous challenges are present; Category 1 criticality: four simultaneous challenges are present. This classification establishes a basic hierarchy of spatial prioritization, where a higher number of simultaneous challenges mean a higher level of spatial threat and thus a greater urgency for action (see Table 2).
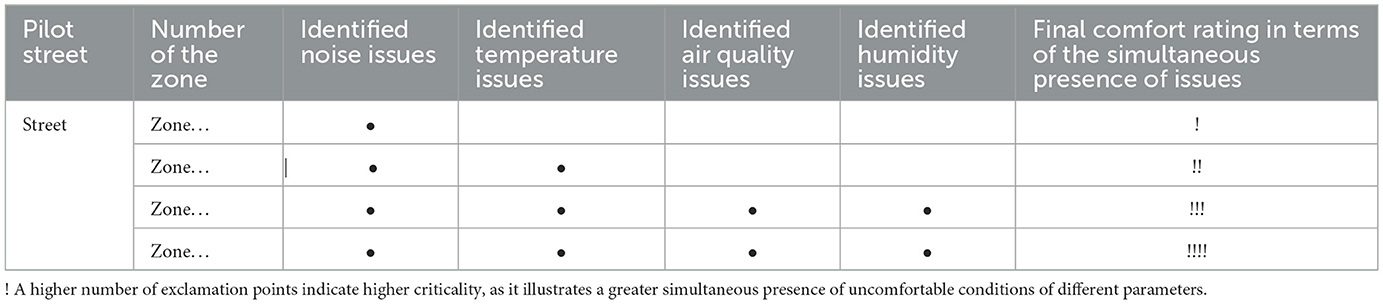
Table 2. The categorization of criticality is based on an analysis of the number of simultaneously present environmental challenges at a given location, which is shown in the table by the number of exclamation points (!).
The criticality rating is not based solely on the number of simultaneous discomforts parameters but also considers the frequency with which such conditions occur in a given zone. This does not directly affect the criticality category, but serves as an additional weight, illustrating the increased severity of conditions within an already determined category.
The weight category is divided into four classes:
• The highest class (class 1) is marked with the most intense color. This class shows that the zone is exposed to the most frequent uncomfortable conditions. Uncomfortable conditions of all parameters are present more than 50% of the time, while extremely uncomfortable conditions of all parameters are present more than 20% of the time.
• Class 2 (marked with a lighter color) includes zones where uncomfortable conditions of all parameters are present more than 50% of the time, and some parameters are characterized by extreme conditions more than 20% of the time.
• Class 3 (marked with the lightest color) indicates zones where uncomfortable conditions of all parameters are present for more than 50% of the time, while extreme values are detected in some parameters, ranging between 0% and 20%.
• Class 4, with the least pronounced uncomfortable conditions (marked in white), indicates zones that are exposed to uncomfortable conditions more than 50% of the time, but without the presence of extreme conditions.
Such an approach allows for visual distinction between different levels of criticality, with color shades clearly indicating the intensity of environmental impacts within each zone.
4 Analyses and results
This section presents a comprehensive analysis of comfort levels across the study area, focusing first on the evaluation of individual environmental parameters of noise, temperature, air quality, and humidity. Each parameter is assessed in terms of comfortable, uncomfortable, and extremely uncomfortable conditions, offering detailed insights into specific comfort levels (Section 4.1). Subsequently, zones with a spectrum of comfort for each parameter are presented, along with a comparison of comfort based on urban patterns in the five streets (Section 4.2). The results are supported by maps, graphs that illustrate the proportion of comfort levels across the zones within the streets, in Table 3, providing a visual summary of the comfort spectrum. Finally, the simultaneous parameter analysis is presented, where the combined effects of these parameters are examined to identify zones (expressed as I–XV) with significant microclimate and user-comfort issues. The most severe locations are identified, considering both the intensity of uncomfortable conditions and the simultaneous presence of multiple parameters.
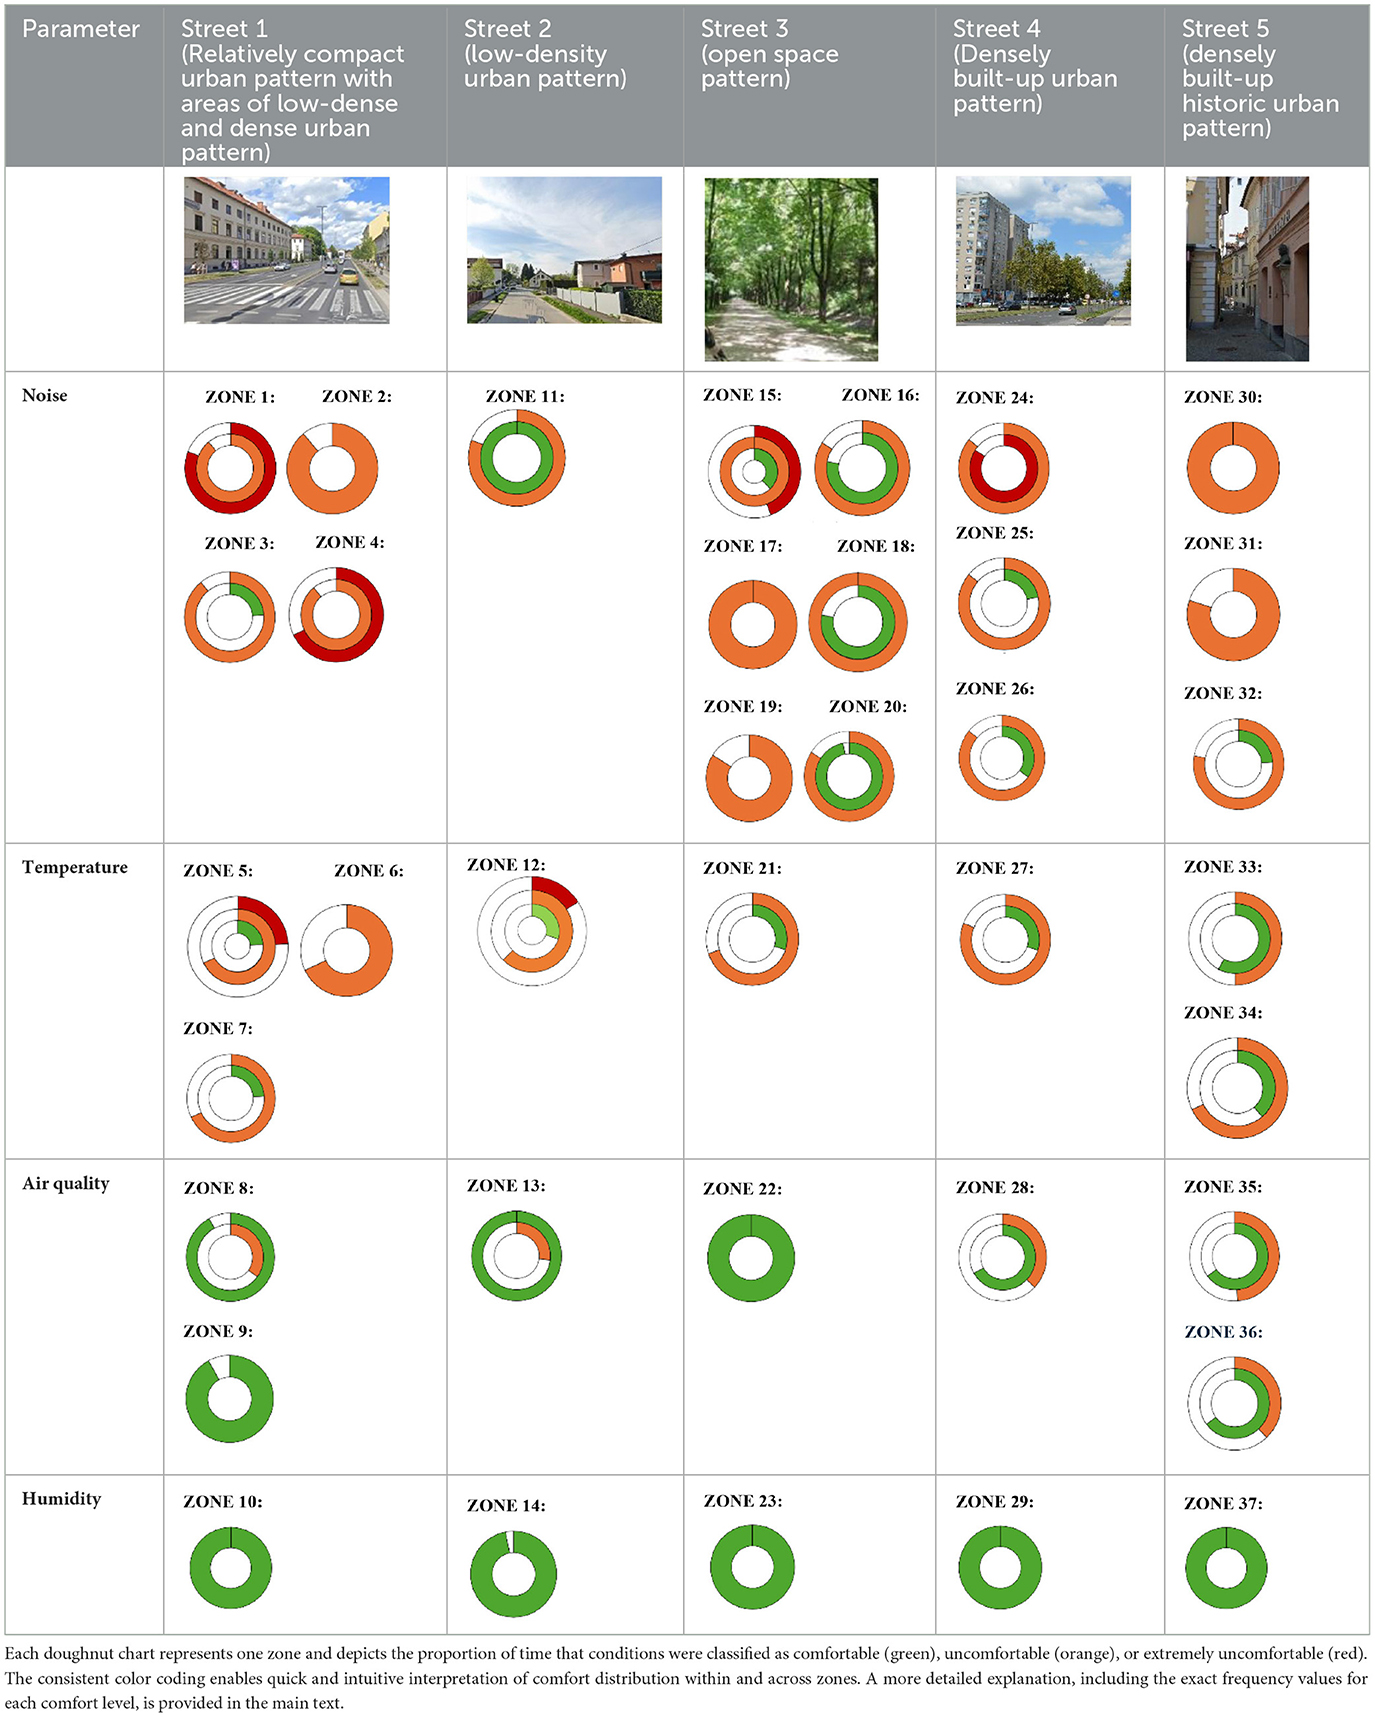
Table 3. Visual summary of the comfort spectrum for each environmental parameter (temperature, noise, air quality, and humidity) across all zones in the five analyzed streets.
4.1 Identifying comfort zones: single-parameter mapping of individual comfort levels
Based on the proposed methodology, comfortable conditions were identified in 27 zones, uncomfortable conditions in 20 zones, and extremely uncomfortable conditions in 10 zones across the five streets. These zones with a single comfort level vary in length along the streets, with the shortest zone (zone 19) covering 50 meters.
In relation to noise, extremely unfavorable noise conditions (above 70 dBA) were observed on individual parts of three streets (street 1, street 3, and street 4). All three streets have heavy traffic, while the other two streets (streets 2 and 5) do not have heavy traffic. Uncomfortable noise conditions were found in most areas of all five streets, with this category representing the most frequently present form of noise conditions in all analyzed areas. In addition, comfortable noise conditions were also present on all five streets. These are associated with the complete absence of intensive road traffic or with the sidewalk being away from the noisy road.
In relation to the temperature parameter, extremely uncomfortable conditions were detected on two streets (streets 1 and 2). A common feature of both streets is the limited presence of greenery that would provide shade for pedestrians, which directly affects the increased exposure to solar radiation. On streets 3, 4, and 5, shading is provided either by trees or by dense urban fabric and tall buildings that create shade throughout the day. Uncomfortable temperature conditions were found on most surfaces of all five streets, reflecting the generally high daytime temperatures during the measurement period. This category of conditions represents the most frequently present temperature condition in all analyzed areas. Comfortable temperature conditions are present on all five streets, primarily due to lower morning temperatures.
Continuing with the air quality parameter. Extremely uncomfortable conditions were not detected on any street. Uncomfortable conditions are present on all streets, including streets with reduced traffic or complete absence of traffic. The frequency of uncomfortable conditions on streets 1, 3, 4, and 5 is not high, as they occur only between 27% and 49% of the time measured. The exception is Street 2, which is in the urban forest, where uncomfortable conditions were not recorded at all. Comfortable air quality conditions are present on all streets, mostly along the entire lengths of the streets, and occur with very high frequency.
The comfort levels for the humidity parameter are consistently comfortable across all zones and streets, where no uncomfortable conditions were noted. Streets 1, 3, 4, and 5 faces comfortable conditions 100% of the time, and street 2 experiences comfortable conditions 97% of the time.
4.2 Identifying the spectrum of comfort: single-parameter analysis and urban pattern comparison across five streets
This section presents results related to zones with a spectrum of comfort for each parameter (see Table 3), along with a comparison of comfort across the five streets based on the frequency of (un)comfortable conditions in relation to the length of individual zones.
4.2.1 Noise
The noise parameter represents one of the most frequently occurring uncomfortable parameters on all streets. Street 1, relatively compact urban pattern with areas of low-dense and dense urban pattern, ranks among the noisiest streets in terms of the frequency of uncomfortable conditions compared to other streets. Approximately half of the length of the street extremely uncomfortable conditions are present in 68%−81% of the time (zone 1 and zone 4, see Figures 6, 7), while uncomfortable conditions are present along the entire length of the street 89% of the time (zone 2). On a smaller part of the street, comfortable conditions are present 24% of the time (zone 3). This coexistence of different comfort levels in the same zones (see Table 3; Figure 7) indicates that noise can vary significantly even within 10 m. The street experiences heavy traffic, especially near intersections, noise is extremely uncomfortable. The street corridor measures between 20 and 60 m in width, and most buildings are two-story. In areas where the street has a particularly dense and compact urban pattern without discontinuous empty spaces, the street corridor is narrow (20 m) and devoid of vegetation (zone 1). In such conditions, the conditions are very poor, with extremely uncomfortable noise conditions reaching 81%, while uncomfortable conditions are present for 89% of the time.
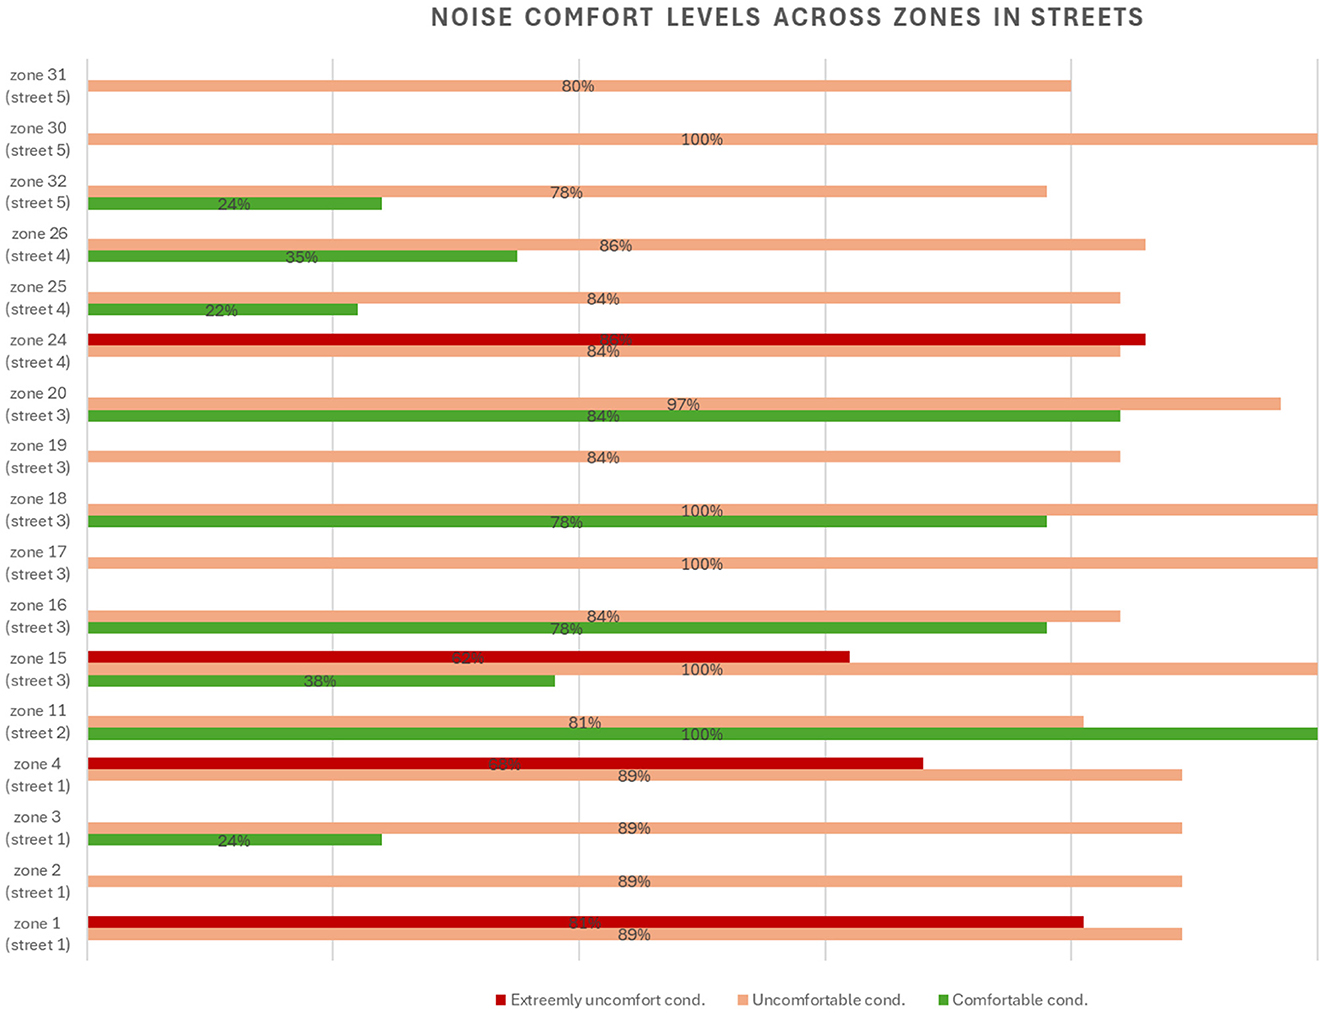
Figure 7. Noise comfort levels across zones on all five streets, showing the relative share of extremely uncomfortable, uncomfortable, and comfortable conditions within each zone. The chart highlights considerable variability in noise comfort both between and within streets. Street 1 stands out as one of the noisiest streets, with extremely uncomfortable conditions present up to 81% of the time in zone 1, which extends across nearly half of the street's length. In contrast, Street 2 shows the highest share of comfortable conditions, with zone 11 being 100% comfortable despite 81% of the time being categorized as uncomfortable.
Street 4, a densely built-up urban tissue, experiences the second highest noise level of all streets. The main source of noise is traffic. The street corridor measures about 60 m. The buildings are mostly ten-story. Natural morphological features include urban tree lines, roadside green belts, green areas, and groups of trees. Despite this, the street experiences extremely uncomfortable noise conditions along almost its entire length 86% of the time, and uncomfortable conditions are present 86% of time (zone 24, 25, 26). To a lesser extent, comfortable conditions are also present, occurring 22%−35% of the time (zone 25, 26).
Street 5, which has a densely built-up historic urban pattern, is the third noisiest street. In parts of the street (zones 30 and 31) where there is also car and bus traffic, conditions are uncomfortable between 80% and 100% of the time. In the old historic city part, conditions are less uncomfortable. Zones 32 and 32 are close to traffic so, in addition to uncomfortable conditions, which are present 78%−80% of the time, comfortable conditions in zone 32 are present 24% of the time.
Then follows Street 3, with an open urban pattern. Despite being in the middle of an urban forest, characterized by natural morphological features of natural terrain, tall vegetation and green areas, it runs parallel to a busy road, which is ~50 m away. Along the whole street, noise varies with uncomfortable conditions between 84% and 100% of the time. In the zone where the traffic road approaches the street, as well extremely uncomfortable conditions are present 62% of the time (zone 15). Along the street, comfortable conditions are present between 0% and 78% of the time, with higher frequencies observed in zones where dense vegetation acts as a buffer between the busy road and the street.
The least noisy is Street 2 (zone 11), characterized by a low-density urban pattern, where only local traffic is present. The street corridor is 20 m wide, providing sufficient space between low-rise buildings (private housing) to allow for noise dispersion. Conditions are uncomfortable 81% of the time and 100% of the time comfortable.
Figure 8 provides a simplified overview of noise exposure frequency across the five streets analyzed, highlighting spatial differences in acoustic comfort.
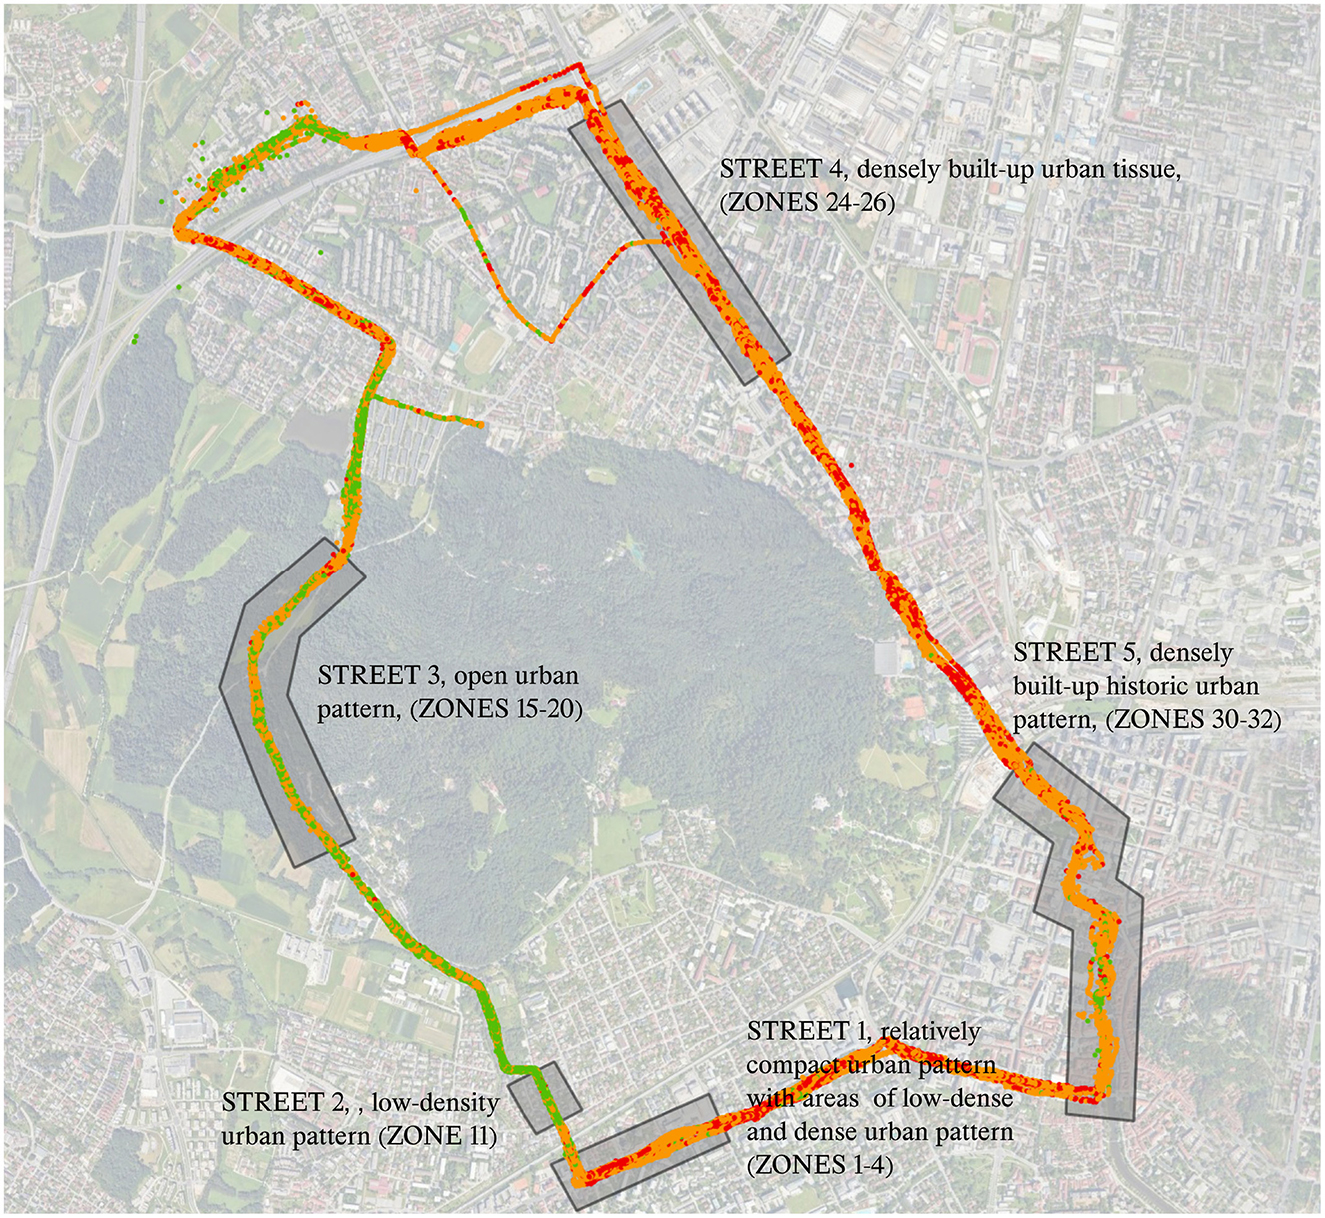
Figure 8. A simplified visual representation of the frequency of noise exposure on five streets, with red indicating areas with extremely uncomfortable conditions and orange indicating areas with uncomfortable conditions. Such conditions are most commonly present on streets 1 and 4, while street 2 is one of the most acoustic-comfortable, as illustrated by the green color. The representation is intentionally simplified, as detailed zones within individual streets would not be discernible on a map of this size.
4.2.2 Air quality
The air quality is consistently good across all streets.
Street 3, characterized by an open urban pattern and situated in the middle of an urban forest, is the most comfortable in terms of air quality. Conditions are classified as comfortable 100% of the time, with no occurrences of uncomfortable or extremely uncomfortable conditions (see Figure 9). Despite the proximity of a busy road running parallel to the street, dense and tall vegetation acts as an effective buffer against air pollution, resulting in consistently high levels of air quality comfort.
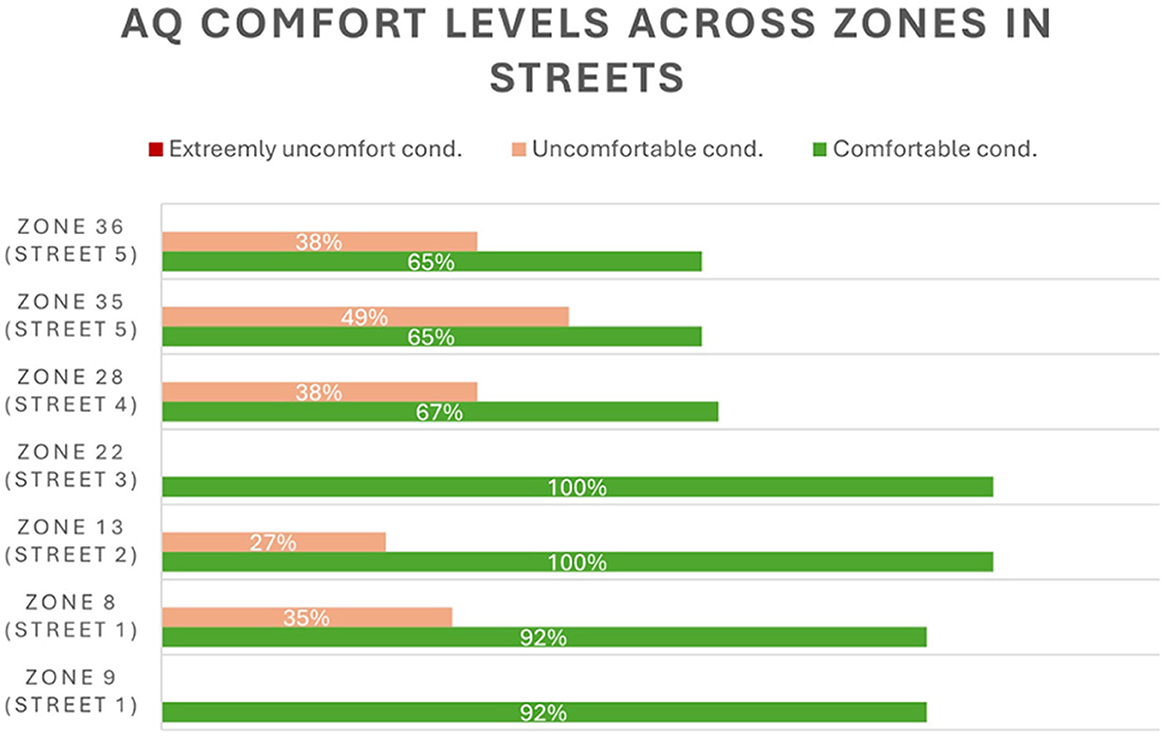
Figure 9. Air quality comfort levels across zones on all five streets, showing the proportion of comfortable, uncomfortable, and extremely uncomfortable conditions. Street 3 demonstrates the highest air quality comfort, with 100% of the time classified as comfortable across all zones. Its location within an urban forest contributes to optimal conditions—even though a busy road runs nearby. In contrast, Street 5, with dense historic urban pattern, limited vegetation, proximity to traffic, shows the lowest comfort levels, with uncomfortable conditions occurring up to 49% of the time.
As the second most comfortable in terms of air quality, follows street 1. It has a relatively compact urban pattern with areas of low and high density of urban patterns. There is a busy traffic road, and the presence of natural elements is low, consisting of sparse urban tree lines and two small sized green areas. The entire street experiences comfortable conditions 92% of the time, while uncomfortable conditions are present in zone 8, 35% of the time. Despite the presence of a busy road and low proportion of vegetation, the air quality is comfortable, which indicates that the ventilation of the location represents an important aspect of air quality related comfort.
The third most comfortable street is street 2, with a low-density urban pattern. The presence of natural elements is moderate including linear green spaces along the sidewalk and compact, one small sized green space. Conditions along the whole street are comfortable 100% of the time, yet local traffic contribute to the 27% presence of uncomfortable conditions.
It follows street 4, densely built urban pattern, where a busy road is present. The presence of natural elements is moderate, including urban avenues and small green spaces. Despite the whole street experiencing comfortable conditions 67% of the time, a relatively high presence of uncomfortable conditions (37%) is also recorded.
Street 5, characterized by its dense historic urban pattern, is the most polluted among the analyzed streets. Uncomfortable conditions occur 38%−49% of the time, while comfortable conditions are present only 65% of the time. Although only half of the street is affected by traffic, this can still negatively impact the air quality of the entire street, as pollutants from traffic can spread to enclosed areas. The dense urban pattern and relatively tall buildings (mostly three- to four-story structures), further impede air flow and contribute to the accumulation of pollutants.
4.2.3 Temperature
High temperatures are present on all five streets (see Figure 10). The comparison of temperature conditions below only applies to streets that are comparable in terms of their spatial location, where they have the same direction of sunlight during the same time. These streets are streets 2, 3, 4, and half of the street 5.
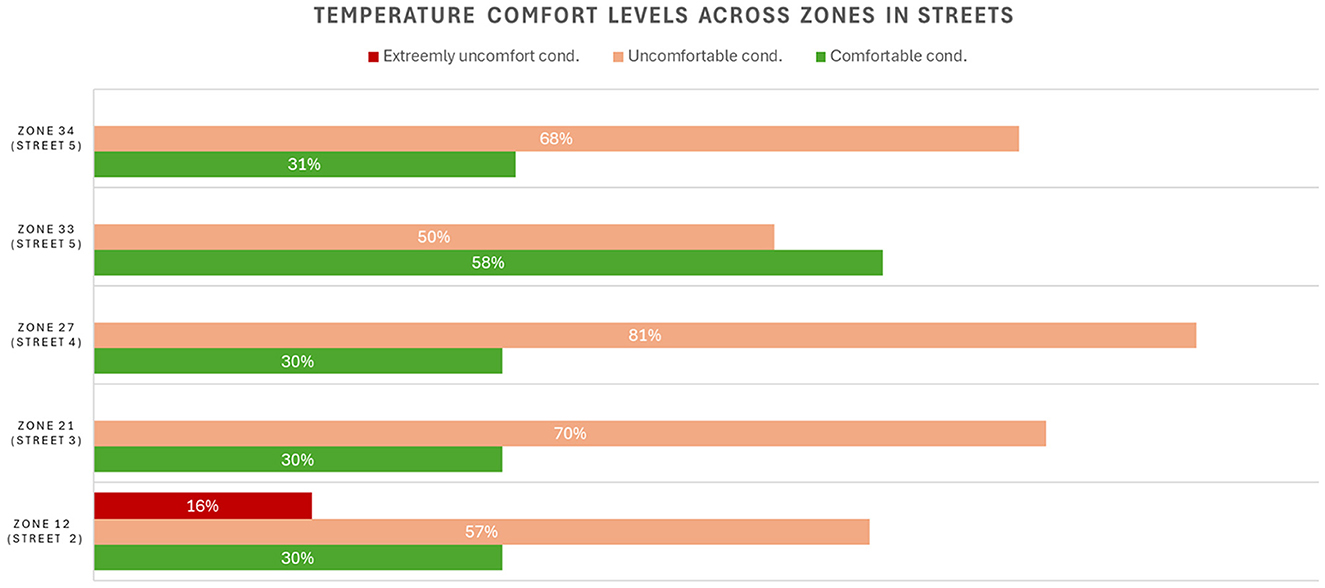
Figure 10. Thermal comfort conditions across zones on all five streets, showing the proportion of extremely uncomfortable, uncomfortable, and comfortable temperature levels. Among streets with comparable orientation, Street 5 stands out as the most thermally comfortable. Despite its dense historic urban form and lack of vegetation, narrow street corridors and tall buildings provide consistent shading throughout the day, resulting in the highest share of comfortable conditions. In contrast, Street 2 shows the lowest thermal comfort. Its low-density urban pattern, wide spacing between buildings, and absence of tree cover led to minimal shading, making it the most heat-exposed street among those analyzed.
The most comfortable temperature was found to be street 5 with a densely built-up historic urban pattern. Here, the width of the corridor is narrow—between 8 and 20 m, and the buildings are higher than three floors. Due to the physical characteristics of the corridor, shade was present along most of the street in the morning and afternoon. This street consists of two zones. Although Zone 33, located in the narrowest part of the historic area, contains no natural elements, it shows the most thermally comfortable conditions among all zones on streets. In this zone, uncomfortable temperature conditions occur 68% of the time, while comfortable conditions are recorded 31% of the time.
The next least uncomfortable street is Street 3, an open urban pattern, which is in an urban forest and is shaded almost all day. Conditions are uncomfortable 70% of the time and comfortable 30% of the time.
It is followed by Street 4, which has a densely built-up urban pattern. Uncomfortable conditions occur 81% of the time, while comfortable conditions are present 30% of the time. Most buildings are 10 stories high. Vegetation is also present in the form of tree lines, linear green spaces along the sidewalk and small sized green spaces between buildings. Shade is present on the street in the afternoon, yet temperatures are still high.
Street 2, with a low-density urban pattern, is the most uncomfortable in terms of temperature. There is more space between the buildings, as it is individual housing with private gardens. Green areas on the street are in the form of linear green spaces along the sidewalk. Private gardens also contribute to microclimate. However, since most of the buildings are one- or two-story, and there are no tree lines, the street has the least shade of all the streets. Therefore, conditions are extremely uncomfortable 16% of the time, uncomfortable 57% of the time, and comfortable 30% of the time.
4.2.4 Humidity parameter
The comfort levels for the humidity parameter are consistently comfortable across all zones and streets, where no uncomfortable conditions were noted (see Figure 11). Streets 1, 3, 4, and 5 faces comfortable conditions 100% of the time, and Street 2 experiences comfortable conditions 97% of the time.
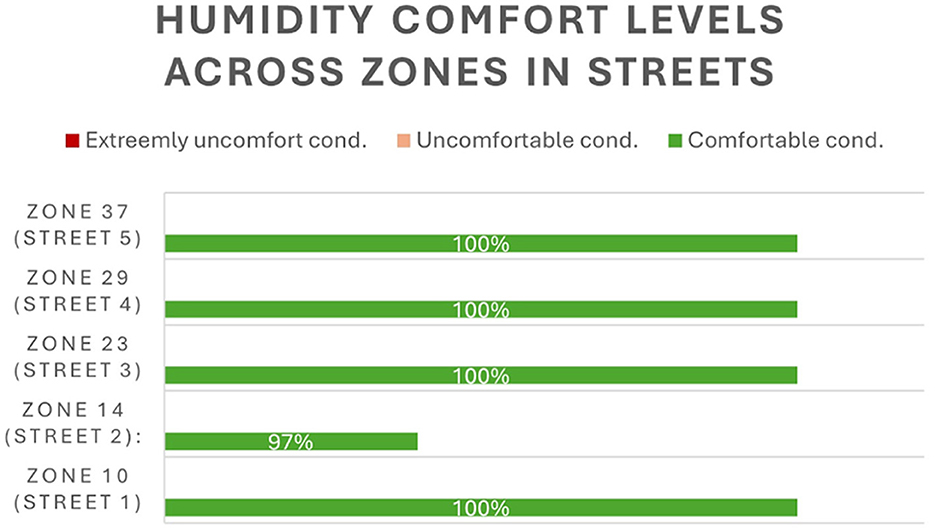
Figure 11. Humidity comfort levels across all zones and streets, showing a consistently high degree of comfort. Streets 1, 3, 4, and 5 experience comfortable conditions 100% of the time, while Street 2 shows slightly lower comfort, with 97% of time classified as comfortable. No uncomfortable or extremely uncomfortable humidity conditions were recorded across the study area, indicating that humidity did not significantly contribute to overall environmental discomfort during the measurement period.
4.3 Zones indicating microclimate and user-comfort related issues
The analysis of simultaneous parameters' effect allowed us to identify zones where uncomfortable conditions frequently occur (more than 50% of time), highlighting the presence of microclimate and other user-comfort related issues. The findings are illustrated on maps (Figure 12), which indicate the physical boundaries of zones indicating user-comfort related issues, as well as the type and frequency of related parameters.
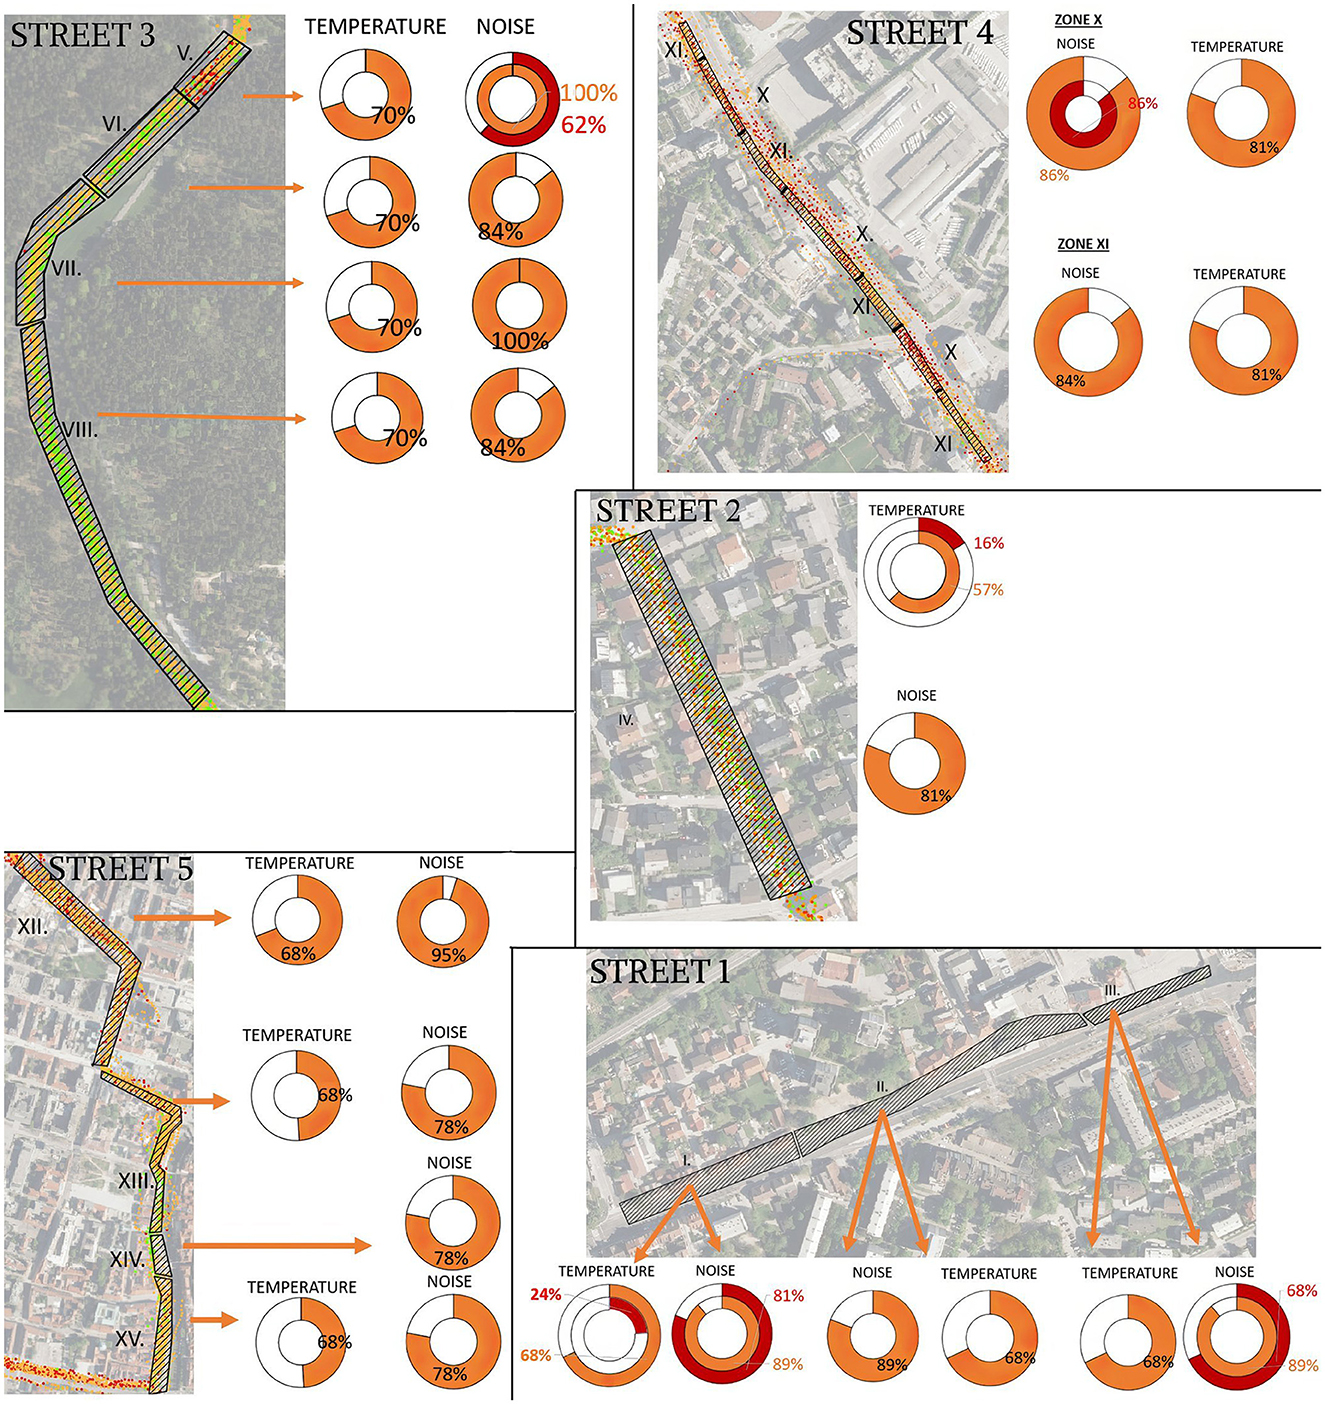
Figure 12. Map-based representation of zones with identified microclimate- and user comfort-related issues across the five analyzed streets. The figure highlights the most critical areas where uncomfortable or extremely uncomfortable conditions are present for 50% or more of the time. Among all identified zones, Street 1 stands out as the most exposed, particularly Zone I, which combines extreme heat and high noise levels. In this zone, uncomfortable temperature conditions occur 68% of the time, extremely uncomfortable temperatures 24%, while noise levels are uncomfortable 89% and extremely uncomfortable 81% of the time—making it the most critical location for intervention within the dataset.
Assessing the criticality of zones by evaluating the simultaneous presence of environmental issues, combined with the intensity of discomfort, allows for a more comprehensive understanding of environmental challenges in urban areas. The graphical display allows for the visualization of critical zones on a map (see Figure 12), while Table 4 further explains the intensity of issues and the presence of simultaneous impacts. This allows spatial planners to more easily prioritize areas that need improvement and define solutions that address specific noise and/or temperature challenges.
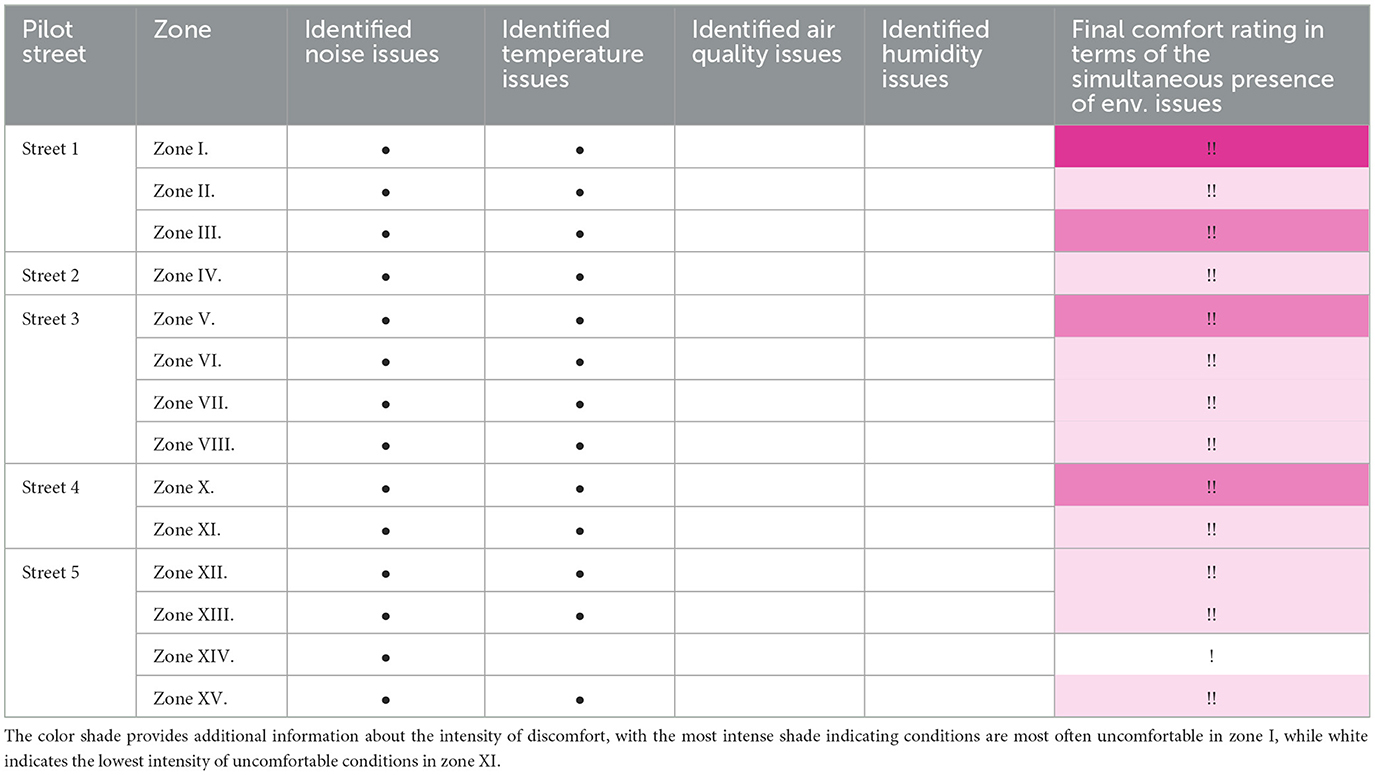
Table 4. The symbol (!!) indicates that two issues (temperature and noise) are present in almost all zones, while the symbol (!) indicates that only one issue (noise) is present in zone XIV.
Below, individual streets and uncomfortable condition values are presented in detail. Street 1, situated in a compact urban area with both low-density and high-density development (see Figure 12), faces two significant issues related to microclimate and user comfort: high temperatures and high noise levels. Three distinct zones were identified within this street. Each of these zones consistently experiences dual issues of high temperatures and elevated noise levels, making interventions necessary to enhance overall comfort. Zone I. has the highest frequency of uncomfortable and extremely uncomfortable conditions. Temperatures are uncomfortable 68% of the time. Additionally, Zone I. experiences extremely uncomfortable temperatures, rising 24% of the time. Noise levels are uncomfortable 89% of the time and extremely uncomfortable 81% of the time. Zone II. faces uncomfortable temperatures conditions 68% of the time and uncomfortable noise conditions 89% of the time. Zone III. faces uncomfortable temperatures 68% of the time and uncomfortable noise levels 89% of the time. Additionally, Zone III. experiences extremely uncomfortable noise levels 68% of the time.
Street 2 is situated in a low-density urban pattern. Within this street, one zone (Zone IV.) with two microclimate and user-comfort related issues have been identified (see Figure 12). Temperature parameter was observed 16 % of the time facing extremely uncomfortable and 57% of the time uncomfortable conditions. The second issue is related to noise parameters. Compared to the noise in Street 1, uncomfortable conditions here are less frequently present, occurring 81% of the time. Since Street 2 is characterized by low-density urban pattern with areas of individual housing, the area is generally quieter, and uncomfortable conditions only result from local traffic sequences.
Street 3 is characterized by open space and is surrounded by natural terrain and high vegetation. Even though it is situated within highly vegetated green spaces, the path is roughly parallel with a road, heavily congested during morning and afternoon intervals. In that sense the predominant user comfort-related issue identified here is related to high noise. This street is composed of three zones with occurring issues. Zone V., which is in the nearest proximity with road (0–30 m of distance) has the highest level of uncomfortable and extremely uncomfortable conditions, facing 62 % of the time extremely uncomfortable conditions, and 100 % of the time uncomfortable conditions. Within zones VI., VII., and VIII. noise levels vary, facing uncomfortable conditions of 84%−100% of the time. The second microclimate issue refers to high temperatures which, while significant due to the generally high temperatures in August in Ljubljana, are comparatively lower than on other 4 streets. All 4 zones (V., VI, VII., VIII) are characterized by frequent uncomfortable temperature conditions facing 70% of the time.
Street 4 is characterized by densely built-up urban patterns and is further impacted by a heavy traffic road adjacent to pedestrian and cycling paths, significantly affecting human comfort. Street 4 has two zones. Across the entire street, high temperatures result in uncomfortable conditions 81% of the time. The noise parameter consistently exhibits a high frequency of uncomfortable conditions. In Zone X. conditions are uncomfortable 86% of the time, and due to the presence of a crossroad, extremely uncomfortable conditions are observed 84% of the time. Additionally, Zone XI. faces uncomfortable conditions 84% of the time.
Street 5 is situated within a densely built-up historic urban pattern, where two microclimate and user-comfort issues were identified. High temperatures were noted almost through entire street (Zone XII., XIII., XV.), facing uncomfortable conditions 68 % of the time. An exception is Zone XIV., located in a narrow building corridor, where the issue was not found, since the frequency of uncomfortable conditions did not exceed 50%. Continuing with noise parameters, where noise levels in zones with a traffic regime (Zone XII.) faced uncomfortable conditions 95% of the time. In traffic-free zones (Zones XIII., XIV., XV), affected only by other urban sounds such as music from bars and pedestrian conversations, a lower percentage of uncomfortable conditions was noted, occurring 78% of the time.
By identifying microclimate- and user comfort-related issues in the case study, we demonstrated how detailed data gathered through an ICT and GIS-based protocol for street assessment can significantly assist urban planners in recognizing and prioritizing areas for improvement. This foundational step is crucial for directions toward spatial solutions that will enhance comfort levels and improve the quality of life in urban areas.
5 Discussion
This research advances urban planning and climate adaptation science by developing a methodology that harnesses the power of ICT for detailed microclimate- and user comfort-related street assessment. It sets a new benchmark for technological integration into urban planning and climate science, offering a practical example that cities can readily implement. This study underscores the potential of ICT not only as a data collection tool but as a crucial element of strategic urban environmental planning and microclimate and user-comfort issue identification. By providing a robust methodology for identifying temperature, noise, humidity, and air quality issues, this research makes a significant contribution toward creating more resilient and comfortable urban spaces in response to ongoing climate-related challenges. This robustness is also reflected in the approach to representation and information handling, which is specifically designed to be accessible and practical for municipal planners and decision-makers. Importantly, the results of this study reveal that urban conditions can vary substantially from one street to another, even within the relatively small city of Ljubljana. This highlights the essential role of spatially distributed data collection tools and methodologies, as fixed monitoring stations—typically located at only a few points in the city—cannot adequately capture the fine-grained and highly localized variations that exist across heterogeneous urban environments.
5.1 Integrating comfort zones analysis into urban planning
The novelty of this research for urban planning lies in its systematic approach to analyze and map uncomfortable zones for parameters of temperature, noise, air quality and humidity with high accuracy at street level in urban environments. Single-parameter analyses offer urban planners and researchers a method to examine patterns of environmental conditions, creating specific inventories of comfortable, uncomfortable, and extremely uncomfortable zones. Additionally, integrating all comfort-related parameters into a comprehensive analysis enables the simultaneous examination of overall comfort, providing a framework for prioritizing critical locations to improve comfort.
This study successfully validated the hypothesis that detailed microclimate and user-comfort data, gathered through ICT and GIS-based protocols, can significantly assist urban planners in better recognizing and interpreting microclimate and user-comfort issues in urban environments, also with the typology of visualizations that can support the way of interpretation and communication among the issues as well as the robustness of the approach as such. The analysis provided real-time, granular data that revealed precise variations in environmental conditions across different urban zones. In this case study, urban planners can precisely identify environmental conditions at a resolution of 10 m, allowing them to accurately allocate areas requiring targeted spatial interventions. By integrating multiple parameters simultaneously this study demonstrates how these parameters interact within different urban tissue types, presenting a novel and previously underexplored approach in urban planning (Ravnikar et al., 2023). The ability to allocate specific discomfort zones and understand how urban elements and urban morphologies influence these conditions confirmed that this methodology equips urban planners with actionable insights. This detailed level of analysis supports the hypothesis by showing how the data-driven approach enhances the identification and interpretation of microclimate- and comfort-related issues in versatile environmental site-specific context.
Furthermore, the potential of this approach extends beyond merely identifying issues; it also lies in uncovering correlations between environmental conditions and spatial elements, such as urban patterns. By analyzing the data collected, we can discern how different urban structures influence environmental conditions. For instance, as expected the temperature conditions were found to be most comfortable in streets where trees or high building offer shade through most of the day. Air quality conditions were most comfortable within a city forest, where 100% of the measured conditions were comfortable. These conditions correlate with the open space urban pattern, featuring natural terrain and high, dense vegetation. Noise levels were found to be least uncomfortable in a quieter private housing neighborhood, where traffic volume is low, although dynamic noise variations were present within small areas. Finally, the humidity parameter was consistently comfortable 100% of the time across all streets. Ljubljana's location in a basin surrounded by mountains influences its microclimate, contributing to stable humidity levels. Seasonal variations, particularly in spring and autumn, bring moderate precipitation, which affects relative humidity. The city's abundant vegetation and urban greenery also help regulate humidity by retaining moisture and providing natural cooling.
By showing the way urban planners and researchers can more effectively identify comfort issues in urban environments. This approach equips them with valuable insights into how various spatial elements interact within different urban patterns, empowering them to design interventions that enhance comfort through informed urban planning strategies and incorporate often neglected climate consideration in urban planning. As well the potential is seen in continuous monitoring of conditions which allows for informed adjustments to optimize intervention performance, ensuring they remain effective in mitigating urban environmental challenges. The dynamic data provided by real-time monitoring through ICT tools enables responsive decision-making, adapting to changing environmental conditions—a critical capability in urban areas where fluctuations are constant. This adaptability supports timely adjustments in public space usage, traffic management, and infrastructure development. By integrating detailed microclimate- and comfort-related data into city planning processes, this approach not only addresses immediate environmental and human comfort issues but also supports sustainable urban development, ensuring cities are prepared for future environmental and societal shifts.
5.2 Limitations and further issues
One key limitation of this study is the method used to form the zones, which were created using hand-drawn polygons in GIS software. While this approach allows for a clear visualization of comfort zones, it lacks precision and advanced GIS-based aggregation techniques that could offer more detailed and automated analyses. The current method is relatively simple and yet the process is accessible to decision-makers who may not be highly skilled in GIS as an analytic tool. Future work could focus on incorporating more advanced GIS methodologies to aggregate and analyze zones with greater precision, enhancing the overall reliability and applicability of the findings in more complex urban settings.
Another limitation concerns the range of parameters used for assessing urban comfort. This study employed a basic set of parameters—air temperature, relative humidity, noise level, and air quality (PM 2.5). While these represent fundamental environmental factors relevant to urban comfort, other parameters, such as solar radiation, wind velocity, and subjective aspects like human perception, could provide a more comprehensive view of comfort conditions. Despite this limitation, the parameters used are considered sufficient for analyzing microclimate and user-comfort conditions in Ljubljana, and they demonstrate the potential of this approach for interpreting comfort levels in urban planning. Although this study addressed the simultaneous effects of multiple discomfort parameters through a combined criticality assessment, a more in-depth analysis of the interrelations between parameters would further enhance the understanding of environmental comfort. Such an extension would likely require a dedicated study capable of capturing the complexity of these interactions and their cumulative impact on human wellbeing.
Additionally, the data collection period was limited to 23 days in August, which, while useful for capturing summer conditions, does not reflect the year-round variability of environmental factors. Although this provides enough data to demonstrate the type and approach toward the analysis, and its potential to inform urban planning and design, a more extended period of data collection across different months would allow for a deeper understanding of how spatial elements interact with environmental conditions. More days of data collection would also enhance the accuracy of identifying environmental issues and contribute to more robust and informed planning solutions. For example, extending the monitoring period would enable the identification of critical locations even during times when vegetation is not in leaf, thereby improving the understanding of seasonal variations and their impact on urban comfort and environmental quality.
Building on the potential demonstrated by this approach, future work could explore innovative ways to enhance data collection and analysis. One promising direction is the integration of the device into a shared bike system, allowing data to be gathered while cycling. This concept, combined with the existing infrastructure of Ljubljana's city bike rental system—with around 80 docking stations located within 500 m of each other, presents an excellent opportunity for continuous, automatic real-time data gathering. By embedding ICT tools into the bike-sharing system, the city could transform it into a mobile environmental monitoring network, significantly expanding data coverage and increasing the frequency and granularity of the data captured. This system would provide a richer, more comprehensive understanding of microclimatic and comfort-related conditions in real time, while enabling continuous and automatic data flow across the city. Such an approach would offer up-to-date insights into the urban environment, supporting timely interventions and rapid responses to changing environmental conditions.
6 Conclusions
This research marks advancement in urban planning and climate science through the implementation and validation of a novel approach for assessing microclimate- and user comfort-related conditions, leveraging the data gathering process based on protocol for microclimate and user-comfort street assessment of ICT (Ravnikar et al., 2023). The case study presented here offers a novel approach of systematically analyzing and mapping comfort zones for temperature, noise, air quality, and humidity with a high data precision at the street level. Through zoning process, detailed patterns of environmental conditions are identified, enabling researchers, urban planners the creation of inventories categorizing locations as comfortable, uncomfortable, or extremely uncomfortable. The integration of multiple comfort-related parameters into a single comprehensive analysis further enhances this methodology, allowing for the simultaneous assessment of parameters and allocating the locations where discomfort is most often occurring. In that sense, the value of this study lies in its capacity to provide urban planners and city managers with actionable insights, empowering them to address urban environmental issues more effectively. Moreover, the methodology highlights the potential for a better understanding of the correlations between environmental conditions and spatial characteristics, considering different spatial patterns and comfort related temporal variability. The application of this methodology underscores its utility in not just allocating specific urban environmental issues but also in real-time data gathering within the smart cities' framework. This continuous data collection is invaluable for monitoring the effectiveness of existing spatial solutions and assessing environmental quality. Furthermore, the dynamic nature of this approach allows for timely responses to fluctuating microclimate conditions, ensuring that urban environments remain adaptable and resilient in the face of environmental changes. This adaptability greatly enhances urban climate mitigation and adaptation strategies. As cities worldwide navigate the complexities of climate change, the methodologies and insights offered by this study are invaluable, promising to guide urban development toward sustainability, resilience, and enhanced quality of life.
Data availability statement
The datasets presented in this study can be found in online repositories. The names of the repository/repositories and accession number(s) can be found below: https://zenodo.org/records/10932142.
Author contributions
ŽR: Conceptualization, Formal analysis, Funding acquisition, Investigation, Methodology, Resources, Validation, Visualization, Writing – original draft, Writing – review & editing. AB: Supervision, Validation, Writing – review & editing. BG: Funding acquisition, Supervision, Validation, Writing – review & editing.
Funding
The author(s) declare that financial support was received for the research and/or publication of this article. This project has received funding from the European Union's Horizon 2020 Research and Innovation Programme under the Marie Skłodowska-Curie grant agreement N° 847624. In addition, a number of institutions back and co-finance this project. This paper reflects only the author's view, and the Research Executive Agency is not responsible for any use that may be made of the information it contains. The authors acknowledge the financial support from the Slovenian Research and Innovation Agency (research core funding No. P5-0100) and the financial support from the AGINGPLACE project (ref. PID2023-146254OB-C41) financed by MICIU/AEI/10.13039/501100011033 and FEDER, UE.

Conflict of interest
The authors declare that the research was conducted in the absence of any commercial or financial relationships that could be construed as a potential conflict of interest.
Generative AI statement
The author(s) declare that Gen AI was used in the creation of this manuscript. During the preparation of this work the author(s) used ChatGPT strictly to improve language, readability and clarity. After using this tool/service, the author(s) reviewed and edited the content as needed and take(s) full responsibility for the content of the publication.
Publisher's note
All claims expressed in this article are solely those of the authors and do not necessarily represent those of their affiliated organizations, or those of the publisher, the editors and the reviewers. Any product that may be evaluated in this article, or claim that may be made by its manufacturer, is not guaranteed or endorsed by the publisher.
References
Antoniou, N., Montazeri, H., Blocken, B., and Neophtou, M. (2024). On the impact of climate change on urban microclimate, thermal comfort, and human health: multiscale numerical simulations. Build. Environ. 260:111690. doi: 10.1016/j.buildenv.2024.111690
Arshad, B., Ogie, R., Barthelemy, J., Pradhan, B., Verstaevel, N., and Perez, P. (2019). Computer vision and IoT-Based sensors in flood monitoring and mapping: a systematic review. Sensors 19:5012. doi: 10.3390/s19225012
Babisch, W., Wolf, K., Petz, M., Heinrich, J., Cyrys, J., and Peters, A. (2014). Associations between traffic noise, particulate air pollution, hypertension, and isolated systolic hypertension in adults: the KORA study. Environ. Int. 198:109403. doi: 10.1289/ehp.1306981
Barry, R. G. (1970). A framework for climatological research with particular reference to scale concepts. Trans. Inst. Br. Geogr. 49, 61–78. doi: 10.2307/621641
Bherwani, H., Singh, A., and Kumar, R. (2020). Assessment methods of urban microclimate and its parameters: a critical review to take the research from lab to land. Urban Clim. 34:100690. doi: 10.1016/j.uclim.2020.100690
Bodytrak (2024). Heat stress, fatigue and noise: Impact on workplace mental health. Available online at: https://bodytrak.co/news/impact-heat-stress-fatigue-noise-mental-health-workplace-safety/ (Accessed April 29, 2025).
Bu, Y., Sun, Z., Tao, Y., Zhao, X., Zhao, Y., Liang, Y., et al. (2024). The synergistic effect of high temperature and relative humidity on non-accidental deaths at different urbanization levels. Sci. Total Environ. 940:173612. doi: 10.1016/j.scitotenv.2024.173612
Centers for Disease Control and Prevention (2024). About heat stress. National Institute for Occupational Safety and Health. Available online at: https://www.cdc.gov/niosh/heat-stress/about/index.html (Accessed July 18, 2025).
Cheng, Y., Liu, X., Zeng, Z., Liu, S., Wang, Z., Tang, X., et al. (2022). Impacts of water bodies on microclimates and outdoor thermal comfort: implications for sustainable rural revitalization. Front. Environ. Sci. 10:940482. doi: 10.3389/fenvs.2022.940482
Day, R. (2007). Place and the experience of air quality. Health Place 13, 249–260. doi: 10.1016/j.healthplace.2006.01.002
De Groeve, M., Kale, E., Godts, S., Orr, S. A., and De Kock, T. (2024). Impact of vertical greening on urban microclimate and historic building materials: a meta-analysis. Build. Environ. 253:111365. doi: 10.1016/j.buildenv.2024.111365
Esfandi, S., Tayebi, S., Byrne, J., Taminiau, J., Giyahchi, G., and Alavi, S. A. (2024). Smart cities and urban energy planning: an advanced review of promises and issues. Smart Cities 7, 414–444. doi: 10.3390/smartcities7010016
European Environment Agency (2023). Combined Effects of Air Pollution and Heat Exposure. Available online at: https://www.eea.europa.eu/en/newsroom/editorial/combined-effects-of-air-pollution-and-heat-exposure (Accessed July 18, 2025).
Golmohammadi, R., and Darvishi, E. (2020). The combined effects of occupational exposure to noise and other risk factors – A systematic review. Noise Health 21, 125–141. doi: 10.4103/nah.NAH_4_18
Guan, H., Hu, S., Liu, G., and Zhang, L. (2020). The combined effects of temperature and noise on the comfort perceptions of young people with a normal body mass index. Sustain. Cities Soc. 54:101993. doi: 10.1016/j.scs.2019.101993
Huang, X., Song, J., Wang, C., Chui, T. F. M., and Chan, P. W. (2021). The synergistic effect of urban heat and moisture islands in a compact high-rise city. Build. Environ. 205:108274. doi: 10.1016/j.buildenv.2021.108274
Jafari, M. J., Khosrowabadi, R., Khodakarim, S., Khodagholi, F., and Mohammadian, F. (2019). The effects of combined exposure to noise and heat on human salivary cortisol and blood pressure. Int. J. Occup. Safety Ergon. 27, 831–839. doi: 10.1080/10803548.2019.1659578
Lai, Y., Ning, Q., Ge, X., and Fan, S. (2022). Thermal regulation of coastal urban forest based on ENVI-Met model—A case study in Qinhuangdao, China. Sustainability 14:7337. doi: 10.3390/su14127337
Li, J., Mao, Y., Ouyang, J., and Zheng, S. (2022). A review of urban microclimate research based on CiteSpace and VOSviewer analysis. Int. J. Environ. Res. Public Health 19:4741. doi: 10.3390/ijerph19084741
Li, X., Peng, L. L. H., Jiang, W., Yin, S., Feng, N., and Yao, L. (2024). Urban form affects the cool island effect of urban greenery via building shadows. Build. Environ. 246:110878. doi: 10.1016/j.buildenv.2024.111398
Liu, W., Zhao, H., Sun, S., Xu, X., Huang, T., and Zhu, J. (2022). Green space cooling effect and contribution to mitigate heat island effect of surrounding communities in beijing metropolitan area. Front. Public Health 10:870403. doi: 10.3389/fpubh.2022.870403
MacCutcheon, D. (2021). Negative responses to urban residential noise as a social rebound effect of increasing population density: legislative challenges and auditory territoriality. Noise Health 23, 35–41. doi: 10.4103/nah.NAH_45_18
Miao, D., Cao, X., and Zuo, W. (2022). Associations of indoor environmental quality parameters with students' perceptions in undergraduate dormitories: a field study in Beijing during a transition season. Int. J. Environ. Res. Public Health 19:16997. doi: 10.3390/ijerph192416997
Mitro, N., Krommyda, M., and Amditis, A. (2022). Smart tags: IoT sensors for monitoring the micro-climate of cultural heritage monuments. Appl. Sci. 12:2315. doi: 10.3390/app12052315
Nikolopoulou, M., and Lykoudis, S. (2007). Use of outdoor spaces and microclimate in a Mediterranean urban area. Build. Environ. 42, 3691–3707. doi: 10.1016/j.buildenv.2006.09.008
Obaideen, K., Yousef, B. A. A., AlMallahi, M. N., Tan, Y. C., Mahmoud, M., Jaber, H., et al. (2022). An overview of smart irrigation systems using IoT. Energy Nexus 7:100124. doi: 10.1016/j.nexus.2022.100124
Park, B., Kim, S., Park, S., Kim, M., Kim, T. Y., and Park, H. (2021). Development of multi-item air quality monitoring system based on real-time data. Appl. Sci. 11:9747. doi: 10.3390/app11209747
Ragheb, A. A., El-Darwish, I. I., and Ahmed, S. (2016). Microclimate and human comfort considerations in planning a historic urban quarter. Int. J. Sustain. Built Environ. 5, 156–167. doi: 10.1016/j.ijsbe.2016.03.003
Ravnikar, Ž. (2024). Data Related to Mapping User-Related Comfort Conditions to Identify Urban Planning Issues for Improved Quality of Places in Cities: The Case of Ljubljana, Slovenia. Geneva: Zenodo. doi: 10.5281/zenodo.10932141
Ravnikar, Ž., Bahillo, A., and Goličnik Marušić, B. (2023). A Protocol for microclimate-related street assessment and the potential of detailed environmental data for better consideration of microclimatology in urban planning. Sustainability 15:8236. doi: 10.3390/su15108236
Roshan, G., Saleh Almomenin, H., da Silveira Hirashima, S. Q., and Attia, S. (2019). Estimate of outdoor thermal comfort zones for different climatic regions of Iran. Urban Clim. 27, 8–23. doi: 10.1016/j.uclim.2018.10.005
Sánchez Jiménez, J. L., and Ruiz de Adana, M. (2024). Assessment of outdoor thermal comfort in a hot summer region of Europe. Atmosphere 15:214. doi: 10.3390/atmos15020214
SimScale (2025). Thermal Comfort Basics: What is ASHRAE 55? SimScale Blog. Available online at: https://www.simscale.com/blog/what-is-ashrae-55-thermal-comfort/#:~:text=ASHRAE%2055%20defines%20thermal%20comfort,in%20parallel%20with%20other%20well (Accessed July 18, 2025).
Sun, F., Zhang, J., Yang, R., Liu, S., Ma, J., Lin, X., et al. (2023). Study on microclimate and thermal comfort in small urban green spaces in Tokyo, Japan—A case study of Chuo Ward. Sustainability 15:16555. doi: 10.3390/su152416555
Tian, L., Hao, T., He, X., Chan, I., Niu, J., Chan, P. W., et al. (2024). Examining the non-linear relationship between urban form and air temperature at street level: a case of Hong Kong. Build. Environ. 264:111884. doi: 10.1016/j.buildenv.2024.111884
Ullah, A., Anwar, S. M., Li, J., Nadeem, L., Mahmood, T., Rehman, A., et al. (2024). Smart cities: the role of Internet of Things and machine learning in realizing a data-centric smart environment. Complex Intell. Syst. 10, 1607–1637. doi: 10.1007/s40747-023-01175-4
WHO (1999). Guidelines for Community Noise. Available online at: https://www.who.int/publications/i/item/a68672 (Accessed June 29, 2024).
WHO (2021). WHO Global Air Quality Guidelines: Particulate Matter (PM2.5 and PM10), Ozone, Nitrogen Dioxide, Sulfur Dioxide, and Carbon Monoxide. Available online at: https://www.who.int/publications/i/item/9789240034228 (Accessed July 18, 2025).
WHO (2022). Environmental Noise Guidelines: A Comprehensive Overview of the Health Impacts of Noise. Available online at: https://cdn.who.int/media/docs/default-source/who-compendium-on-health-and-environment/who_compendium_noise_01042022.pdf (Accessed July 18, 2025).
Xu, H., Sheng, K., and Gao, J. (2023). Mitigation of heat island effect by green stormwater infrastructure: a comparative study between two diverse green spaces in Nanjing. Front. Ecol. Evol. 11:1307756. doi: 10.3389/fevo.2023.1307756
Ysebaert, T., Koch, K., Samson, R., and Denys, S. (2021). Green walls for mitigating urban particulate matter pollution—A review. Urban For. Urban Green. 59:127014. doi: 10.1016/j.ufug.2021.127014
Zhang, L., and Yuan, C. (2023). Multi-scale climate-sensitive planning framework to mitigate urban heat island effect: a case study in Singapore. Urban Clim. 49:101451. doi: 10.1016/j.uclim.2023.101451
Keywords: urban planning, comfort, ICT, noise, air quality, humidity, temperature, mapping issues
Citation: Ravnikar Ž, Bahillo A and Goličnik Marušić B (2025) Mapping temperature, humidity, air quality, and noise-related comfort conditions to identify urban planning issues: a case study of Ljubljana, Slovenia. Front. Sustain. Cities 7:1542126. doi: 10.3389/frsc.2025.1542126
Received: 09 December 2024; Accepted: 08 July 2025;
Published: 13 August 2025.
Edited by:
Aapo Matias Huovila, VTT Technical Research Centre of Finland Ltd, FinlandReviewed by:
You Peng, National University of Singapore, SingaporeHameed Sulaiman, Sultan Qaboos University, Oman
Copyright © 2025 Ravnikar, Bahillo and Goličnik Marušić. This is an open-access article distributed under the terms of the Creative Commons Attribution License (CC BY). The use, distribution or reproduction in other forums is permitted, provided the original author(s) and the copyright owner(s) are credited and that the original publication in this journal is cited, in accordance with accepted academic practice. No use, distribution or reproduction is permitted which does not comply with these terms.
*Correspondence: Živa Ravnikar, eml2YXJAdWlycy5zaQ==