Abstract
Introduction:
In the process of rapid urbanization in China, the arbor planting form is often used in the majority of urban squares, due to the large area of hard pavement in this type of square space leads to poor human comfort in the microenvironment of the summer site, so the planting of arbor vegetation in the site is an important factor to enhance the comfort of the microenvironment of this type of site space.
Methods:
This paper takes the main square of the central axis of a university in the north as an example, carries out multi-type simulation on the planting method of square arborvitae by point cloud modeling and Computational Fluid Dynamics (CFD) simulation, and explores the optimal layout form of arbor in this type of square based on the simulation of thermal comfort.
Results and discussion:
The results show that the thermal comfort in different forms can be divided into three levels: (1) when the planting distance is 2.5 times the crown width at an angle of 45° to the wind direction, the thermal comfort effect of the site is optimal (ΔSET*= 0.243°C, ΔWBGT = 0.141°C reduction); (2) when the planting distance is 2 times the crown width parallel to the direction of the prevailing winds in summer, the thermal comfort effect of the site is better (ΔSET*= 0.198°C, ΔWBGT = 0.130°C reduction); (3) when the planting distance is less than 2 times the crown width in the perpendicular wind direction, the thermal comfort effect of the site is the worst (ΔSET*= 0.079°C, ΔWBGT = 0.036°C reduction). This paper intervenes in the point cloud modeling method to provide reference for the subsequent simulation accuracy in this field, and the results of the study have certain reference significance for the design of tree layout when optimizing the thermal comfort environment in this type of main square. In the future, through the integration of real-time meteorological data and multi-scale models, it can dynamically respond to climate change and provide accurate decision support for urban green space system planning, carbon neutral pathway design and extreme weather emergency planning.
1 Introduction
The outdoor thermal environment is an important component of urban climate, and a good outdoor thermal environment can significantly enhance the comfort of urban outdoor spaces. Weather extremes are becoming increasingly common, and summer climate extremes are primarily characterized by extreme heat waves, and such climate events can lead to increased surface temperatures and air humidity imbalances exacerbating the urban heat island effect. According to existing studies, the ability of each thermal mitigation strategy to improve the outdoor thermal environment is heavily influenced by the site climate (Xi et al., 2012). In northern China, the temperature changes between the four seasons are distinct, the rainfall is low throughout the year, and the seasonal distribution is uneven, with rainfall concentrated in the summer. The region has a large population, rapid economic growth, and a high rate of urbanization. Utilizing plants to mitigate the effects of extreme weather has become a research hotspot.
As a public space with important functions, the thermal environment of a square not only affects people's daily activities but also may have a far-reaching impact on urban ecology and energy consumption (Guo et al., 2023). Most of the main squares in China's cities have a large area of pavement with an array of trees planted in the space. This type of site, particularly in the hot summer, offers very poor thermal comfort, which, in turn, creates a large area with a low space utilization rate. The thermal environment on the square depends on the physical characteristics of the square (geometry, material, etc.; Kariminia et al., 2015; Djekic et al., 2018) and natural characteristics (vegetation, water environment, etc.; Syafii et al., 2017; Lai et al., 2019), for the thermal environment of the square, a variety of studies have shown that the vegetation is the most important landscape elements affecting the thermal comfort of urban squares (Yu et al., 2022). Vegetation coverage can effectively reduce the surface temperature of the square and improve thermal comfort (Stocco et al., 2015).
The influence of trees on thermal comfort is higher than that of lawns (Lee et al., 2016); therefore, studying the influence of trees is key to better understanding and improving the thermal environment of squares. The impact of trees on the thermal environment of the square mainly depends on factors such as layout, cover, species, and leaf type. As an effective means of regulating the urban microclimate and improving thermal comfort, tree canopies can intercept 70%−90% of solar radiation, cutting short-wave and long-wave radiation to cool the urban surface; at the same time, through evapotranspiration, substituting latent heat for sensible heat, making the surrounding environment humidity rise and air temperature fall, thus significantly enhancing thermal comfort (Wang et al., 2024). The arrangement of trees can reduce the temperature; the degree of reduction is related to the layout method, and both temperature distribution and local heat transfer degree are affected by the planting pattern. The higher tree coverage, the better thermal comfort, Susana Stocco et al. concluded through simulation that the centralized layout of vegetation is better than the decentralized layout, and when the woodland area is equal to or >60% of the total area of the square, the thermal behavior will be improved (Stocco et al., 2021). Jiang Lijuan et al. measured the influence of different greening forms and landscape characteristics on the thermal environment of the square during day and night, concluded that in the meet when a certain degree of tree coverage, replacing the lower layer plants such as understory space shrubs, grass and other understory plants with hard pavement accessible to pedestrians will not have a negative impact on PET, and can effectively improve the utilization rate and vitality of the square space (Lijuan et al., 2022). Leaf type and tree species can effectively influence green space and local climate change, the physical characteristics of trees (canopy width, leaf area index, etc.) are important factors affecting the microclimate, the leaves create resistance to the air, so that the wind speed flowing through the leaves is reduced; the leaves also have the role of shading solar radiation. Tree transpiration, to some extent, lowers the ambient temperature and raises the humidity of the surrounding environment. The canopy, as an aggregate of tree foliage, modifies the thermal environment at the micro-scale by altering shade, evapotranspiration, and ventilation (Morakinyo et al., 2017). It has been shown that planting tall trees in open areas can help improve ventilation and increase thermal comfort during the day. Still, it is also necessary to consider the effects of the tree's characteristics, such as leaf area index and canopy width. Trees with wider crowns and higher leaf densities exhibit higher light attenuation, providing better cooling (Speak et al., 2020). Additionally, trees with high leaf area index have a more significant impact on the outdoor thermal environment (Yang et al., 2022).
Tree array layout directs the wind environment and thus affects the thermal environment of the site. The wind environment also affects the effectiveness of vegetation in regulating the microclimate. Ribbons of green space parallel to the wind direction have a better cooling effect (Sodoudi et al., 2018); concentrating trees in the center of the site toward the leeward side can provide a more effective cooling effect on the site environment (Hao et al., 2023). It has been shown that the use of upwind tree enclosure to block the summer dominant wind heat wave (Wang et al., 2019), in the downwind enclosure is to break the continuity of the trees, combined with the space under the canopy of the trees in a timely manner to evacuate the hot air generated within the colony can improve the thermal environment around the building. When the spacing of the tree array is denser it can be taken as a whole, the wind speed at the top of the first tree is larger, and the wind speed at the top of the subsequent trees is obviously weakened, and the wind pressure suffered by the tree is also obviously reduced (Xiaoyan et al., 2021).
After clarifying the characteristics of trees in the thermal environment, accurately simulating their three-dimensional (3D) morphology and ecological effects through scientific research methods has become a technical key to optimizing the design of the square's thermal environment. Computational fluid dynamics (CFD) is a recently developed simulation technique for analyzing fluid thermal-dynamic problems, commonly used to assess urban microclimates (Toparlar et al., 2017). In previous studies, due to the limitations of the simulation technique, the plant model was reduced to simple aggregates such as rectangles, cones, and prisms (Zhengnong et al., 2021). The closer the plant model is to reality, the closer the simulation results will be to reality. The simulation software has also launched corresponding functions. Currently, the Environment for Visualizing Images (ENVI)-met software, which is the most widely used in microclimate research, offers more refined customization options for plant modeling and can adjust the plant leaf area density and other factors (Simon, 2016). The ENVI-met plant model is constructed using software to voxelize the plant, after utilizing the plant's multiangle photographs as a reference; it is primarily based on European plants, which results in a difference between the simulation and reality (Shi et al., 2022). Currently, there are three mainstream reconstruction methods for three-dimensional modeling of plants: (1) The use of geometric shapes to depict the crown surface. (2) The use of voxels to reconstruct the tree. (3) The reconstruction of the tree's skeleton and the addition of foliage configurations (Xu et al., 2021). The first reconstruction method has the advantage of being computationally efficient and is suitable for simple trees, such as broadleaf trees (Janoutová et al., 2019). The second method features a spatial foliage distribution that takes into account gaps in the canopy. The third method has high accuracy and works better in estimating the transpiration rate of trees (Bournez et al., 2019). According to the previous study, the plant canopy part (leaves + branches) is considered as a whole (Lin, 2004). Since the primary research objective of this study is to explore the impact of trees on the thermal environment of the square, for the sake of computational efficiency and accuracy, this research uses the first method for tree reconstruction.
The in-depth and systematic research on thermal mitigation strategies for arboriculture in urban squares in northern China's climate has yet to be thoroughly explored, and there is a lack of empirical evidence and fine-tuning of key design parameters, such as the balance between arboriculture layout and space utilization efficiency, and the quantification of arboricultural characteristics. The primary purpose of this study is to take the flag-raising square in the central axis of a university in the north as an example, to assess the influence of its arbor layout on the thermal environment in summer through thermal environment simulation and other methods, and to explore the role of arbor layout on the thermal environment in this space type of square under extreme weather. The specific research methods are as follows: (1) CFD model calibration. Based on the air temperature, relative humidity, and other data measured at the site, the CFD model and parameter settings are adjusted and optimized to determine high-precision parameter settings. (2) Arbor point cloud model construction. Combine unmanned aerial vehicle (UAV) tilt photography with this approach to establish a high-precision status quo arbor model, thereby improving the accuracy of subsequent simulations. (3) Adopt the verified simulation method to simulate the thermal environment of the typical arbor layout of the square, and study the arbor layout way to mitigate the thermal environment of the square.
2 Materials and methods
2.1 Study area
The experiment was conducted in Xiqing District, Tianjin. Tianjin is located at (39°08′N 117°12′E) is a typical Chinese city with a temperate monsoon climate with cold winters and hot summers, and the main vegetation is deciduous trees. The temperature is highest in July, with an average monthly high of 31°C, an average temperature of 26.8°C, and an average humidity of 77%. The test site is located in the main square of the center axis of the Tianjin Urban Construction University campus in Xiqing District, Tianjin, China. With an east–west (EW) length of 170 m and a north–south (NS) width of 165 m, with a total area of about 2.8 ha, of which the hard-paved area is 1.8 ha. The north side of the square is the main administrative building, the east side is the teaching building, the south side is the lakefront sunken square, the west side is the campus nursery green space, and the center is the platform. The East and West sides for the deciduous trees, acacia and ginkgo, are composed of rectangular tree lines, with the south side featuring the two groups of purple leaf plum tree lines.
The square is located in front of the main administrative building at the end of the central axis of the campus. The completely symmetrical form and the spatial sequence with the back of the building facing the water body coincide with the layout form of the main square of most of China's cities, and the selection of this square as the object of study is typical and representative. The test period for this study is 5–8 July 2023 6.00–18.00 p.m. (Beijing time), the measurement points were arranged as shown in Figure 1. The meteorological data were recorded at 1-min intervals, and the instruments and parameters used are shown in Table 1. The measured data were used to calibrate the validity and reliability of the simulation. In previous studies, some scholars have categorized hot weather based on day-by-day maximum temperature (Tmax) and minimum temperature (Tmin): Tmax ≥ 35°C is defined as hot weather and Tmin ≥ 25°C is defined as hot and muggy weather (Yingchun et al., 2003). In this study, 6 July (Tmax = 38.8°C, Tmin = 29.8°C), the day with the extreme high temperature among the survey days, is selected as the simulation date (Table 2).
Figure 1
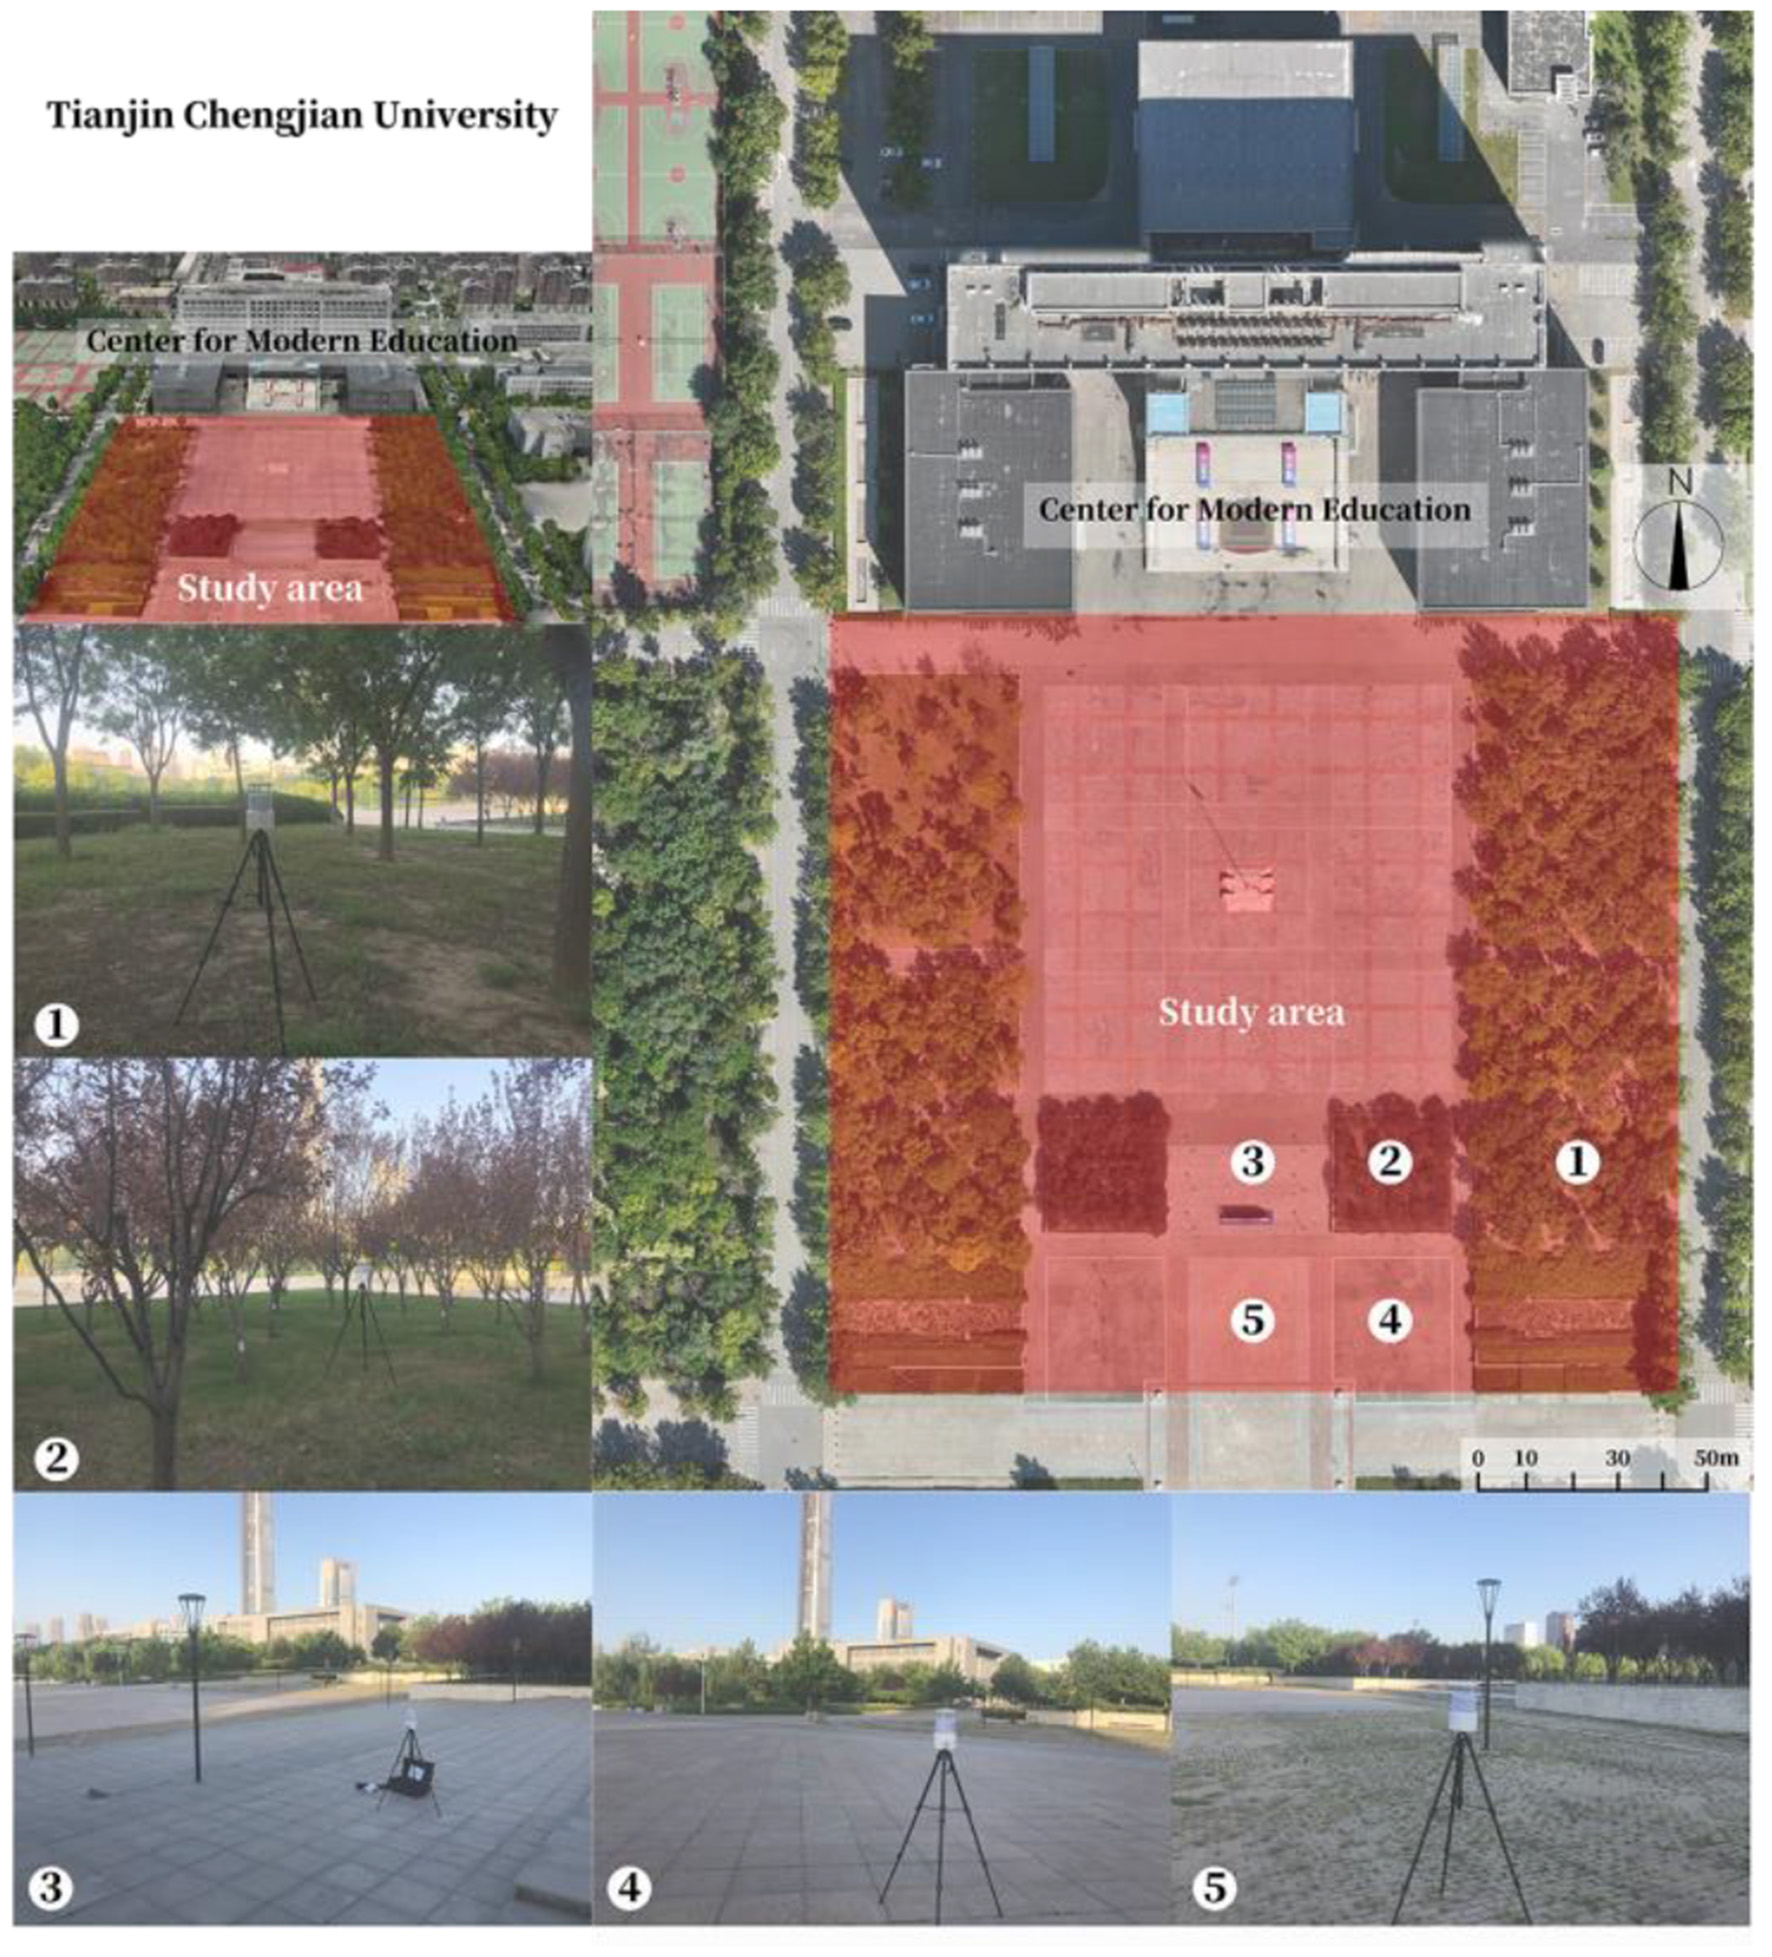
Location of the site and weather stations.
Table 1
| Measured instrument | Instrument sensitivity |
|---|---|
| Air temperature | 0.01°C |
| Relative humidity | 0.02% RH |
| Wind speed | 0.01 m/s |
| Solar radiation | 0.01 HW/m2 |
Instrument parameters.
Table 2
| Time | Temperature (°C) | Humidity (%) | Wind velocity (m/s) |
|---|---|---|---|
| 0:00 | 32.2 | 51.0 | 3.4 |
| 1:00 | 31.7 | 55.8 | 2.7 |
| 2:00 | 31.5 | 59.3 | 1.7 |
| 3:00 | 31.2 | 61.7 | 1.7 |
| 4:00 | 30.3 | 62.4 | 2.4 |
| 5:00 | 30.0 | 62.1 | 2.3 |
| 6:00 | 29.8 | 60.9 | 2.8 |
| 7:00 | 30.2 | 59.1 | 3.0 |
| 8:00 | 30.9 | 57.9 | 2.2 |
| 9:00 | 32.3 | 55.9 | 2.1 |
| 10:00 | 34.0 | 50.2 | 2.1 |
| 11:00 | 34.9 | 47.5 | 1.8 |
| 12:00 | 36.1 | 43.2 | 1.8 |
| 13:00 | 37.2 | 38.0 | 2.4 |
| 14:00 | 38.0 | 34.5 | 2.2 |
| 15:00 | 38.8 | 29.8 | 2.3 |
| 16:00 | 38.6 | 29.4 | 2.1 |
| 17:00 | 38.5 | 27.0 | 2.2 |
| 18:00 | 37.9 | 28.7 | 1.4 |
| 19:00 | 37.0 | 34.8 | 1.4 |
| 20:00 | 32.2 | 37.8 | 2.2 |
| 21:00 | 31.1 | 41.8 | 1.1 |
| 22:00 | 30.9 | 44.0 | 0.7 |
| 23:00 | 29.8 | 45.3 | 1.7 |
Average daily temperature, humidity, and wind speed.
2.2 Site modeling and simulation setup
A finite volume method and structured grid meshing based solver the CFD scStreamV2021 (Software Cradle Co., Ltd., Osaka, Japan) was used to simulate the current state of the site in terms of the vegetation, water bodies, radiation fields in the buildings and the surrounding city, winds, temperatures, humidity and other climatic environments. The software is widely used for environmental control analysis of buildings, including analysis of indoor and outdoor air and heat flow fields that affect the environment. scSTREAM holds a 90% market share in the construction industry, particularly in Japan. The point cloud model generated by UAV tilt photography was imported to restore the current vegetation status of the site.
Through mapping, the square and the surrounding area are modeled in 3D at a scale of 0.1 m resolution in the study area, with detailed references to reality in terms of the scale and material properties of the landscape elements (Figure 2). To retain the simulation of the surrounding urban environment, a rectangle centered on the study object and extending to 2,070 × 2,078 m in all directions is the modeling domain. The software uses Cartesian meshing for local optimization, enavling a finer mesh to be applied to a specific part or location, reducing memory consumption and computation time. Automatic meshing with tetrahedral or hexahedral cells using Cutcell and finite element modeling. Based on the size of the computational domain and the square, a three-layer square was used for meshing:
Figure 2
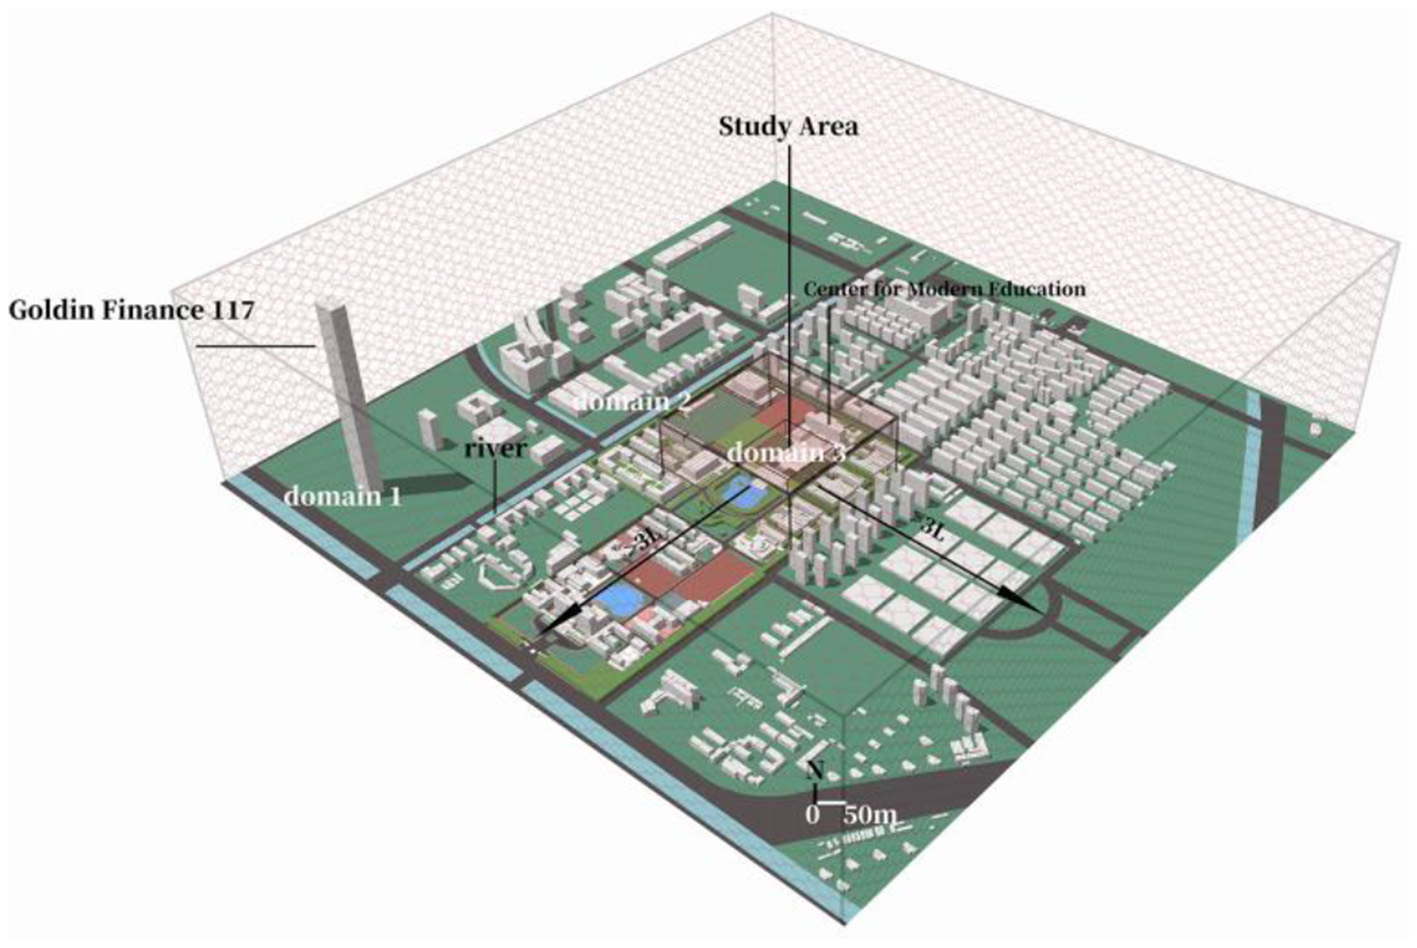
Multilayer meshing and perimeter site modeling.
The outermost structural domain 1 is 2,070 m(x), 2,090 m(y), 564 m(z) with a standard grid length of 20 m and a threshold length of 8 m.
Intermediate domain 2 is 410 m(x), 410 m(y), 200 m(z), with a standard grid length of 8 m and a threshold length of 1 m.
The innermost domain 3 is 180 m(x), 185 m(y), 50 m(z) with a standard grid length of 1 m and a threshold length of 0.2 m.
The grid was generated from representative local encryptions with geometric transfer ratios of 1:1.2 and a total grid count of 45,926,701.
The simulation is set up as follows: the turbulence is modeled using the standard k-e model, which is the most basic model and is widely used to predict various types of turbulence. The simulation setup considers thermal, radiative, solar radiation, and other types of analysis. Steady-state analysis is used for this analysis. The top and side thermal boundaries are boundaries of solar radiation. The intensity and direction of solar radiation were specified from the observation database in the American Society of Heating, Refrigerating and Air-Conditioning Engineers (ASHRAE) Handbook (2013). ASHRAE 2013 provides standard methods for calculating the intensity of direct and scattered solar radiation on horizontal and vertical surfaces under clear-sky conditions. Cradle CFD's solar radiation model integrates these formulas to compute the radiative heat flux acting on the boundary of the computational domain as a thermal boundary condition based on the input geographic location, time, date, and surface orientation. Plants and water bodies serve as the primary sources of heat and moisture transfer, with plants as the porous medium for convective heat transfer and transpiration, and water as the static interface for convective heat transfer and evaporation. In this study, this was modeled as the convective heat transfer coefficient (Asawa et al., 2016), and the evaporative water flux rate (Morille et al., 2013), which are consistent with the average values of related studies (Yi-jia et al., 2021; Yang et al., 2020), respectively. Boundary conditions are set according to previous studies (Ma et al., 2023). The lateral wall boundaries of the domain were no-slip conditions; the top wall boundary is free-slip, whereas the power-law velocity was applied to the ground and building surfaces.
The sc Stream built-in Plant Canopy model was used to simplify the site vegetation species by considering the hygrothermal characteristics of plants (Xue et al., 2018), and the density per unit of leaf area (3.61 m2/m3), friction coefficient (0.63), and porosity (0.9) were set for the plant model to characterize the attenuation of solar radiation, the loss of wind pressure, and the turbulence-forming effects of plants. To obtain a more intuitive picture of the impact of plants on the square's microclimate during the daytime, the simulation times were set for 6 July 2023, at 6:00, 9:00, 12:00, 15:00, and 18:00 h. Specific parameters are shown in Table 3.
Table 3
| Parameters | Values used |
|---|---|
| Simulation date | 6 July 2023 |
| Location | China Tianjin (39°08′N 117°12′E) |
| Meteorological parameters | Air temperature, humidity, wind speed, wind direction, cloud cover 0, weather station 1.5 m above ground level, and solar insolation calculated using ASHRAE information (2013) |
| Plant | Point cloud establishment plants, porous media: particle diameter 0.03 m, shape factor 0.2, porosity 0.9; other plants: friction factor 0.63, leaf area density 3.61 m2/m3 |
| Building | A notable 0.05 m thick concrete (293 K), emissivity 0.9, absorption ratio for construction materials |
| Ground | Asphalt (293 K), emissivity 0.9, absorption ratio for building materials; 0.2 m thick soil (293 K), emissivity 0.9, absorption ratio for building materials |
Microclimate simulation settings and meteorological parameters of the model input in scStreamV2021.
2.3 Field measurements and model validation
Comparison of the current state microclimate data with the simulated data at each point to verify the model accuracy. In this study, correlation coefficient (R2), mean absolute error (MAE), and root mean square error (RMSE) are used to check the accuracy of the model. The formula is calculated as follows:
where Xobs is the measured value, Xmodel is the simulated value, and n is the number of data blocks. The average correlation coefficient (R2) = 0.993, root mean square error (RMSE) = 0.373°C, and mean absolute error (MAE) = 0.306°C for the temperature at each measurement point. Mean correlation coefficient (R2) for humidity = 0.942, root mean square error (RMSE) = 3.7%, and mean absolute error (MAE) = 1.9%. The mean correlation coefficient (R2) = 0.892, root mean square error (RMSE) = 0.523 m/s and mean absolute error (MAE) = 0.378 m/s for wind speed (Figure 3). Compared with the temperature and humidity, the wind speed error is relatively large but within the error tolerance, analyzing the reason for this is that the status quo point of plant growth is poor, the simulation for plant growth is good conditions, resulting in part of the point of the wind by the plant canopy obstruction caused by the value of the low. The results indicate that the error falls within the normal range, thereby verifying the credibility of the microclimate simulation.
Figure 3
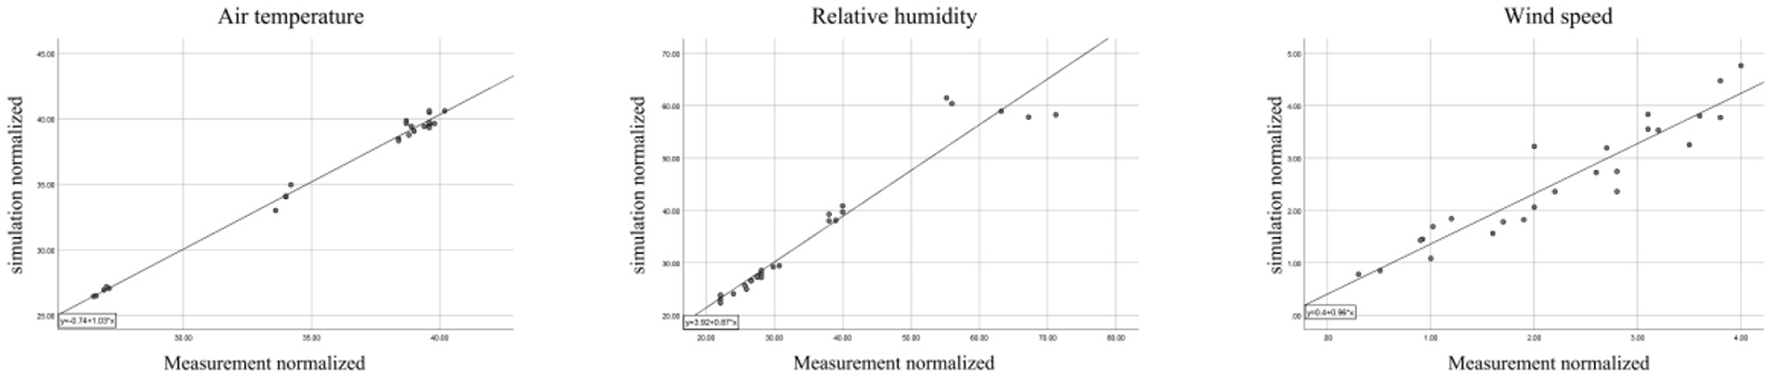
Linearity between the simulated data and the measured data.
2.4 Plant modeling
The physical properties of plants have an important impact on the simulation, and a more accurate model can help reshape the microclimate in the current situation. In this study, we utilize the tilt photography function of DJI Sentinel 3M multispectral version to acquire the vegetation point cloud data. We then reconstruct the collected data using DJI Terra software and perform appropriate pruning in conjunction with the actual situation to simulate the current environment. The use of 3D point cloud technology for acquiring landscape spatial data significantly enhances data acquisition efficiency and accuracy (Shi et al., 2022). Due to the poor growth or dead trees in the current site, for the sake of experimental unity and standardization, and to facilitate qualitative and quantitative changes in the tree array space, a single tree with good growth and a full crown was selected as the standard vegetation module, and rearranged in the site according to the current distribution of trees as the optimized plant point cloud model, which was then used in the subsequent simulation to explore the effect of plant distribution on the thermal comfort of the square.
The feasibility of plant point cloud modeling was verified by comparing the wind environment maps generated by point cloud modeling and those obtained from plant coarse modeling The simulations were carried out using the original plant block (the square plants were divided into eight groups of blocks), the original plant coarse block (the square plants were modeled according to the distribution of the square plants using the rectangular block), the modified original plant point cloud model (a decent modification of some parts of the square plant point cloud model), and the optimized plant point cloud model (a well-grown tree was chosen to replace all the trees at all locations; Figure 4). Other conditions remain unchanged. As shown in Figure 5, the modified point cloud model is more effective at simulating the current environment because the reconstructed plants exhibit more morphological characteristics than the real plants, especially in the wind environment, which is an important condition for the microclimate. The optimized plant point cloud model may differ from the measured values of the current weather station due to inconsistencies with the current situation. Still, as an idealized and standardized plant model, the optimized plant point cloud model was used in the later experiments to explore the relationship between the plants and the microclimate in the square of the main teaching building.
Figure 4
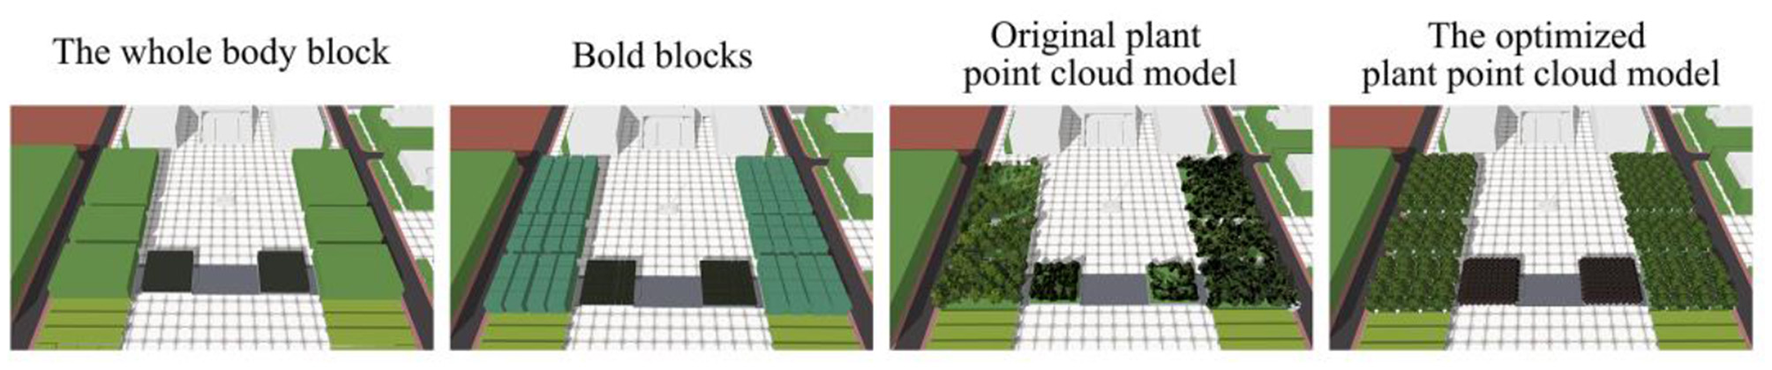
Modeling of site vegetation.
Figure 5
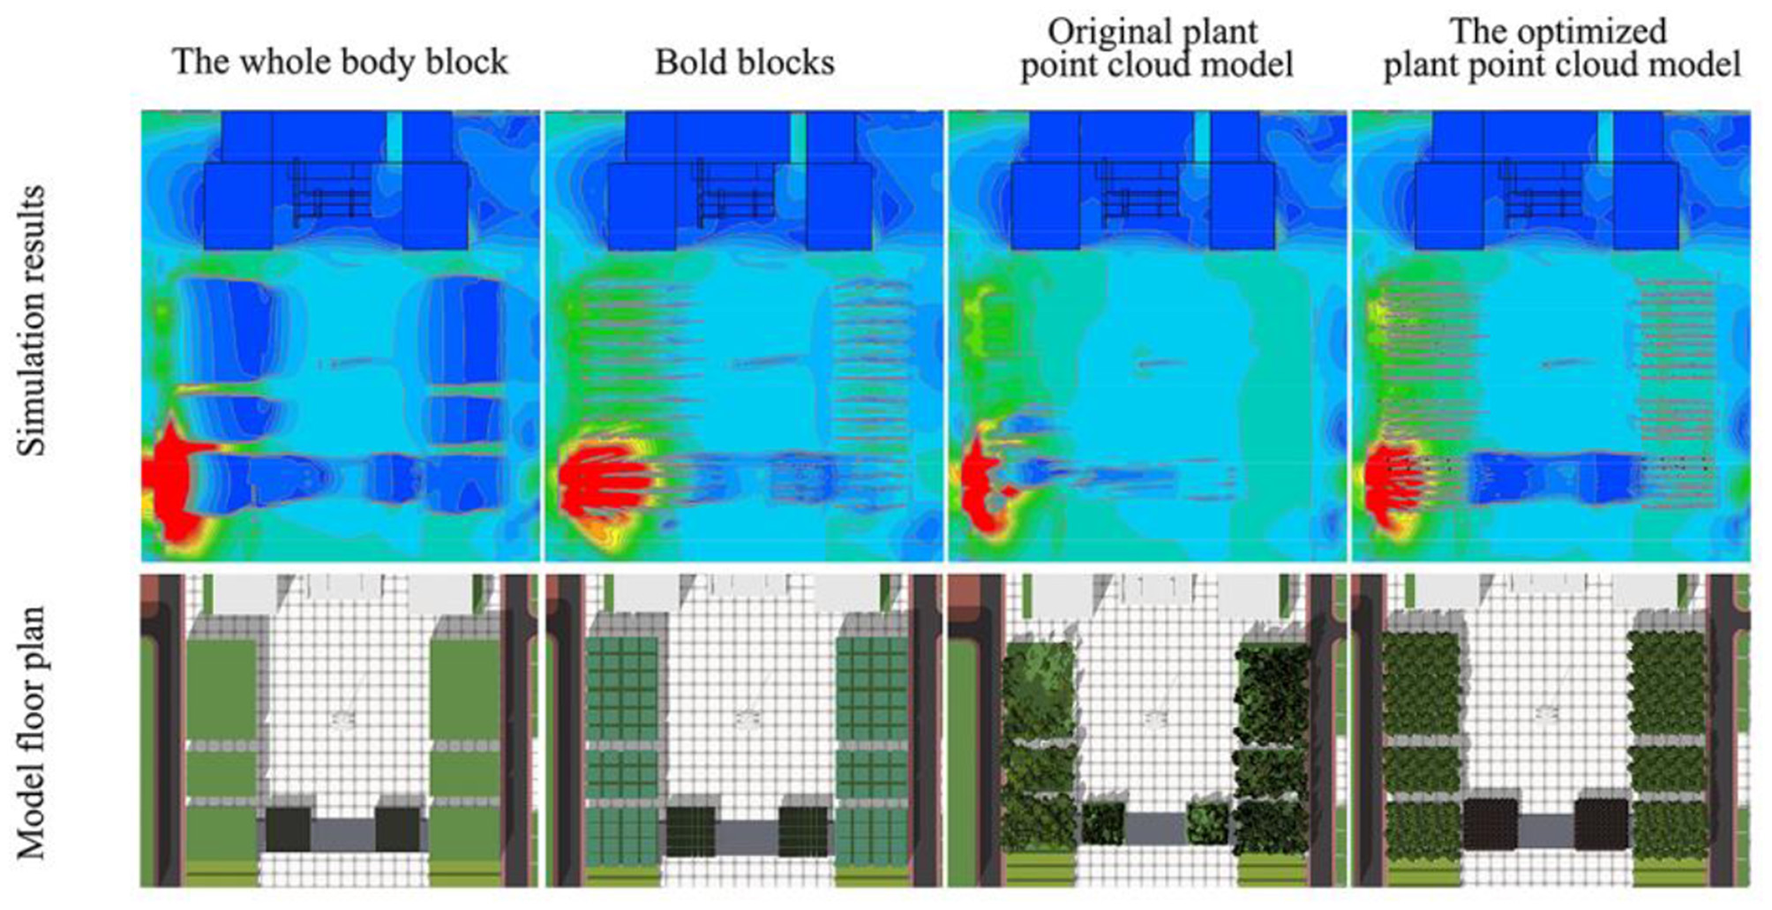
Results of wind environment simulation.
2.5 Square landscape space design and reconstruction
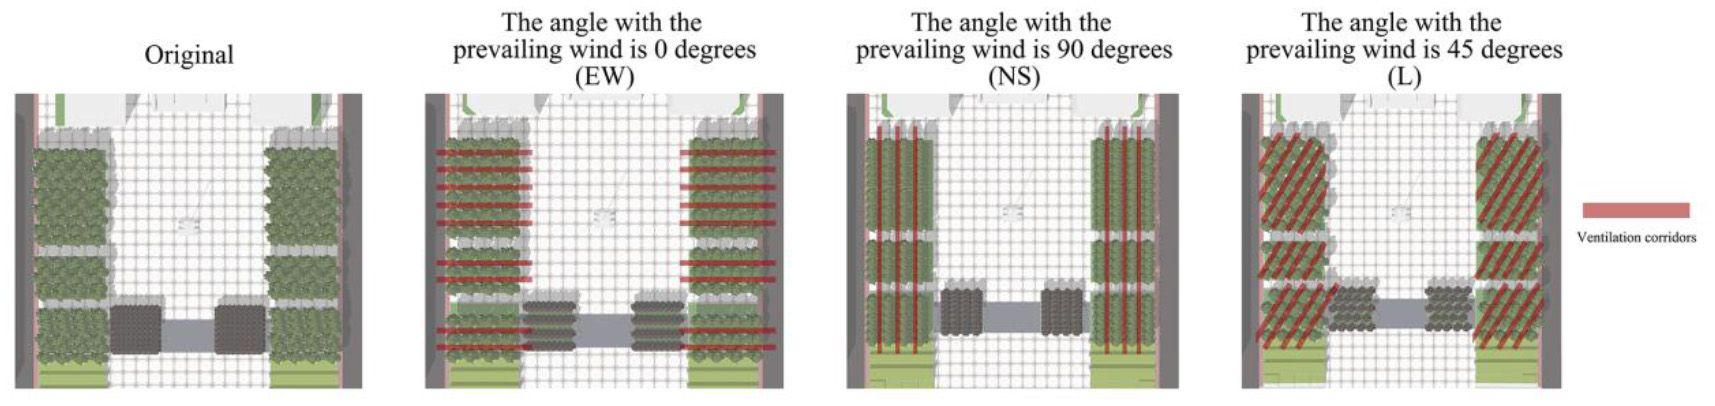
Based on determining the optimal simulation model, to better create a ventilation corridor, the current vegetation planting spacing is increased, the current tree planting 5 m between east and west, north and south side of the 2.5 m spacing between the denser form of planting adjusted to a single time the planting density of the tree crown, that is, east and west sides of the 9 m. To investigate the effect of ventilation corridor orientation on the thermal environment of the square. The spacing between the north and south sides of square tree rearranged to create three kinds of planting patterns (Figure 6): (1) Reduce the EW tree arrangement to create an EW wind corridor pattern with a 0° angle to the wind direction; (2) Reduce the north-south tree arrangement to create a North–South (NS) wind corridor pattern with a 90° angle to the wind direction; and (3) Maintain the original tree arrangement to create a L wind corridor pattern with a 45° angle to the wind direction. To investigate the influence of the width of the ventilation corridor on the thermal environment of the plaza, the above three wind corridor patterns were simulated respectively, and trees were planted at intervals of 1 × crown, 1.5 × crown, 2 × crown, and 2.5 × crown, so as to derive the optimal spacing of the tree array arrangement.
Figure 6
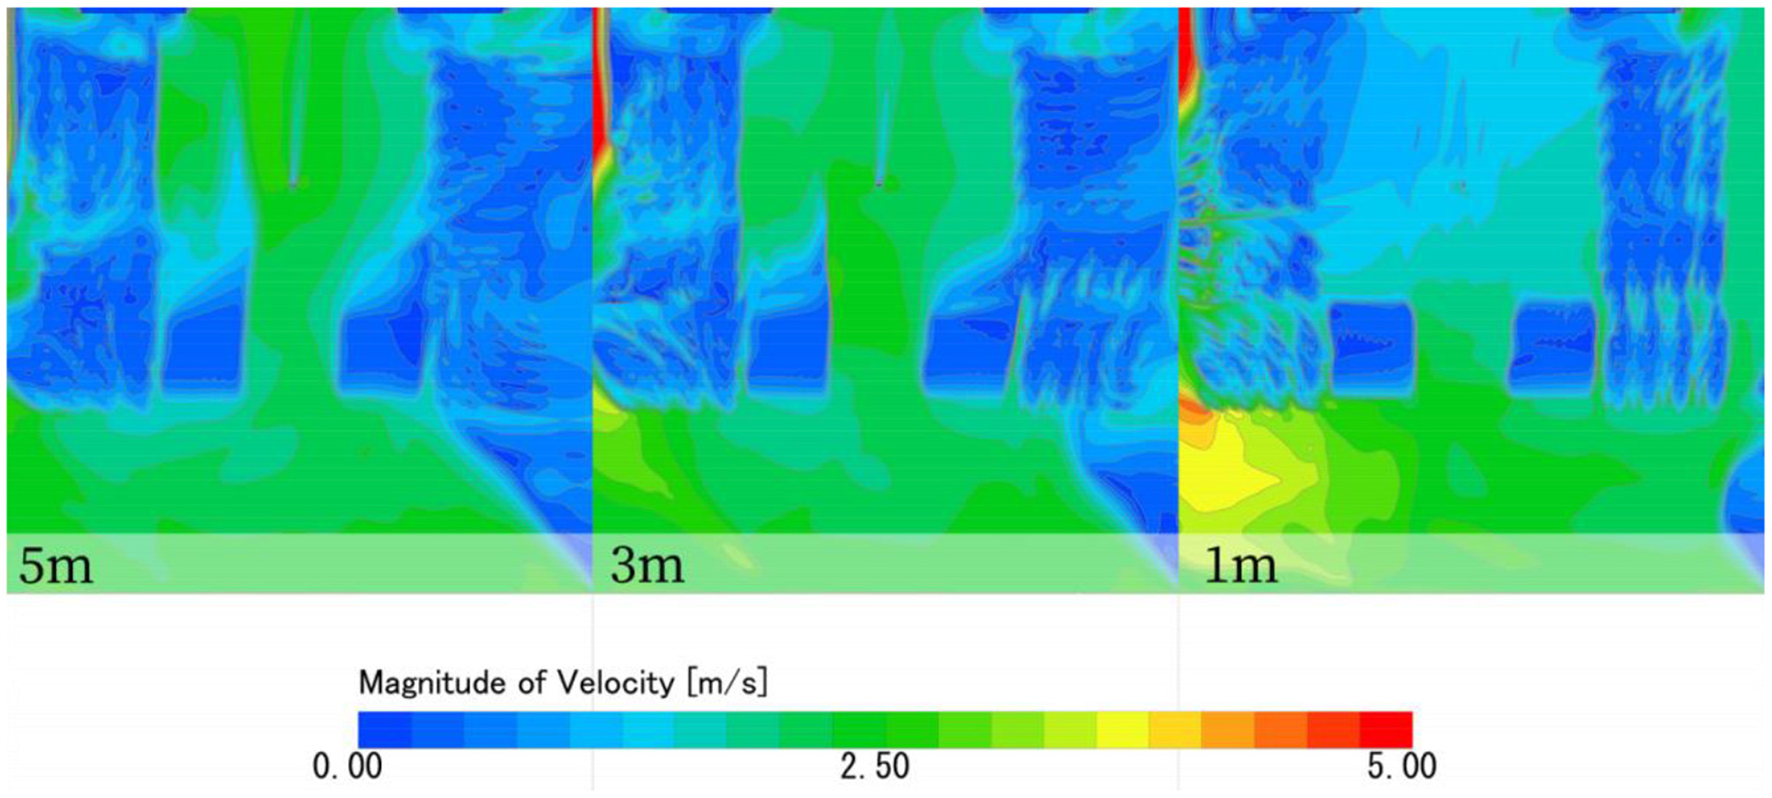
Wind environment simulation results for different length thresholds.
2.6 Grid-independence verification
Numerical simulations of computational fluid dynamics are affected by mesh discretization errors between the converged solution of the adopted mesh scheme and the exact solution of the equations. Grid convergence validation was carried out for the scenarios using progressive grid encryption. The simulated and measured error values are calculated for the wind environment simulation grid length thresholds of 5, 3, and 1 m, respectively, and the results are shown in Table 4 and Figure 7, which shows that it can be found that the simulation error is smaller in the case of a length threshold of 1 m, and a grid with a length threshold of 1 m is used to ensure the simulation's accuracy and efficiency.
Table 4
| Grid length thresholds | Ratio of error area (%) |
|---|---|
| 5 m | 60.3 |
| 3 m | 44.2 |
| 1 m | 3.9 |
Case scenarios for grid sensitivity verification.
Figure 7
The original pattern with three new planting patterns.
2.7 Thermal comfort evaluation indicators
Planimetric maps of thermal comfort indices were also generated on the basis of the microclimate simulation maps, and in this study, the wet-bulb globe temperature (WBGT) and the New Standard Effective Temperature (SET*) were used as the indicators for evaluating the thermal comfort of the site. These microclimate planimeters illustrate how different plant landscape types affect the spatial distribution of thermal comfort zones within the square. The thermal comfort of the core area of the square under different planting patterns is evaluated using these indicators.
Wet Black Globe Temperature (WBGT) is a fundamental parameter for comprehensively evaluating the heat load of human contact with the operating environment and has been certified by the ISO 7243 standard system. WBGT considers four factors: air temperature, wind speed, air humidity, and radiant heat. New Standard Effective Temperature (SET*) is a thermal comfort index incorporated into the ASHRAE standard that takes into account wind speed, temperature, humidity, space mean temperature (sMRT), as well as atmospheric pressure and human condition data (summer clothing heat resistance 0.5 clo, height 1.8 m, weight 70 kg, metabolic rate 0.8 met).
3 Results
3.1 Influence of ventilation corridors on thermal comfort in the core area of the square
Numerical simulations of the three wind corridor modes parallel to the wind direction of the day at 6:00, 9:00, 12:00, 15:00, and 18:00 h are converted to 1.5 m pedestrian height WBGT and SET* planograms and calculated as histograms of the different temperature ranges. The simulation results of the different ventilation corridor orientations are evaluated in terms of relative thermal comfort in the target area as evaluation criterion. In the summer, people will feel uncomfortable when the standard equivalent temperature is above 34.5°C, and will feel very uncomfortable when it exceeds 37.5°C. The safe WBGT limit for the human body in the summer recreational state is 32 to 33°C. When the ambient WBGT value is exceeded for an extended period, safety precautions should be taken to prevent thermal damage to the human body (Lin, 2004). To better reflect the range of thermal comfort on that day, the thermal comfort floor plan sets the maximum temperature to 34°C (Gagge et al., 1971).
On that day, the test wind direction was westerly, and by comparing the status quo thermal comfort floor plan, the simulation was conducted at 6:00, 9:00, 12:00, 15:00, and 18:00; the specific characteristics were as follows (Figure 8): (1) The EW mode had the best average daily improvement of the thermal comfort level (the average daily improvement of ΔSET*= 0.07°C and ΔWBGT = 0.15°C), in which the EW mode improvement was not optimal at 6 a.m. and 9 a.m., and the improvement was optimal at the rest of the time periods. The thermal comfort of the southwest side of the site in this model was optimal and improved most significantly, and the improvement effect of the southeast side was weaker; (2) the NS model had the worst average daily improvement in thermal comfort (average daily improvement ΔSET* = 0.05°C, ΔWBGT = 0.08°C), in which the NS model had a worse improvement effect in all time periods. The overall improvement depth is weaker than EW, but the west side has the most significant improvement in this mode; (3) The L mode has a better average daily improvement in thermal comfort (average daily improvement ΔSET* = 0.03°C, ΔWBGT = 0.08°C), where the L mode has the best improvement at 9 am. The overall improvement depth is deeper than NS and weaker than EW, with better thermal comfort improvement on the southwest side in this mode.
Figure 8
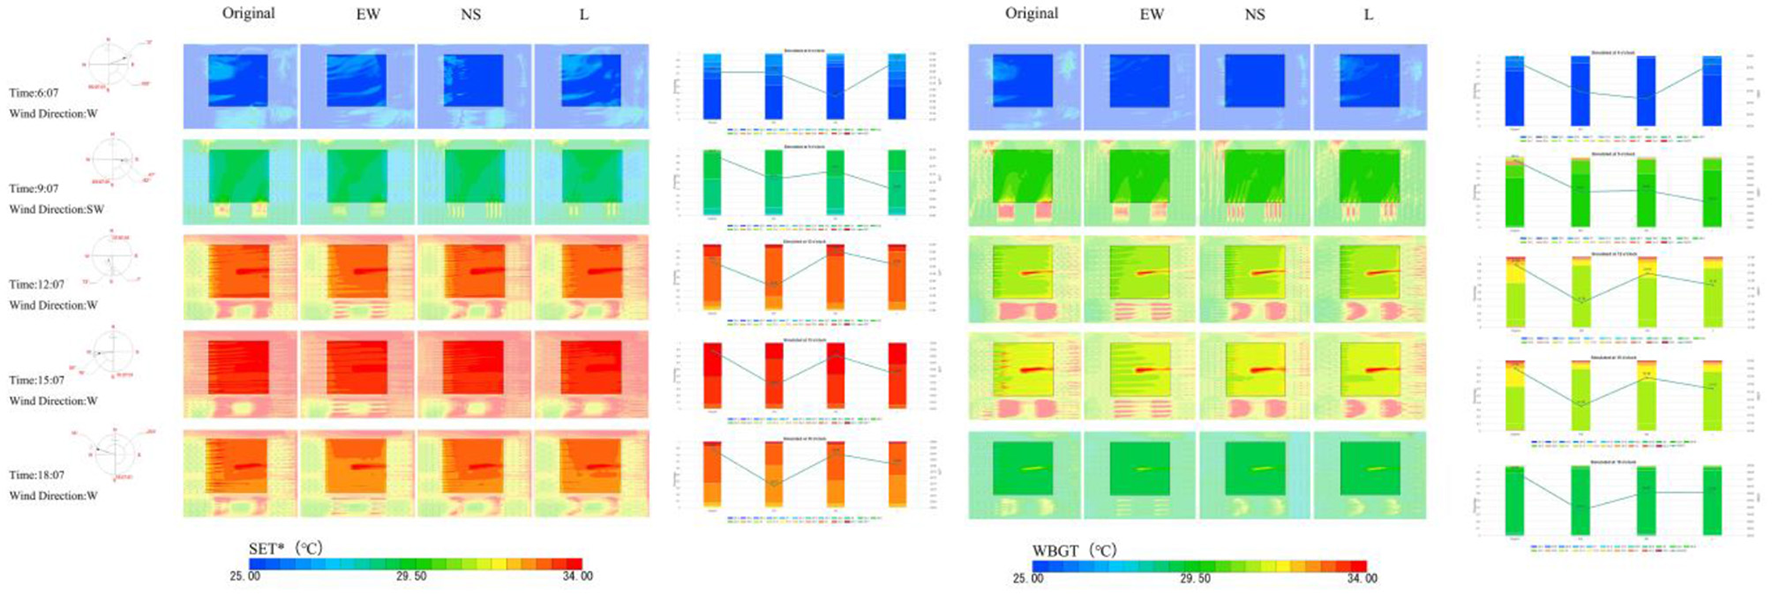
Simulation results of the different ventilation corridor orientations.
3.2 The effect of plant spacing on core thermal comfort in a square
Unreasonable planting density is not conducive to improving thermal comfort in the center of the plaza, To simplify the simulation experiments, plant spacing was simulated in terms of 1, 1.5, 2, and 2.5D planting intervals in terms of the crown D of the selected established trees. The average thermal comfort in the thermal comfort plan generated by the calculation was compared with the original data to derive a changed thermal comfort map.
3.2.1 EW mode
SET*, WBGT thermal comfort plan view, and the improvement of the change in Figures 9, 10, respectively, in EW mode to improve the degree of thermal comfort of the square with increased plant spacing showed a trend of increasing and then decreasing, the degree of improvement in the two-dimensional (2D) space at the optimal value. In the intervals of 1, 1.5, 2, 2.5D increased the area of the square comfort area, the main improvement area for the southwest side of the square, the north side of the improvement is worse, and the worst improvement is in the northeast of the square. The EW model improved the thermal comfort of the square except for point 6, and the best improvement at 6 was EW1.5 (ΔSET* = 0.056°C, ΔWBGT = 0.141°C); the best improvement at 9 was EW2.5 (ΔSET* = 0.158°C, ΔWBGT = 0.109°C); the best improvement at 12 was EW2.5 (ΔSET* = 0.449°C, ΔWBGT = 0.140°C); the best improvement at 15:00 h was EW2 (ΔSET* = 0.238°C, ΔWBGT = 0.287°C); and the best improvement at 18:00 h was EW1.5 (ΔSET* = 0.180°C, ΔWBGT = 0.01°C). The best improvement in thermal comfort throughout the day was achieved by EW2 (ΔSET* = 0.198°C, ΔWBGT = 0.130°C). The average daily improvements, from largest to smallest, were EW2, EW2.5, EW1.5, and EW1, with average improvement of ΔSET*= 0.177°C and ΔWBGT = 0.122°C.
Figure 9
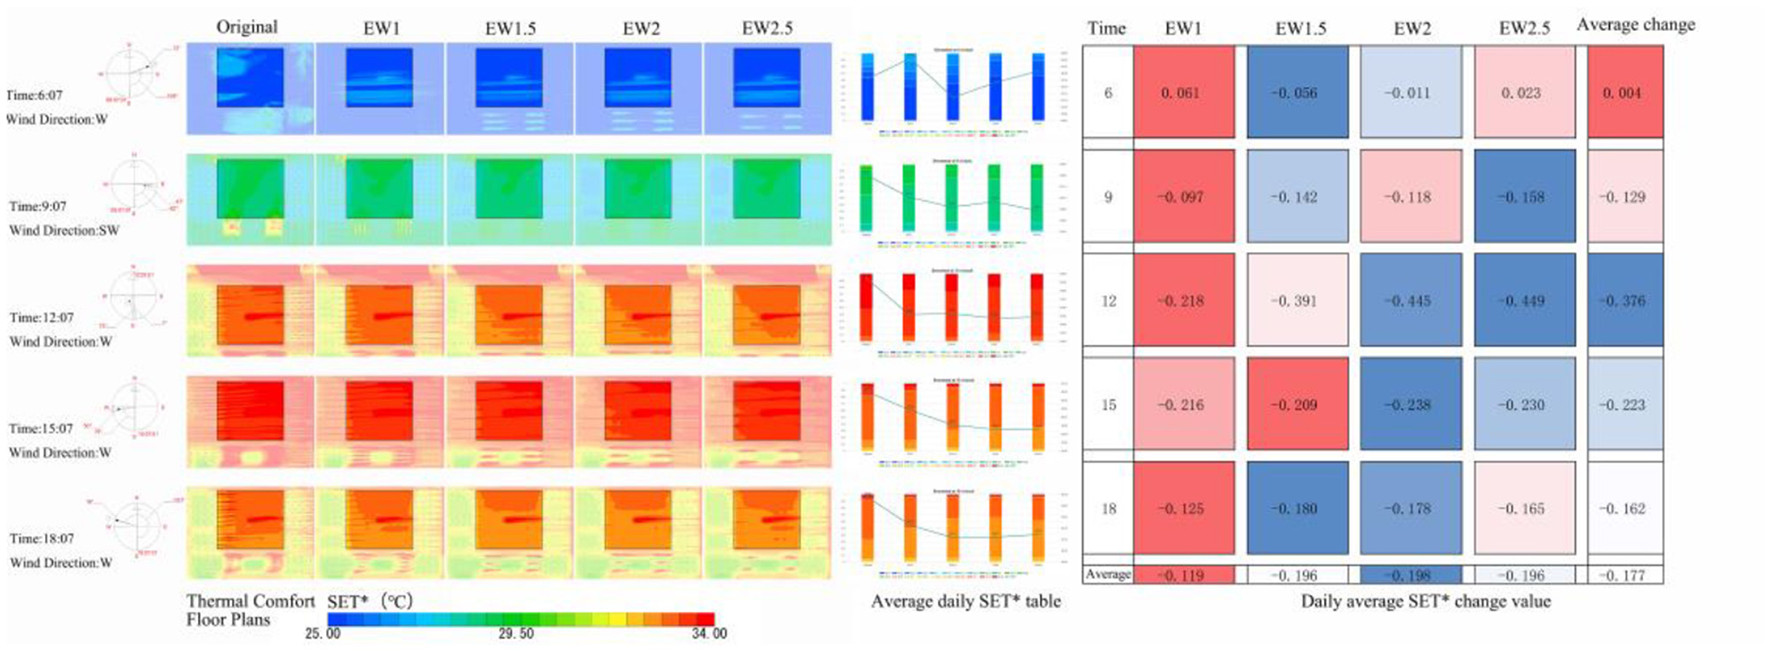
EW model SET* floor plans and improvement changes.
Figure 10
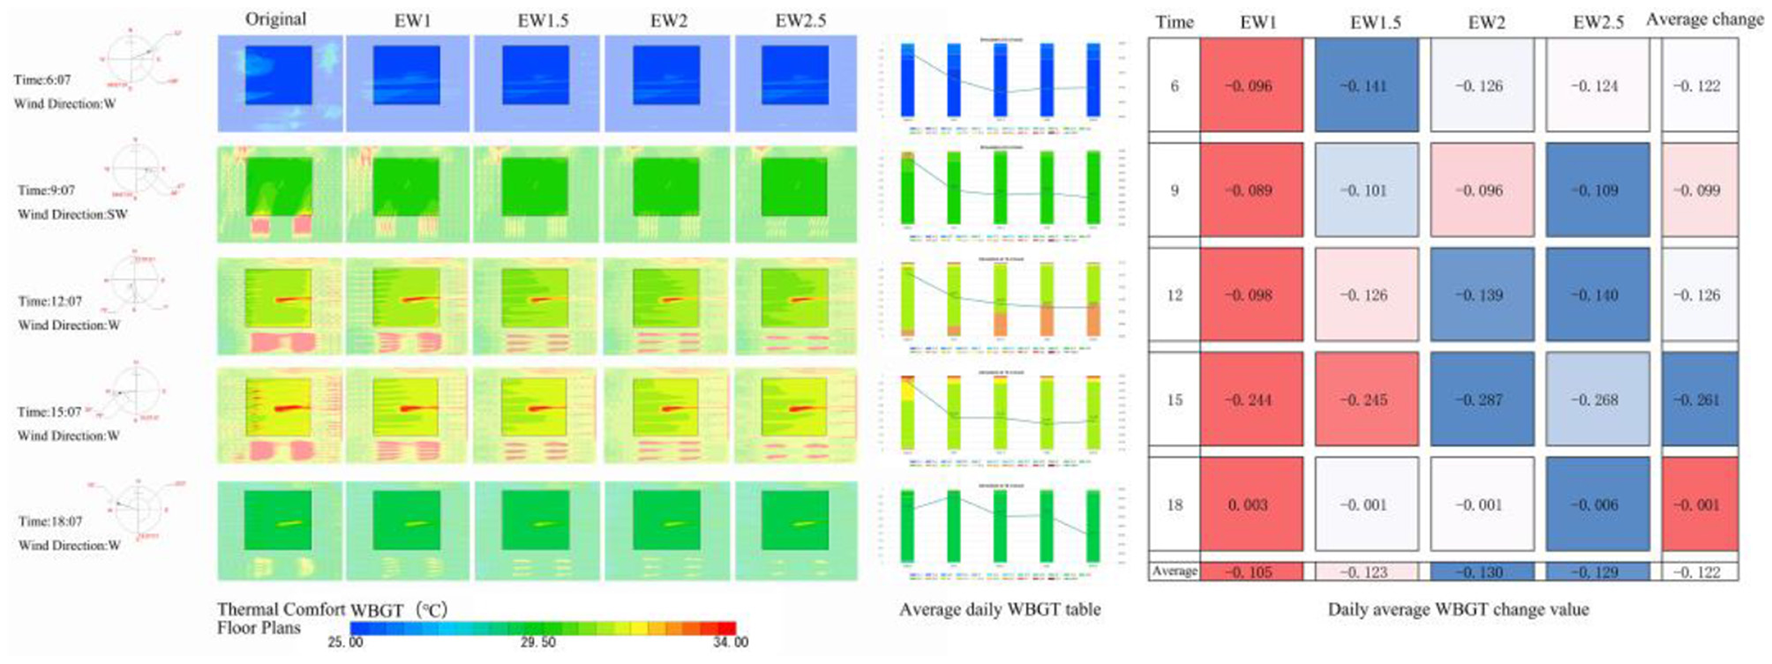
EW model WBGT floor plans and improvement changes.
3.2.2 NS model
SET*, WBGT thermal comfort plan, and the improvement of changes in Figures 11, 12, respectively, the NS mode to improve the degree of thermal comfort in the square with the increase in plant spacing showed a first increase and then decrease, the degree of improvement in the 2D when the optimal. At intervals of 1, 1.5, 2, and 2.5D, the area of the square comfort area was increased, and the main improvement area was the southwest side of the square; the north side was poorly improved, and the northeast side of the square was the worst improved. NS mode improved the thermal comfort of the square except for point 6, and the best improvement effect at point 6 was NS2.5 (ΔSET*= −0.104°C, ΔWBGT = 0.019°C); and the best improvement effect at point 9 was NS2 (ΔSET* = −0.104°C, ΔWBGT = 0.019°C). (ΔSET* = 0.031°C, ΔWBGT = 0.074°C); NS2 (ΔSET* = 0.262°C, ΔWBGT = 0.014°C) at 12:00 h; NS2 (ΔSET* = 0.144°C, ΔWBGT = 0.064°C) at 15:00 h; and NS2.5 (ΔSET* = 0.144°C, ΔWBGT = 0.064°C) at 18:00 h. NS2.5 (ΔSET*= 0.139°C, ΔWBGT = 0.005°C). The best improvement in thermal comfort throughout the day was achieved by NS2 (ΔSET* = 0.079°C, ΔWBGT = 0.036°C). The average daily improvements, from largest to smallest, were NS2, NS2.5, NS1.5, and NS1, with average improvement of ΔSET* = 0.051°C and ΔWBGT = 0.031°C.
Figure 11
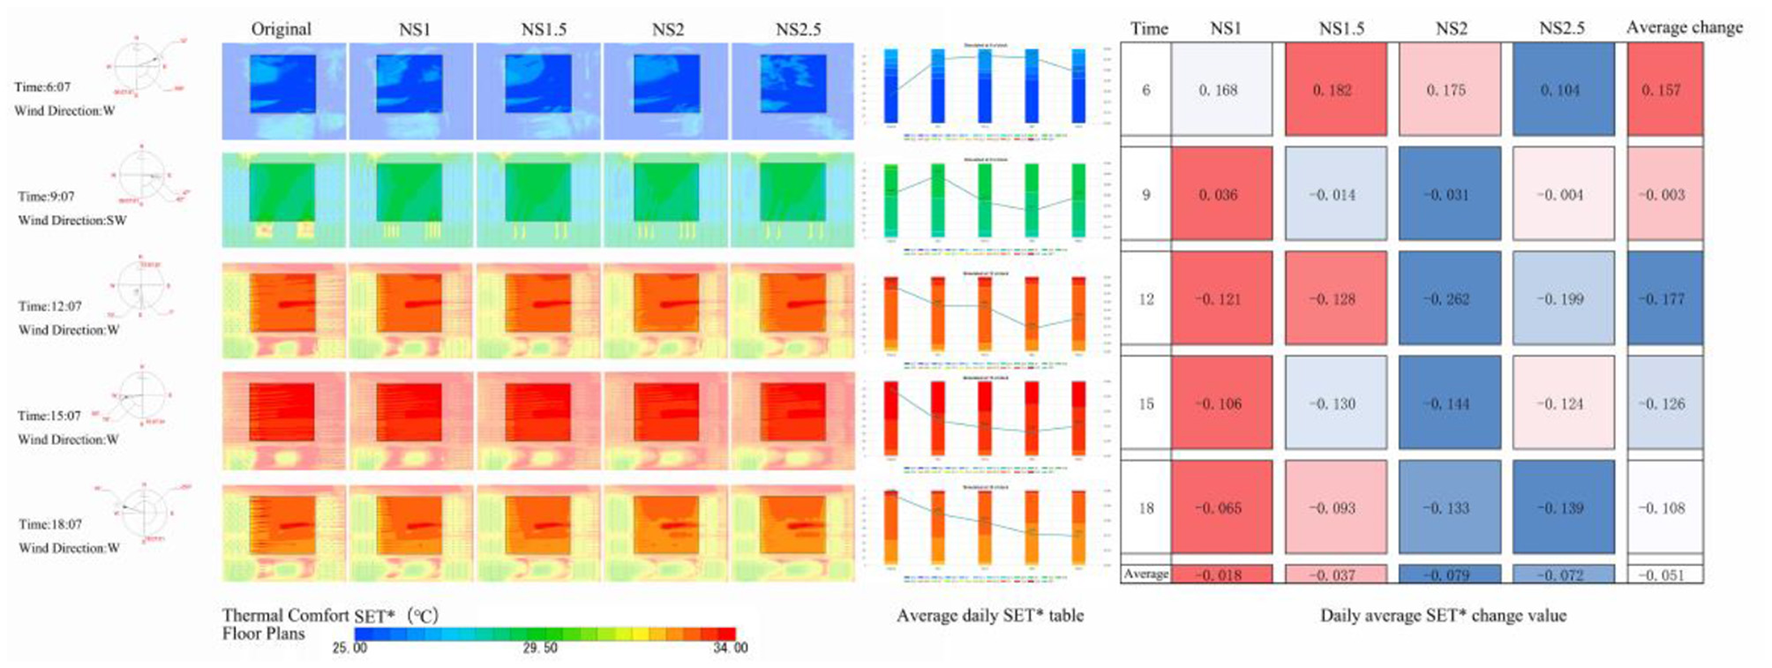
NS model SET* floor plans and improvement changes.
Figure 12
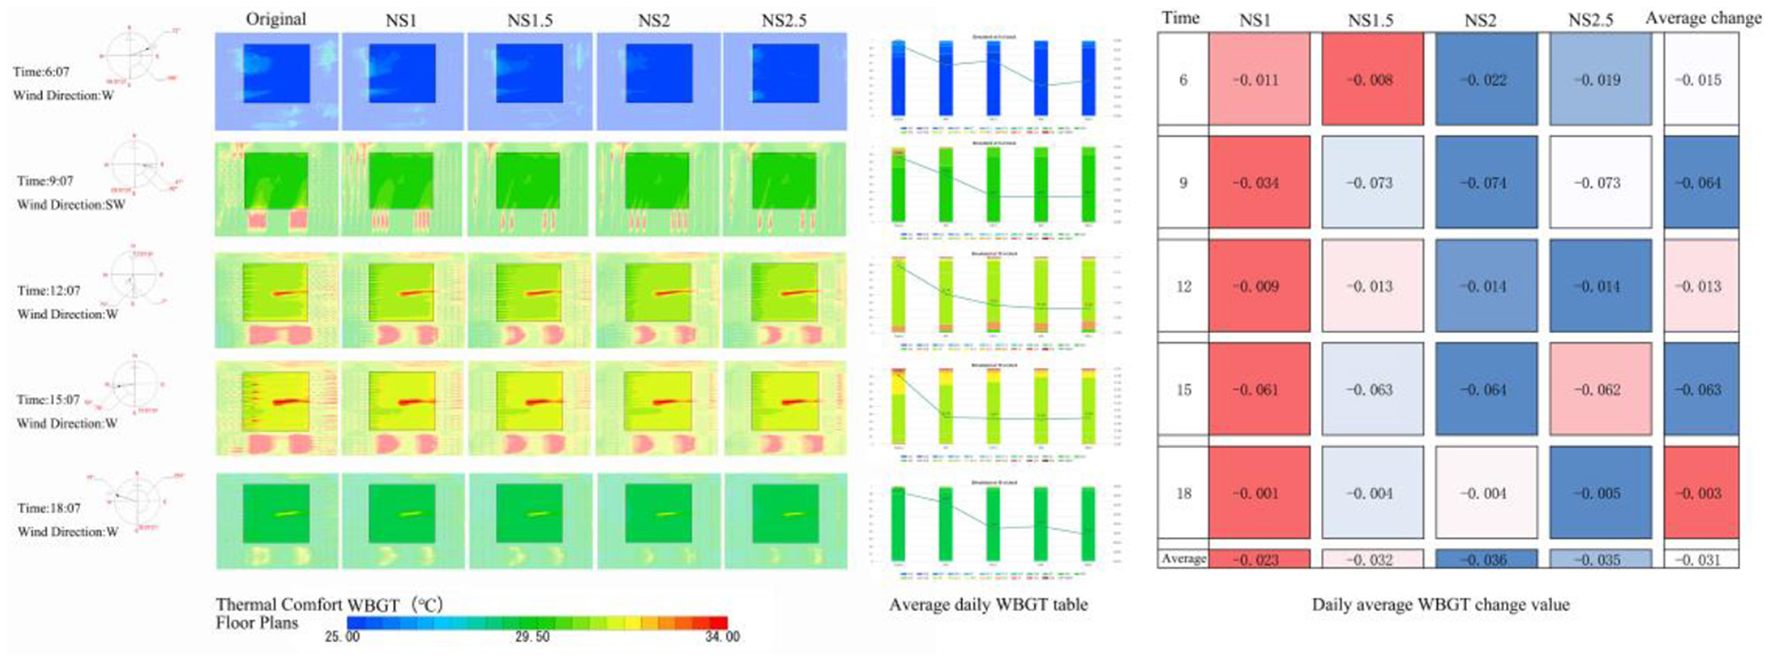
NS model WBGT floor plans and improvement changes.
3.2.3 L mode
SET*, WBGT thermal comfort plan, and the improvement of changes in Figures 13, 14, respectively, in L mode to improve the degree of thermal comfort of the square increases with the increase in plant spacing, and the degree of improvement in the optimal 2.5D. At intervals of 1, 1.5, 2, and 2.5D all increased the area of the square comfort area, the main improvement area for the southwest side of the square, the north side of the improvement is worse, and the northeast of the square is the worst improvement. the L mode except for the 6 points have improved the thermal comfort of the square, and at 6:00 h the best improvement is L2.5 (ΔSET* = 0.266°C, ΔWBGT = 0.229°C); at 9:00 h the best improvement is L2.5 (ΔSET*= 0.136°C, ΔWBGT =0.110°C); the best improvement at 12:00 h was L2.5 (ΔSET*= 0.414°C, ΔWBGT = 0.133°C); at 15:00 h the best improvement was L1 (ΔSET*= 0.222°C, ΔWBGT = 0.249°C); and the best improvement at 18:00 h was L2.5 (ΔSET*= 0.209°C, ΔWBGT = 0.01°C). The best improvement in thermal comfort throughout the day was achieved by L2.5 (ΔSET* = 0.243°C, ΔWBGT = 0.141°C). The average daily improvements, from largest to smallest, were L2.5, L2, L1.5, and L1, with average improvement of ΔSET* = 0.166°C and ΔWBGT = 0.122°C.
Figure 13
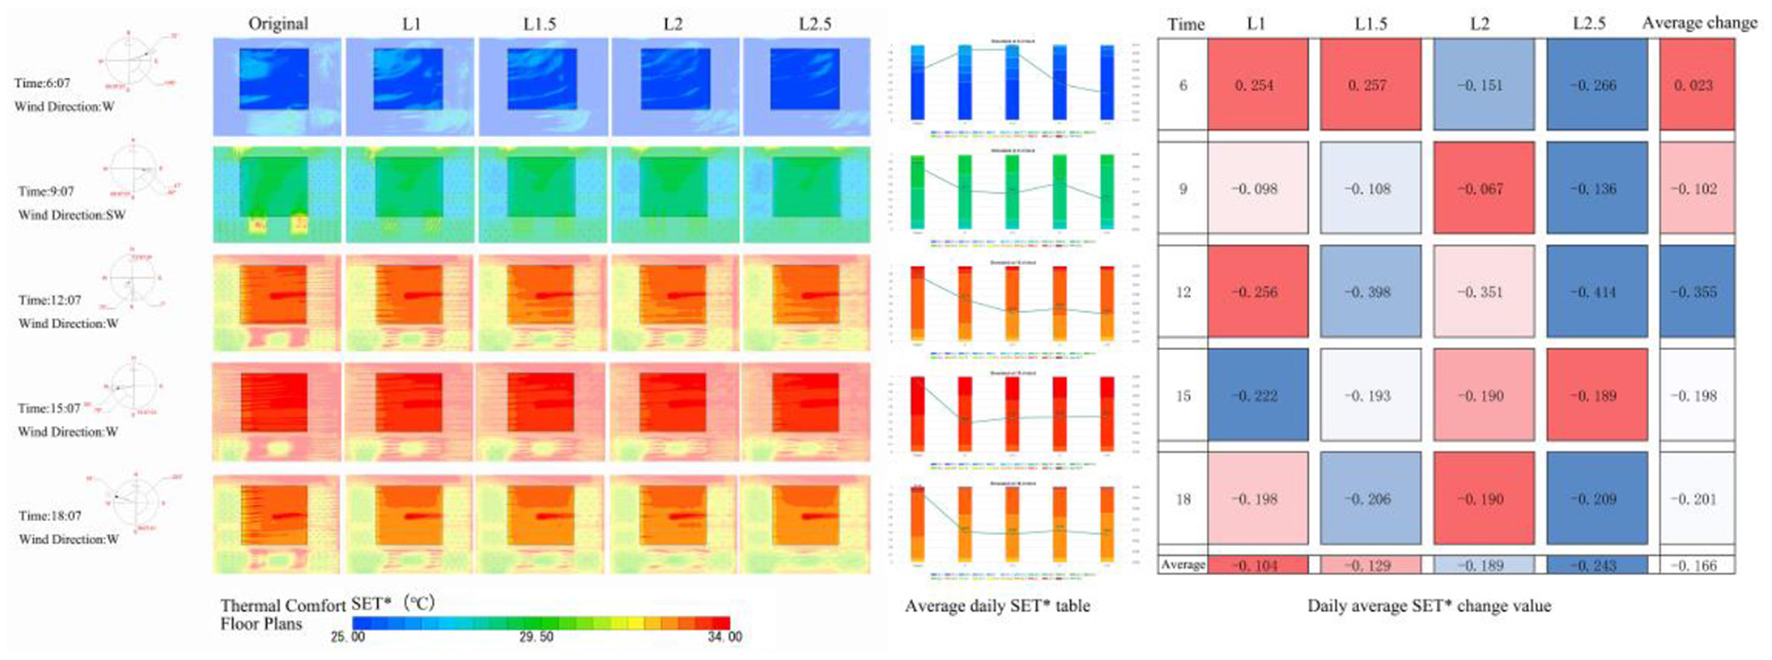
L model SET* floor plans and improvement changes.
Figure 14
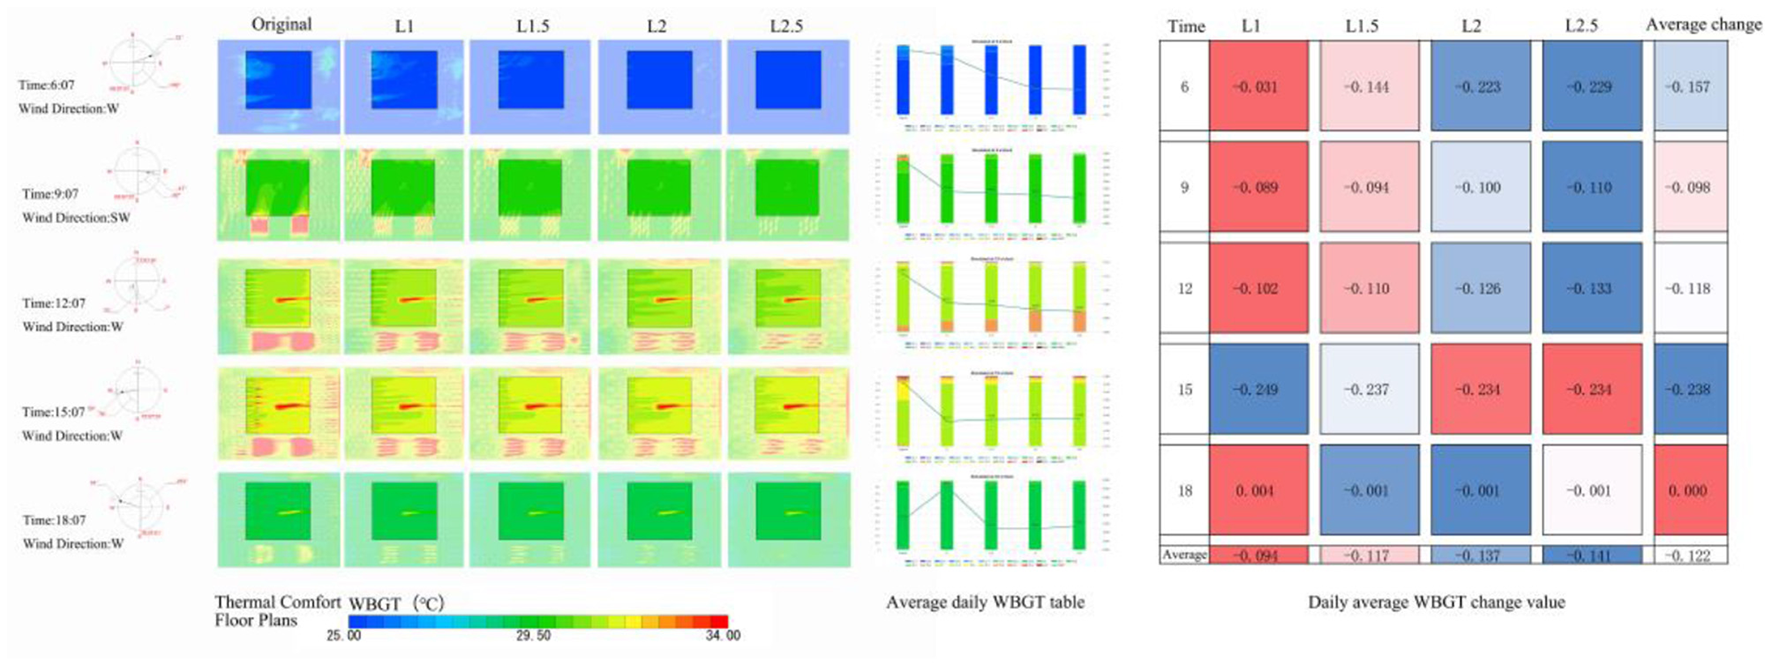
L model WBGT floor plans and improvement changes.
3.3 Relationship between planting spacing and planting direction
Combining the thermal comfort improvement values for each model (Figure 15), the thermal comfort improvement shows a trend of increasing and then decreasing with the increase of time, and the most significant thermal comfort improvement is at 12:00 and 15:00 h. The SET* improvement value for each mode is greater than WBGT. Due to the teaching building on the north side of the square, which blocks part of the air circulation, and the building absorbs and reflects thermal radiation, resulting in the thermal comfort on the north side of the square is smaller than that on the south side; the wind source at the microclimate conditions are good, the thermal comfort is better, and the degree of improvement on the west side is greater than that on the east side.
Figure 15
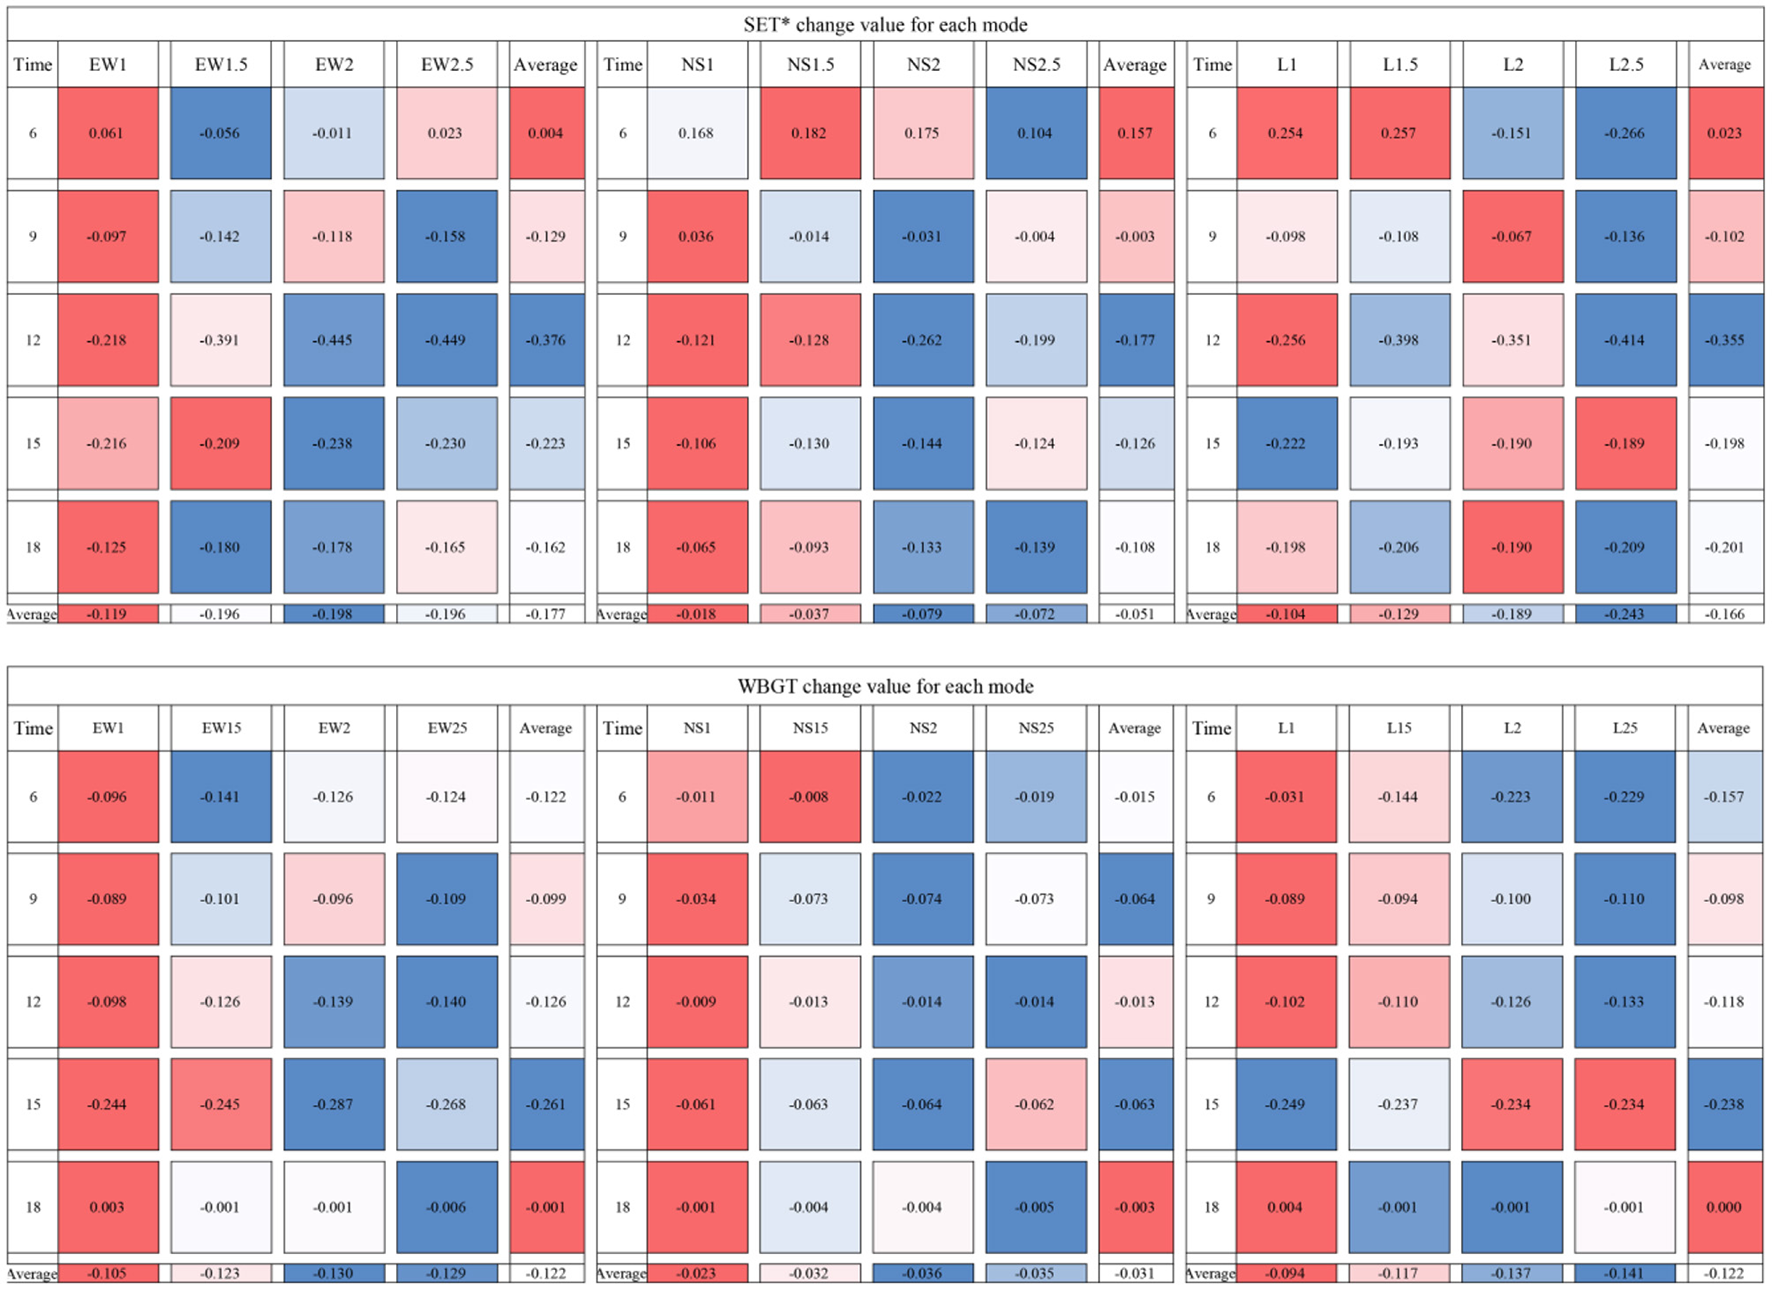
Combining the thermal comfort improvement values for each model.
The EW, NS and L modes all create an improved area in the south of the square in the EW direction; the EW mode has the best depth of improvement for the interior of the square, the L mode has a better degree of improvement, and the NS mode has the worst degree of improvement. When the planting spacing is less than or equal to 2D, EW mode has the best thermal comfort improvement effect, followed by L mode and NS mode is the worst; when the planting spacing is greater than 2D, L mode has the best improvement effect, followed by EW mode and NS mode is the worst. As the L layout mode can increase the density of plants to a certain extent, when used in 2.5D, a better thermal environment can be obtained under the condition of site ventilation, compared to the other two types of modes.
4 Discussion
This study reproduces the site plants through UAV point cloud modeling, with a more realistic physical form, which can more accurately simulate the current environment, and has a certain reference value for subsequent research in this field of accurate modeling. The simulation studies for the planting spacing and direction of a single tree can guide this type of square space, which is of scientific interest in the method of tree design and layout.
4.1 Ventilation corridor arrangement of trees under optimal thermal comfort
Several studies have shown that the setup of a ventilation corridor can guide the wind into the internal space of the site and improve the thermal comfort of the site (Gomaa et al., 2024; Zölch et al., 2019). And the distance of tree planting has an effect on the outdoor thermal environment (Yang et al., 2022). When planting trees, appropriate consideration of reserving ventilation corridors can help improve the thermal comfort of the core area of the square, and the best effect of improving the space of the site in the west and south sides of the dominant wind direction; the direction of the arrangement of the ventilation corridor should be based on the direction of the prevailing winds of the site as a reference, and the best effect is to plant parallel to the dominant wind direction, followed by the best effect at an angle of 45° with the wind direction, and the worst effect of the arrangement of the perpendicular wind direction.
4.2 Spacing arrangement of tree planting under optimal thermal comfort
Previous studies have shown that excessively dense planting leads to overlapping of tree canopies, which negatively affects the cooling efficiency of the trees and, consequently, does not contribute to improving the thermal comfort of the area (Sodoudi et al., 2018). In the simulation, increasing the distance between floors (intervals of 1, 1.5, 2, and 2.5D) showed positive effects on improving the thermal comfort of the space. 1.5 and 2D have the best effect on the space improvement, and the improvement effect of other modes except the L mode gradually decreases after being larger than 2.5D. In the simulation, the planting spacing is too wide to improve the thermal comfort of the space, so it is necessary to leave enough spacing between trees. In the actual design, too wide planting spacing is not conducive to the interpretation of the design concept and greening and beautification effect, although 2D planting spacing is the best layout form for improving thermal comfort in the design of the array of trees in the square, if the pursuit of the design effect can also be taken to improve the effect of thermal comfort better 1.5D spacing. In order to ensure the width of the ventilation corridor, attention also needs to be paid to the impact of plant coverage, and a 45° angle wind direction can increase the ventilation corridor while also increasing plant coverage, thus improving the thermal comfort in the square.
4.3 Optimization of arbor layout from the perspective of thermal comfort
The consideration of a ventilation corridor in the layout of trees can make the cooling range of plants the largest, which is conducive to the cooling of the square center, and also takes away the hot air generated by the hard pavement. When the width of the ventilation corridor exceeds 2D, the influence of plant cover on the thermal comfort of the square space increases. Combined with the above conclusions, the strategies for improving the summer thermal comfort in the study area are as follows (Figure 16): (1) Create a wind corridor pattern parallel to the prevailing wind direction or at an angle of 45°; Combined with the simulation results above, the current EW wind corridor is reduced by the regular reduction of north-south trees to form a wind corridor arrangement at an angle of 45° to the prevailing wind direction. (2) Reduce the density of the planting spacing of 1.5–2D; Since the current tree planting is too dense, it can form a corridor arrangement at an angle of 45° to the prevailing wind direction. In the current situation, the trees are planted too densely, and some of the trees are in bad condition and dead. Reduced planting density can allow better growth space and competitive advantage among trees, and at the same time combined with the above simulation results in the current layout on the basis of the removal of some of the trees with bad upward trend, and the regular reduction of local trees, so that the overall density of the tree layout is controlled at a planting spacing of 1.5–2D crowns, to provide the optimal spatial layout for the thermal comfort of the square by the trees themselves.
Figure 16
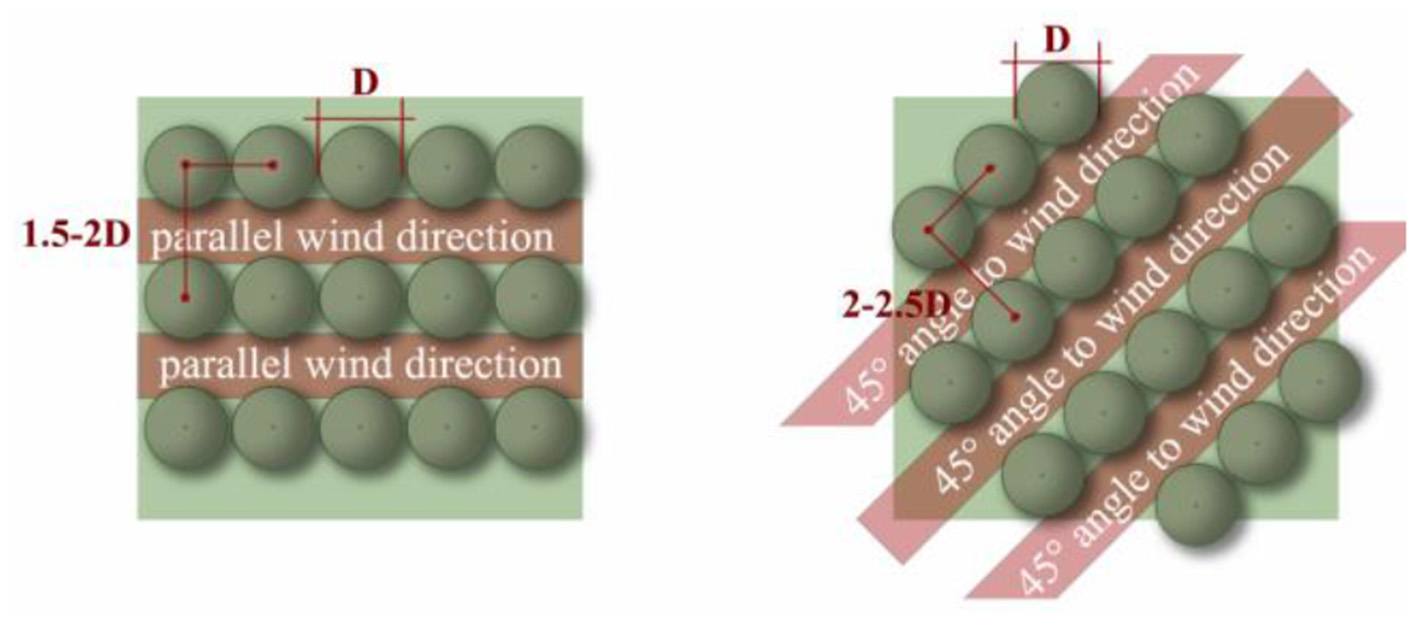
Vegetation optimization program.
5 Conclusion
In this study, the optimization method of tree layout based on thermal environment simulation can provide a scientific basis and precise design tool for microclimate regulation in urban public space, which is meaningful to break through the empirical limitations of traditional landscape design by quantitatively analyzing the impact of vegetation layout on thermal comfort, effectively mitigating the urban heat island effect, and reducing the threat of extreme high temperature on human health and activity quality. By combining point cloud modeling and CFD simulation, the methodology provides urban planners with actionable optimization strategies to improve thermal comfort, reduce energy dependence, and enhance urban resilience in hard-paved areas during the summer.
UAV point cloud modeling can accurately characterize the physical form of vegetation and significantly improve the accuracy of thermal comfort simulations. Through the simulation of the study area, the spatial thermal comfort of this type of urban square was concluded as follows: (1) For this study type of urban square, its spatial thermal comfort is more affected by factors such as tree planting spacing, crown width, and arrangement direction, etc.; (2) Under the guarantee of a particular form of tree layout remains unchanged, the planting direction is arranged at an angle of 45° to the dominant wind direction with the best effect of improving the thermal environment; (3) Under the condition of ensuring the layout direction is unchanged, the wind corridor width when the tree spacing is 1.5–2 times the crown width has the best effect on the improvement of the thermal environment in space; (4) During the high temperature period in summer (12:00 and 15:00 h), the pattern of planting trees with a spacing of 2.5 times the crown and parallel to the dominant wind direction has the best effect on the improvement of the thermal comfort of the site; (5) The wind source of the site, which is at the west side of the square, is the region with the most profound impact on the depth of the thermal comfort of a variety of simulation forms. Open space and activity space can be increased and arranged in this part appropriately; and (6) Combined with the simulation results of this study, it can also be concluded that the microclimate improvement in winter can be increased appropriately by arranging evergreen trees in the dominant wind direction, which can block the depth of the wind flow and improve the comfort level of the site in winter.
This study focuses on the influence of the physical characteristics and arrangement of trees on thermal comfort, and some studies have shown that the size of the tree canopy has a greater impact on the thermal environment in hot weather (Liu et al., 2021). The understory space was set as the soil in the simulation, and the effect of the lawn under the trees on the microclimate was not taken into account, despite several studies have shown that the lawn has a negligible impact on the overall thermal comfort (Xiaogang et al., 2024; Wenna et al., 2019). The reconstruction of the tree canopy was only for the refinement of the outer epidermis of the canopy, but not for the spatial reconstruction of the branches and leaves within the canopy. For the sake of uniformity and standardization, the point cloud data of a single tree shape on the site were used to establish the model, which may be suitable for the diversified plant growth status. However, the data and results of the simulation are still of a certain degree of credibility. The simulation experiment was only carried out in summer; for winter, this study can only speculate on the planting orientation of evergreen trees in winter to improve the microclimate of the site. The plant spatial layout form of the simulation requires further study in the future.
Although the effect of plants on the thermal environment of the square under extreme weather was small in this experiment, the results of the study can still provide a scientific basis and quantitative guidance for the optimization of the microclimate of urban public space. By clarifying the relationship between tree layout direction, spacing, and canopy width, thermal comfort during the hot summer hours can be significantly improved, and the urban heat island effect can be reduced, thereby improving the residents' outdoor activity experiences and reducing energy consumption. The results are not only applicable to campus squares but can also be extended to urban parks, commercial streets, and other hard-paved areas, providing key technical support for the construction of resilient cities and helping to realize the “dual-carbon” goal and sustainable development. In the future, the study can further combine dynamic climate data and multitree parameters to build a more adaptable optimization model, while exploring strategies to improve the microclimate in winter to form a comprehensive control program throughout the year. Its role is not only to enhance the residents' experience of using outdoor space and promote ecological and functional balance, but also to help the construction of low-carbon cities through scientific layout, providing a practical model for the global response to climate change and the design of sustainable human settlements.
Statements
Data availability statement
The original contributions presented in the study are included in the article/supplementary material, further inquiries can be directed to the corresponding author.
Author contributions
FL: Data curation, Formal analysis, Investigation, Project administration, Software, Supervision, Writing – original draft, Writing – review & editing. CG: Conceptualization, Data curation, Investigation, Methodology, Software, Validation, Visualization, Writing – original draft. DW: Conceptualization, Data curation, Resources, Validation, Visualization, Writing – review & editing. YL: Formal analysis, Supervision, Writing – review & editing.
Funding
The author(s) declare that financial support was received for the research and/or publication of this article. This work was funded by the Tianjin Education Commission Research Program Project under grant number 2022SK088.
Conflict of interest
The authors declare that the research was conducted in the absence of any commercial or financial relationships that could be construed as a potential conflict of interest.
Generative AI statement
The author(s) declare that no Gen AI was used in the creation of this manuscript.
Correction note
This article has been corrected with minor changes. These changes do not impact the scientific content of the article.
Publisher’s note
All claims expressed in this article are solely those of the authors and do not necessarily represent those of their affiliated organizations, or those of the publisher, the editors and the reviewers. Any product that may be evaluated in this article, or claim that may be made by its manufacturer, is not guaranteed or endorsed by the publisher.
References
1
Asawa T. Fujiwara K. Hoyano A. Shimizu K. (2016). Convective heat transfer coefficient of crown of Zelkova Serrata. J. Environ. Eng.81, 235–245. 10.3130/aije.81.235
2
Bournez E. Landes T. Najjar G. Kastendeuch P. Ngao J. Saudreau M. (2019). Sensitivity of simulated light interception and tree transpiration to the level of detail of 3D tree reconstructions. Urban For. Urban Green.38, 1–10. 10.1016/j.ufug.2018.10.016
3
Djekic J. Djukic A. Vukmirovic M. Djekic P. Brankovic M. D. (2018). Thermal comfort of pedestrian spaces and the influence of pavement materials on warming up during summer. Energy Build159, 474–485. 10.1016/j.enbuild.2017.11.004
4
Gagge A. P. Stolwijk J. A. J. Nishi Y. (1971). An effective temperature scale based on a simple model of human physiological regulatory response. ASHRAE Trans.77, 21–36.
5
Gomaa M. M. El Menshawy A. Nabil J. Ragab A. (2024). Investigating the impact of various vegetation scenarios on outdoor thermal comfort in low-density residential areas of hot arid regions. Sustainability16:3995. 10.3390/su16103995
6
Guo F. Guo R. Zhang H. Dong J. Zhao J. (2023). A canopy shading-based approach to heat exposure risk mitigation in small squares. Urban Clim.49:101495. 10.1016/j.uclim.2023.101495
7
Hao T. Zhao Q. Huang J. (2023). Optimization of tree locations to reduce human heat stress in an urban park. Urban For. Urban Green.86:128017. 10.1016/j.ufug.2023.128017
8
Janoutová R. Homolová L. Hanuš J. Malenovský Z. Lauret N. Gastellu-Etchegorry J. P. (2019). Influence of 3D spruce tree representation on accuracy of airborne and satellite forest reflectance simulated in DART. Forests10:292. 10.3390/f10030292
9
Kariminia S. Sh. Ahmad S. Saberi A. (2015). Microclimatic conditions of an urban square: role of built environment and geometry. Procedia Soc. Behav. Sci.170, 718–727. 10.1016/j.sbspro.2015.01.074
10
Lai D. Liu W. Gan T. Liu K. Chen Q. (2019). A review of mitigating strategies to improve the thermal environment and thermal comfort in urban outdoor spaces. Sci. Total Environ.661, 337–353. 10.1016/j.scitotenv.2019.01.062
11
Lee H. Mayer H. Chen L. (2016). Contribution of trees and grasslands to the mitigation of human heat stress in a residential district of Freiburg, Southwest Germany. Landsc. Urban Plan.148, 37–50. 10.1016/j.landurbplan.2015.12.004
12
Lijuan J. Yatian C. Weijin C. Changguang W. U. (2022). Field observation and analysis on effects of greening form and its plant landscape characteristics on thermal environment in square. Build. Sci.38, 52–58. 10.13614/j.cnki.11-1962/tu.2022.06.08
13
Lin B. (2004). Studies of Greening's Effects on Outdoor Thermal Environment [dissertation/master's thesis]. Tsinghua University.
14
Liu S. Dr Zhao J. Xu M. Ahmadian E. (2021). Effects of landscape patterns on the summer microclimate and human comfort in urban squares in China. Sustain. Cities Soc.73:103099. 10.1016/j.scs.2021.103099
15
Ma C. Gao W. Liu B. Chen Y. (2023). Optimization of landscape spatial configuration and form for thermal comfort: a case study of urban square, Shanghai. Atmosphere14:1357. 10.3390/atmos14091357
16
Morakinyo T. E. Kong L. Lau K. K. Yuan C. Ng E. (2017). A study on the impact of shadow-cast and tree species on in-canyon and neighborhood's thermal comfort. Build Environ.115, 1–17. 10.1016/j.buildenv.2017.01.005
17
Morille B. Migeon C. Bournet P. E. (2013). Is the penman–monteith model adapted to predict crop transpiration under greenhouse conditions? Application to a New Guinea Impatiens crop. Sci. Hortic.152, 80–91. 10.1016/j.scienta.2013.01.010
18
Shi C. Xiangyu L. I. Xiaohan Z. Ruijun W. (2022). Preliminary study on microclimate analysis methods of small landscape spaces based on three-dimensional vegetation point cloud data—taking mei'an of southeast university as an example. Chin. Landsc. Archit.38, 98–103. 10.19775/j.cla.2022.12.0098
19
Simon H. (2016). Modeling Urban Microclimate: Development, Implementation and Evaluation of New and Improved Calculation Methods for the Urban Microclimate Model ENVI-met. Rheinland-Pfalz: Johannes Gutenberg-Universitt Mainz.
20
Sodoudi S. Zhang H. Chi X. Müller F. Li H. (2018). The influence of spatial configuration of green areas on microclimate and thermal comfort. Urban For. Urban Green.34, 85–96. 10.1016/j.ufug.2018.06.002
21
Speak A. Montagnani L. Wellstein C. Zerbe S. (2020). The influence of tree traits on urban ground surface shade cooling. Landsc. Urban Plan.197:103748. 10.1016/j.landurbplan.2020.103748
22
Stocco S. Cantón M. A. Correa E. (2021). Evaluation of design schemes for urban squares in arid climate cities, Mendoza, Argentina. Build Simul.14, 763–777. 10.1007/s12273-020-0691-5
23
Stocco S. Cantón M. A. Correa E. N. (2015). Design of urban green square in dry areas: thermal performance and comfort. Urban For. Urban Green.14, 323–335. 10.1016/j.ufug.2015.03.001
24
Syafii N. I. Ichinose M. Kumakura E. Jusuf S. K. Chigusa K. Wong N. H. (2017). Thermal environment assessment around bodies of water in urban canyons: a scale model study. Sustain. Cities Soc.34, 79–89. 10.1016/j.scs.2017.06.012
25
Toparlar Y. Blocken B. Maiheu B. van Heijst G. J. F. (2017). A review on the CFD analysis of urban microclimate. Renew. Sustain. Energy Rev.80, 1613–1640. 10.1016/j.rser.2017.05.248
26
Wang S. H. Sun C. Y. Huang L. Xu X. L. Shi H. D. Han D. R. et al . (2024). Impacts of urban green spaces structure on summer urban thermal environment. Acta Ecol. Sin.44, 11163–11176. 10.20103/j.stxb.202403130517
27
Wang W. W. Fei-Nan L. I. Wang D. Wang Q. (2019). Urban ventilation corridor construction based on ventilation potential and quantitative analysis of wind characteristics. J. Zhejiang Univ. 53, 470–481. 10.3785/j.issn.1008-973X.2019.03.008
28
Wenna J. Yanwen W. U. Zhendong L. E. I. (2019). Analysis of planting demand and form of residential houses in the Loess Plateau. Chin. Landsc. Archit.35, 17–22. 10.3969/j.issn.1000-6664.2019.01.004
29
Xi T. Y. Li Q. Mochida A. Meng Q. L. (2012). Study on the outdoor thermal environment and thermal comfort around campus clusters in subtropical urban areas. Build. Environ. 52, 162–170. 10.1016/j.buildenv.2011.11.006
30
Xiaogang F. Yongquan Y. Meng L. I. Zaihui Z. Fengxia L. I. Yuan W. et al . (2024). Study on the impact of multi-mode combined residential green space on thermal environment. J. Xi'an Univ. Archit. Technol.56, 113–119+158. 10.15986/j.1006-7930.2024.01.014
31
Xiaoyan Z. Zhang Guanheng Y. (2021). Planting strategies of road plant landscape in xiamen island based on fluent simulation of wind environment. J. Chin. Urban For.19, 78–84. 10.12169/zgcsly.2019.11.28.0001
32
Xu H. Wang C. C. Shen X. Zlatanova S. (2021). 3D Tree reconstruction in support of urban microclimate simulation: a comprehensive literature review. Buildings11:417. 10.3390/buildings11090417
33
Xue H. Tang H. Yanming L. I. Xinyu L. I. Guo J. Jun M. A. (2018). Regulation service of main greening tree species in Beijing. J. Beijing Norm. Univ.54, 517–524. 10.16360/j.cnki.jbnuns.2018.04.015
34
Yang J. Zhao Y. Zou Y. Xia D. Liu W. Ji K. et al . (2022). Effects of tree species and layout on the outdoor thermal environment of squares in hot-humid areas of China. Buildings12:1867. 10.3390/buildings12111867
35
Yang L. Liu X. Qian F. (2020). Research on water thermal effect on surrounding environment in summer. Energy Build.207:109613. 10.1016/j.enbuild.2019.109613
36
Yi-jia Y. Qi-hang C. Rui Z. Miao S. Li-qi C. Fei L. et al . (2021). Transpiration characteristics and temperature and humidity benefits of common greening tree species in Beijing. J. Northwest For. Univ.36:31–36+76. 10.3969/j.issn.1001-7461.2021.01.05
37
Yingchun W. Guoqing G. Zuyu T. (2003). Climatic characteristics of estival muggy weather in Beijing related to 2008 olympics. Meteorol. Mon.2003:23–27+33.
38
Yu H. Fukuda H. Zhou M. Ma X. (2022). Improvement strategies for microclimate and thermal comfort for urban squares: a case of a cold climate area in China. Buildings12:944. 10.3390/buildings12070944
39
Zhengnong L. I. Shibin Y. U. Honghua W. U. Lifen Z. (2021). Numerical simulation of flow field around the tree in strong wind. J. Cent. South Univ.52, 3970–3980. 10.11817/j.issn.1672-7207.2021.11.018
40
Zölch T. Rahman M. A. Pfleiderer E. Wagner G. Pauleit S. (2019). Designing public squares with green infrastructure to optimize human thermal comfort. Build Environ.149, 640–654. 10.1016/j.buildenv.2018.12.051
Summary
Keywords
urban microclimate, thermal comfort, plant arrangement, CFD simulation, modeling point cloud
Citation
Li F, Ge C, Wei D and Liu Y (2025) Research on the optimal layout form and optimization of trees in the main square of an urban campus based on thermal environment simulation. Front. Sustain. Cities 7:1544249. doi: 10.3389/frsc.2025.1544249
Received
20 December 2024
Accepted
17 June 2025
Published
16 July 2025
Corrected
17 July 2025
Volume
7 - 2025
Edited by
Peng Fu, Louisiana State University, United States
Reviewed by
Raffaele Cucuzza, Polytechnic University of Turin, Italy
Leticia Bonilla, National Institute of Forestry and Agricultural Research (INIFAP), Mexico
Updates
Copyright
© 2025 Li, Ge, Wei and Liu.
This is an open-access article distributed under the terms of the Creative Commons Attribution License (CC BY). The use, distribution or reproduction in other forums is permitted, provided the original author(s) and the copyright owner(s) are credited and that the original publication in this journal is cited, in accordance with accepted academic practice. No use, distribution or reproduction is permitted which does not comply with these terms.
*Correspondence: Dongxue Wei weidongxue@tcu.edu.cn
Disclaimer
All claims expressed in this article are solely those of the authors and do not necessarily represent those of their affiliated organizations, or those of the publisher, the editors and the reviewers. Any product that may be evaluated in this article or claim that may be made by its manufacturer is not guaranteed or endorsed by the publisher.