Abstract
Introduction:
Wireless Sensor Networks (WSNs) play a critical role in the development of sustainable and intelligent smart city infrastructures, enabling data-driven services such as smart mobility, environmental monitoring, and public safety. As these networks evolve under 6G connectivity frameworks, their increasing reliance on heterogeneous communication protocols and decentralized architectures exposes them to sophisticated cyber threats. To secure 6G-enabled WSNs, robust and efficient anomaly detection mechanisms are essential, especially for resource-constrained environments.
Methods:
This paper proposes and evaluates a multi-deep learning intrusion detection framework optimized to secure WSNs in 6G-driven smart cities. The model integrates a Transformer-based encoder, Convolutional Neural Networks (CNNs), and Variational Autoencoder-Long Short-Term Memory (VAE-LSTM) networks to enhance anomaly detection capabilities. This hybrid approach captures spatial, temporal, and contextual patterns in network traffic, improving detection accuracy against botnets, denial-of-service (DoS) attacks, and reconnaissance threats.
Results and discussion:
To validate the proposed framework, we employ the Kitsune and 5G-NIDD datasets, which provide intrusion detection scenarios relevant to IoT-based and non-IP traffic environments. Our model achieves an accuracy of 99.83% on the Kitsune and 99.27% on the 5G-NIDD dataset, demonstrating its effectiveness in identifying malicious activities in low-latency WSN infrastructures. By integrating advanced AI-driven security measures, this work contributes to the development of resilient and sustainable smart city ecosystems under future 6G paradigms.
1 Introduction
Serving as a digital backbone, Wireless Sensor Networks (WSNs) are foundational to smart city infrastructures by enabling intelligent automation, urban data collection, and real-time decision-making for applications such as environmental sensing, public safety, transportation, and smart energy systems (Sharma et al., 2024). These WSNs play a vital role in advancing liveable and sustainable urban environments through data-driven operations. The integration of WSNs into the 6G communication environments offers unprecedented opportunities for urban connectivity, facilitating ultra-reliable low-latency communication (URLLC), massive machine-type communications (mMTC), and artificial intelligence (AI)-driven security mechanisms (Alhammadi et al., 2024). 6G communication networks are targeted to be “Intelligent Networks of Everything”, providing ultra-high speed, capacity, integrated AI/ML across core and edge layers. It's expected to pose as a universal Internet of Everything (IoE) connecting sensors, devices and machines with enhanced functionalities in applications such as computing, sensing, positioning, and energy management (Pennanen et al., 2024).
However, as WSN deployments scale up under 6G frameworks, their exposure to cyber threats increases significantly due to heterogeneous communication protocols, dynamic node topologies, AI-driven breaches, adversarial attacks on AI model, and resource-constrained device architectures (Rifa-Pous et al., 2024; Suomalainen et al., 2025). A critical challenge that still exists in the realization of smart cities, is the security of 6G-enabled WSNs. The traditional intrusion detection systems don't work efficiently on WSNs, because WSNs, unlike traditional networks, rely on non-IP communication. The communication models that WSNs use are usually low-power wide-area networks (LPWANs) and time-sensitive networking (TSN), which require intelligent security solutions (Ali et al., 2020). A wide variety of cyberattacks can target WSNs including but not limited to reconnaissance-based intrusions, and denial-of-service (DoS) attacks (Zhang et al., 2021). These sophisticated attacks require modern AI-based intrusion detection solutions which, in addition to efficiently detecting intrusions, should also be efficient and computationally less expensive.
Commercial 6G networks are expected to launch around 2030, with standardization beginning in 2025. Key advancements include computing, sensing, energy management, wireless power transfer, indoor optical free-space communication, and energy harvesting (Pennanen et al., 2024; David and Berndt, 2018). 6G will transform sectors with technologies like AI, IoT, flying vehicles, non-terrestrial networks, immersive XR, holographic telepresence, autonomous systems, blockchain, and distributed ledgers (Shahraki et al., 2021; Tripi et al., 2024; You et al., 2024; Sharma et al., 2023). Core technologies under exploration include ultra-massive MIMO, terahertz communication, millimeter waves, beamforming, intelligent surfaces, quantum communication, UAVs, and satellite communication (Chataut et al., 2024).
AI is also expected to rule the area of anomaly and intrusion detection and holds its application in areas including AI risk control, financial monitoring, system security, and regulatory compliance (Chataut et al., 2024). In addition to these attacks, the most significant challenge is the detection of zero-day attacks in 6G networks. There are two types of intrusion detection systems (IDS), i.e., signature-based and anomaly-based. The signature-based IDS are usually not accurate for zer-day attacks and 6 Networks, mostly due to their complex nature. The anomaly-based IDS are usually preferred in these cases.
1.1 6G-driven WSN security and smart city applications
6G wireless technology in conjunction with WSNs is expected to revolutionize smart city infrastructures. The 6G technology boasts ultra-fast communication, efficient real-time data transfers, along with being highly reliable. These characteristics make them highly preferable in areas of intelligent transportation systems, environmental monitoring, and public safety (Murroni et al., 2023). Despite these advancements, the 6G-enabled WSNs pose critical security challenges. The nature of these networks having multiple interconnected devices call for advanced and highly secure security solutions, especially the AI-driven security protocols to detect and resolve sophisticated cyber-threats (Rifa-Pous et al., 2024).
In addition, the distributed nature of 6G networks along with their heterogeneity demand security solutions that are adaptive and scalable. The technologies such as AI-bases IDS and/or Blockchain-based technologist can result in improved data integrity and trust in various smart city applications (Singh et al., 2023). All these challenges, require efficient AI-based IDS for 6G-driven WSNs for efficiently protecting the future applications of smart cities against emerging threats (Kulkarni and Kulkarni, 2021).
1.2 Key contributions
To tackle these challenges, this paper presents a novel multi-deep learning intrusion detection framework tailored for securing WSNs in 6G-driven smart cities. The proposed model integrates three key deep learning architectures: (1) Transformer-Based Encoder, which captures long-range dependencies and contextual relationships in sensor network traffic, (2) Convolutional Neural Networks (CNNs), which extract spatial features from network traffic patterns for anomaly detection, (3) Variational Autoencoder-Long Short-Term Memory (VAE-LSTM), which models temporal dependencies to detect abnormal behavior over time. This hybrid approach enables enhanced detection of cyber threats affecting smart city WSNs while ensuring computational efficiency suitable for low-power sensor nodes.
Following stated are the main contributions that this paper offers are:
-
Security enhancement for 6G-enabled WSNs: this study proposes an advanced intrusion detection framework tailored for securing WSNs in 6G-driven smart city environments.
-
Hybrid deep learning architecture: a novel deep learning-based intrusion detection model is developed by integrating Transformer encoders, Convolutional Neural Networks (CNNs), and Variational Autoencoder-Long Short-Term Memory (VAE-LSTM) networks to improve anomaly detection accuracy and computational efficiency.
-
WSN security validation using IoT and Non-IP-Based datasets: the model is validated using the Kitsune dataset, which captures IoT-based network anomalies, and the 5G-NIDD dataset, which represents non-IP-based intrusion scenarios, demonstrating relevance to 6G-enabled WSN security.
-
Hyperparameter tuning and performance evaluation: random search hyperparameter turning used for model optimization and to improve the accuracy and reliability of the proposed model, while evaluation of its effectiveness was further supported by reliability parameters such as Matthews Correlation Coefficient (MCC) and Cohen's Kappa and by key performance metrics such as accuracy and F1 score.
-
Detecting zero day attacks: detecting known and zero-day cyber threats with a high degree of accuracy, minimum false positives and improving data integrity by an AI adaptive method in the current dynamic threat in a 6G-driven smart city environment.
The following is the article's structure: a survey of related literature is covered in Section 2, the approach is presented in Section 3, the architecture of the suggested model is explained in Section 4, performance evaluation is discussed in Section 5, experimental findings are presented in Section 6, and Section 7 brings the study to a close and makes recommendations for further research.
2 Literature review
A wide range research in recent literature investigates security challenges in 6G networks and discuss obstacles to implementing the suggested solutions. Saeed et al. (2023) developed a robust framework for anomaly detection within 6G networks, leveraging ensemble learning (EL) for high-accuracy threat detection across various datasets NSL_KDD, UNSW_NB2015, CIC_IDS2017, CICDDOS2019, achieving accuracy rates up to 99.9% and minimal false alarms. Random forests and support vector machines are used in this approach to combining ensemble approaches with feature selection, improving detection capabilities for both multiclass and binary-class classifications. Their findings emphasize the demand for advanced, AI-driven anomaly detection systems to support future networked environments characterized by high-throughput, low-latency applications, underscoring the increasing significance of hybrid ML methods in modern cybersecurity
In this paper, Ankita and Rani (2021) points out the significance of privacy and security in 5G and 6G networks, focusing on detecting malware and ransomware attacks using machine learning and deep learning. ML and DL classifiers were compared, with the Bayesian Network achieving 99.83% accuracy in ML and the Generative Adversarial Network (GAN) attaining 98.9% in DL, suggesting DL offers better security for future networks.
This research paper Oleiwi et al. (2023) proposes a meta-model using ensemble machine learning for intrusion detection in 6G wireless networks, designed to enhance security against evolving, intelligent attacks. The model uses four datasets (NSL KDD, UNSW NB15, CIC IDS17, and SCI CIC IDS18), applying preprocessing and feature selection (chi-square) to reduce the dimensionality of the data. The meta-model combines classifiers random forest, AdaBoost, Gradient boost, XGBoost, CATBoost, and LightGBM with a decision tree as a voting classifier, optimizing performance by selecting the best-predicted results. Experimental findings outperform conventional intrusion detection systems with outstanding accuracy 99% and minimal false alarm rates in both multi and binary-class detection. Alsubai et al. (2024) proposed a deep learning and optimization based anomaly detection model for 6G networks. This article focuses on the security threats in 6G networks. The framework used a multiscale convolutional auto encoder with different kernel sizes for feature extraction and tuna swarm optimization for feature selection. Using the Kitsune dataset for the training model, the model achieves 97.50% accuracy, 94.81% precision, and a 93.50% F1-score, which improves 6G network security by detecting anomalies and low latency. However, the model's performance can be improved by using different approaches.
A UAV-integrated collaborative intrusion detection and prevention system for 6G networks is introduced by the authors in Hadi et al. (2024). This CIDPS system tackles the security challenges posed by UAVs, which function as airborne sensing and communication nodes in 6G networks. Instead of relying on single-layer approaches like traditional IDS models, this study adopts a fusion multi-tier DNN framework to improve accuracy and minimize latency. The system uses complementary features to detect complex intrusion patterns effectively, even on imbalanced data, and incorporates real-time response protocols to neutralize detected attacks. The model was validated on multiple datasets (NF-UQ-NIDS-v2, 5G-NIDD, UAVIDS-2020,) and tested on actual UAV devices, achieving an attack classification accuracy of 99.25% and outperforming existing detection efficiency and resource optimization methods. This paper proved to be an efficient soution in protecting UAV-integrated 6G networks. Simialrly, the authors in Gupta et al. (2023) proposed a deep learning model for cyberattack detection in 6G wireless networks, targeting threats like probe, DoS, and Sybil attacks. The model was built using PyTorch and evaluated on the KDD Cup dataset the model achieves 94% accuracy which validates its capability to handle changing attack behaviors. The architecture, based on a modified VGG model, processes 64 × 64 heatmap images for feature extraction and classification.
Moreover, an intelligent breach detection system has been present in Chinnasamy et al. (2024). This AI-based IDS focuses on the intrusion detection in 6G-enabled smart grid networks. By incorporating the Grey Wolf algorithm with artificial neural networks, the GWAANN model is utilized to optimize cyber intrusion detection, the deep learning model was Tested on the CICIDS2017 dataset, GWAANN outperformed traditional methods like SVM and KNN in accuracy, precision, recall, and F-score, proving more effective at identifying and mitigating threats in real-time. as cyber risks evolve in the 6G era, this approach serves as a key measure to secure modern smart grid networks. An unsupervised deep learning framework is developed in this research paper (Paolini et al., 2023), integrating a convolutional autoencoder and a Gaussian Mixture Model to analyze traffic flow. Using the CIC-IDS 2017 dataset, the model achieved high detection accuracy at 6G base stations, with F1-scores of 97.3% for DoS Hulk and 92.2% for DoS Goldeneye attacks. The paper demonstrates how unsupervised learning improves the accuracy of threat detection.The article (Rana et al., 2022) compares four IDS methods for identifying cyber attacks within cloud computing. It employs two datasets, UNSW-NB15 and NSL-KDD, and compares FCM-SVM, SVM-ANN, FCM-ANN, and SMO-ANN models in terms of accuracy, precision, detection rate, F1-score, and false positive rate. Results indicate that UNSW-NB15 is best perform by FCM-SVM, while NSL-KDD is best addressed by SVM-ANN.
3 Methodology
3.1 Datasets
The proposed model was evaluated using the Kitsune (Mirsky et al., 2018) and 5G Network Intrusion Detection and Defence (5G-NIDD) (Samarakoon et al., 2022) datasets. These datasets serve as relevant benchmarks for assessing intrusion detection in 6G-enabled Wireless Sensor Networks (WSNs) deployed in smart city environments.
3.1.1 5G-NIDD dataset
The 5G-NIDD dataset was chosen for its recent release, comprehensive variety of attack types, and real 5G network traffic captured with actual devices in a 5G test network. A 6G dataset would have been ideal, none is currently available. The data collection process was conducted in a controlled 5G test environment using the 5G Test Network (5GTN) at the University of Oulu, incorporating Nokia Flexi Zone Indoor Pico Base Stations and a Dell N1524 switch for network connectivity. Benign living traffic was simulated through the use of real mobile devices doing web browsing, streaming, and SSH communications and interacting with various device applications in the background in order to mimic real network behaviors. Attack traffic was generated by several Raspberry Pi 4 Model B machines running Ubuntu OS with an installation of some open-source penetration testing tools that performed ICMP Flood, UDP Flood, SYN Flood, and HTTP Flood attacks. Traffic was collected on a dedicated Data Collection PC, thus ensuring the segmentation of traffic based on protocol types and attack categories.The data were captured in pcap format, with attack sessions of between 10 and 30 min duration, depending on the type of attack. After collection, the generated data underwent some primary preprocessing steps, including packet filtering, feature extraction, and labeling. The dataset is fully labeled, containing both malicious and benign traffic with a total of 1,215,890 network flows, each classified as either benign or associated with a specific attack type. This dataset comprises various types of attacks including “SYN” Flood, “UDP” Scan, “TCP” Connect, HTTP, ICMP, DDoS, and slow rate DoS, in addition to port scanning vulnerabilities like TCP Connect Scan, SYN Scan, and UDP Scan, as demonstrated in Table 1. The dataset contains 52 features, consisting of 32 features of type float64, 12 features of type int64, and 8 features of type object.
Table 1
| S.No | Attack type | No of samples |
|---|---|---|
| 1 | Benign | 477,737 |
| 2 | UDP Flood | 457,340 |
| 3 | HTTP Flood | 140,812 |
| 4 | Slow rate DoS | 73,124 |
| 5 | TCP Connect Scan | 20,052 |
| 6 | SYN Scan | 20,043 |
| 7 | UDP Scan | 15,906 |
| 8 | SYN Flood | 9,721 |
| 9 | ICMP Flood | 1,155 |
| Total number of samples | 1,215,890 | |
Attack distribution in 5G-NIDD for WSN intrusion detection.
3.1.2 Kitsune dataset
The Kitsune dataset, originally developed for IoT anomaly detection, is leveraged as a proxy for evaluating intrusion detection in WSNs operating in smart city infrastructures. The data collection process is initiated by a Packet Capture receiving raw packets, parsed by a Packet Parser, and then extracted for meta-data such as source/destination IP addresses, ports, and packet lengths. This information is then fed to the feature extractor to computation over 100 temporal statistical features, such as packet rates, bandwidth, and inter-packet delays, through damped incremental statistics that briefly describe traffic over time in compact form. Feature Mapper then divides these features into smaller subsets in correlation-based clusters such that there are not more than a fixed number of features per group. The Kitsune dataset comprises nine distinct attack types, collected through comprehensive IP-based monitoring of devices within an IoT network. Each part of the dataset contains many network packets, capturing unique cyber-attacks. Attack types include Mirai Botnet, ARP MitM, SYN DoS, OS Scan, Active Wiretap, SSL Renegotiation, Fuzzing, SSDP Flood, and Video Injection, organized into four categories: Recon, Denial of Service, Man-in-the-Middle, and Botnet Malware, which align with real-world security challenges in WSN deployments. Table 2 provides an overview of the attack distribution in the dataset.
Table 2
| S.No | Type | No of samples |
|---|---|---|
| 1 | Normal | 13,528,655 |
| 2 | SSDP Flood | 1,439,604 |
| 3 | ARP MitM | 1,145,272 |
| 4 | Active Wiretap | 923,216 |
| 5 | Mirai | 642,516 |
| 6 | Fuzzing | 432,783 |
| 7 | Video Injection | 102,499 |
| 8 | SSL Renegotiation | 92,652 |
| 9 | OS Scan | 65,700 |
| 10 | SYN DoS | 7,038 |
| Total number of samples | 18,379,935 | |
Attack distribution in Kitsune dataset for WSN security.
3.2 Data preprocessing
To eliminate the noise and clean the dataset, it is passed through pre-processing stage. Cleaning data is the initial stage in pre-processing, where pointless elements like NaN and NULL values are removed. Both datasets contain NaN and null values. Rows with a high percentage of missing values are removed entirely, while rows with a lower percentage of missing values are filled using the mean and median (Kumar et al., 2022).
3.2.1 Label encoding
To train the proposed model efficiently, nominal features must be converted into numerical values. A common approach for processing categorical columns is one-hot encoding, which creates new columns based on unique values in a category. Each unique value gets its own column, where a “1” indicates the presence of the value, and “0” marks all other positions.
3.2.2 Data normalization
Data normalization is a critical pre-processing step that helps in improving the performance of the model by modifying the scale of input features. Three normalization methods were applied to deep learning algorithms: Min-Max, Z-Score, and Unit Normalization. In this study, Min-Max normalization scales the data to a specific range of [−1, 1] as demonstrated in Equation 1.
3.2.3 Data balancing
The data imbalance in the training dataset increases the robustness of the intrusion detection system against real-world cyber threats. In cases where data is imbalanced, one class tends to be in greater numbers than the other; thus, the model may show a bias toward the dominant class and neglect important data belonging to the minority class. To handle the problem, synthetic minority oversampling technique (SMOTE), as proposed by Chawla et al. (2002), has been used. SMOTE creates synthetic samples for the minority classes to ensure a better balance across all the classes in the dataset.
3.2.4 Dataset splitting
Sixty percent of the data was used for training, while the remaining portion was used for model testing. After that, the training sub-dataset was further divided into a 30:70 split with 30% of the data for validation and the remaining 70% for training.
4 Architecture of the proposed model
This paper proposes a unique combination of 1D-CNN, variational encoder LSTM, and skip transformer. The uniqueness of the proposed model is its parallel architecture, which integrates these deep learning models. Figure 1 illustrates the architecture of the proposed model. Before discussing the architecture itself, let's provide a detailed description of the layers used: autoencoder LSTM, 1D-CNN, and transformer. The following subsections explain how each layer is used in the proposed model.
Figure 1
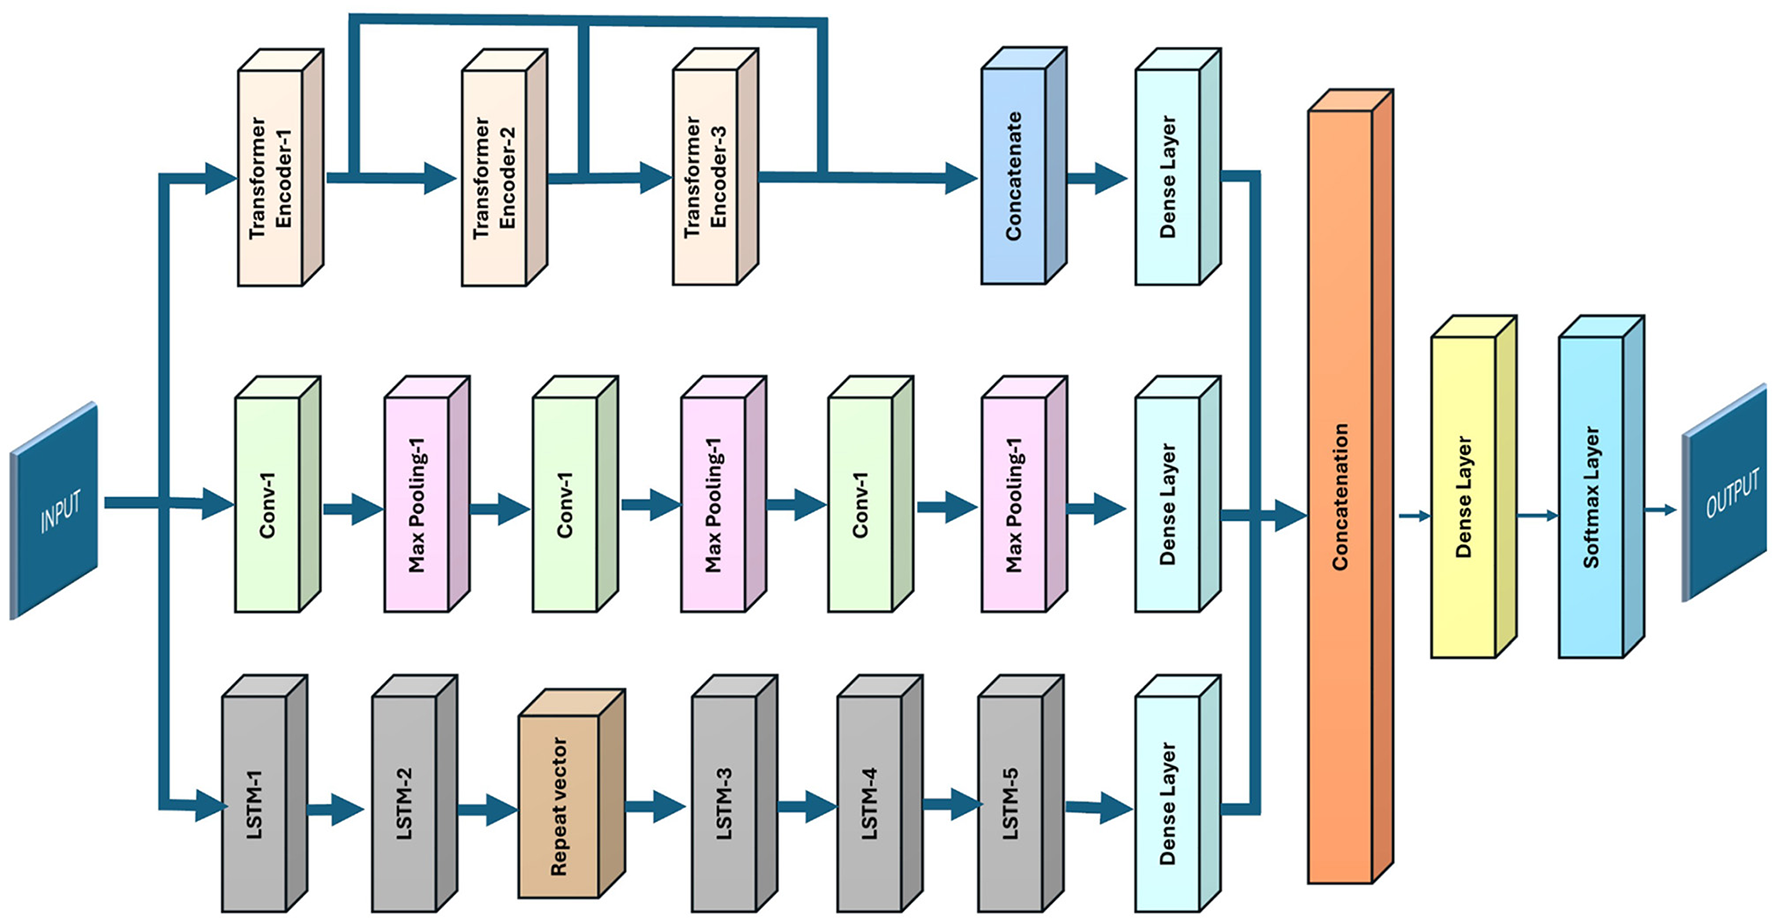
The proposed model architecture.
4.1 Convolutional neural network
The model integrates a 1D CNN layer to enhance the process of feature extraction from time-series data. The convolutional layers are used to capture local patterns in sequential data. The input to the 1D CNN is a sequence of features denoted as Equation 2 and the 1D CNN architecture is displayed in Figure 2.
Figure 2
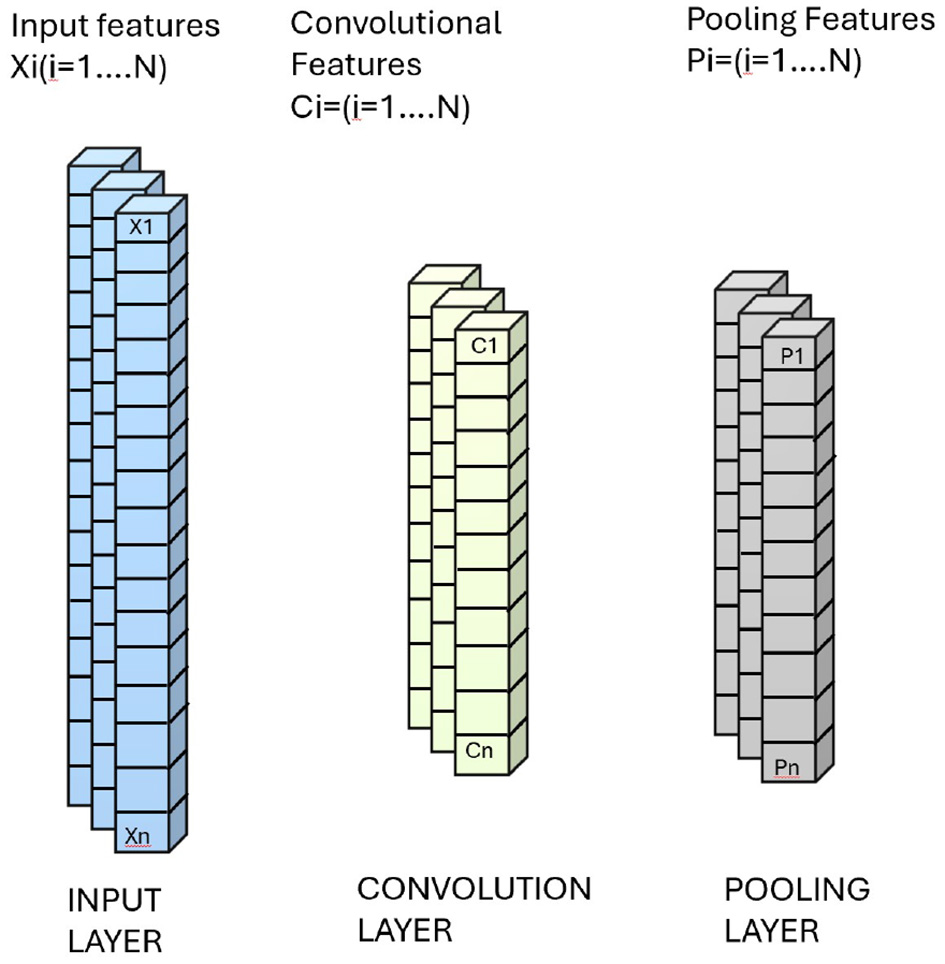
1D CNN architecture with input, convolution, and pooling layers.
Each convolutional output feature Ci (for i = 1, 2, 3, …, N) is connected to numerous input features Xn via a local weight matrix Wi with dimensions P × Q. where P indicates the filters number f and Q represents the filter length. Each filter, with a length of Q, slides across the input data to generate a feature map, resulting in P distinct feature maps, one for each filter.
The following is a mathematical representation of an individual component of the convolutional layer's output feature Equation 3:
where:
- Ci,k Refers the k-th element of the convolutional output feature Ci,
- α represents the ReLU activation function,
- Xp,q Denotes the q-th component of the input feature Xp,
- Wp,i,q Indicates the q-th unit of the weight matrix Wp,i,
- bi is the bias term for the i-th convolutional output.
α(·) is the ReLU activation function, defined as:
The overall convolution operation, linking each convolutional output Cj to the input instance via the weight matrix, can be mathematically expressed as Equation 4:
where:
- Xp symbolizes the p-th input feature,
- * denotes the convolution operator.
A max-pooling layer is used after each convolutional layer, which decreases the spatial size of the feature maps by retaining key information while discarding redundancy, effectively lowering the computational load, can be mathematically expressed as Equation 5:
Pooling features:
where
-P is the pooling window size, and
-N is the resulting number of pooled features.
4.2 Transformer encoder
The Transformer's capability to model long-term dependencies and global features extraction has demonstrated its effectiveness in numerous classification tasks (Liu et al., 2021). There are two components that comprise the transformers, i.e., an encoder and a decoder. They key characteristics of the input data are extracted and encoded by the encoder, whereas, this encoded information is used by the decoder to predict the output (Vaswani, 2017). A multi-head self-attention layer and a feed-forward layer make up an encoder block. Normalization layers and residual connections link each layer. Residual connections are used in the neural network for training stability and learning (Szegedy et al., 2015) and the normalization layer is used to process sequential data and faster convergence of the model raining (Ba, 2016). The feed-forward layer contains two linear layers separated by a ReLU activation function (Agarap, 2018) as shown in Figure 3.
Figure 3
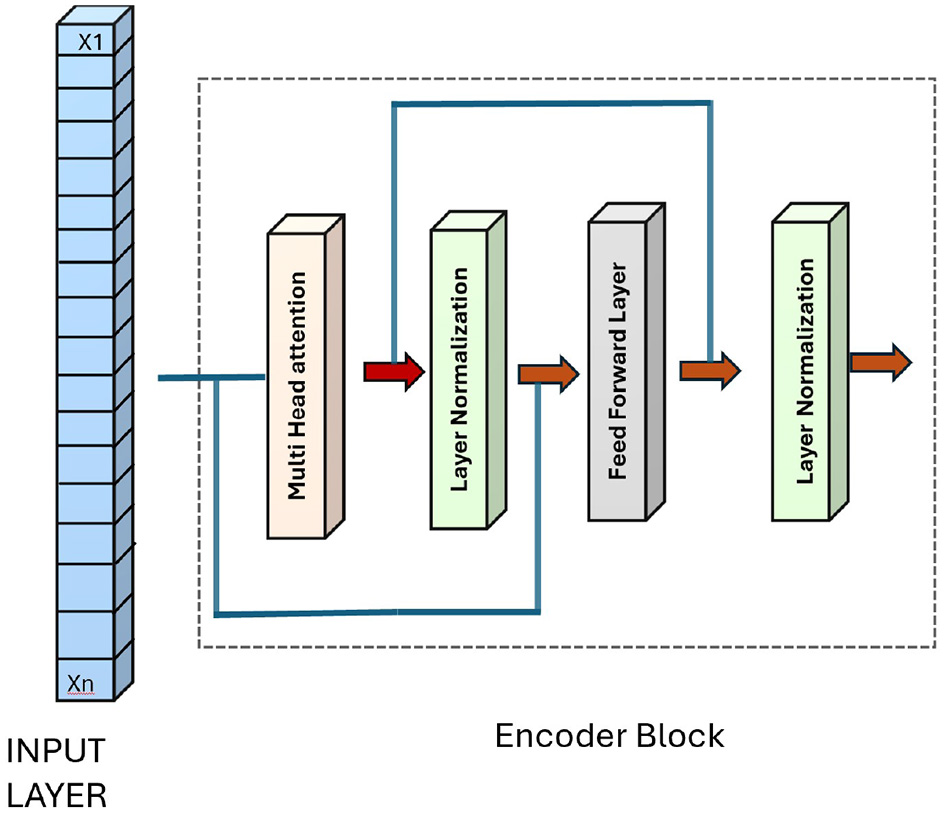
Transformer encoder architecture.
The input to the Encoder is a sequence of features denoted as Equation 6:
An attention function uses a weighted sum of the values, each of which is established by a compatibility function between the query and its matching key, to convert a query and key-value pairs to an output. Each attention head computes scaled version of dot-product attention as shown in Equation 7.
where
V = XWV, K = XWK, Q = XWQ
W Q , WK, and WV are learnable weight matrices for query, value, and key transformations,
is the dimension of each attention head. Multiple self-attention heads process the same input in parallel, each with its weight matrices, allowing them to take different patterns and relations within the data. The multihead attention output for the sequence X is computed as Equation 8:
where
-WO is the output projection matrix, and headi denotes the output of the i-th attention head.
After the attention layer, the output is succeeded through a feed-forward network with ReLU activation:
where W1 is weight matrices, and b1 is biases.
A residual connection module followed by a layer normalization module is applied around each component, with the final output represented as follows Equation 11:
where
SA(.) represents the self-attention module, and
LayerNorm(.) represents the layer normalization operation.
4.3 Long short-term memory neural network
The recurrent neural network algorithm is a deep learning model widely used in real-world applications and the ability to learn long-term dependencies. RNNs face vanishing and exploding gradient problems during training, which can be mitigated by using LSTMs with forget gates to better manage information flow and stabilize learning (Hochreiter et al., 2001). The input to the LSTM is a sequence of features denoted as
For each time step t, the LSTM processes the input Xt and updates its internal states. An LSTM unit comprises three gates, i.e., input, output, and forget and a memory cell as depicted in Figure 4. The structure of the LSTM enables it to maintain a controlled flow of information by choosing what to “forget” and what to “remember,” facilitating the learning of long-term dependencies.
Figure 4
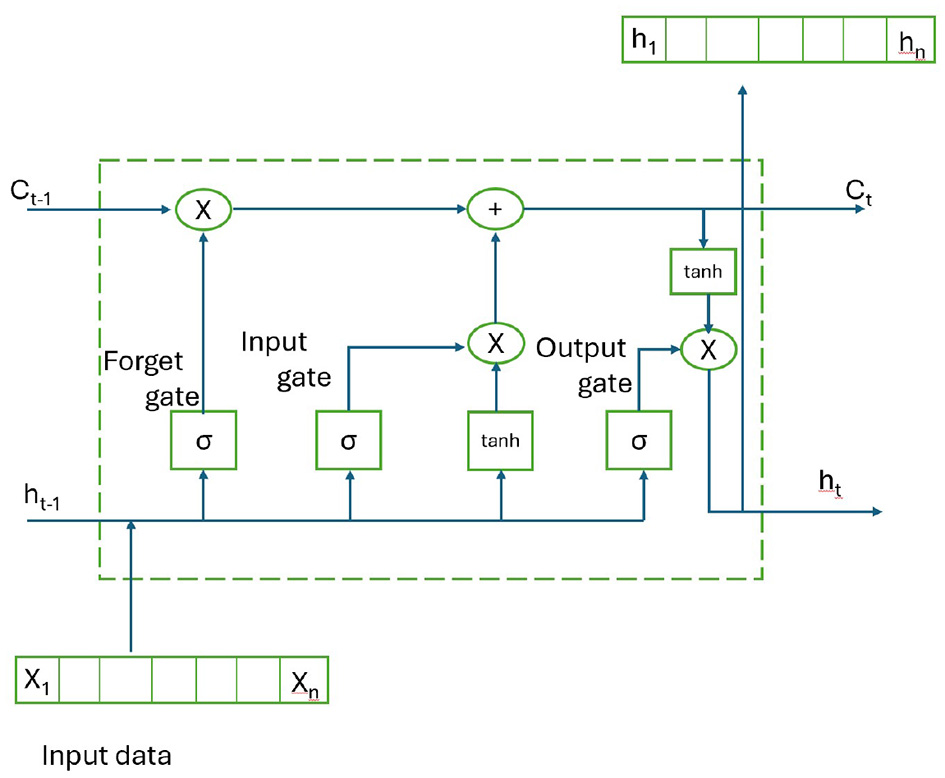
LSTM architecture.
More specifically, New information stored in the memory state at time t is controlled by the input gate it and the secondary gate Ct. Meanwhile, the forget gate ft decides on the disposal or retention of earlier information from t−1, whereas the output of the cell is determined by the gate ot.
Where ht−1 represents the previous time step state or the hidden state. On the other hand, Wf, Wo, WC, Wi represent the forget, output, cell candidate, and input gate, respectively. The related bias terms bC, bf, bobi.σ is the sigmoid activation function, and tanh is the hyperbolic tangent activation function.
The hidden state ht, which is transferred to the next layer, is the LSTM's final output at time step t.
4.4 Architectural details of the proposed hybrid model
This paper presents a hybrid model that consists of three deep learning components Transformer Encoders, Convolution neural network, and Variational Autoencoder with LSTM as illustrated in Figure 5. The input data flows through three separate paths, each representing one of these architectures. The Transformer path consists of multiple encoder layers. These layers use self-attention mechanisms that help in capturing long-range dependencies in the data. Each Transformer encoder processes the input sequentially, extracting meaningful global patterns by weighting each time step according to its relevance. The Transformer pathway begins with an input layer Input_Transformer of shape (38, 1). The first transformer block includes a MultiHeadAttention layer, capturing dependencies in the sequence with 1,793 parameters, followed by a LayerNormalization layer (2 parameters) to stabilize learning.The output is added back to the input using an Add layer, enabling residual learning.A Dense layer with 128 units (256 parameters) and another LayerNormalization refine the output before a second MultiHeadAttention layer (131,968 parameters). This pattern repeats, culminating in another Add layer, which prepares the transformer output for further processing. A final Dense layer with 16,512 parameters and a LayerNormalization are applied, producing a rich feature representation.
Figure 5
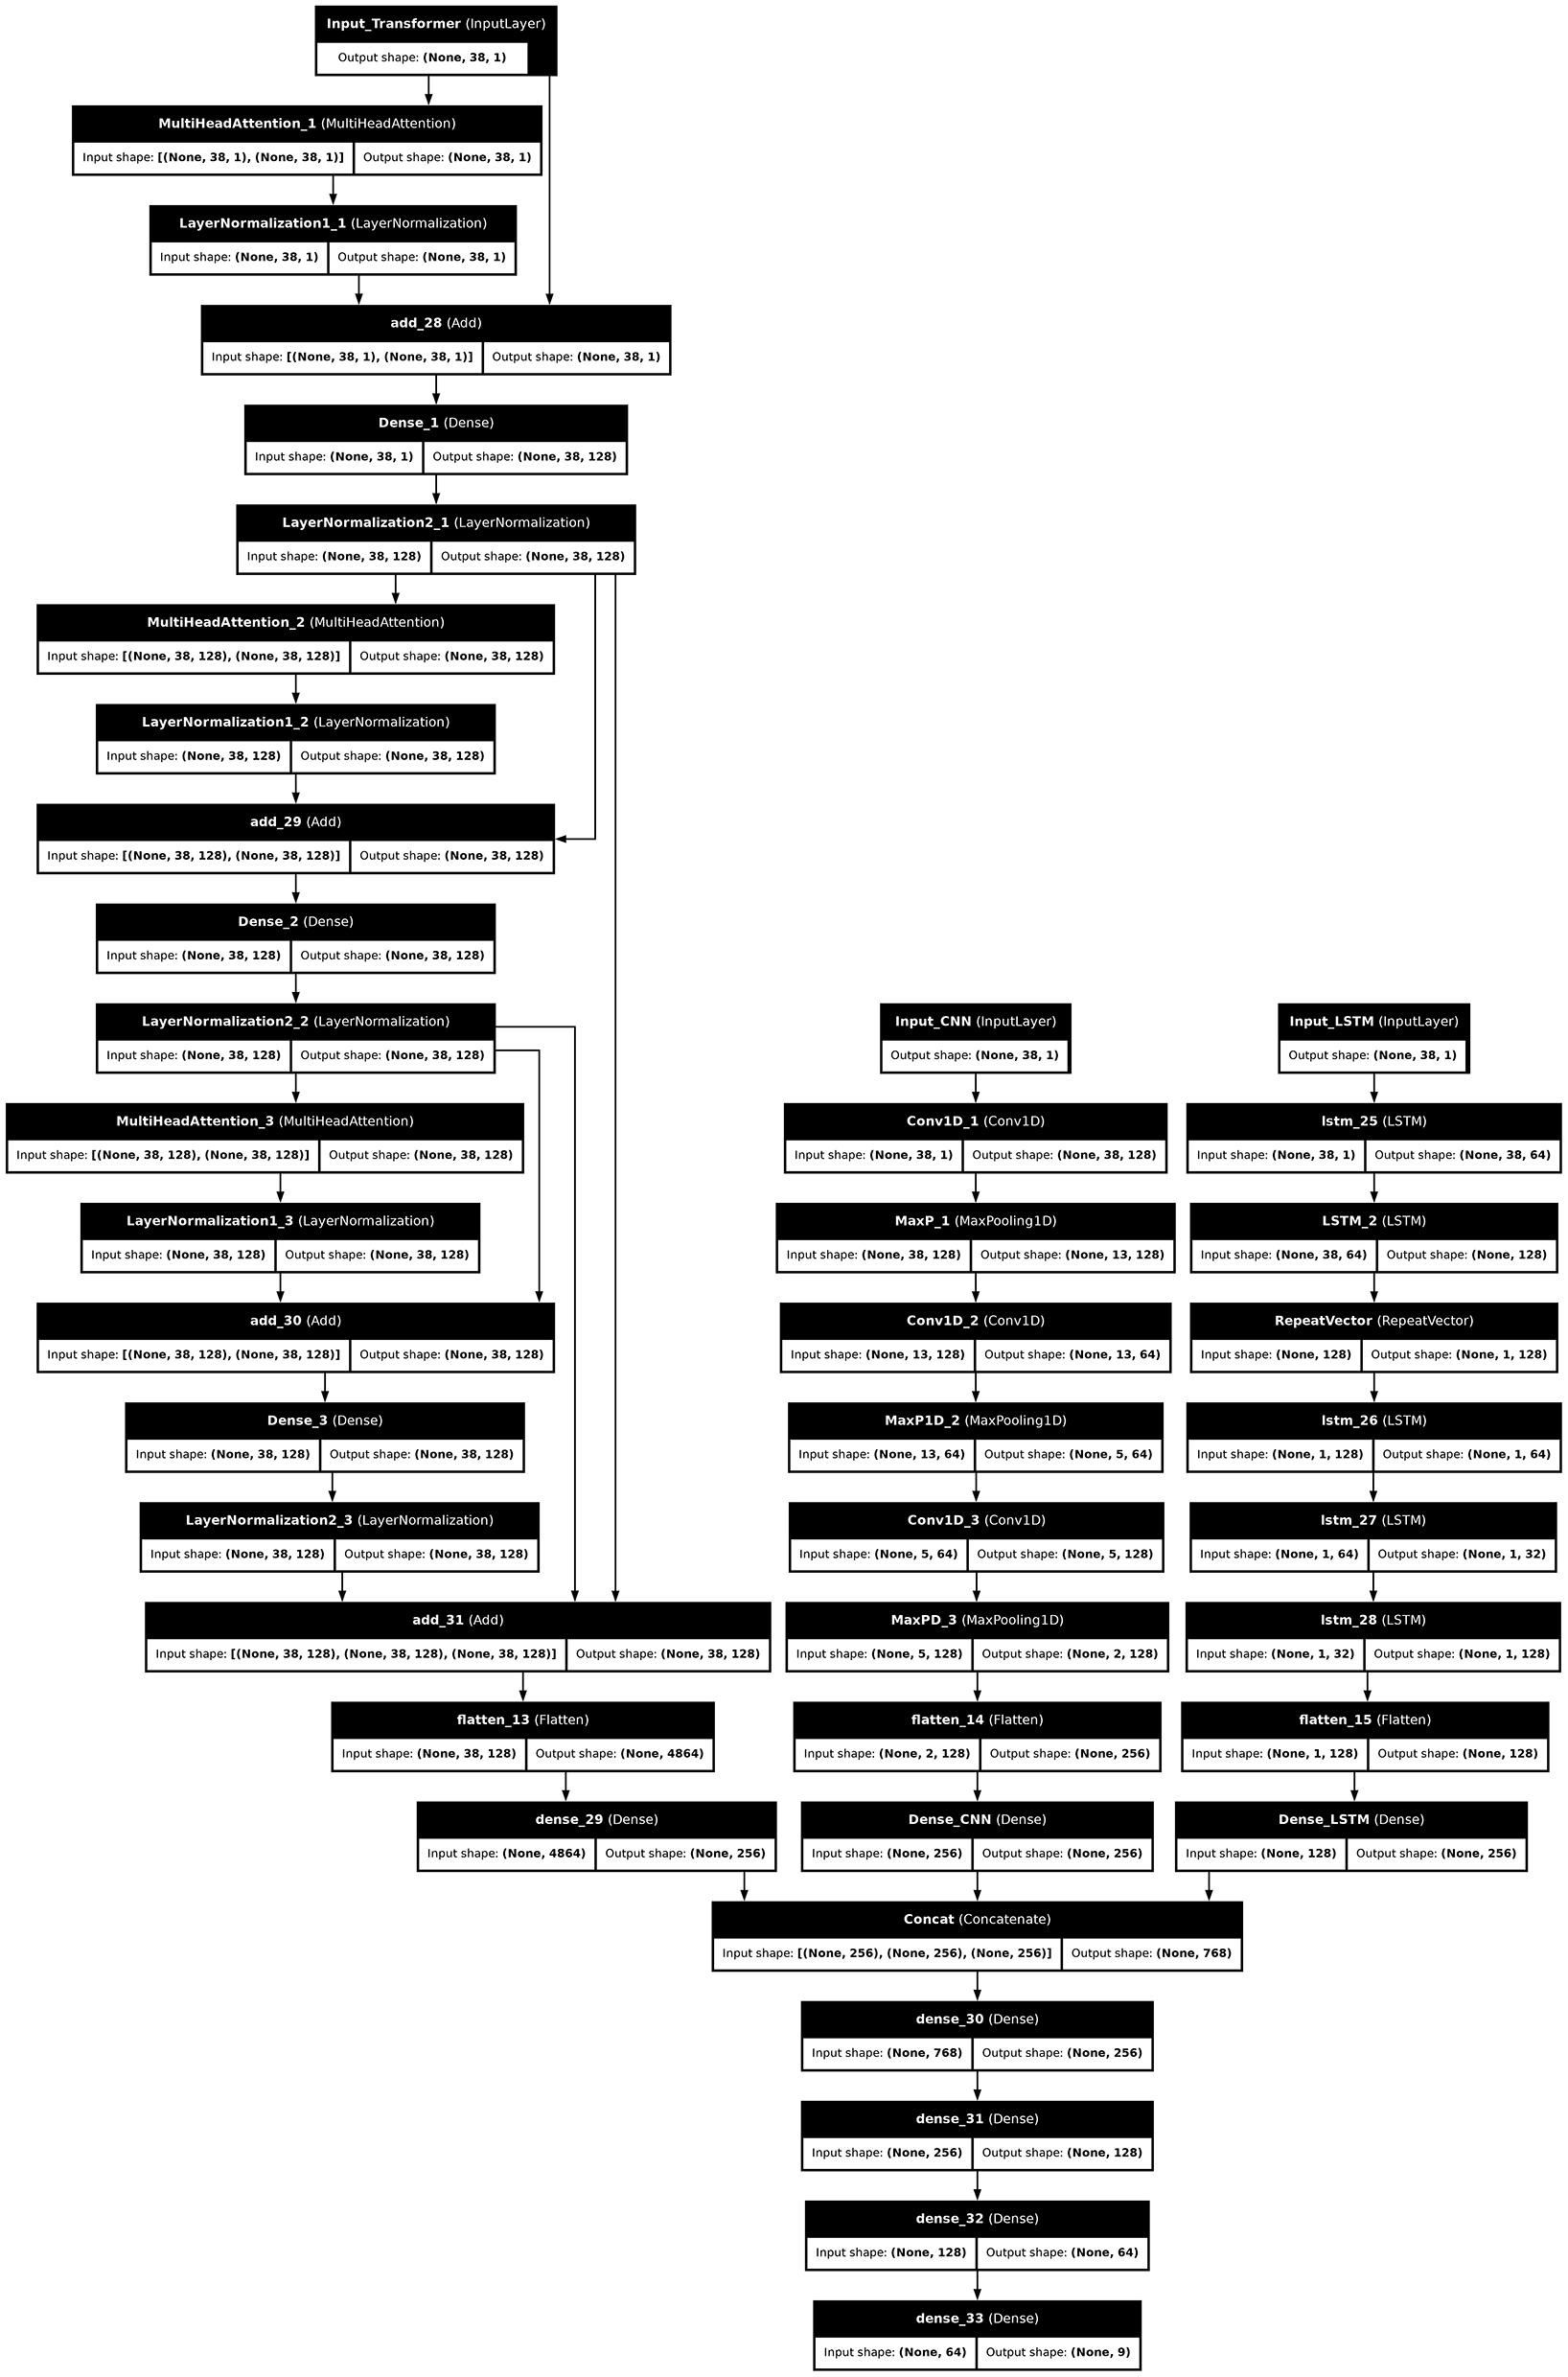
Architectural details of the proposed hybrid model.
The second path is a CNN-based pathway that captures local patterns through convolution and pooling layers. The data in this path goes through multiple convolutional layers, each followed by max-pooling layers to reduce dimensionality while retaining essential features. By applying convolution filters, this path detects spatial hierarchies within the data, which are particularly effective in recognizing short-term patterns and localized trends in time-series data. The convolutional neural networks take input data sized (38, 1) and three additional convolutional blocks with different hyperparameters. The first layer takes the input data with 128 filters, 5 kernel size, and 768 trainable parameters. Conv1D_2 (with 64 filters and 41,024 parameters) assumes the role of the second convolutional layer, immediately followed by another max-pooling layer. Finally, Conv1D_3 (41,088 parameters) and a third max-pooling layer produce a spatial feature map, flattened to 256 dimensions, and flattened into a Dense_CNN (65,792 parameters), producing a comprehensive CNN-based feature vector.
Furthermore, the LSTM variational autoencoder is used to capture complex latent structures from the time-series data. The encoder, decoder, and latent space are its three sub-layers. VAEs encode data into a latent space while the model captures meaningful representations of the data distribution. The first LSTM layer, lstm_25, has 64 units and 16,896 parameters. The output undergoes additional LSTM layers to capture long-term dependencies. A RepeatVector layer rearranges the output for the next LSTM layer, lstm_26 (49,408 parameters), followed by lstm_27 (12,416 parameters), and a final LSTM layer, lstm_28 (82,432 parameters), producing a feature vector of shape (1, 128) that is flattened to a 128-dimensional output.
Finally, the outputs from Transformers, CNN, and Variational Autoencoder LSTM are concatenated, combining global, local, and sequential features. The concatenated representation is processed through additional dense layers and a softmax layer to yield the final classification output. This model design enables a rich feature extraction, allowing it to handle complex temporal patterns with both short- and long-term dependencies effectively The outputs from the Transformer, CNN, and LSTM pathways are flattened (flatten_13, flatten_14, and flatten_15, respectively) and passed through dense layers (dense_29, Dense_CNN, and Dense_LSTM) to produce 256-dimensional feature vectors. These are concatenated (Concat) to form a single vector with 768 features. The concatenated features are processed through a series of dense layers (dense_30 with 256 units, dense_31 with 128 units, and dense_32 with 64 units), further refining the representation. The final Dense layer with 9 units and softmax activation provides the classification output, predicting probabilities across nine target classes.
4.5 The proposed model size and parameters
The parameter size and count of the proposed model vary and depend upon the total features in the dataset. A large model size is due to the increase in the number of parameters. In this paper, different datasets were used to train the model as shown in Table 3. Furthermore, the number of parameters depends on the number of features; the greater the number of features, the higher the number of parameters. The proposed model was compared with the MobileNet model (Howard et al., 2017), which consists of 4.2 million parameters. The proposed model, when using the 5G-NIDD dataset, has around 2.2 million parameters. For the UNSW-NB15 dataset, the number of parameters is ~ 2 million, while for the CIC IoT 2017 dataset, it is around 2.6 million. However, the Kitsune dataset has a higher number of features, resulting in a larger size of 4.8 million parameters.
Table 3
| Dataset | Model total parameters | Trainable parameters | Non-trainable parameters | Size |
|---|---|---|---|---|
| Kitsune | 4,847,501 | 4,847,501 | 0 | 18.49 MB |
| 5G-NIDD | 2,225,996 | 2,225,996 | 0 | 8.49 MB |
| UNSW-NB15 | 2,029,518 | 2,029,518 | 0 | 7.74 MB |
| CIC-IOT 2017 | 2,684,618 | 2,684,618 | 0 | 10.24 MB |
Model parameters and sizes for different datasets.
4.6 Hyperparameter tuning
Different hyperparameter tuning techniques were employed based on the available resources. In this paper, we used random search optimization for hyperparameter tuning. Initially, we utilized the VAE-LSTM model to identify the optimal parameters. Afterward, we combined the 1D-CNN model with the VAE-LSTM model, keeping the LSTM parameters constant while randomly selecting the 1D-CNN component parameters within a predefined range. Furthermore, when integrating the VAE-LSTM and 1D-CNN components with the transformer encoder, we experimented with varying the number of transformer encoders. We started with one transformer encoder, then incrementally increased to two, three, and finally four transformer encoders, and found that three transformer encoder with skip connections are best and a lightweight architecture.
5 Performance evaluation
5.1 Performance parameters
In order to evaluate the deep learning model algorithm's detection performance on a particular dataset, metrics like false positives (FP), true positives (TP), false negatives (FN), and true negatives (TN) can be used. The evaluation of the proposed model's performance was based on four key metrics. Accuracy, as given in Equation 17, is the percentage of correctly identified samples relative to the total number of observations, including both true positives and true negatives. True positives compared to total predicted positives define precision, given in Equation 18. The parameter Recall, as given in Equation 19, helps in quantifying the proportion of true positive instances that the model successfully identifies, indicating its sensitivity. F1-Score, given in Equation 20. The harmonic mean of precision and recall provides a balance between the binary metrics.
5.2 Reliability parameters
5.2.1 Area under an ROC curve
The area under the receiver operating characteristic curve is a precise metric that may be used to measure a model's sensitivity Equation 21 and specificity Equation 22 at various threshold levels. AUC is widely favored in the machine learning field, particularly for imbalanced datasets, due to its reliability and stability. It represents the likelihood that the classifier will rank a positive instance higher than a negative instance at random.
5.2.2 Matthews correlation coefficient
MCC is a strong measure for evaluating model performance, especially in cases with class imbalances. It provides a balanced evaluation by taking into account false and true positives and negatives. The MCC ranges from -1 to +1. A value of -1 indicates a completely incorrect prediction, where all positives are classified as negatives and all negatives as positives. A value of +1 represents perfect classification. An MCC value near 0 suggests that the predictions are equivalent to random guessing. MCC can be mathematically defined as Equation 23.
5.2.3 Cohen's Kappa coefficient
Originally, Cohen's Kappa was used to measure the level of agreement between two observers assessing the same group of people using a nominal scale with two or more categories. These coefficients assess the correlation between categorical variables and are widely used to evaluate reliability or validity. It is mathematically defined as Equation 24.
where the mathematical formula for accuracy is given by:
and the formula for expected accuracy is given by:
where N is the dataset sample.
6 Results
6.1 Training and validation results
Over 100 epochs, the proposed model's training accuracy, loss and validation accuracy, loss metrics were used to evaluate its performance. The evaluation of these metrics is critical for diagnosing and addressing potential overfitting or underfitting in the model. By using the Kitsune dataset, 99.87% accuracy was achieved during the proposed model training, while same accuracy observed during validation, as shown the Figure 6. Likewise, in the Figure 7, training and validation loss reached 0.01%.
Figure 6

Training accuracy on the Kitsune dataset.
Figure 7

Training loss on the Kitsune dataset.
Furthermore, training and validation of the proposed model using the 5G-NIDD dataset achieved a training accuracy of 99.29% and a validation accuracy of 99.28%, as shown in Figure 8, with the training and validation loss presented in Figure 9.
Figure 8

Training accuracy on the 5G-NIDD dataset.
Figure 9

Training loss on the 5G-NIDD dataset.
6.2 Class-wise classification report
The performance of the proposed model has been evaluated by quantifying key parameters, i.e., precision, recall, accuracy, and F1-score. The classification report, as given in Table 4, classifies different attack types and normal network behavior. The precision for every class remains near 1, indicating that the model has a high level of accuracy in predicting positive instances for each class. Recall is also close to 1 for all classes, which suggests that the model successfully identifies most of the true instances of each class. The F1-score, which harmonizes precision and recall, is almost 1 for most classes, signifying balanced performance The model can accurately classify different attack types and normal traffic.
Table 4
| Class | Precision | Recall | F1-score | Support |
|---|---|---|---|---|
| 0 | 1.00 | 0.99 | 0.99 | 30,000 |
| 1 | 1.00 | 1.00 | 1.00 | 30,000 |
| 2 | 1.00 | 1.00 | 1.00 | 30,000 |
| 3 | 1.00 | 1.00 | 1.00 | 30,000 |
| 4 | 1.00 | 1.00 | 1.00 | 30,000 |
| 5 | 1.00 | 1.00 | 1.00 | 30,000 |
| 6 | 1.00 | 1.00 | 1.00 | 30,000 |
| 7 | 0.99 | 1.00 | 1.00 | 30,000 |
| 8 | 1.00 | 1.00 | 1.00 | 30,000 |
| 9 | 1.00 | 1.00 | 1.00 | 30,000 |
Classification metrics for Kitsune dataset.
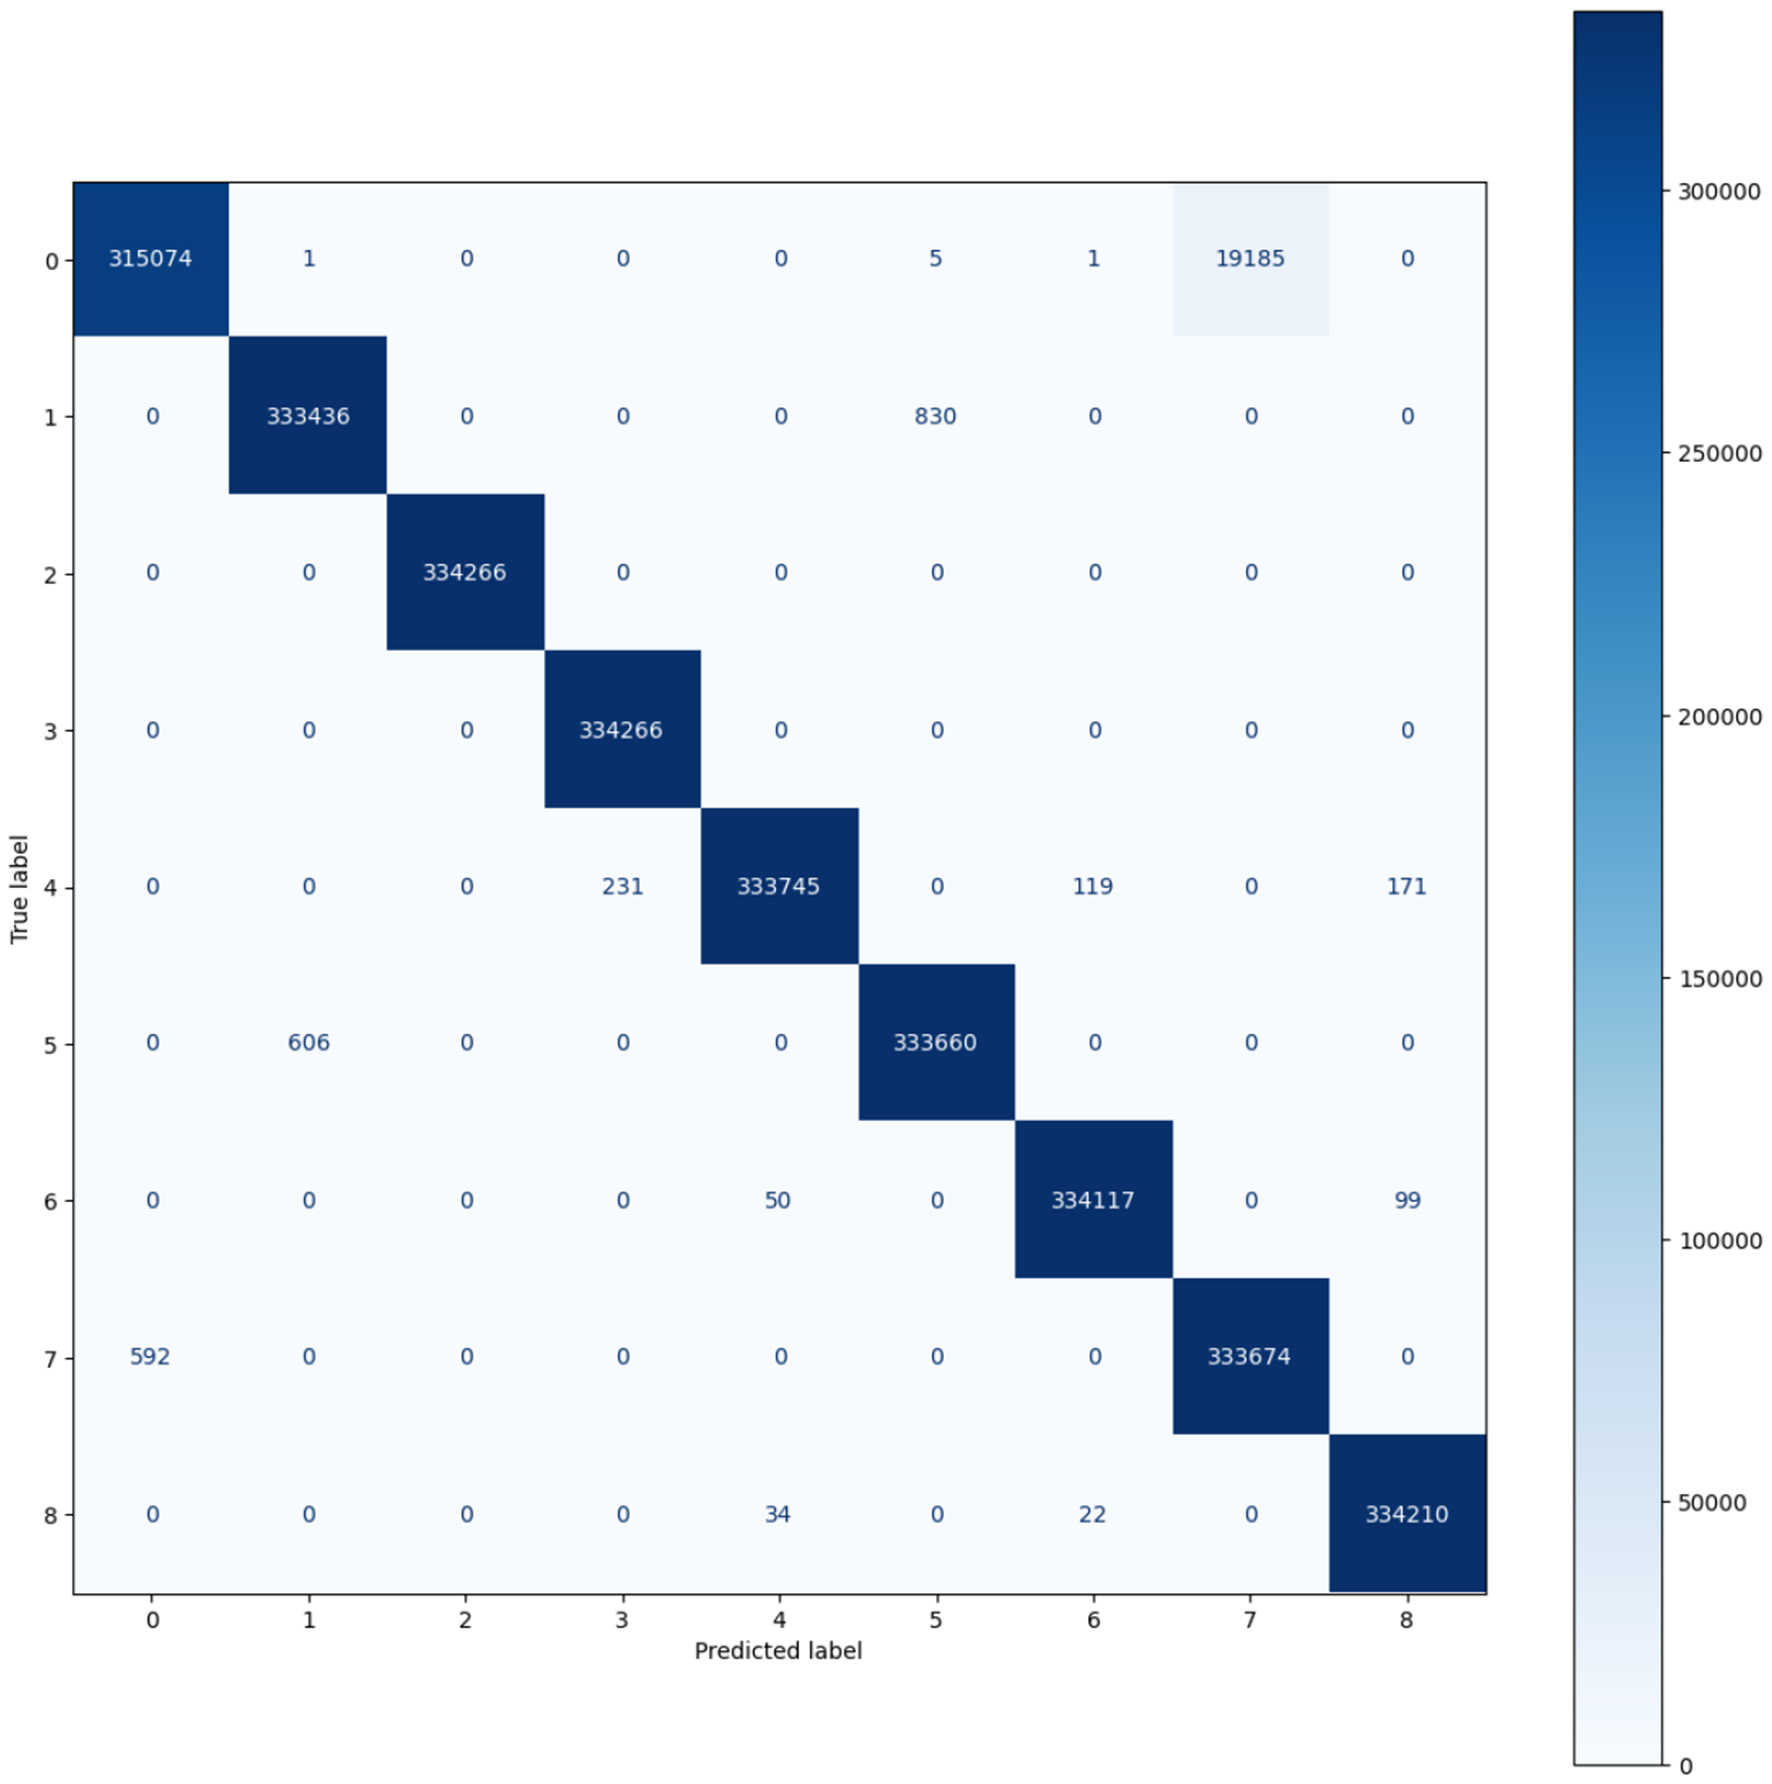
The results from the model trained on the 5G-NIDD dataset show Table 5 that the model well performed across the different classes of network traffic and attacks. For most classes, precision is almost 1.00. This means the model is making very few false positive errors. A recall is perfect (1.00) for most classes, meaning the model identifies nearly all relevant instances. F1 scores are also high, reflecting a balanced performance. However, benign has a slightly lower recall (0.99), and UDP_Scan and benign have lower F1_scores (0.99) where rarer attacks are harder to detect. The confusion matrices Figures 10, 11. demonstrate the model's strong classification performance on both the 5G-NIDD and Kitsune datasets. Most samples are correctly classified, with high values along the diagonal indicating excellent true positive rates. Minor misclassifications are observed, particularly in the 5G-NIDD dataset, where Benign traffic overlaps slightly with SYN_Flood due to feature similarities. The Kitsune dataset shows fewer errors, suggesting the model generalizes more effectively to this dataset. Overall, the results highlight the model's robustness in detecting diverse attack types.
Table 5
| Class | Precision | Recall | F1-score | Support |
|---|---|---|---|---|
| 0 | 1.00 | 0.94 | 0.97 | 143,257 |
| 1 | 1.00 | 1.00 | 1.00 | 143,257 |
| 2 | 1.00 | 1.00 | 1.00 | 143,257 |
| 3 | 1.00 | 1.00 | 1.00 | 143,257 |
| 4 | 1.00 | 1.00 | 1.00 | 143,257 |
| 5 | 1.00 | 1.00 | 1.00 | 143,257 |
| 6 | 1.00 | 1.00 | 1.00 | 143,257 |
| 7 | 0.95 | 1.00 | 0.97 | 143,257 |
| 8 | 1.00 | 1.00 | 1.00 | 143,257 |
Classification metrics for 5G-NIDD dataset.
Figure 10

Confusion matrix of Kitsune dataset.
Figure 11
Confusion matrix of 5G-NIDD dataset.
6.3 Reliability parameters results
For each class in the Kitsune dataset, the Cohen's Kappa and Matthews Correlation Coefficient (MCC) metrics validate the high performance of the proposed model, as shown in Table 6. Most classes achieve near-perfect scores, with MCC and Kappa values exceeding 0.999 for several categories, indicating strong agreement between predictions and ground truth. Video injection attack has slightly lower values (MCC: 0.995, Kappa: 0.995), reflecting minor misclassifications likely due to overlapping features.
Table 6
| Class | MCC | Cohen's Kappa |
|---|---|---|
| 0 | 0.992 | 0.992 |
| 1 | 0.999 | 0.999 |
| 2 | 0.999 | 0.999 |
| 3 | 1.000 | 1.000 |
| 4 | 1.000 | 1.000 |
| 5 | 1.000 | 1.000 |
| 6 | 0.999 | 0.999 |
| 7 | 0.995 | 0.995 |
| 8 | 0.999 | 0.999 |
| 9 | 1.000 | 1.000 |
Cohen's Kappa and MCC for each class in Kitsune dataset.
The Matthews Correlation Coefficient (MCC) and Cohen's Kappa values for the 5G-NIDD dataset indicate the proposed model's strong performance across all classes as shown in Table 7. Class 0 and Class 7 exhibit slightly lower scores, suggesting minimal misclassification, potentially due to feature overlap or noise. Most classes achieve scores close to or equal to 1.0, reflecting exceptional agreement between predicted and actual labels.
Table 7
| Class | MCC | Cohen's Kappa |
|---|---|---|
| 0 | 0.97 | 0.97 |
| 1 | 0.99 | 0.99 |
| 2 | 1.00 | 1.00 |
| 3 | 1.00 | 1.00 |
| 4 | 0.99 | 0.99 |
| 5 | 0.99 | 0.99 |
| 6 | 1.00 | 1.00 |
| 7 | 0.97 | 0.97 |
| 8 | 1.00 | 1.00 |
Cohen's Kappa and MCC for each class in 5G-NIDD dataset.
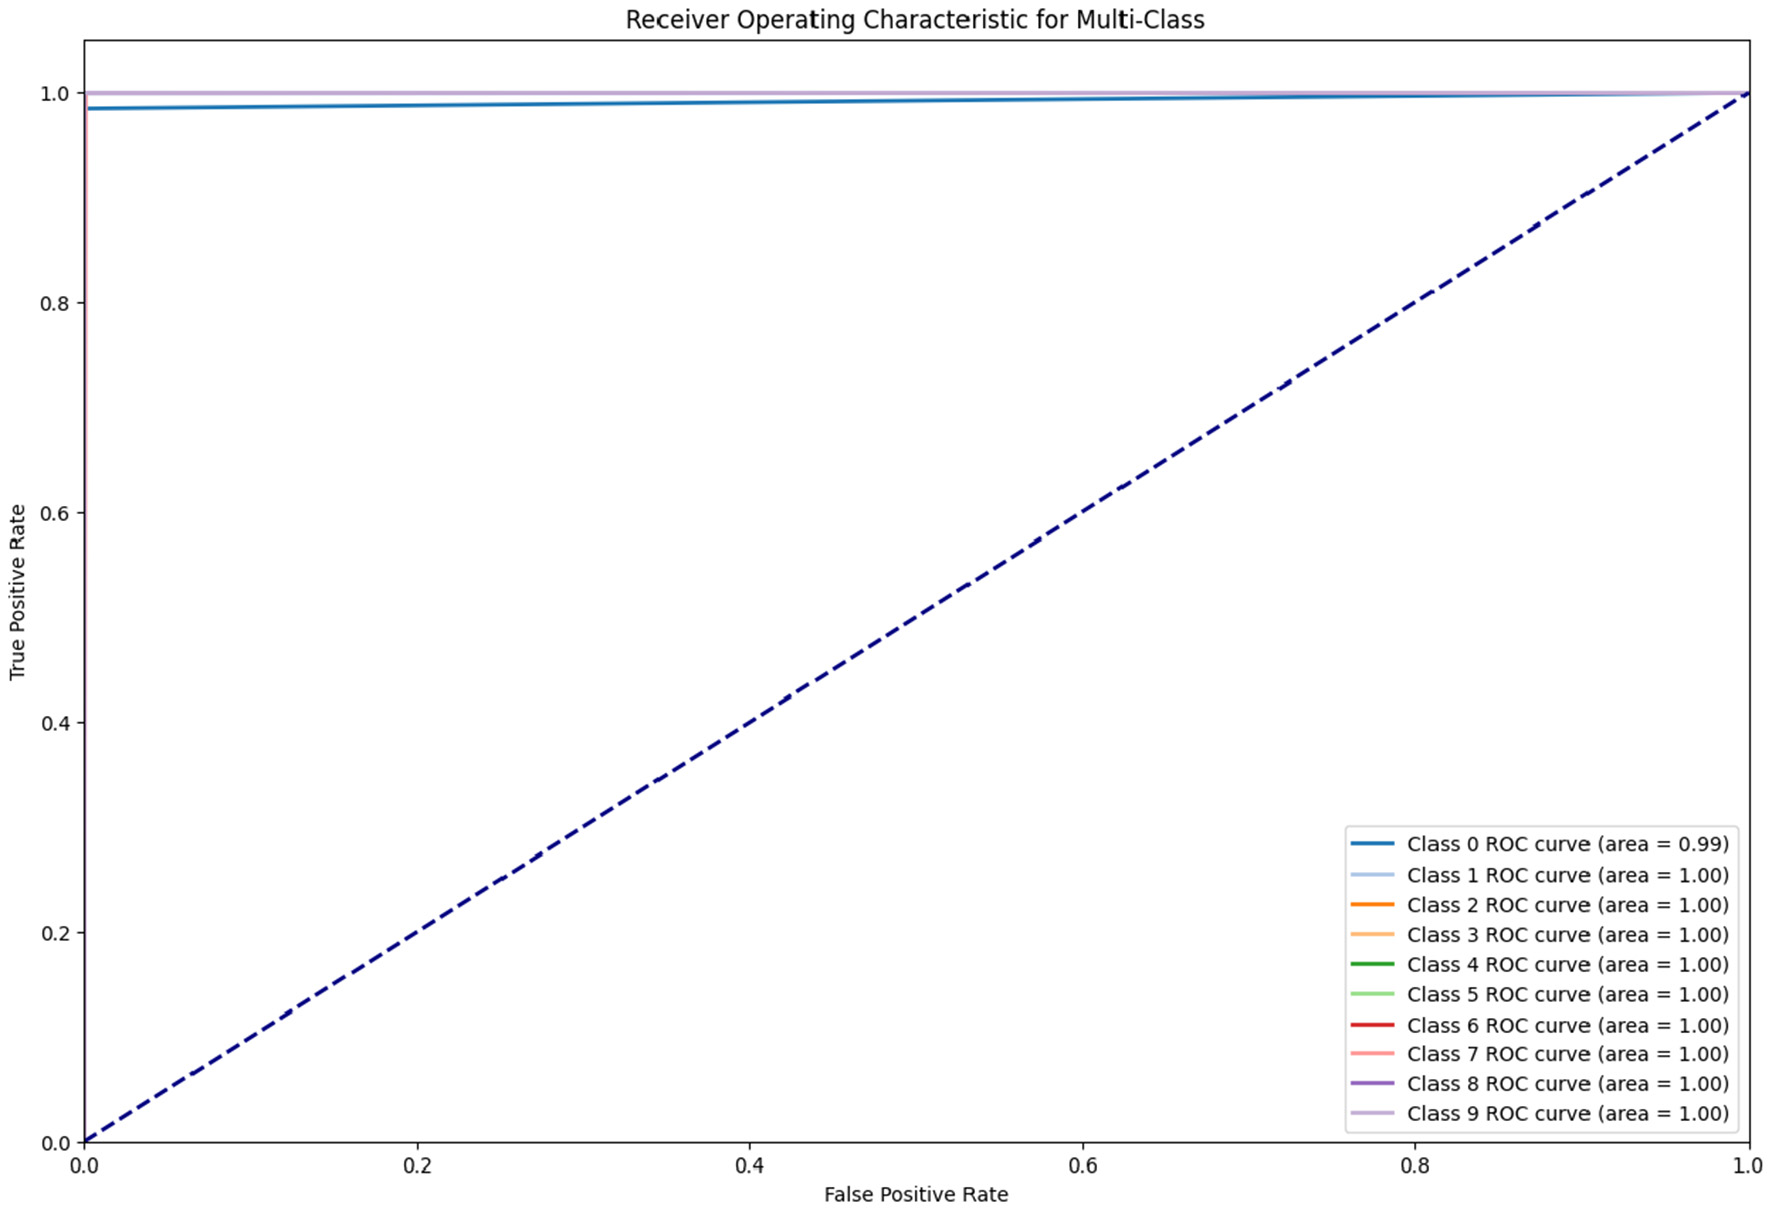
The ROC curves demonstrate the model's excellent multi-class classification performance. In the Figure 12 graph, most classes achieve an AUC of 1.00, with one class slightly lower at 0.97. The Figure 13 graph shows perfect performance across all classes with an AUC of 1.00, representing the model's strong ability to differentiate between classes with minimal false positives.
Figure 12

ROC Of 5G-NIDD dataset.
Figure 13
ROC Of Kitsune dataset.
6.4 Model component contribution analysis
The component control efficiency is conducted on the Kitsune dataset demonstrates the progressive improvement in model performance with the integration of advanced architectures. The baseline model using a Variational Autoencoders LSTM, achieved an accuracy of 90.00%. Incorporating a 1D CNN alongside the Variational Autoencoders LSTM gives an accuracy 99.26%, showcasing the benefits of combining temporal and spatial feature extraction. Integrating the transformer with a 1D CNN improved model's overall performance, resulting in 99.62% accuracy. Finally, by exhibiting an accuracy score of 99.83%, the proposed model outperformed all configurations. The results of the ablation study, showing the impact of different components on the model's performance, are presented in Table 8.
Table 8
| Exp no | Model components | Accuracy |
|---|---|---|
| 1 | LSTM | 90.00% |
| 2 | 1D CNN + LSTM | 99.26% |
| 3 | Transformer + 1D CNN | 99.62% |
| 4 | The proposed model | 99.83% |
Impact of model components on performance.
6.5 Cross dataset validation
In this paper the author tested the proposed model on two different dataset CIC-IOT 2017 (Sharafaldin et al., 2018) and UNSW-NB15 (Moustafa and Slay, 2015). The model has a high overall accuracy 99.81% on the CIC IoT dataset, but the performance is biased because of class imbalance. It performs well in identifying majority classes such as Normal Traffic precision of 0.999, and recall of 0.999 but performs poorly with minority classes such as Bots recall 0.579 and Web Attacks recall 0.975. In the absence of data balancing, the model prefers the majority class and results in bad detection of minority attacks as shown from the Table 9.
Table 9
| Class | Precision | Recall | F1 score | Support |
|---|---|---|---|---|
| Bots | 0.8689 | 0.5788 | 0.6948 | 584 |
| Brute Force | 0.9916 | 0.9905 | 0.9911 | 2,745 |
| DDoS | 0.9997 | 0.9998 | 0.9998 | 38,404 |
| DoS | 0.9919 | 0.9949 | 0.9934 | 58,124 |
| Normal Traffic | 0.9991 | 0.9987 | 0.9989 | 628,518 |
| Port Scanning | 0.9903 | 0.9992 | 0.9947 | 27,208 |
| Web Attacks | 0.9646 | 0.9751 | 0.9698 | 643 |
Classification metrics for CIC-IoT 2017 dataset.
After balancing the dataset using SMOTE algorithm the proposed model results showing well performance across all classes with high precision, recall, and F1 scores close to one as shown in Table 10. The model achieves near-perfect results for most classes, such as DDoS F1 0.9999 and Brute Force F1 0.9998, indicating strong generalization and detection capabilities. However, Normal Traffic has a slightly lower recall of 0.9920. the model have an overall accuracy of 99.84%. After comparing the results, Data balancing did not negatively impact the model's overall accuracy, which remained consistently high. Still, it significantly improved the detection of minority classes, as evidenced by the enhanced recall and F1 scores for previously underrepresented attack types.
Table 10
| Class | Precision | Recall | F1 score | Support |
|---|---|---|---|---|
| Bots | 0.9956 | 0.9997 | 0.9976 | 58,517 |
| Brute Force | 0.9996 | 0.9999 | 0.9998 | 58,518 |
| DDoS | 0.9999 | 0.9998 | 0.9999 | 58,517 |
| DoS | 0.9969 | 0.9991 | 0.9980 | 58,517 |
| Normal Traffic | 0.9986 | 0.9920 | 0.9953 | 58,517 |
| Port Scanning | 0.9993 | 0.9991 | 0.9992 | 58,517 |
| Web Attacks | 0.9995 | 0.9998 | 0.9996 | 58,517 |
Classification results on CIC IoT dataset with balanced.
The proposed model was trained using the UNSW-NB15 dataset, both with and without data balancing, achieving the same accuracy of 98.2% in both cases. However, the recall and F1 scores varied significantly for different attack types in the unbalanced dataset.
6.6 The proposed model's performance comparison
Table 11 presents a performance comparison of the proposed model with existing works using the Kitsune dataset. In this study Zelichenok and Kotenko (2024) using a combination of machine learning and LSTM techniques achieved an accuracy of 93.00%, while Alsubai et al. (2024) used a convolutional autoencoder and achieved 97.50% accuracy. In contrast, our proposed model significantly outperforms these approaches, achieving an accuracy of 99.83%.
Table 11
| Paper | Model | Accuracy |
|---|---|---|
| Zelichenok and Kotenko (2024) | ML + LSTM | 93.00% |
| Alsubai et al. (2024) | Convolutional Autoencoder | 97.50% |
| This paper | The proposed model | 99.83% |
Performance comparison with existing works using Kitsune dataset.
Table 12 compares the accuracy of our proposed model with various existing approaches in the 5G-NIDD dataset. Among the prior works, BiLSTM reached the highest accuracy of 99.90% (Pant et al., 2024), followed by Random Forest with 99.44% (Samarakoon et al., 2022). Other models, such as CNN (Park et al., 2023), federated learning (Makris et al., 2023), and K-Nearest neighbor (Ghani et al., 2023), yielded accuracies of 98.26%, 97.89%, and 97.20%, respectively, while Variational Autoencoders (Islam et al., 2024) performed the lowest at 92.00%. Our proposed model achieved a competitive accuracy of 99.27%, highlighting its robustness and ability to deliver cutting-edge results on the 5G NIDD dataset, closely rivaling the best-performing models in the literature.
Table 12
| Paper | Model | Accuracy |
|---|---|---|
| Samarakoon et al. (2022) | Random Forest | 99.44% |
| Ghani et al. (2023) | K-Nearest Neighbor | 97.20% |
| Pant et al. (2024) | BiLSTM | 99.90% |
| Park et al. (2023) | CNN | 98.26% |
| Islam et al. (2024) | Variational Autoencoders | 92.00% |
| Makris et al. (2023) | FL | 97.89% |
| This paper | The proposed model | 99.27% |
Model accuracy comparison with existing papers using 5G-NIDD dataset.
7 Conclusion
As the WSN networks evolve under the 6G paradigm, their security becomes a critical concern due to increased cyber threats, heterogeneous communication protocols, and resource constraints. This study proposed a novel deep learning-based intrusion detection framework to enhance the security of 6G-enabled WSNs, ensuring their resilience against evolving cyber threats. This research proposed a novel multi-deep learning framework for IDS in 6G networks, integrating CNNs, Variational Autoencoder LSTM, and Transformers in parallel. The proposed model achieved accuracies of 99.83% and 99.27% on the Kitsune and 5G-NIDD datasets. Class-wise analysis showed near-perfect classification for most attack types, with minor misclassifications. High values of Cohen's Kappa and Matthews Correlation Coefficient (MCC) indicated the model's performance. Our model show that effectively mitigates emerging 6G network threats, demonstrating adaptability and generalizability while processing both IP and non-IP-based traffic. Future research will focus on optimizing the model for real-time deployment in resource-constrained WSN nodes and exploring lightweight deep learning techniques to enhance energy efficiency.
Statements
Data availability statement
The original contributions presented in the study are included in the article/supplementary material, further inquiries can be directed to the corresponding author. The datasets analyzed and utilized for this study can be found at doi: 10.21227/xtep-hv36 and 10.24432/C5D90Q.
Author contributions
WK: Methodology, Software, Writing – original draft. MU: Supervision, Writing – review & editing. MSK: Conceptualization, Methodology, Writing – original draft. OS: Funding acquisition, Project administration, Writing – review & editing. HA: Formal analysis, Funding acquisition, Project administration, Writing – review & editing. NA: Investigation, Validation, Writing – review & editing. MA: Data curation, Validation, Writing – review & editing. JA: Formal analysis, Project administration, Supervision, Writing – review & editing.
Funding
The author(s) declare that financial support was received for the research and/or publication of this article. This work was funded by Princess Nourah bint Abdulrahman University Researchers Supporting Project number (PNURSP2025R760), Princess Nourah bint Abdulrahman University, Riyadh, Saudi Arabia. The research team thanks the Deanship of Graduate Studies and Scientific Research at Najran University for supporting the research project through the Nama'a program, with the project code NU/GP/SERC/13/352-2.
Acknowledgments
The authors extend their appreciation to the Cyber-Security and Applied Resilience Center (C-SAR), the University of Dubai for supporting this research. This work was funded by Princess Nourah bint Abdulrahman University Researchers Supporting Project number (PNURSP2025R760), Princess Nourah bint Abdulrahman University, Riyadh, Saudi Arabia. The research team thanks the Deanship of Graduate Studies and Scientific Research at Najran University for supporting the research project through the Nama'a program, with the project code NU/GP/SERC/13/352-2.
Conflict of interest
The authors declare that the research was conducted in the absence of any commercial or financial relationships that could be construed as a potential conflict of interest.
Generative AI statement
The author(s) declare that no Gen AI was used in the creation of this manuscript.
Publisher’s note
All claims expressed in this article are solely those of the authors and do not necessarily represent those of their affiliated organizations, or those of the publisher, the editors and the reviewers. Any product that may be evaluated in this article, or claim that may be made by its manufacturer, is not guaranteed or endorsed by the publisher.
References
1
Agarap A. (2018). Deep learning using rectified linear units (ReLU). arXiv preprint arXiv:1803.08375. 10.48550/arXiv.1803.08375
2
Alhammadi A. Shayea I. El-Saleh A. A. Azmi M. H. Ismail Z. H. Kouhalvandi L. et al . (2024). Artificial intelligence in 6G wireless networks: opportunities, applications, and challenges. Int. J. Intell. Syst. 2024:8845070. 10.1155/2024/8845070
3
Ali T. Irfan M. Shaf A. Saeed Alwadie A. Sajid A. Awais M. et al . (2020). A secure communication in iot enabled underwater and wireless sensor network for smart cities. Sensors20:4309. 10.3390/s20154309
4
Alsubai S. Umer M. Innab N. Shiaeles S. Nappi M. (2024). Multi-scale convolutional auto encoder for anomaly detection in 6G environment. Comput. Ind. Eng. 194:110396. 10.1016/j.cie.2024.110396
5
Ankita A. Rani S. (2021). “Machine learning and deep learning for malware and ransomware attacks in 6G network,” in 2021 Fourth International Conference on Computational Intelligence and Communication Technologies (CCICT) (Sonepat: IEEE), 39–44. 10.1109/CCICT53244.2021.00019
6
Ba J. L. (2016). Layer normalization. arXiv preprint arXiv:1607.06450. 10.48550/arXiv.1607.06450
7
Chataut R. Nankya M. Akl R. (2024). 6G networks and the ai revolution–exploring technologies, applications, and emerging challenges. Sensors24:1888. 10.3390/s24061888
8
Chawla N. V. Bowyer K. W. Hall L. O. Kegelmeyer W. P. (2002). Smote: synthetic minority over-sampling technique. J. Artif. Intell. Res. 16, 321–357. 10.1613/jair.953
9
Chinnasamy P. Samrin R. Sujitha B. B. Augasthega R. Rajagopal M. Nageswaran A. (2024). Integrating intelligent breach detection system into 6G enabled smart grid-based cyber physical systems. Wirel. Pers. Commun. 1–16. 10.1007/s11277-024-11192-2
10
David K. Berndt H. (2018). 6G vision and requirements: is there any need for beyond 5G?IEEE Veh. Technol. Mag. 13, 72–80. 10.1109/MVT.2018.2848498
11
Ghani H. Salekzamankhani S. Virdee B. (2023). “Critical analysis of 5G networks' traffic intrusion using PCA, T-SNE, and umap visualization and classifying attacks,” in International Conference on Data Analytics and Management (Springer: New York), 421–437. 10.1007/978-981-99-6544-1_32
12
Gupta B. B. Chui K. T. Gaurav A. Arya V. (2023). “Deep learning based cyber attack detection in 6G wireless networks,” in 2023 IEEE 98th Vehicular Technology Conference (VTC2023-Fall) (Hong Kong: IEEE), 1–5. 10.1109/VTC2023-Fall60731.2023.10333795
13
Hadi H. J. Cao Y. Li S. Xu L. Hu Y. Li M. (2024). Real-time fusion multi-tier dnn-based collaborative idps with complementary features for secure uav-enabled 6G networks. Expert Syst. Appl. 252:124215. 10.1016/j.eswa.2024.124215
14
Hochreiter S. Bengio Y. Frasconi P. Schmidhuber J. (2001). “Gradient flow in recurrent nets: the difficulty of learning long-term dependencies,” in A Field Guide to Dynamical Recurrent Neural Networks. IEEE Press.
15
Howard A. G. Zhu M. Chen B. Kalenichenko D. Wang W. Weyand T. et al . (2017). Mobilenets: efficient convolutional neural networks for mobile vision applications. arXiv preprint arXiv:1704.04861. 10.48550/arXiv.1704.04861
16
Islam A. Chang S.-Y. Kim J. Kim J. (2024). “Anomaly detection in 5G using variational autoencoders,” in 2024 Silicon Valley Cybersecurity Conference (SVCC) (IEEE), 1–6. 10.1109/SVCC61185.2024.10637312
17
Kulkarni R. Kulkarni S. (2021). How 6G has an influence on smart cities: an overview. Int. J. Eng. Res. Technol10, 258–275. 10.17577/IJERTV10IS050447
18
Kumar M. Goyal N. Qaisi R. M. A. Najim M. Gupta S. K. (2022). Game theory based hybrid localization technique for underwater wireless sensor networks. Trans. Emerg. Telecommun. Technol. 33:e4572. 10.1002/ett.4572
19
Liu M. Ren S. Ma S. Jiao J. Chen Y. Wang Z. et al . (2021). Gated transformer networks for multivariate time series classification. arXiv preprint arXiv:2103.14438. 10.48550/arXiv.2103.14438
20
Makris I. Ntampakis N. Lagkas T. Radoglou-Grammatikis P. Goudos S. K. Argyriou V. et al . (2023). “Elevating 5G network security: a profound examination of federated learning aggregation strategies for attack detection,” in 2023 IEEE Future Networks World Forum (FNWF) (Baltimore, MD: IEEE), 1–6. 10.1109/FNWF58287.2023.10520474
21
Mirsky Y. Doitshman T. Elovici Y. Shabtai A. (2018). Kitsune: an ensemble of autoencoders for online network intrusion detection. arXiv preprint arXiv:1802.09089. 10.14722/ndss.2018.23204
22
Moustafa N. Slay J. (2015). “UNSW-NB15: a comprehensive data set for network intrusion detection systems (UNSW-NB15 network data set),” in 2015 Military Communications and Information Systems Conference (MilCIS) (Canberra, ACT: IEEE), 1–6. 10.1109/MilCIS.2015.7348942
23
Murroni M. Anedda M. Fadda M. Ruiu P. Popescu V. Zaharia C. et al . (2023). 6G–enabling the new smart city: a survey. Sensors23:7528. 10.3390/s23177528
24
Oleiwi H. W. Mhawi D. N. Al-Raweshidy H. (2023). A meta-model to predict and detect malicious activities in 6G-structured wireless communication networks. Electronics12:643. 10.3390/electronics12030643
25
Pant P. Kumar A. Vashishtha L. K. Dash S. Ray N. K. Sahu S. K. (2024). “A comparative study of deep learning techniques for network intrusion detection,” in 2024 International Conference on Emerging Systems and Intelligent Computing (ESIC) (Bhubaneswar: IEEE), 722–727. 10.1109/ESIC60604.2024.10481540
26
Paolini E. Valcarenghi L. Maggiani L. Andriolli N. (2023). Real-time clustering based on deep embeddings for threat detection in 6G networks. IEEE Access. 11, 115827–115835. 10.1109/ACCESS.2023.3325721
27
Park C. Park K. Song J. Kim J. (2023). “Distributed learning-based intrusion detection in 5G and beyond networks,” in 2023 Joint European Conference on Networks and Communications and 6G Summit (EuCNC/6G Summit) (Gothenburg: IEEE), 490–495. 10.1109/EuCNC/6GSummit58263.2023.10188312
28
Pennanen H. Hänninen T. Tervo O. Tölli A. Latva-aho M. (2024). 6G: the intelligent network of everything-a comprehensive vision, survey, and tutorial. arXiv preprint arXiv:2407.09398. 10.1109/ACCESS.2024.3521579
29
Rana P. Batra I. Malik A. Imoize A. L. Kim Y. Pani S. K. et al . (2022). Intrusion detection systems in cloud computing paradigm: analysis and overview. Complexity2022:3999039. 10.1155/2022/3999039
30
Rifa-Pous H. Garcia-Font V. Nunez-Gomez C. Salas J. (2024). Security, trust and privacy challenges in ai-driven 6G networks. arXiv preprint arXiv:2409.10337. 10.5121/csit.2024.141408
31
Saeed M. M. Saeed R. A. Abdelhaq M. Alsaqour R. Hasan M. K. Mokhtar R. A. (2023). Anomaly detection in 6G networks using machine learning methods. Electronics12:3300. 10.3390/electronics12153300
32
Samarakoon S. Siriwardhana Y. Porambage P. Liyanage M. Chang S.-Y. Kim J. et al . (2022). 5G-Nidd: a comprehensive network intrusion detection dataset generated over 5G wireless network. arXiv preprint arXiv:2212.01298. 10.48550/arXiv.2212.01298
33
Shahraki A. Abbasi M. Piran M. J. Taherkordi A. (2021). A comprehensive survey on 6G networks: applications, core services, enabling technologies, and future challenges. arXiv preprint arXiv:2101.12475. 10.48550/arXiv.2101.12475
34
Sharafaldin I. Lashkari A. H. Ghorbani A. A. (2018). Toward generating a new intrusion detection dataset and intrusion traffic characterization. ICISSp1:108–116. 10.5220/0006639801080116
35
Sharma C. Sharma K. Kumar M. Garg P. Goyal N. (2023). “Open-source gesture-powered augmented reality-based remote assistance tool for industrial application: challenges and improvisation,” in International Conference on Emergent Converging Technologies and Biomedical Systems (Springer: New York), 337–347. 10.1007/978-981-99-8646-0_27
36
Sharma S. Popli R. Singh S. Chhabra G. Saini G. S. Singh M. et al . (2024). The role of 6G technologies in advancing smart city applications: opportunities and challenges. Sustainability16:7039. 10.3390/su16167039
37
Singh P. R. Singh V. K. Yadav R. Chaurasia S. N. (2023). 6G networks for artificial intelligence-enabled smart cities applications: a scoping review. Telemat. Inform. Rep. 9:100044. 10.1016/j.teler.2023.100044
38
Suomalainen J. Ahmad I. Shajan A. Savunen T. (2025). Cybersecurity for tactical 6G networks: threats, architecture, and intelligence. Future Gener. Comput. Syst. 162:107500. 10.1016/j.future.2024.107500
39
Szegedy C. Liu W. Jia Y. Sermanet P. Reed S. Anguelov D. et al . (2015). “Going deeper with convolutions,” in 2015 IEEE Conference on Computer Vision and Pattern Recognition (CVPR) (Boston, MA: IEEE), 1–9. 10.1109/CVPR.2015.7298594
40
Tripi G. Iacobelli A. Rinieri L. Prandini M. (2024). Security and trust in the 6G era: risks and mitigations. Electronics13:2162. 10.3390/electronics13112162
41
Vaswani A. Shazeer N. Parmar N. Uszkoreit J. Jones L. Gomez A. et al . (2017). “Attention is all you need,” in Advances in Neural Information Processing Systems, Vol. 30, eds. I. Guyon, U. Von Luxburg, S. Bengio, H. Wallach, R. Fergus, S. Vishwanathan, et al. (Curran Associates, Inc.). Avilable online at: https://proceedings.neurips.cc/paper_files/paper/2017/file/3f5ee243547dee91fbd053c1c4a845aa-Paper.pdf
42
You C. Cai Y. Liu Y. Di Renzo M. Duman T. M. Yener A. et al . (2024). Next generation advanced transceiver technologies for 6G. arXiv preprint arXiv:2403.16458. 10.1109/JSAC.2025.3536557
43
Zelichenok I. Kotenko I. (2024). “Kitsune dataset analysis via bigdata and deep learning techniques,” in 2024 IEEE Ural-Siberian Conference on Biomedical Engineering, Radioelectronics and Information Technology (USBEREIT) (IEEE), 152–155. 10.1109/USBEREIT61901.2024.10584030
44
Zhang Z. Cao Y. Cui Z. Zhang W. Chen J. (2021). A many-objective optimization based intelligent intrusion detection algorithm for enhancing security of vehicular networks in 6G. IEEE Trans. Veh. Technol. 70, 5234–5243. 10.1109/TVT.2021.3057074
Summary
Keywords
6G, wireless sensor networks, smart cities, multi-deep learning, intrusion detection, anomaly detection, transformer encoder, convolutional neural network
Citation
Khan W, Usama M, Khan MS, Saidani O, Al Hamadi H, Alnazzawi N, Alshehri MS and Ahmad J (2025) Enhancing security in 6G-enabled wireless sensor networks for smart cities: a multi-deep learning intrusion detection approach. Front. Sustain. Cities 7:1580006. doi: 10.3389/frsc.2025.1580006
Received
20 February 2025
Accepted
24 April 2025
Published
26 May 2025
Volume
7 - 2025
Edited by
Salil Bharany, Chitkara University, India
Reviewed by
Ali Sarrafi Nik, Islamic Azad University, Iran
Nitin Goyal, Central University of Haryana, India
Updates
Copyright
© 2025 Khan, Usama, Khan, Saidani, Al Hamadi, Alnazzawi, Alshehri and Ahmad.
This is an open-access article distributed under the terms of the Creative Commons Attribution License (CC BY). The use, distribution or reproduction in other forums is permitted, provided the original author(s) and the copyright owner(s) are credited and that the original publication in this journal is cited, in accordance with accepted academic practice. No use, distribution or reproduction is permitted which does not comply with these terms.
*Correspondence: Mohammed S. Alshehri msalshehry@nu.edu.sa
Disclaimer
All claims expressed in this article are solely those of the authors and do not necessarily represent those of their affiliated organizations, or those of the publisher, the editors and the reviewers. Any product that may be evaluated in this article or claim that may be made by its manufacturer is not guaranteed or endorsed by the publisher.