Abstract
Introduction:
Understanding the synergies and trade-off between the economy, ecological environment, and water resources is crucial to realizing the transformation and sustainable development of resource-based cities (RBCs).
Methods:
In order to identify and evaluate the situation, spatio-temporal characteristics, and impact factors of the regional water–economy–ecology (WEE) nexus, this study builds an evaluation indicators system of coupling coordinated development for the WEE nexus, and employs multiple methods including spatial analysis and the Tobit model. Panel data from 2010 to 2021 of six RBCs in Shaanxi, China are the basis for this study.
Results and discussion:
The results show that RBCs in Shaanxi have seen an overall upward trend in the development of their water economies and environments in recent years. The fundamental issue facing RBCs in Shaanxi is uneven and inadequate development. The coupling coordination levels of RBCs have increased, albeit at varying rates, and most are in the primary coordination stage. The ecological environment, industrial structure, scientific and technical innovation, economic development, and industrial structure are all beneficial; the urbanization rate, however, has not met the significance test. This study adds to the knowledge body regarding the development of RBCs worldwide and aids scholars and practitioners in understanding the development of RBCs in China.
1 Introduction
Cities whose primary economic activities revolve around the extraction, processing, and utilization of natural resources are classified as resource-based cities, and they have played a vital role in driving both economic growth and urban development (Hu and Yang, 2018; Wang et al., 2024). However, RBCs also face challenges such as single industrial structures, severe environmental pollution, and a low degree of urban governance (Long et al., 2021). Over-reliance on non-renewable resources causes industrial efficiency to decrease as natural resource extraction moves to a later stage (Wang, 2022). This leads to an urban economic downturn, a dramatic reduction in employee pay and employment, and what is generally referred to as the “resource trap” (Li et al., 2013). RBCs are in urgent need of transformation and sustainable development. The National Plan for Sustainable Development of Resource-Based Cities (2013–2020) issued by the Chinese government identifies 262 RBCs, divides them into four types–including growth, maturity, decline, and regeneration–and proposes the development direction for each type. A targeted long-term approach to transformational development must be studied due to the industry, type, and spatial variations among RBCs nationwide (Li Q. et al., 2021). Therefore, it is crucial to evaluate the present and future growth of RBCs at the regional level.
Shaanxi is a Chinese province rich in mineral resources. By the end of 2016, 92 different types of mineral reserves had been discovered in Shaanxi, and their combined potential worth, which ranked first in the nation, was 46.23 trillion yuan (Figure 1). Shaanxi has 10 prefecture-level cities, of which six are RBCs, namely Yan'an, Tongchuan, Weinan, Xianyang, Baoji, and Yulin. These six cities are also research objects of this study. According to the national policy, Yan'an, Xianyang, and Yulin belong to the growth city; Weinan and Baoji are mature cities; and Tongchuan is a declining city. The majority of the six RBCs in Shaanxi are coal cities, which are significant energy hubs for China due to their abundance of coal, oil, and natural gas. However, the six RBCs lack water resources. Shaanxi is located in western China, facing a shortage of water resources and the unequal distribution of water for a long time; 70% of its water resources are concentrated in southern Shaanxi, and its per capita water resource is only about half the national average. The rapid growth of energy and chemical enterprises, along with Shaanxi's social and economic development and urbanization, has resulted in a proliferation of projects with high pollution, high water consumption, and high energy consumption, leading to further shortage of water resources and worsening pollution (Yang Y. et al., 2023; Yang Z. et al., 2023). The ecological environment and water resources have emerged as significant challenges to the transformation and sustainable development of RBCs in Shaanxi. Economic development is the foundation of water and ecology development, and the economy can provide strong support for improving water and the ecological environment (Li and Dewan, 2017). On the other hand, economic activities depend on the support of ecological resources, and water and ecological development are also the driving forces of economic growth (Yan et al., 2019). However, the synergies and trade-offs between water resources, economy, and ecological environment in RBCs remain unclear. Therefore, exploring the coupling coordinated development of the WEE nexus is of great significance for realizing the transformational development of RBCs in Shaanxi and also has reference value for the sustainable development of RBCs in other regions and countries.
Figure 1

Location and mineral resources of Shaanxi.
Specifically, this study aims to answer the following research questions: How is the development of the WEE nexus in RBCs in Shaanxi? What kind of spatial and temporal characteristics does it have? What factors are influenced by it? To address these problems, this study takes the RBCs in Shaanxi as the typical case to conduct a quantitative study on the synergies and trade-offs of the WEE nexus by constructing an evaluation indicator system, as well as on diverse methods, including the entropy method, coupling coordination degree model, and the Tobit model. The contribution of this study is multifold. This study not only enriches the existing knowledge body of RBCs but also helps optimize the transformational development policy of RBCs in Shaanxi and China. In addition, this study helps global scholars and practitioners to further understand the development of RBCs in China.
Structurally, this article consists of five sections and is organized as follows. After this introduction, Section 2 reviews the progress of the RCB research. Section 3 describes the data it relies on, the research method it deploys, and the analytical model it adopts for this study. Section 4 demonstrates and discusses the results. Section 5 concludes and draws out some of the policy implications.
2 Literature review
The transformational development of RBCs is a common challenge facing the world. RBCs are highly dependent on non-renewable resources such as minerals, and the depletion of these resources leads to urban decline and transformation (Takatsuka et al., 2015). Global climate change exacerbates environmental pressures (Pani, 2009). For example, urbanization in the Mekong River region has led to an increased risk of flooding. On the other hand, RBCs are often caught in the “resource curse”, where over-reliance on traditional industries creates barriers to innovation and transformation (Gao et al., 2023).
Globally, a great deal of research has been conducted on RBCs. Early research examined the connection between resource availability and economic growth (He et al., 2022; Kuai et al., 2015; Li Y. et al., 2021). Research on RBCs has shifted its focus to sustainable development since the turn of the 21st century. Scholars are committed to seeking the development path and theoretical model of RBCs with coordinated multi-elements, such as resource exploitation, regional development, community construction, and environmental protection (Chen S. et al., 2023; Chen Y. et al., 2023; He et al., 2021; Song W. et al., 2022; Yan et al., 2019; Yang et al., 2022). Furthermore, a great deal of research has been conducted on the cycle of development and its causes, ecology and economy, transformation and sustainable development, spatial organization, and resource-based city optimization (Chen S. et al., 2023; Chen Y. et al., 2023; Li et al., 2023; Ruan et al., 2021; Song Y. et al., 2022; Wang D. et al., 2021; Wang Q. et al., 2021; Wu et al., 2022; Zhao F. et al., 2023).
Owing to RBC research being predicated on finding solutions to key issues in the process of development and transformation, it places a greater emphasis on the empirical method. A descriptive study focused on qualitative analysis made up the bulk of the early work. The entropy method, ecological footprint analysis, balanced scorecard, and key performance indicators are examples of empirical research that gradually emerged later on and were based on quantitative calculations (Guo et al., 2022; Li et al., 2020; Wang et al., 2020; Wang, 2022; Yang Y. et al., 2023; Yang Z. et al., 2023; Zhang H. et al., 2022). These studies were primarily focused on the area of economic development, especially the study of industrial structure adjustment (Li et al., 2013; Wang et al., 2023; Xie et al., 2020).
The transformation of resource-based cities is a complex, multifaceted process that often involves a shift from a single industry or resource dependency to more diversified economic structures (Hou et al., 2019). There are also several scholars who have conducted a lot of research in the development pathways of RBCs, with potential key measures including the use of green technologies to build a circular economic system, the digital economy to empower industrial upgrading, inclusive urbanization, and collaborative governance by multiple actors (Haustein and Lorson, 2023; Musango et al., 2017; Yusuf et al., 2024). Typical examples include the Ruhr in Germany, which has utilized its industrial heritage to develop cultural tourism while at the same time developing new industries such as hydrogen energy and forming a “brownfield regeneration” model (Berkenbosch et al., 2022). South Africa has adopted an inclusive policy to alleviate the contradiction in the resettlement of miners (Ehrlich, 2012). Saar-Lor-Lux Euro-Region has realized industrial upgrading by integrating into the EU industrial chain (Kovalev et al., 2020). The experiences of global RBCs transformation show that, on the one hand, it is necessary to choose differentiated paths and tailored policies based on local advantages. On the other hand, the transformation of global RBCs is the result of the synergistic effect of resource endowment, policy innovation, technological revolution, and social demand.
3 Materials and methods
3.1 Constructing the evaluation indicators system
Shaanxi is a major energy province and an important energy exporter in China. The six RBCs mainly rely on the large-scale exploitation of mineral resources. However, with the long-term development of resources, resources are depleted, the development of alternative industries is slow, and the ecological environment is deteriorating, which affects the sustainable development and transformation development of RBCs.
In addition to being a necessary resource for social and economic advancement and preserving the natural environment, water is fundamental to human survival and growth (Dolan et al., 2021). Mining and resource extraction industries need a lot of water. Shaanxi is a western province with a severe water resource shortage, which presents significant obstacles to the growth and transformation of RBCs in the region. The government has been paying more and more attention to ecological and environmental issues brought on by long-term resource development. On the one hand, swift economic growth provides a strong basis for the development of water resources and the preservation of the environment. On the other hand, natural resources and water resources are necessary for economic activity to occur (Zhang et al., 2018). There is a significant interaction between water, economy, and ecology that influences RBCs' ability to develop sustainably. To achieve the sustainable development of RBCs, it is crucial to encourage the coupling coordinated development of the WEE nexus.
Based on the principles of representativeness and accuracy in selecting indicators, this study constructs an evaluation indicator system for the coupling coordinated development of the WEE nexus, including 15 indicators from three dimensions (Figure 2). The water subsystem selected five indicators, including total water resources, per capita water consumption, industrial water proportion, total industrial wastewater discharge, and water consumption of 10,000 yuan GDP. The economic subsystem selects five indicators: gross regional product (GDP), GDP per capita, total wages of employees, the proportion of secondary industry in GDP, and the general budget revenue of local finance. The ecological subsystem selected five indicators, including per capita public green space, green coverage rate of built-up areas, industrial sulfur dioxide emissions, harmless treatment rate of household garbage, and centralized treatment rate of wastewater plants.
Figure 2
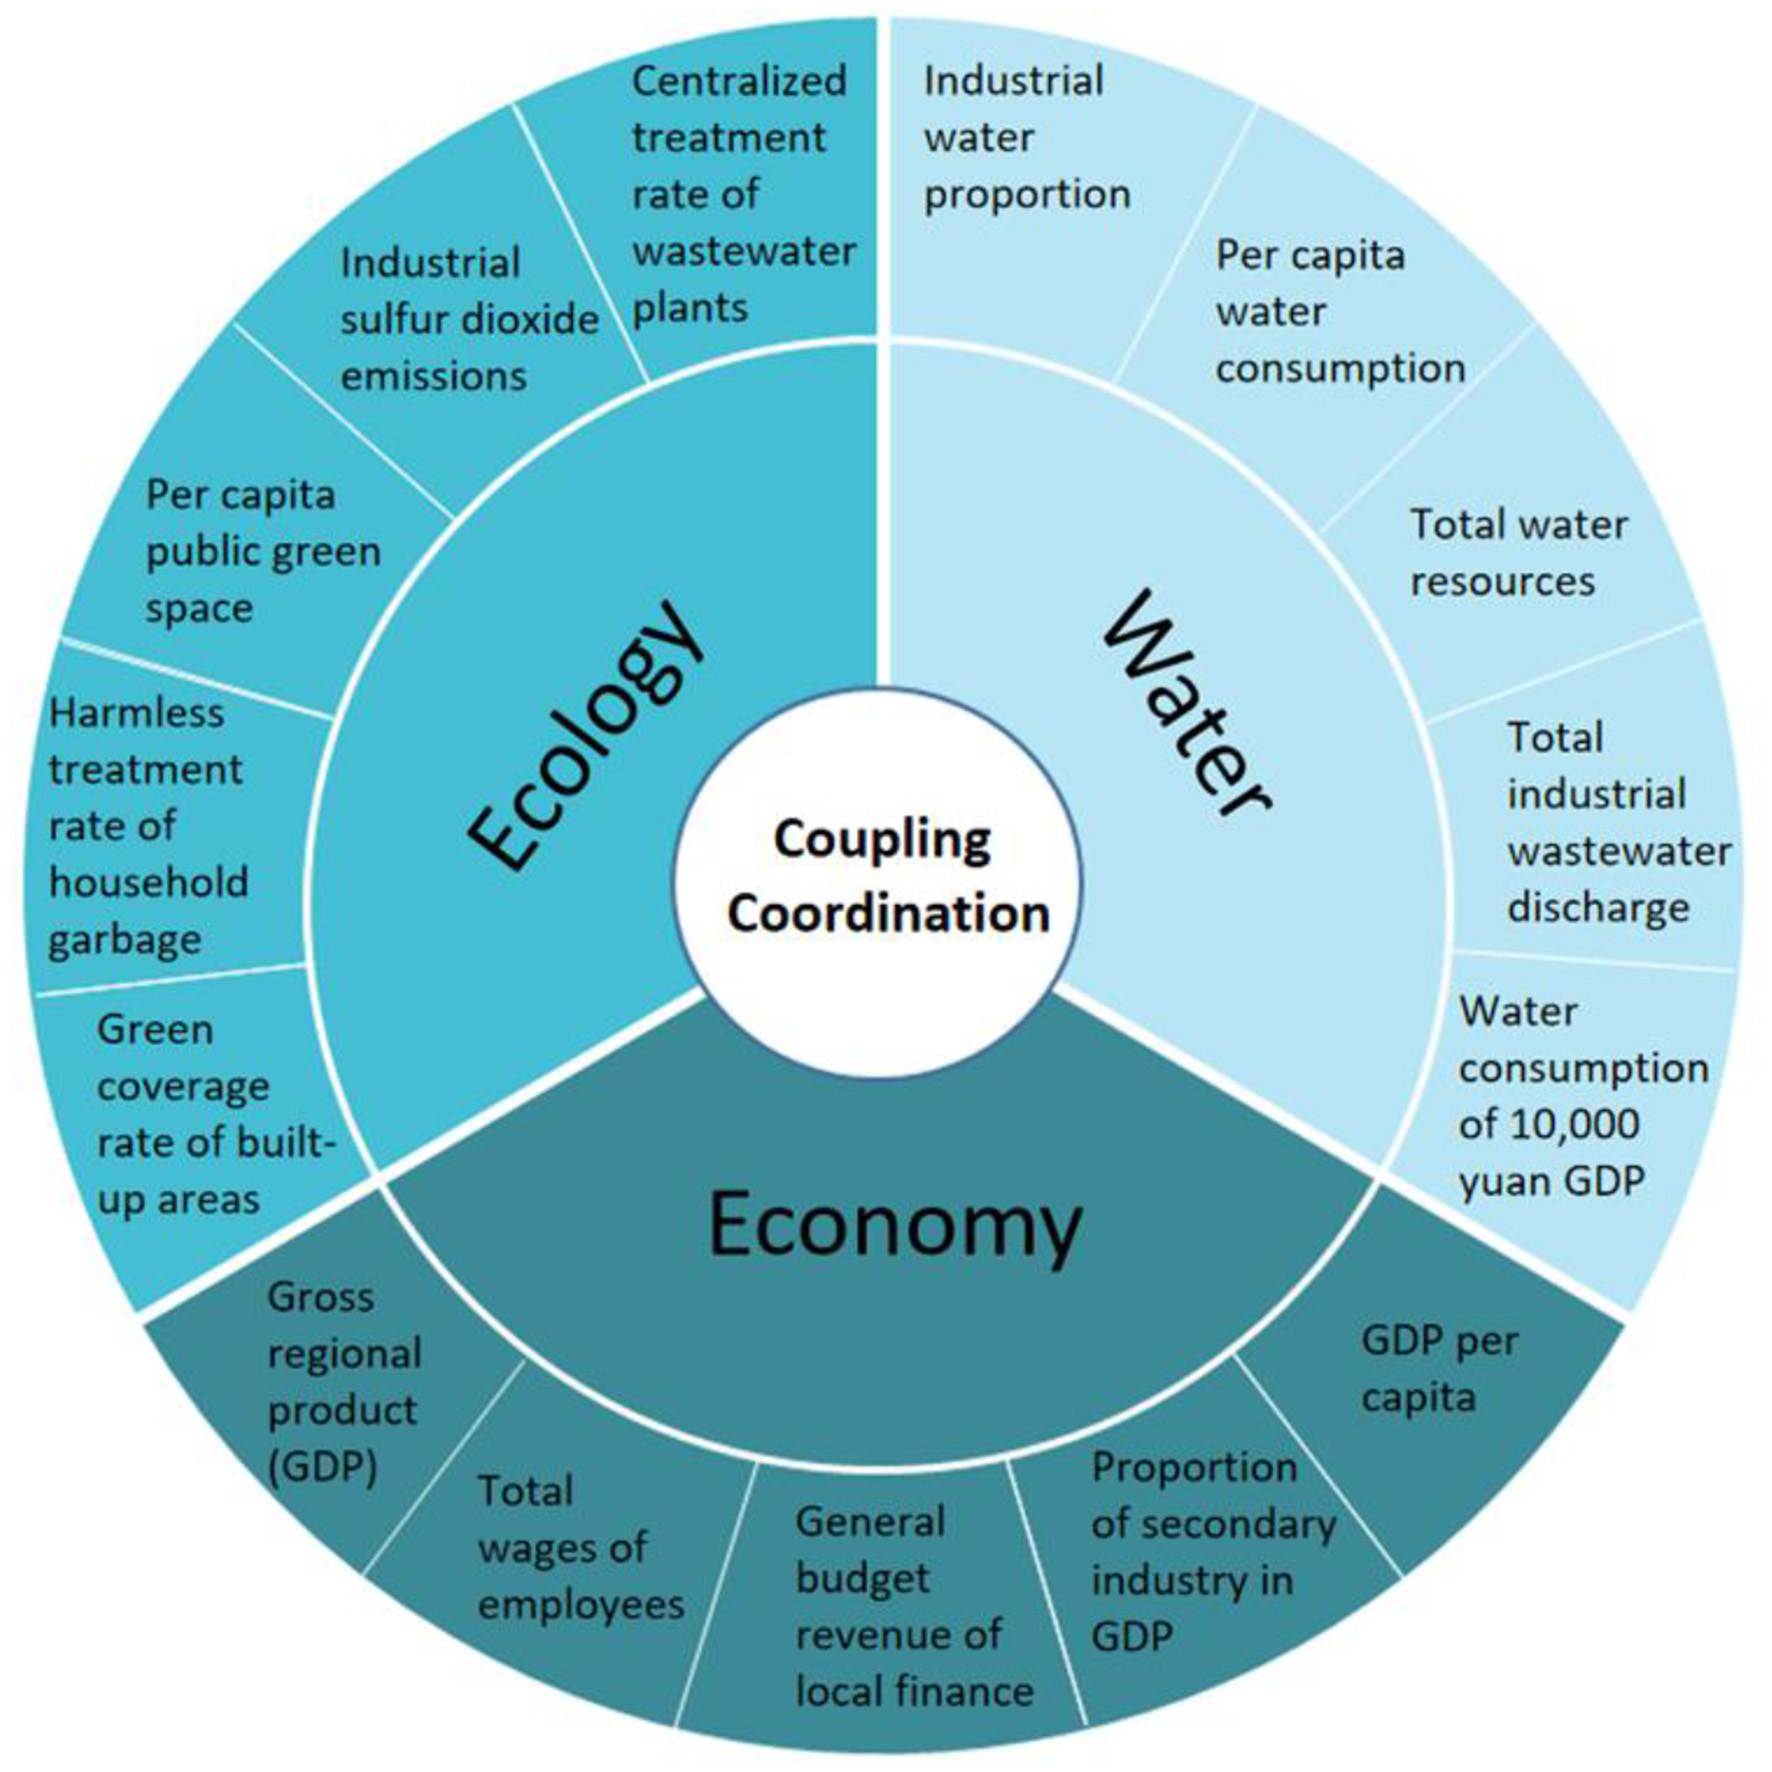
Evaluation indicators system of the water–economy–ecology nexus.
3.2 Methods
3.2.1 Entropy method
The objective weight method of the entropy method is selected to ascertain the weight of indicators. The amount of information can be measured using the entropy approach, which reflects the degree of information technology disorder (Wu et al., 2021). The order and efficacy of the information can be expressed using the entropy value, which can lessen the influence of human factors on the weights of the assessment indexes and increase the accuracy of the evaluation results.
The process is as shown in Equations 1 and 2.
Equation 3 shows the normalization of the indicators.
Equations 4 and 5 are used to calculate the information entropy and redundancy.
Equation 6 calculates the weight of the ith indicator.
After obtaining the weights of indicators, Equation 7 can be used to calculate the development of the subsystem.
where there are m years, n cites, ε is the number of indicators, 0 ≤ ej ≤ 1,k = 1/lnmn, mn = 110, and Xijt denotes the value of the jth indicators of province i in year t.
The weights of indicators are presented in Table 1. The calculation results show that the weight of the total water resources is the highest, which indicates the key role of water resources in the sustainable development of RBCs. Local general budgetary revenue ranks second, indicating the fundamental role of the economy.
Table 1
| System | Indicators | Attribute | Weight |
|---|---|---|---|
| Water | Total water resources | + | 0.499 |
| Per-capita water consumption | + | 0.328 | |
| Industrial water as a percentage of water use | - | 0.049 | |
| Total volume of industrial wastewater discharged | - | 0.061 | |
| Water consumption per 10,000 yuan of GDP | - | 0.063 | |
| Economy | Gross domestic product | + | 0.045 |
| Per-capita GDP | + | 0.214 | |
| Total wages bill | + | 0.120 | |
| Secondary industry as a percentage of GDP | + | 0.195 | |
| Local general budgetary revenue | + | 0.426 | |
| Ecology | Public recreational green space | + | 0.289 |
| Green coverage rate of the built district | + | 0.235 | |
| Volume of industrial sulfur dioxide emission | - | 0.244 | |
| Domestic garbage harmless treatment rate | + | 0.122 | |
| Centralized treatment rate of wastewater plants | + | 0.111 |
Weight of the coupling coordination indicator system of the water–economy–ecology nexus.
3.2.2 Coupling coordination degree model
Coupling is a phenomenon of interaction between two or more systems, which originated in physics (Zhao X. et al., 2023). The coupling coordination degree is a quantitative index to describe the synergy between subsystems, which reflects the coordination between two or more systems and the sustainable development of a region (Cheng et al., 2023a). The water, economy, and ecology systems affect and restrict each other to promote regional sustainable development, so the coupling coordination degree model is used to judge the coupling coordination development of the WEE nexus.
Coupling coordination degree D is composed of coupling degree C and coordination degree T, as determined by Equation 8.
The coupling degree C can reflect the interaction between the subsystems. The larger the value of C, the stronger the coupling degree between the subsystems. Equation 9 can be used to calculate coupling degree C.
Equation 10 is used to calculate T for the coordination degree.
where α, β and γ are parameters to be determined, α + β + γ = 1. Considering that the subsystems of water, economy, and ecology are equally important in the coupling coordinated development, α, β, and γ are taken as one-third. Based on the existing classification standards of coupling coordination degree, this study divides the coupling coordination degree into 10 levels (Table 2).
Table 2
| Value | Coupling coordination degree |
|---|---|
| (0.0–0.1) | Extreme disorder |
| [0.1–0.2) | Severe disorder |
| [0.2–0.3) | Moderate disorder |
| [0.3–0.4) | Mild disorder |
| [0.4–0.5) | Near disorder |
| [0.5–0.6) | Barely coordination |
| [0.6–0.7) | Primary coordination |
| [0.7–0.8) | Intermediate coordination |
| [0.8–0.9) | Good coordination |
| [0.9–1.0) | Quality coordination |
Coupling coordination degree of the water–economy–ecology nexus.
3.2.3 Tobit model
Since the coupling coordination degree of the WEE is a non-negative random variable between [0,1], it does not meet the prerequisite of normal distribution of explained variables in linear regression (ordinary least square, OLS). This study selects the Tobit model to evaluate the factors influencing the coupling coordinated development of the WEE nexus in Shaanxi's RBCs. The Tobit model (Equation 11), also known as the restricted regression model, is a regression method first proposed by American scholar Tobin in 1958 and is widely applied in the field of econometrics (Amemiya, 1984).
where i denotes six RBCs in Shaanxi, t denotes time, and D denotes the coupling coordination degree of the WEE nexus.
The trade is the total value of import and export, using the indicator to measure openness, the higher the level of openness, the larger the domestic and foreign consumer market, and the more development of the coupling coordinated development of the WEE nexus (Li and Dewan, 2017).
The urban is the urbanization rate, and the urbanization process is an important external factor affecting the coupling coordinated development of the WEE nexus. With the improvement of urbanization and the increase in urban population, residents' income and labor productivity will be improved, and the urban economy will be developed, but the damage to the environment will also increase (Yang Y. et al., 2023; Yang Z. et al., 2023).
The inn is the number of patents granted; scientific and technological innovation is an important guarantee to promote the coupling coordinated development of the WEE nexus, and the number of patents authorized can reflect the transformation ability of enterprises' scientific research achievements (Zhang M. et al., 2022).
The pgdp is the per capita GDP, and the economy is the key driving factor to promote the rational utilization of water resources and strengthen the construction of ecological protection (Chen S. et al., 2023; Chen Y. et al., 2023). The higher the regional economic development, the higher the coupling coordination degree of the WEE nexus.
The ind is the industrial structure; the evolution of the industrial structure has a critical effect on improving the coupling coordination degree of the WEE nexus (Tan et al., 2020). This study selects the proportion of secondary industries with high energy consumption and high pollution to measure the industrial structure.
The water is the per capita water consumption; the increase in water consumption will lead to the shortage of water resources, especially in RBCs, which will affect the coupling coordinated development of the WEE nexus (Cheng et al., 2023b).
The gre is the green coverage rate of built-up areas; the indicator reflects the ecological environment quality of a city. The improvement of the ecological environment will drive the coupling coordinated development of the WEE nexus (Chen et al., 2019).
The μ is the error term, α0,ss1,ss2,ss3,ss4,ss5,ss6, and ss7 are the parameters to be estimated (Table 3).
Table 3
| Variables | Symbols | Description | |
|---|---|---|---|
| Dependent variable | Coupling coordination degree | D | Results of the coupling coordination model |
| Independent variable | Opening | trade | Total import and export |
| Urbanization | urban | Share of urban population in the total population | |
| Water development | water | Per-capita water consumption | |
| Economic development | pgdp | Per-capita GDP | |
| Scientific and technological innovation | inn | The number of patents granted | |
| Industrial structure | ind | Secondary industry as a percentage of GDP | |
| Ecological environment | gre | Green coverage rate of the built district |
Variables of the coupling coordination development of the water–economy–ecology nexus.
3.3 Data sources
The research data came from the China Knowledge Network (https://www.cnki.net/), China Statistical Yearbook (https://www.stats.gov.cn/sj/ndsj/), Shaanxi Statistical Yearbook (http://tjj.shaanxi.gov.cn/tjsj/ndsj/tjnj/), China Social Statistical Yearbook (https://www.stats.gov.cn/sj/tjgb/ndtjgb/), China Urban and Rural Construction Statistical Yearbook (https://www.mohurd.gov.cn/gongkai/fdzdgknr/sjfb/tjxx/jstjnj/index.html), and Shaanxi Water Resources Bulletin (http://slt.shaanxi.gov.cn/zfxxgk/fdzdgknr/zdgz/szygb/). All years are from 2010 to 2021. In data processing, there are a few missing data, which are supplemented by the interpolation method. The descriptive statistical results of the variables are shown in Table 4.
Table 4
| Variables | Samples | Mean | S.D. | Min. | Max. |
|---|---|---|---|---|---|
| Coupling coordination degree | 72 | 0.559 | 0.151 | 0.249 | 0.913 |
| Opening | 72 | 11.009 | 1.819 | 6.194 | 14.215 |
| Urbanization | 72 | 3.943 | 0.170 | 3.453 | 4.162 |
| Water development | 72 | 5.226 | 0.380 | 4.549 | 5.779 |
| Economic development | 72 | 10.770 | 0.462 | 9.626 | 11.918 |
| Scientific and technological innovation | 72 | 6.411 | 1.155 | 4.025 | 8.796 |
| Industrial structure | 72 | 4.037 | 0.185 | 3.553 | 4.298 |
| Ecological environment | 72 | 3.672 | 0.062 | 3.477 | 3.809 |
Variable descriptive statistics.
4 Results and discussion
4.1 Overall evaluation
According to the adopted methodology, this study measured the comprehensive and subsystem evaluation index of the WEE nexus of resource cities in Shaanxi from 2010 to 2021; and limited to space, this study only selected the data for 2015, 2017, 2019, and 2021 to analyze and interpret. The specific results of the three subsystems are shown in Table 5.
Table 5
| Cities | Water | Economy | Ecology | |||||||||
|---|---|---|---|---|---|---|---|---|---|---|---|---|
| 2015 | 2017 | 2019 | 2021 | 2015 | 2017 | 2019 | 2021 | 2015 | 2017 | 2019 | 2021 | |
| Baoji | 0.471 | 0.543 | 0.556 | 0.842 | 0.303 | 0.331 | 0.329 | 0.369 | 0.720 | 0.753 | 0.758 | 0.854 |
| Tongchuan | 0.179 | 0.181 | 0.187 | 0.240 | 0.161 | 0.156 | 0.125 | 0.168 | 0.727 | 0.669 | 0.711 | 0.743 |
| Weinan | 0.436 | 0.461 | 0.463 | 0.597 | 0.223 | 0.236 | 0.226 | 0.262 | 0.458 | 0.705 | 0.709 | 0.821 |
| Xianyang | 0.313 | 0.360 | 0.306 | 0.350 | 0.297 | 0.304 | 0.283 | 0.340 | 0.772 | 0.795 | 0.798 | 0.825 |
| Yan'an | 0.228 | 0.256 | 0.256 | 0.355 | 0.363 | 0.353 | 0.410 | 0.441 | 0.659 | 0.688 | 0.756 | 0.722 |
| Yulin | 0.442 | 0.497 | 0.505 | 0.615 | 0.508 | 0.579 | 0.722 | 0.938 | 0.675 | 0.639 | 0.760 | 0.789 |
| Mean | 0.345 | 0.383 | 0.379 | 0.500 | 0.309 | 0.327 | 0.349 | 0.420 | 0.669 | 0.708 | 0.749 | 0.792 |
Evaluation results of water, economy, and ecology.
In the subsystem of water, each city showed an overall upward trend during the study period. Baoji has made a good trend in water resources development and protection, and the value has increased from 0.471 in 2015 to 0.842 in 2021. Tongchuan has a poor situation of water resources development, which has been between 0.179 and 0.240 for a long time. Tongchuan is a resource-based water-scarce city with a large number of industrial and mining enterprises, a serious shortage of water resources, frequent occurrences of water pollution incidents, and a prominent contradiction between the supply and demand of water.
In the subsystem of the economy, the development gap between cities is widening. The economy of Yulin is relatively well developed, with an increase of 0.4295 in 2021 compared to 2015, with the value rising from 0.508 to 0.938, an increase of 84.50%. The gap between Yulin, with the highest economic level, and Tongchuan, with the lowest, was 0.347 in 2015. In 2021, Tongchuan, with the lowest economic level, will have an economic level of only 0.168, a difference of up to 0.77, while Yulin, with the highest economy, has a difference of 0.77.
In the subsystem of ecology, all six cities showed a trend of steady increase, indicating that China's sustainable development has achieved positive results in recent years. From 2017 to 2019, except for Yulin and Yan'an, the economic growth of other cities was not very good. During this period, the development level of water and ecology was mediocre, which indicates that economic growth plays an important driving role in water resource utilization and ecological protection.
The development of subsystems in the six RBCs shows significant spatial heterogeneity. The subsystems in Yulin and Baoji are more balanced and on a positive trend. The economic subsystem of Baoji in 2015, 2017, 2019, and 2021 was weaker than that of Yulin, but the growth rate of Baoji was higher than that of Yulin. The potential reason may lie in the rapid development of industrialization in Baoji and the continuous upgrading of the industry. The advantage of Yulin is that it has rich mineral resources and chemical enterprises. The economic subsystem of Weinan is relatively backward, and the subsystems of water and ecology are rising gradually. The economic subsystem of Xianyang shows an “M-type” fluctuation change, and the water and ecology are in a steady rising state. The development of the water and economic subsystems of Yan'an city has increased to different degrees, and the ecological index is mostly developing.
4.2 Evolution characteristics
The results of the coupling coordination degree of the WEE nexus of RBCs in Shaanxi are shown in Figure 3. Overall, RBCs in Shaanxi are basically in the state of primary coordination. From 2010 to 2021, the coupling coordination degree of six cities showed an oscillating upward trend, and its value ranged from 0.249 to 0.913. There is still a lot of upward space for the coupled coordination degree of six cities. The differences in location, economy, society, and resources across cities lead to the spatial differences in the coupling coordination of the WEE nexus.
Figure 3
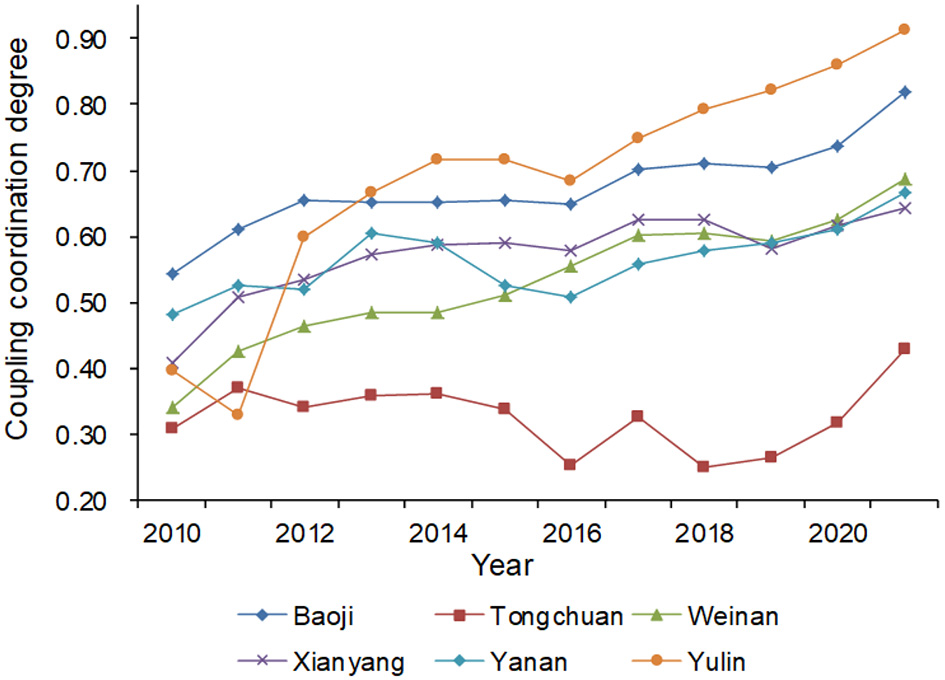
Coupling coordination degree of resource-based cities in Shaanxi.
The variation difference in the coupling coordination degree of each city was significant. The coupling coordination degree is higher in Yulin and Yan'an. In particular, Yulin is in a leading position. Since 2019, Yulin's WEE nexus has been upgraded from good coordination to quality coordination, and it is the only region that has achieved quality coordination at present. On the contrary, Tongchuan was in the mild imbalance stage during the study period, which highlighted the lagging development of the water resources subsystem in general and restricted the development of the WEE nexus coupling coordination.
The coupling coordination degree declined in 2015–2016 and rebounded in 2017. The reason may lie in the increased downward pressure on the domestic economy in 2015, which seriously constrained the development of the WEE nexus. In 2017, China's government, to further stimulate market vitality, formulated a series of policies that ensured the overall stable growth of the economy and pushed forward the construction of water infrastructure projects, which improved the total amount and the efficiency of water resources and promoted the protection of the ecological environment.
Since 2019, the coupling coordination degree of six cities has maintained an upward trend. The Chinese government has put forward a high-quality development strategy and an innovation-driven development strategy, and it has introduced policies to encourage the market economy. The Shaanxi government has closed a large number of enterprises with high water consumption and high pollution to adjust the industrial structure, devoted itself to building high-tech industries, and constantly strengthened the capacity of pollution control. Therefore, the future may be in a long-term upward trend.
4.3 Spatial pattern
The visualization results of the spatial pattern of the coupling coordination degree of the WEE nexus of RBCs in Shaanxi in 2014, 2017, 2020, and 2021 are shown in Figure 4. Overall, the coupling coordination degree of the WEE nexus in RBCs in Shaanxi is in a positive trend, transitioning from bare coordination to primary coordination. The coupling coordination degree of the WEE nexus stays between 0.362 and 0.717 in 2014, 0.326 and 0.748 in 2017, 0.317 and 0.859 in 2020, and 0.429 and 0.913 in 2021.
Figure 4
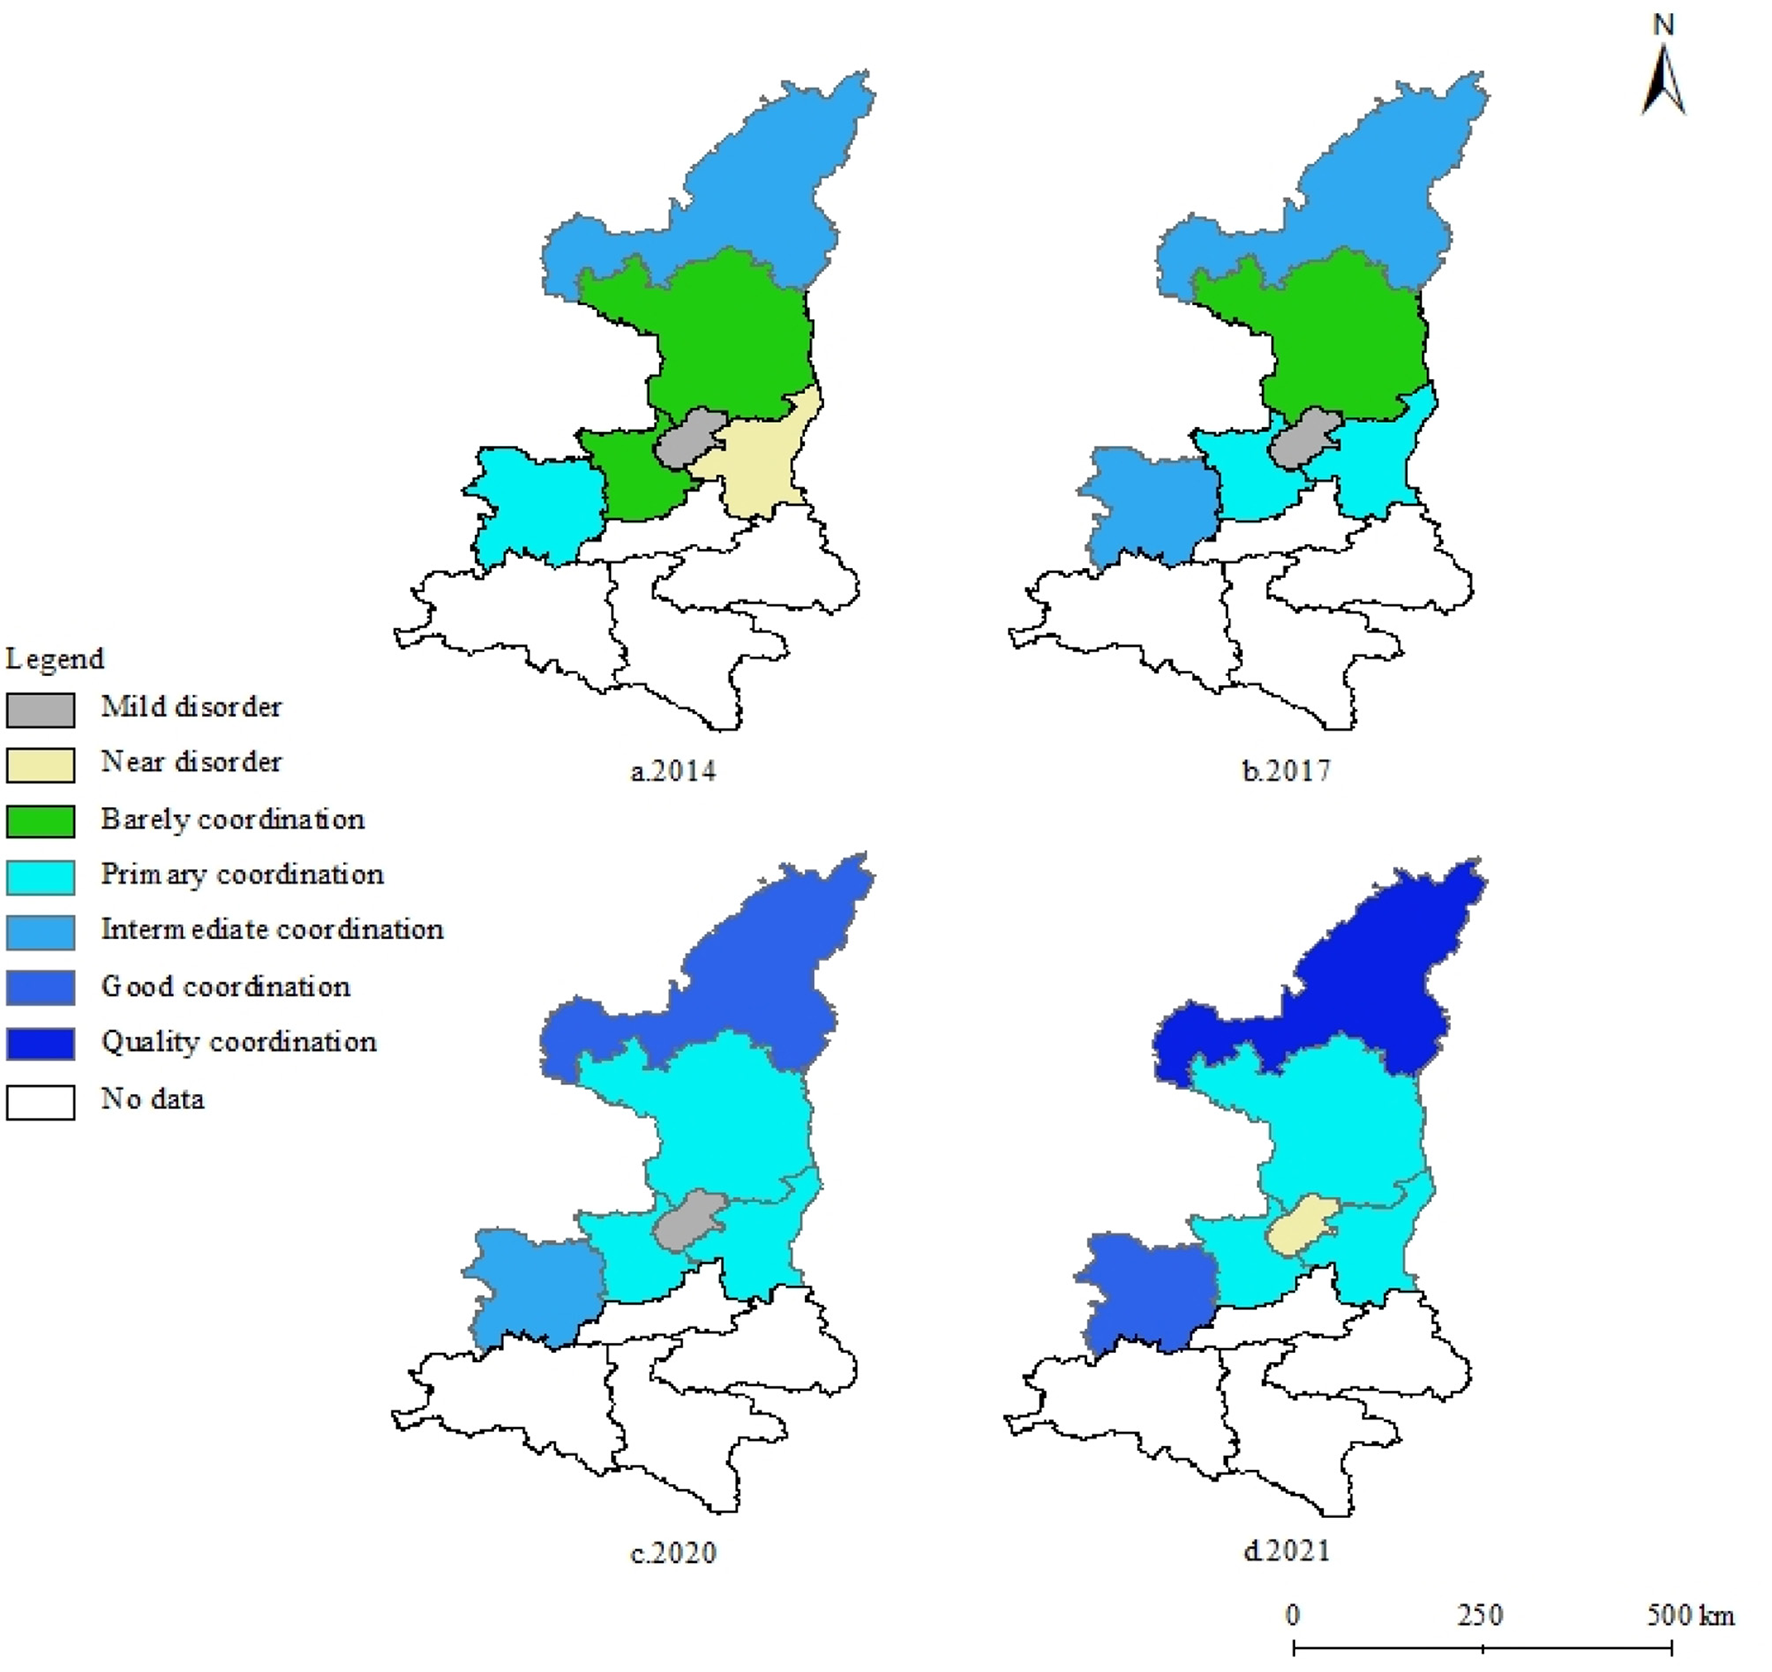
Spatial pattern of the coupling coordination degree of the WEE nexus in Shaanxi.
Due to the single industrial structure, extensive utilization of resources, and low ecological governance, some RBCs have a serious impact on the utilization and management of water resources and the ecological environment, resulting in relatively low coupling coordination. Specifically, in 2014, Tongchuan was in a stage of mild disorder, Weinan was in the near stage, Xianyang and Yan'an were in a barely coordinated stage, Baoji was in primary coordination, and Yulin was in an intermediate coordination.
In 2021, Baoji and Yulin were mainly in good coordination, and Baoji has risen from intermediate coordination to good coordination. The coordinated development process of WEE coupling in other cities is relatively slow and close to the primary coordination state. In particular, Tongchuan, although the state of mild disorder in 2020 has entered the stage of near disorder in 2021, there is still a certain gap with other cities. By 2021, the number of cities with mild disorder decreased to 0, while Weinan, Xianyang, and Yan'an cities rose to the primary coordination.
4.4 Impact factors
Stata software was used to perform panel Tobit regression with random effects, and the results are shown in Table 6. The results showed that water development, scientific and technological innovation, economic development, industrial structure, and ecological environment all had a positive effect on the coupling coordination degree at the significant level of 1%. The urbanization rate failed the significance test.
Table 6
| Variables | Coef. | Std. err. | P > |z| |
|---|---|---|---|
| lntrade | −0.021*** | 0.007 | 0.005 |
| lnurban | 0.060 | 0.088 | 0.498 |
| lnwater | 0.178*** | 0.045 | 0.000 |
| lnpgdp | 0.136*** | 0.033 | 0.000 |
| lnind | 0.131*** | 0.048 | 0.007 |
| lninn | 0.069*** | 0.012 | 0.000 |
| lngre | 0.408*** | 0.116 | 0.000 |
| _cons | −4.316*** | 0.502 | 0.000 |
| LR chi2 | 16.000*** | 0.000 |
Regression result.
***, **, * represent significance levels of 1%, 5%, and 10%, respectively.
Specifically, the regression coefficient of the opening is negative and significant at a 1% level, indicating that the expansion of the opening and the introduction of foreign capital did not lead to the coupling coordinated development of the WEE nexus of RBCs in Shaanxi.
The regression coefficient of per capita water consumption is 0.178, indicating that each 1% increase in per capita water consumption can increase the coupling coordination degree by 0.178%. Since 2015, the development of water resources has shown a steady upward trend, providing a necessary prerequisite for healthy economic operation and ecological environment protection.
The regression coefficient of economic development is 0.136, and it is significant at the 1% level, indicating that urban economic growth significantly promotes the coupling coordinated development of the WEE nexus of RBCs. The higher the level of urban economic development, the more public funds will be invested in water use and ecological protection, to promote the coordinated development of the WEE nexus.
When the proportion of the secondary industry in GDP increases by 1%, the coupling coordination degree can increase by 0.131%, indicating that accelerating the transformation of industrial structure and changing the development model is of great significance for the coupling coordinated development of the WEE nexus.
The regression coefficient of scientific and technological innovation is 0.069, significant at 1% level. With the improvement of science and technology, water resources and mineral resources are used cleanly and efficiently, which drives the coupling coordinated development of the WEE nexus of the RBCs.
The regression coefficient of the ecological environment on the coupling coordination degree was the largest, 0.408. This indicates that the coupling coordination degree increases by 0.41% for every 1% increase in ecological protection. The ecological environment is especially important and sensitive to RBCs, and it is necessary to further strengthen ecological governance and promote the sustainable development of RBCs.
Traditionally, urbanization plays a significant role in promoting both urban economic development and ecological protection. However, in this study, the regression coefficient of urbanization on the coupling coordination degree of the WEE nexus was 0.06, which failed the significance test. Therefore, the relationship between urbanization and coupling coordinated development of the WEE nexus of RBCs needs to be further studied.
5 Conclusion
Shaanxi is a large province that has mineral resources in China. The research on RBCs in Shaanxi is not only helpful to the transformational development of RBCs in Shaanxi but also has reference value for the sustainable development of RBCs in other regions. Systematically evaluating the coupling coordinated development of the WEE nexus is the basic work to realize the transformational development of RBCs. In this study, a comprehensive evaluation model was constructed to evaluate the synergies and trade-offs of the WEE nexus, identify the spatio-temporal pattern, and analyze the impact factors. The evaluation model, which addresses the transformation aspirations of RBCs and is based on the trend of sustainable development, is not only innovative but also replicable, can be used in other RBCs in China, and is also of reference value to other countries. Future research can evaluate large-scale RBCs across the country and even globally based on this model and conduct regional, national, and international comparative studies according to the evaluation results.
This study obtained some valuable novel findings. Shaanxi's RBCs have seen an overall rise in developing the WEE nexus in recent years, but the economic gap has been widening. The fundamental challenge facing Shaanxi's RBCs is uneven and inadequate development, and these cities also deal with a 2-fold imbalance across sectors and regions.
In RBCs in Shaanxi, the interaction between the WEE nexus is deepening, but the coordinated development of subsystems is lagging. The development of water resources has now emerged as a significant barrier to the coupling coordinated development of the WEE nexus. The classification evaluation of coupling coordination degree reveals three categories, with clear development differences and a still significant coupling coordination degree gap.
The results of the Tobit regression showed that water resources development, scientific and technological innovation, economic development, industrial structure, and ecological environment had a positive effect on the coupling coordination degree at a significance level of 1%. The urbanization rate fails the significance test.
Based on the study's findings, we present some specific policy recommendations. First, encourage green growth and the improvement of economic structure, make it easier for RBCs to transition to green development, and bolster environmental protection. Specific measures include strengthening green finance and providing financial support for green industries, encouraging businesses to invest in ecological and environmental preservation, establishing a sound ecological compensation scheme, establishing a green information platform, and fostering a competitive market environment that is both green and healthy. Second, increase investment in science and technology, create a system of science and technology support that is logical and well-coordinated, encourage businesses to implement technological change, encourage the clean and efficient use of energy, significantly increase the ability to control environmental pollution, and encourage the growth of high-tech industries that are friendly to the environment. Third, emphasize the government's leadership position and direct businesses, the public, and the government to collaborate to develop a multi-actor co-governance model. Finally, be aware of regional circumstances and implement customized, varied policies. More focused development methods are used in accordance with the differences in the degree of coupling coordination between the cities.
Statements
Data availability statement
The original contributions presented in the study are included in the article/supplementary material, further inquiries can be directed to the corresponding author.
Author contributions
ZC: Conceptualization, Funding acquisition, Project administration, Supervision, Writing – review & editing. BD: Data curation, Formal analysis, Investigation, Methodology, Software, Writing – original draft. LM: Conceptualization, Formal analysis, Methodology, Resources, Software, Supervision, Validation, Visualization, Writing – original draft.
Funding
The author(s) declare that financial support was received for the research and/or publication of this article. The research was sponsored by the grants of the National Natural Science Foundation of China (No. 42271185) and the Guizhou Provincial Major Scientific and Technological Program (No. [2023]113).
Conflict of interest
The authors declare that the research was conducted in the absence of any commercial or financial relationships that could be construed as a potential conflict of interest.
Generative AI statement
The author(s) declare that no Generative AI was used in the creation of this manuscript.
Publisher’s note
All claims expressed in this article are solely those of the authors and do not necessarily represent those of their affiliated organizations, or those of the publisher, the editors and the reviewers. Any product that may be evaluated in this article, or claim that may be made by its manufacturer, is not guaranteed or endorsed by the publisher.
References
1
Amemiya T. (1984). Tobit models: a survey. J. Econom.24, 3–61. 10.1016/0304-4076(84)90074-5
2
Berkenbosch K. Groote P. Stoffelen A. (2022). Industrial heritage in tourism marketing: legitimizing post-industrial development strategies of the Ruhr Region, Germany. J. Heritage Tour.17, 327–341. 10.1080/1743873X.2022.2026364
3
Chen S. Yang Y. Wu T. (2023). Digital economy and green total factor productivity—based on the empirical research on the resource-based cities. Environ. Sci. Pollut. Res.30, 47394–47407. 10.1007/s11356-023-25547-y
4
Chen W. Chen W. Ning S. Liu E. Zhou X. Wang Y. et al . (2019). Exploring the industrial land use efficiency of China's resource-based cities. Cities93, 215–223. 10.1016/j.cities.2019.05.009
5
Chen Y. Chen Y. Yin G. Liu Y. (2023). Industrial eco-efficiency of resource-based cities in China: spatial–temporal dynamics and associated factors. Environ. Sci. Pollut. Res.30, 94436–94454. 10.1007/s11356-023-28961-4
6
Cheng Z. He J. Li Y. Zhu Y. Dai J. (2023a). Coupling-coordinated development of the water-economy-innovation nexus: a case study of the grand canal area in China. J. Water Resour. Plan. Managem.149, 1–10. 10.1061/JWRMD5.WRENG-6063
7
Cheng Z. Zhao Y. Song T. Cheng L. Wang W. (2023b). White Elephant or Golden Goose? An assessment of middle route of the South-to-North water diversion project from the perspective of regional water use efficiency. Water Resour. Managem.37, 819–834. 10.1007/s11269-022-03405-9
8
Dolan F. Lamontagne J. Link R. Hejazi M. Reed P. Edmonds J. (2021). Evaluating the economic impact of water scarcity in a changing world. Nat. Commun.12, 1–10. 10.1038/s41467-021-22194-0
9
Ehrlich R. (2012). A century of miners' compensation in South Africa. Am. J. Indust. Med.55, 358–371. 10.1002/ajim.22030
10
Gao Y. Li B. Sun W. (2023). Resource curse on innovation: a perspective on local mining industry monopolies in resource-based cities in China. China Econ. Rev.81:102036. 10.1016/j.chieco.2023.102036
11
Guo B. Wang Y. Zhou H. Hu F. (2022). Can environmental tax reform promote carbon abatement of resource-based cities? Evidence from a quasi-natural experiment in China. Environm. Sci. Pollut. Res. 30, 117037–117049. 10.1007/s11356-022-23669-3
12
Haustein E. Lorson P. C. (2023). Co-creation and co-production in municipal risk governance–A case study of citizen participation in a German city. Public Manag. Rev.25:1972704. 10.1080/14719037.2021.1972704
13
He G. Bao K. Wang W. Zhu Y. Li S. Jin L. (2021). Assessment of ecological vulnerability of resource-based cities based on entropy-set pair analysis. Environm. Technol.42:1683611. 10.1080/09593330.2019.1683611
14
He S. Y. Chen X. Es M. Guo Y. Sun K. K. Lin Z. (2022). Liveability and migration intention in Chinese resource-based economies: findings from seven cities with potential for population shrinkage. Cities131:103961. 10.1016/j.cities.2022.103961
15
Hou G. Zou Z. Zhang T. Meng Y. (2019). Analysis of the effect of industrial transformation of resource-based cities in Northeast China. Economies7:40. 10.3390/economies7020040
16
Hu X. Yang C. (2018). Building a role model for rust belt cities? Fuxin's economic revitalization in question. Cities72, 245–251. 10.1016/j.cities.2017.09.002
17
Kovalev Y. Sobolev A. Burnasov A. (2020). Industrialization, neo-industrialization and post-industrialism in the evolution of the old industrial region (on the example of saar-lor-lux euro-region). Sovremennaya Evropa2020:158169. 10.15211/soveurope12020158169
18
Kuai P. Li W. Cheng R. Cheng G. (2015). An application of system dynamics for evaluating planning alternatives to guide a green industrial transformation in a resource-based city. J. Clean. Prod.104, 403–412. 10.1016/j.jclepro.2015.05.042
19
Li Q Zeng F. Liu S. Yang M. Xu F. (2021). The effects of China's sustainable development policy for resource-based cities on local industrial transformation. Resour. Policy 71. 10.1016/j.resourpol.2020.101940
20
Li B. Dewan H. (2017). Efficiency differences among China's resource-based cities and their determinants. Resourc. Policy51, 31–38. 10.1016/j.resourpol.2016.11.003
21
Li H. Long R. Chen H. (2013). Economic transition policies in Chinese resource-based cities: an overview of government efforts. Energy Policy55, 251–260. 10.1016/j.enpol.2012.12.007
22
Li K. Zhou Y. Huang X. Xiao H. Shan Y. (2023). Low-carbon development pathways for resource-based cities in China under the carbon peaking and carbon neutrality goals. Environ. Sci. Pollut Res. Int. 31, 10213–10233. 10.1007/s11356-023-28349-4
23
Li W. Yi P. Zhang D. Zhou Y. (2020). Assessment of coordinated development between social economy and ecological environment: case study of resource-based cities in Northeastern China. Sustain. Cities Soc.59:102208. 10.1016/j.scs.2020.102208
24
Li Y. Yang X. Ran Q. Wu H. Irfan M. Ahmad M. (2021). Energy structure, digital economy, and carbon emissions: evidence from China. Environ. Sci. Pollut. Res.28, 64606–64629. 10.1007/s11356-021-15304-4
25
Long R. Li H. Wu M. Li W. (2021). Dynamic evaluation of the green development level of China's coal-resource-based cities using the TOPSIS method. Resour. Policy74:102415. 10.1016/j.resourpol.2021.102415
26
Musango J. K. Currie P. Robinson B. (2017). Urban Metabolism for Resource-Efficient Cities. Paris: UN Environment.
27
Pani N. (2009). Resource cities across phases of globalization: evidence from Bangalore. Habitat Int.33, 114–119. 10.1016/j.habitatint.2008.05.007
28
Ruan F. Yan L. Wang D. (2021). Policy effects on the sustainable development of resource-based cities in China: a case study of Yichun City. Resour. Policy72:102145. 10.1016/j.resourpol.2021.102145
29
Song W. Yin S. Zhang Y. Qi L. Yi X. (2022). Spatial-temporal evolution characteristics and drivers of carbon emission intensity of resource-based cities in China. Front. Environm. Sci.10:972563. 10.3389/fenvs.2022.972563
30
Song Y. Yeung G. Zhu D. Xu Y. Zhang L. (2022). Efficiency of urban land use in China's resource-based cities, 2000–2018. Land Use Policy115:106009. 10.1016/j.landusepol.2022.106009
31
Takatsuka H. Zeng D. Z. Zhao L. (2015). Resource-based cities and the Dutch disease. Resourc. Energy Econ.40:3. 10.1016/j.reseneeco.2015.01.003
32
Tan J. Hu X. Hassink R. Ni J. (2020). Industrial structure or agency: What affects regional economic resilience? Evidence from resource-based cities in China. Cities106:102906. 10.1016/j.cities.2020.102906
33
Wang D. Huang Z. Wang Y. Mao J. (2021). Ecological security of mineral resource-based cities in China: Multidimensional measurements, spatiotemporal evolution, and comparisons of classifications. Ecol. Indic.132:108269. 10.1016/j.ecolind.2021.108269
34
Wang D. Shi Y. Wan K. (2020). Integrated evaluation of the carrying capacities of mineral resource-based cities considering synergy between subsystems. Ecol. Indic.108:105701. 10.1016/j.ecolind.2019.105701
35
Wang J. Feng L. Li B. (2023). The heterogeneity impact of factor market distortions on GTFP: from the view of resource-based cities. Environ. Sci. Pollut. Res.30, 78108–78126. 10.1007/s11356-023-27738-z
36
Wang Q. Liu M. Tian S. Yuan X. Ma Q. Hao H. (2021). Evaluation and improvement path of ecosystem health for resource-based city: a case study in China. Ecol. Indic.128:107852. 10.1016/j.ecolind.2021.107852
37
Wang Y. (2022). Development characteristics, influencing mechanism and coping strategies of resource-based cities in developing countries: a case study of urban agglomeration in Northeast China. Environ. Sci. Pollut. Res.29, 25336–25348. 10.1007/s11356-021-17820-9
38
Wang Z. Cao X. Ren X. (2024). Green development and economic resilience: Evidence from Chinese resource-based cities. Front. Eng. Managem.11, 194–206. 10.1007/s42524-024-0307-3
39
Wu H. Deng K. Dong Z. Meng X. Zhang L. Jiang S. et al . (2022). Comprehensive assessment of land use carbon emissions of a coal resource-based city, China. J. Clean. Prod.379:134706. 10.1016/j.jclepro.2022.134706
40
Wu L. Guo X. Chen Y. (2021). Grey relational entropy calculation and fractional prediction of water and economy in the Beijing-Tianjin-Hebei region. J. Mathemat.2021:4418260. 10.1155/2021/4418260
41
Xie W. Yan T. Xia S. Chen F. (2020). Innovation or introduction? The impact of technological progress sources on industrial green transformation of resource-based cities in China. Front. Energy Res.8:598141. 10.3389/fenrg.2020.598141
42
Yan D. Kong Y. Ren X. Shi Y. Chiang S. W. (2019). The determinants of urban sustainability in Chinese resource-based cities: a panel quantile regression approach. Sci. Total Environm.686, 1210–1219. 10.1016/j.scitotenv.2019.05.386
43
Yang J. Wang Y. Mao J. Wang D. (2022). Exploring the dilemma and influencing factors of ecological transformation of resource-based cities in China: perspective on a tripartite evolutionary game. Environ. Sci. Pollut. Res.29, 41386–41408. 10.1007/s11356-021-18450-x
44
Yang Y. Cheng D. Zhang B. Guan C. H. Cheng X. Cheng T. (2023). Coal resource-based cities at the crossroads: towards a sustainable urban future. Cities140:104424. 10.1016/j.cities.2023.104424
45
Yang Z. Cao Y. Du J. (2023). The impact of new urbanization construction on sustainable economic growth of resource-based cities. Environ. Sci. Pollut. Res.30, 96860–96874. 10.1007/s11356-023-29171-8
46
Yusuf M. Samsir A. Tiro S. Ilyas M. Riana A. D. Saru A. et al . (2024). Blue economy policy model for encouraging regional growth in South Sulawesi. AACL Bioflux17:1.
47
Zhang C. Zhong L. Wang J. (2018). Decoupling between water use and thermoelectric power generation growth in China. Nat. Energy3, 792–799. 10.1038/s41560-018-0236-7
48
Zhang H. Sun X. Bi C. Ahmad M. Wang J. (2022). Can sustainable development policy reduce carbon emissions? Empirical evidence from resource-based cities in China. Sci. Total Environm.838:156341. 10.1016/j.scitotenv.2022.156341
49
Zhang M. Yan T. Ren Q. (2022). Does innovative development drive green economic growth in resource-based cities? Evidence From China. Front. Environm. Sci.9:745498. 10.3389/fenvs.2021.745498
50
Zhao F. Sun Y. Zhang J. (2023). Does industrial agglomeration and environmental pollution have a spatial spillover effect? Taking panel data of resource-based cities in China as an example. Environ. Sci. Pollut. Res.30, 76829–76841. 10.1007/s11356-023-27852-y
51
Zhao X. Wang X. Wu G. (2023). Exploring the coupling relationship of industrial agglomeration and low-carbon economy considering spatiotemporal differentiation: an empirical study in China's construction machinery industry. Front. Eng. Managem.10, 285–299. 10.1007/s42524-022-0197-1
Summary
Keywords
resource-based cities, water–economy–ecology nexus, coupling coordination development, Tobit model, China
Citation
Cheng Z, Ding B and Ma L (2025) Assessing the synergies of the water–economy–ecology nexus in resource-based cities: a case study of Shaanxi, China. Front. Sustain. Cities 7:1586642. doi: 10.3389/frsc.2025.1586642
Received
03 March 2025
Accepted
05 May 2025
Published
22 May 2025
Volume
7 - 2025
Edited by
Gabriella Maselli, University of Salerno, Italy
Reviewed by
Paunita Iuliana Boanca, University of Agricultural Sciences and Veterinary Medicine of Cluj-Napoca, Romania
Pablo Torres-Lima, Metropolitan Autonomous University, Mexico
Updates
Copyright
© 2025 Cheng, Ding and Ma.
This is an open-access article distributed under the terms of the Creative Commons Attribution License (CC BY). The use, distribution or reproduction in other forums is permitted, provided the original author(s) and the copyright owner(s) are credited and that the original publication in this journal is cited, in accordance with accepted academic practice. No use, distribution or reproduction is permitted which does not comply with these terms.
*Correspondence: Li Ma mal848@xauat.edu.cn
Disclaimer
All claims expressed in this article are solely those of the authors and do not necessarily represent those of their affiliated organizations, or those of the publisher, the editors and the reviewers. Any product that may be evaluated in this article or claim that may be made by its manufacturer is not guaranteed or endorsed by the publisher.