 Alex Tro-Cabrera1,2*
 Rosa Lago-Aurrekoetxea1,3Estitxu Villamor1,4Leire Urkidi-Azkarraga1,5
 Gorka Bueno1,3Emmanuel Aramendia6
- 1EKOPOL—Research Group on Ecological Economics and Political Ecology, University of the Basque Country UPV/EHU, Leioa, Spain
- 2Department of Energy Engineering, Bilbao School of Engineering, University of the Basque Country UPV/EHU, Bilbao, Spain
- 3Department of Electronic Technology, Bilbao School of Engineering, University of the Basque Country UPV/EHU, Bilbao, Spain
- 4Department of Physics, Faculty of Pharmacy, University of the Basque Country UPV/EHU, Vitoria-Gasteiz, Spain
- 5Department of Geography, Prehistory and Archeology, Faculty of Arts, University of the Basque Country UPV/EHU, Vitoria-Gasteiz, Spain
- 6Sustainability Research Institute, School of Earth and Environment, University of Leeds, Leeds, United Kingdom
Cities are key players in the current energy and climate crisis. Not only do they account for two-thirds of global final energy consumption and produce 75% of total greenhouse gas emissions, but they also offer opportunities to respond to these challenges through local actions, such as the installation of rooftop photovoltaic (RPV) systems. However, caution is needed to minimize the socio-environmental impacts that renewable deployment causes as well. This study analyses the implications of RPV in terms of primary extraction material requirements and environmental and social impacts using the city of Vitoria-Gasteiz (Spain) as a case study. Both environmental and social life cycle assessments (LCA) were performed by modeling the potential annual photovoltaic electricity production of 473 GWh found for Vitoria-Gasteiz, and comparing it to the same amount of electricity produced by the conventional Spanish electricity mix. We employed the openLCA software, with the ecoinvent 3.10 database and the soca v3 add-on module. The inventory of ecoinvent for RPV electricity production was updated in order to reflect the per capita primary extraction material requirements and compare them to population weighted global material reserves, resources and in-use stocks. A literature review is included to illustrate the socio-environmental impacts of mining. Results show a very high ratio of primary extraction requirements to reserves for gold (28.5%), silver (29.4%), and tin (56.2%). In addition, the deployment of RPV would increase the in-use stocks of silver by 12%, and the aluminum and tin stocks by 9%. Regarding silicon, despite its reserves being abundant, global polysilicon production capacity should be at least tripled in a 25-year scenario. Hence, recycling activities should be more than doubled to avoid an increase in mining. Environmental-LCA shows a significant reduction for all analyzed impact categories, especially climate change (79%), acidification (71%), and land (70%), and water use (63%). In contrast, social-LCA shows no substantial changes in risk levels, as the economic activity in photovoltaic supply chains remains largely concentrated in developing countries, generating similar social impacts. By acknowledging the socio-environmental trade-offs of renewable energies, cities can foster a fair energy transition that is both materially grounded and ecologically aware.
1 Introduction
In 2021, more than 85% of the global primary energy supply came from fossil fuels (IEA, 2023). One of the main problems of the current energy system is that it is strongly based on inequality, on top of the energy crisis caused by the depletion of fossil fuels (Wachtmeister et al., 2018) and the unprecedented climate crisis we are facing due to the CO2 emissions associated with the burning of such fossil fuels (IPCC, 2021). Therefore, the need for fossil fuels and raw materials of Northern economies is often met by extractive projects located in Southern countries, which generate global environmental damage, as well as an ecological debt in such countries (Garmendia et al., 2016). In addition, outsourcing of industry results in the hidden energy flows of developed countries representing a large proportion of their energy footprint (Akizu-Gardoki et al., 2021). Therefore, there is a pressing need for an energy transition toward a fair and renewable system. In 2019, cities consumed two-thirds of the world’s final energy and produced 75% of the planet’s CO2 emissions. Hence, they can play a key role in decarbonizing energy systems (REN21, 2021). In the context of a city, many initiatives can be taken, such as the installation of modular renewable systems close to the point of consumption, which favor self-consumption and reduce energy transport losses.
The European Union, in its long-term strategies for decarbonization (European Commission, 2018), considers photovoltaics to be a key carbon-free energy source. Renewables represent more than half the energy consumption in all decarbonization scenarios in 2050 to limit global warming to 1.5°C. Increased electrification takes place in most sectors, and thus, the transport sector is expected to multiply its electricity consumption several times and the residential and industrial sectors are expected to increase it by up to 60% in 2050 compared to 2015, despite the proposal to reduce primary energy consumption between 35 and 50% in 2050 compared to 2005. Therefore, electricity generation renewable sources such as photovoltaics play a key role in any of the decarbonization scenarios. Nevertheless, there are several questions about renewables—and photovoltaics in particular—to be discussed in the literature: land and material requirements, and how much “net” energy can be delivered to society in the form of a given energy carrier (e.g., electricity), after subtracting the energy inputs required to support the supply chain of that same energy carrier. Let us check that.
As regards land requirements, some studies report that a 100% solar mix electricity scenario for most high income economies would require extra area dedicated to infrastructure and settlement of the same or a higher order of magnitude than the current built-up area, in order to meet current electricity consumption (Capellán-Pérez et al., 2017). Accordingly, rooftop photovoltaics offers a clear advantage. However, there is a controversial and wide range of values in the literature regarding its potential contribution to electricity consumption. Highest potentials estimate 27% of global electricity consumption in 2050 (Jacobson et al., 2017), along with the lowest estimate in the case of Spain, for example, of between 2.4 and 8.1% of electricity consumption (Capellán-Pérez et al., 2017). Studies focused on RPV using GIS-based methodologies to assess it in detail—as explained below for the case study of this article—estimate high contributions to electricity consumption (Romero Rodríguez et al., 2017; Tro-Cabrera et al., 2025).
Another topic of debate in the literature concerns the amount of net energy that renewable energies, and photovoltaics in particular, are capable of supplying to society in order for basic human needs to be met and even current levels of social complexity to be sustained, after subtracting the energy inputs needed to sustain the energy system supply chain (Moriarty and Honnery, 2016; Raugei, 2019). The energy return on energy investment (EROI or EroEI) is becoming a key indicator for assessing the quality of energy sources. The EROI is the amount of energy generated per unit of energy invested in a process over its lifetime. As the EROI decreases, more resources and energy must be diverted to the energy sector, rather than to other sectors of the economy. Therefore, there is a minimum average EROI level across energy generation infrastructure that is needed in order to maintain contemporary industrial societies (Hall et al., 2009; Lambert et al., 2014). While there is no consensus as to this minimum value, different authors agree that an EROI below 5 may lead to a cascading decline (Brandt, 2017; King and van den Bergh, 2018; Murphy, 2014). There is a risk of rapid collapse in net energy production below this threshold. Murphy (2014) refers to this threshold as an “energy cliff.” According to the EROI, the capability of renewables and photovoltaics in particular, to surpass the energy cliff and sustain modern complex societies, is a matter of debate in the literature (de Castro and Capellán-Pérez, 2020; Raugei et al., 2017). Renewable potential assessments start to include the net energy efficiency as a constraint (Dupont et al., 2020).
Renewables’ material requirements is also a hot topic. The way in which minerals may limit economic growth and eventually lead the economy to collapse has been studied since the Meadows Report in 1972, and is still in the spotlight (Michaux, 2021). The European Union traces the materials with a high supply risk and of great importance to the economy, known as “critical raw materials,” and has identified that they may threaten the deployment of renewables (Arellano-Yanguas, 2023). According to the scenarios of the EU “Clean Planet for all” report (European Commission, 2018), the additional material consumption for photovoltaics alone in 2030/2050 could be several times higher for several elements compared to EU consumption of the material in all applications; those elements include tellurium, germanium and indium, specifically used in thin-film and multi-junction technologies. Photovoltaics based on the most widely used crystalline silicon (c-Si) solar cells would also involve a 60% higher consumption of silicon than at present (Arellano-Yanguas, 2023); despite it being the second most abundant element in the Earth’s crust in the form of silicon dioxide the real limiting factor is the global industrial capacity to purify it.
Even though the EU did not consider silver as a critical raw material in 2023, this element has long been identified as a limiting factor of c-Si solar cells in the PV field, and the only significant one for some authors (Delucchi and Jacobson, 2011; Feltrin and Freundlich, 2008). From a glass-half-empty point of view, García-Olivares et al. (2012) qualified PV as a “no-go alternative” precisely because of the scarcity of silver and other elements. Although the photovoltaic industry has shown a silver learning rate above 20% over the past 10 years, depending on the specific c-Si technology driven, under a broad electrification scenario PV’s silver consumption could have a high impact on global silver reserves (Hallam et al., 2023). Urbina (2023) checked the material needs for the NET Zero Emissions by 2050: A Roadmap for the Global Energy Sector, of the International Energy Agency (edited in 2021), and found that the materials demand for PV would surpass world production in the case of several elements, such as silver and tin, as early as 2030.
In light of these circumstances, a city must aspire to respond to the global challenges of climate change and energy crisis through local actions such as the promotion of renewable sources, and specifically, the installation of rooftop photovoltaic systems. At the same time, local actions must be limited according to the restrictions imposed by the socio-environmental impacts that renewable sources also cause, for example, impacts related to the extraction of critical materials. In this context, the main goal of this paper is to study the implications of RPV in terms of primary extraction material requirements, environmental impacts and social impacts. Using the city of Vitoria-Gasteiz as a case study, we will analyze the extent to which the primary extraction material requirements become a constraint to RPV deployment. In addition, its contribution to the IPCC 1.5°C target by reducing the greenhouse gas emissions will be analyzed, as well as the reduction (or increase) with respect to the current electricity mix in various other environmental and social indicators.
2 Materials and methods
The life cycle assessment of a case study from previous research by the authors (Tro-Cabrera et al., 2025) was performed in this work. The aforementioned paper calculated the RPV production of the city of Vitoria-Gasteiz (capital of the Basque Country, northern Spain), based on a comprehensive methodology for RPV calculation using GIS tools and the EROI>5 constraint. c-Si solar panels with PERC technology were considered because it is the most widely used technology, it offers a higher EROI (Dupont et al., 2020), and it depends on fewer critical raw materials—with the exception of silver and silicon—than thin film and multijunction technologies do. Taking a conservative approach, disruptive technologies which might help overcoming the material shortages were not considered, as mentioned. According to the study, a total PV power of 460 MW can be installed in the rooftops of the city of Vitoria-Gasteiz. This RPV deployment would annually produce 473 GWh (38% of the yearly average electricity consumption considering years 2018 to 2022), which corresponds to an annual RPV production of 1.92 MWh per inhabitant.
Based on the earlier research, both an environmental (E-LCA) and social (S-LCA) life cycle assessment were carried out in order to establish the consequences of the RPV deployment of Vitoria-Gasteiz in terms of not only environmental impacts, but also of social implications. To the best of our knowledge, S-LCAs of PV electricity production are missing in scientific literature.
The assessments were performed with the software openLCA (Ciroth, 2007). The ecoinvent 3.10 database (Wernet et al., 2016), with the cut-off system model approach, was used for the E-LCA and the soca v3 add-on module (Eisfeldt, 2017) was used for the S-LCA. This module combines social information into the ecoinvent database (from now on called soca-ecoinvent 3.10), allowing both E-LCA and S-LCA to be performed. The soca v3 add-on is based on the PSILCA 3.1 database (Eisfeldt and Ciroth, 2016), which in turn uses the Global Multi-Regional Input–Output database EORA (Lenzen et al., 2012) in order to cover a total of 83 social indicators for almost 15,000 industrial sectors and goods in 189 countries.
E-LCA is governed by the ISO 14040 and the ISO 14044 (ISO, 2006a, 2006b) and S-LCA by the recently released ISO 14075 (ISO, 2024). The methodology followed in order to perform both assessments is detailed bellow.
A literature review of the environmental and social impacts of mining the materials found to be more critical in this study was carried out in order to complement the LCA.
2.1 Goals and scope of the environmental and social life cycle assessment
The main goal of the E-LCA of the RPV deployment in Vitoria-Gasteiz is to assess the primary extraction material requirements, in kg per new MW installed and inhabitant, so as to conduct a comparison with the known global reserves, resources, and estimated in-use material stocks. Furthermore, the goal of both E-LCA and S-LCA is to identify the environmental and social impacts of the annual electricity production that the RPV deployment of Vitoria-Gasteiz would generate (473 GWh), contrasted with the same amount of energy generated by the current Spanish electricity mix (data from the year 2020, reported in the ecoinvent 3.10 database; Wernet et al., 2016). Hence, the scope of this study is the RPV production of the urban areas of Vitoria-Gasteiz, which include adjoining industrial estates, but exclude rural areas outside the city’s Green Belt, as was the case in our previous work (Tro-Cabrera et al., 2025).
A process-based LCA was therefore performed with the following considerations:
- 3 kWp installations were modeled, as this is the reference installation reported in the ecoinvent database. Inverters, mounting systems, electric installations, and even the energy consumed in the own installation process were taken into account in addition to the fabrication of the solar panels.
- 3 kWp installations were modeled for both flat and slanted roofs. For accuracy purposes, we have applied the ratio of each type of installation according to the results of the above mentioned previously published paper (Tro-Cabrera et al., 2025).
- A from-cradle-to-grave approach was applied, i.e., raw material extraction, manufacturing, transportation, replacements, and end-of-life dismantling phases were included in all sub-processes.
- The functional unit of our analysis was 1 kWh of electricity generated. Therefore, we calculated how much electricity one installation generates over its entire productive life-time of 30 years (including cell-degradation effects), based on our previous results (Tro-Cabrera et al., 2025), so as to determine the proportion of the 3 kWp reference installation that corresponds to the generation of that 1 kWh. Finally, the functional unit of 1 kWh was scaled to the total RPV potential of Vitoria-Gasteiz, 473 GWh.
- The distribution and storage of the PV electricity generated on the roofs is beyond the scope of this paper.
2.2 Inventory: quantifying material requirements
As mentioned above, a process-based LCA was performed, with the soca-ecoinvent 3.10 database (Eisfeldt, 2017) as primary data source. However, the aforementioned database may be obsolete for some processes due to the fact that the photovoltaic industry has made strived to diminish the material requirements in the last decade. Hence, those processes were modified for this study using more recent publications (Gervais et al., 2021; IEA, 2022; Urbina, 2023). Specifically, we utilized the IEA inventory of PV systems (2022) for remodeling the PV cell and panel fabrication processes, and subsequently adjusted some specific critical raw materials as identified by the EU, as well as other potentially limiting materials highlighted by the photovoltaic sector, such as silver and tin, due to future projections (Urbina, 2023). We therefore used the inventory from the paper by Gervais et al. (2021), where the material requirements for producing mono-Si PV cells are listed, as shown in Table 1. Material losses resulting from the module production are included.
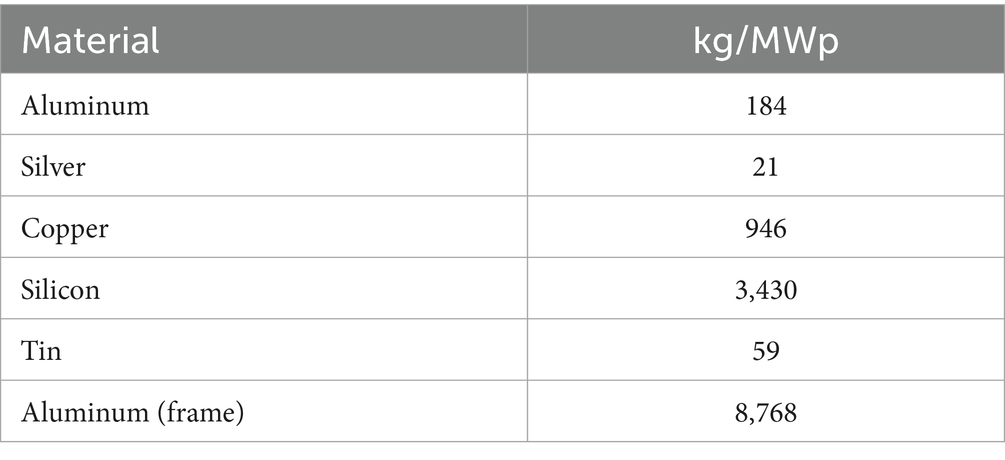
Table 1. Specific material requirements of current PERC technology (Gervais et al., 2021), used as inventory to update the starting database soca-ecoinvent 3.10 for LCA.
This study is focused on the most widely extended commercial PV technology structure, the PERC (passivated emitter and rear cell), based on crystalline silicon. It is a mature and currently least critical module concept in terms of material requirements. In contrast, material supply risks have already been identified for other PV technologies, such as III-V tandem solar cell on silicon substrate and CIGS (Copper indium gallium diselenide) cells, even for conservative PV capacities (Gervais et al., 2021).
Finally, as regards the inverter, we detected that the average installation of the PV deployment in Vitoria-Gasteiz would be 20 kWp (Tro-Cabrera et al., 2025). Therefore, we modeled an inverter of that power and calculated the proportion that would correspond to the reference installation of 3 kWp.
Once the remodeling had been performed, the material requirements of the entire PV system were assessed using openLCA. This approach accounts not only for the production of PV, but also for the material needs of the inverter, mounting system, electrical connections, and system operation—including upstream stages of mining and metal processing. The ecoinvent processes we rely on for our LCA incorporate material recycling to varying degrees, but we focus on the demand for primary extraction material requirements, identified as “Elementary flows/resource-in-ground” within the LCA methodology. Silicon needs are assessed in a different way, as explained below. Due to the complexity of the multiple processes involved in the installation of a PV system, recycling rates of database soca-ecoinvent 3.10 are assumed in our LCA. However, results are analyzed in the light of more current values as published by the SCRREEN project (BRGM, 2023).
We adjust the quantified primary extraction material requirements for the population share living in Vitoria-Gasteiz. To enable a meaningful comparison between local material requirements and global availability, we adopt a population-weighted approach to estimate global per capita reserves, resources, and in-use stocks. This allows us to contextualize the material demands of the city-scale RPV deployment and to obtain an initial forecast of the increased mining of certain minerals required by PV systems (see Table 2).
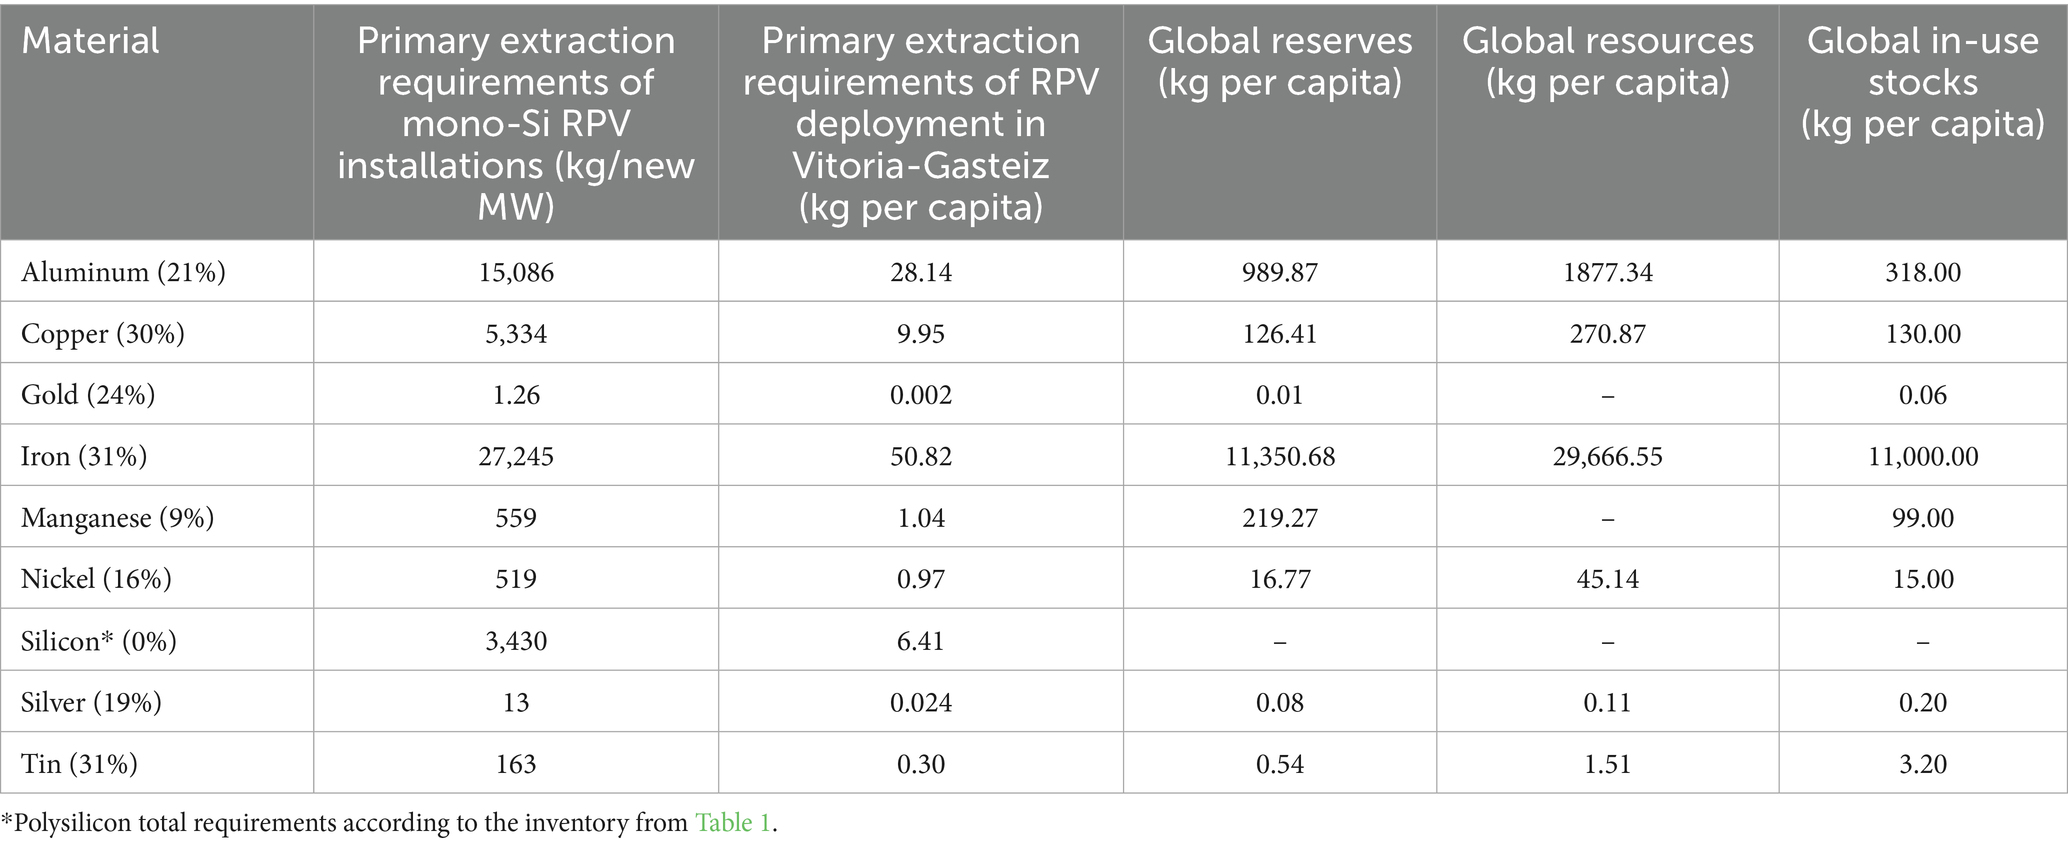
Table 2. Primary extraction requirements of RPV deployment in Vitoria-Gasteiz compared to known global reserves, resources and in-use stocks (population-weighted), and end-of-life recycling input rates (EOL-RIR) in parenthesis.
Reserves refer to the known amount of materials in deposits that are currently both economically and technologically extractable, while resources are considered to be the known amount of materials in deposits that may be 1 day economically and technologically extractable—both taken from the United States Geological Survey (2025). In-use stocks refer to the quantity of materials present in society put into use, currently providing service, after extraction and processing, and before being discarded. In-use stocks are taken from Watari and Yokoi (2021) for aluminum, copper, iron, and nickel, and estimated from the United Nations Environment Programme & International Resource Panel (2010) for manganese, gold, and tin. Silver in-use stocks are estimated from Gsodam et al. (2014), considering international inequality as analyzed by Watari and Yokoi (2021). With respect to gold resources, country-by-country data use a different reporting code and cannot be aggregated to obtain the world value (BRGM, 2023).
Silicon in the form of silicates constitutes more than 25% of the Earth’s crust, and thus, world resources and reserves are abundant and not limitant. In-use stocks of semiconductor and solar-grade silicon are hard to quantify because they are not even included in USGS statistics, and published data refers to metallurgical-grade silicon mainly used for alloying with aluminum and for production of chemicals, and has therefore not been reported in this article. Limits for PV deployment are related to solar grade silicon (polysilicon) production capacity of manufacturer facilities (IEA, 2022). Therefore, silicon needs for rooftop photovoltaics have been assessed as the total requirements to manufacture polysilicon and obtain a c-Si wafer, while demand from other activities is excluded. Since the EOL-RIR (end-of-life recycling input rate) of silicon is estimated to be low (BRGM, 2023), primary extraction silicon requirements in Table 3 will be the same as reported in Table 1.
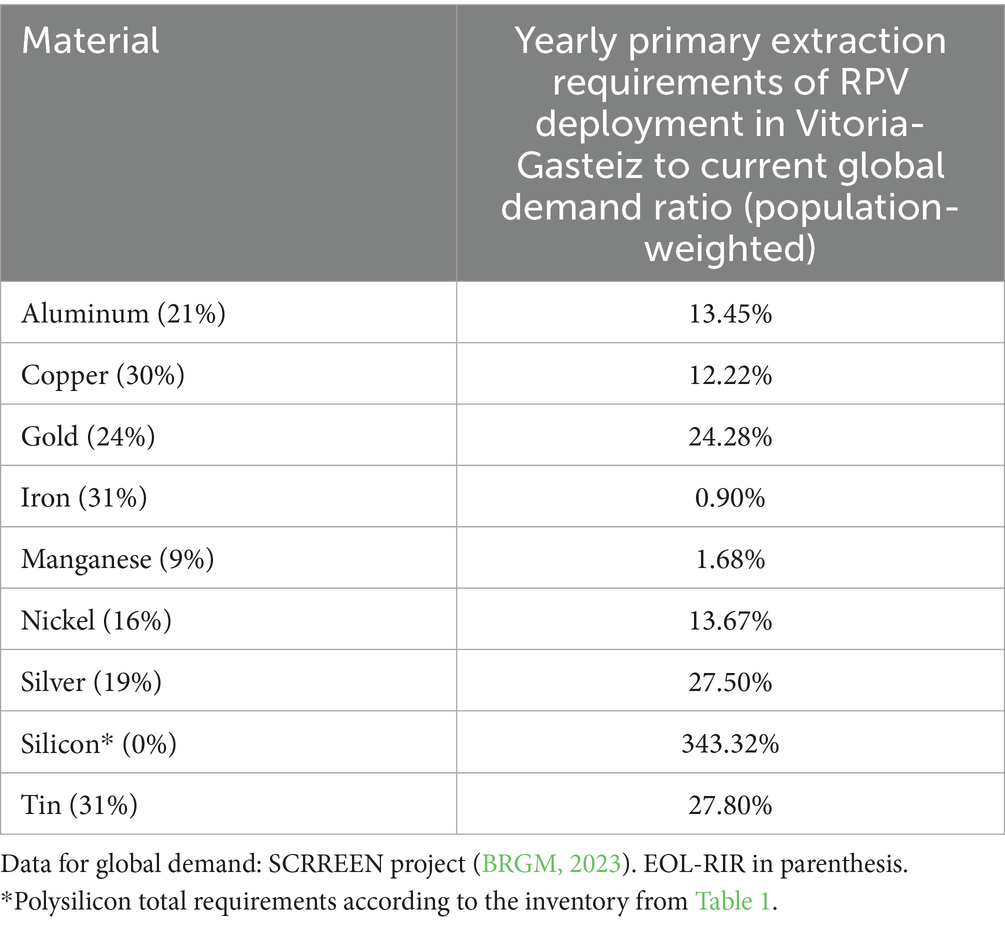
Table 3. Yearly primary extraction material requirements of RPV deployment in Vitoria-Gasteiz in a 25-year scenario of installation to 2050, compared to current global demand (population weighted).
2.3 Lyfe cycle impact assessment
2.3.1 Environmental life cycle impact assessment
Following the Recommendation 2021/2279 provided by the European Union (EU Commission, 2021), environmental impacts have been estimated using the Environmental Footprint EF v3.1 impact assessment method (European Commission and Joint Research Centre, 2022). The EF v3.1 is a methodology that considers 25 significant impact categories including acidification, climate change, land and water use, and material resources (all of which are listed in the first column of Table 4). The E-LCA results, also shown in Table 4, are presented in detail in section 3.2.1.
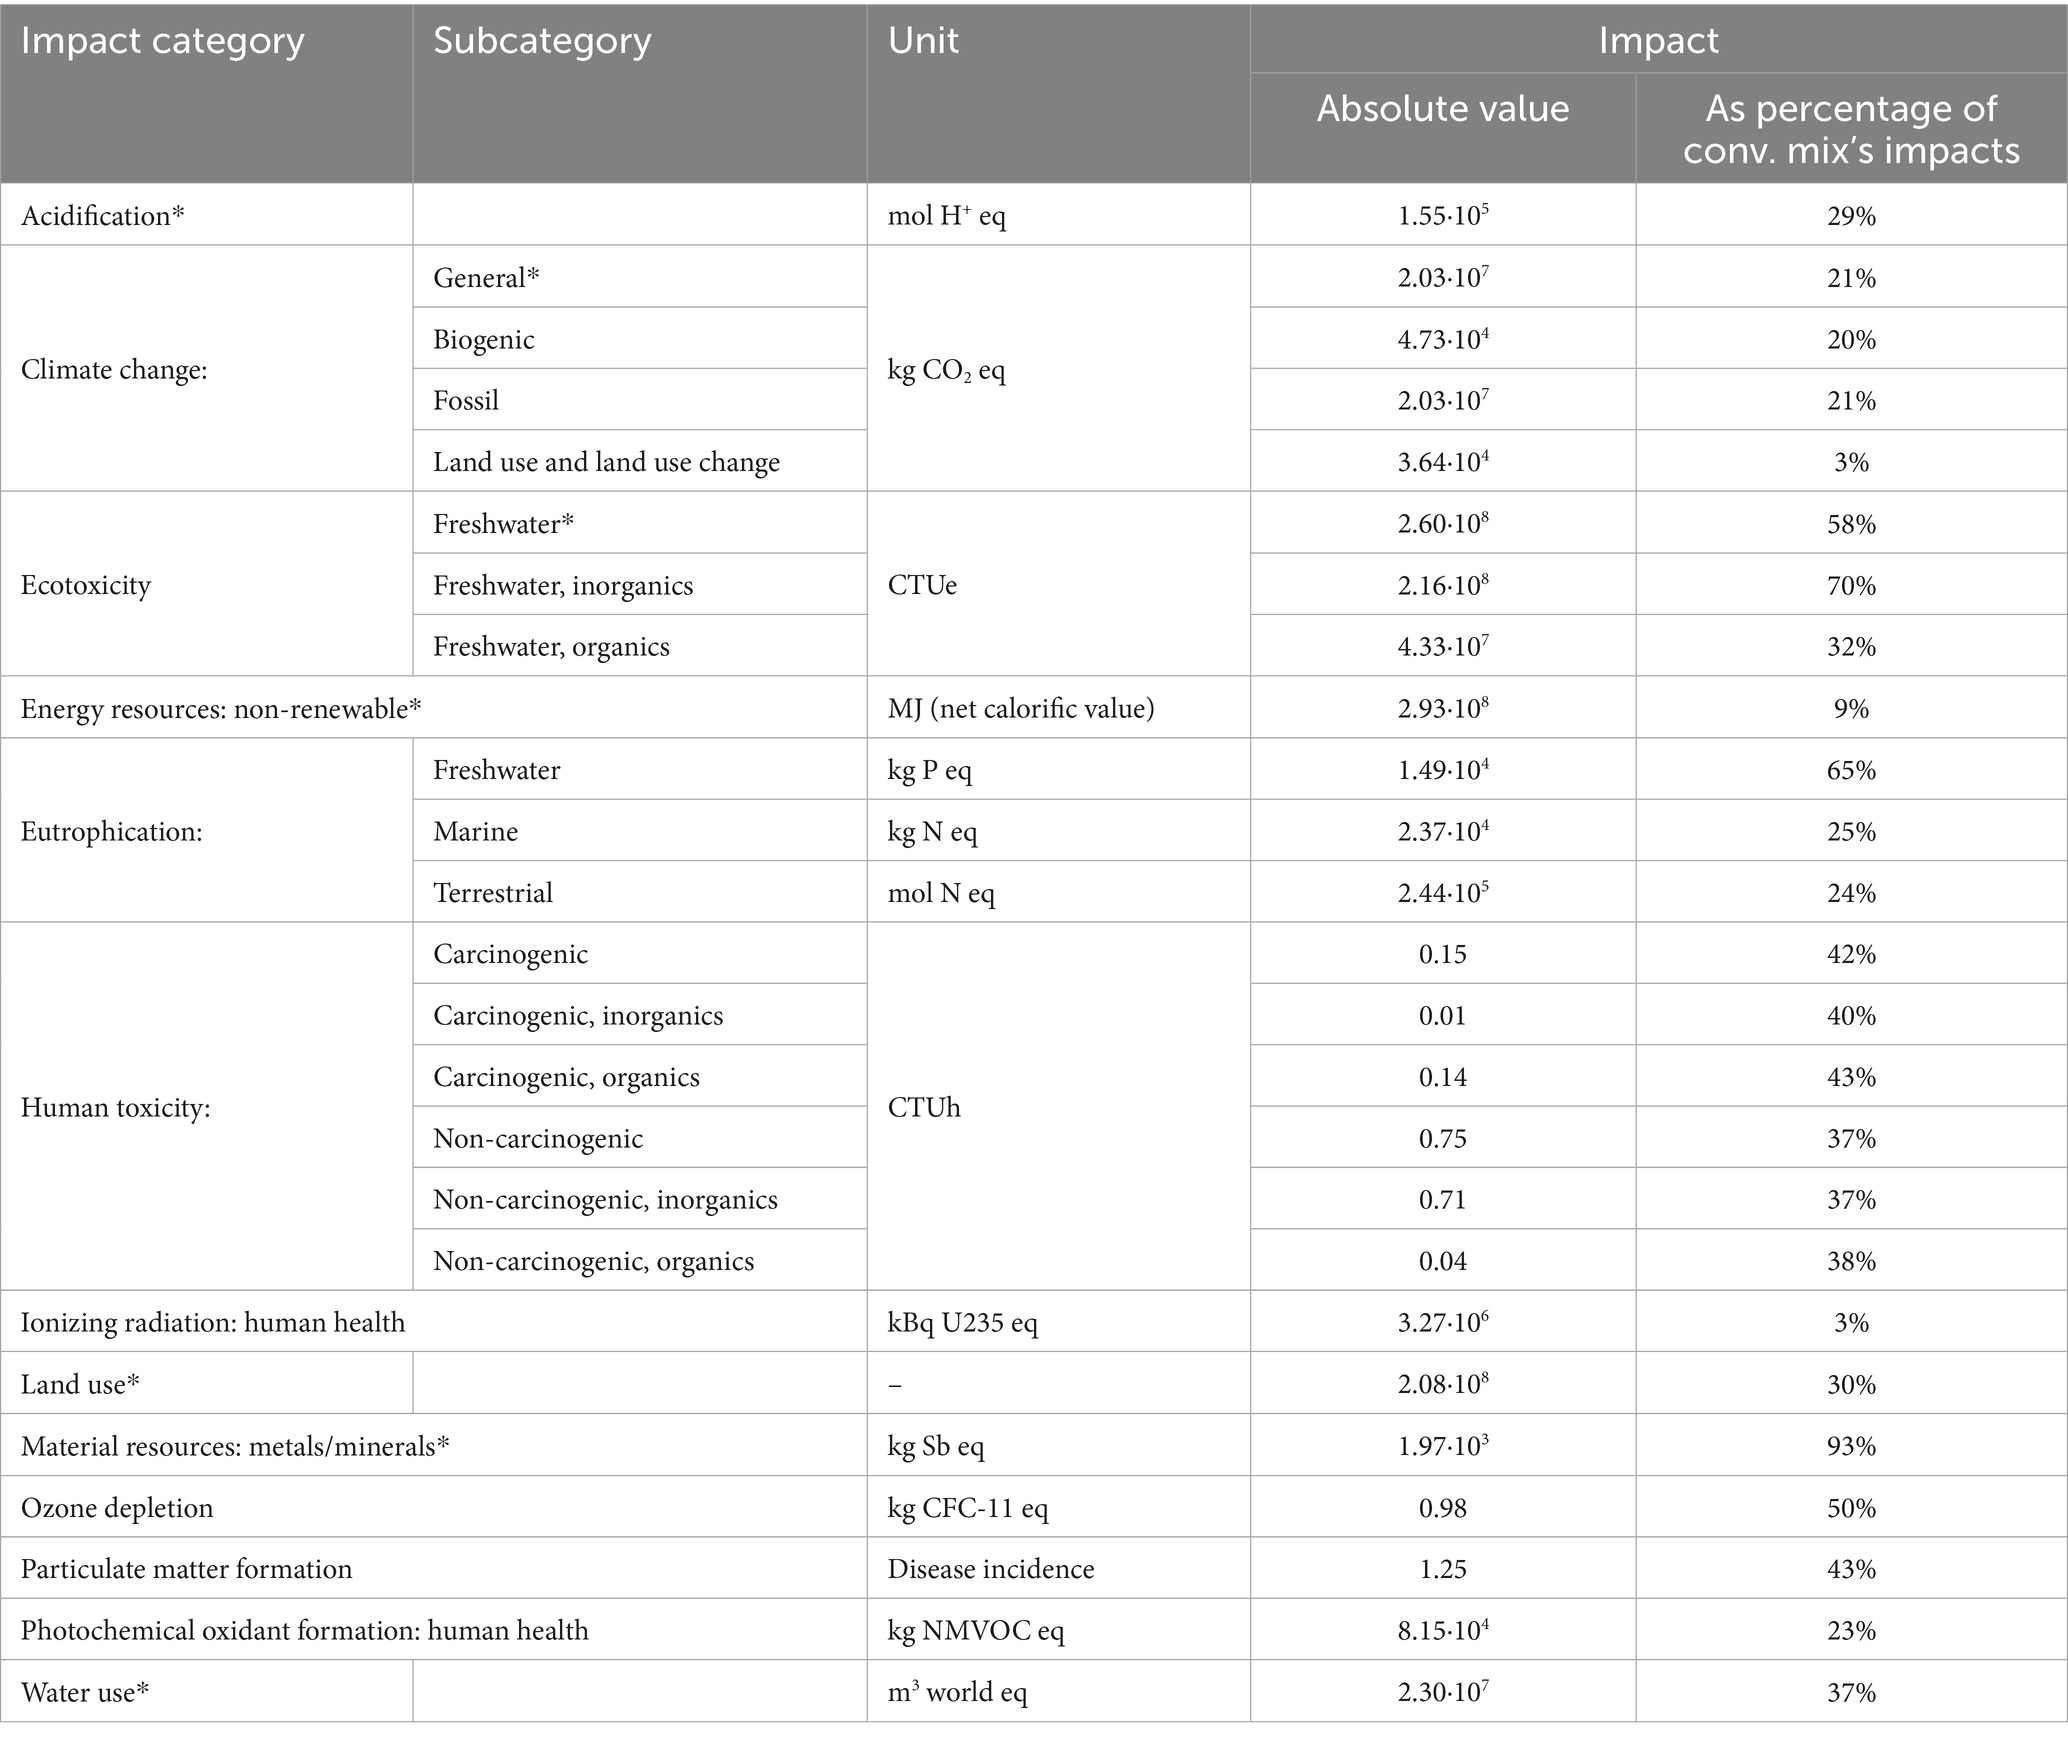
Table 4. Environmental impacts of generating 473 GWh of electricity by RPV deployment in Vitoria-Gasteiz and by the current Spanish conventional energy mix (year 2020), for each of the categories of EF v3.1 environmental assessment method.
2.3.2 Social life cycle impact assessment
The social impact assessment was carried out using the Social Impact Weighting Method (Eisfeldt, 2017) provided by the soca v3 module, a PSILCA-based add-on for the ecoinvent database, which provides 83 social impact indicators, related to 18 impact categories and arranged in four different stakeholders (Workers, Local community, Society and Value-chain actors). The impact categories and their related indicators are shown in Tables 5–8 for each stakeholder. The results contained in these tables are analyzed in section 3.3.1.
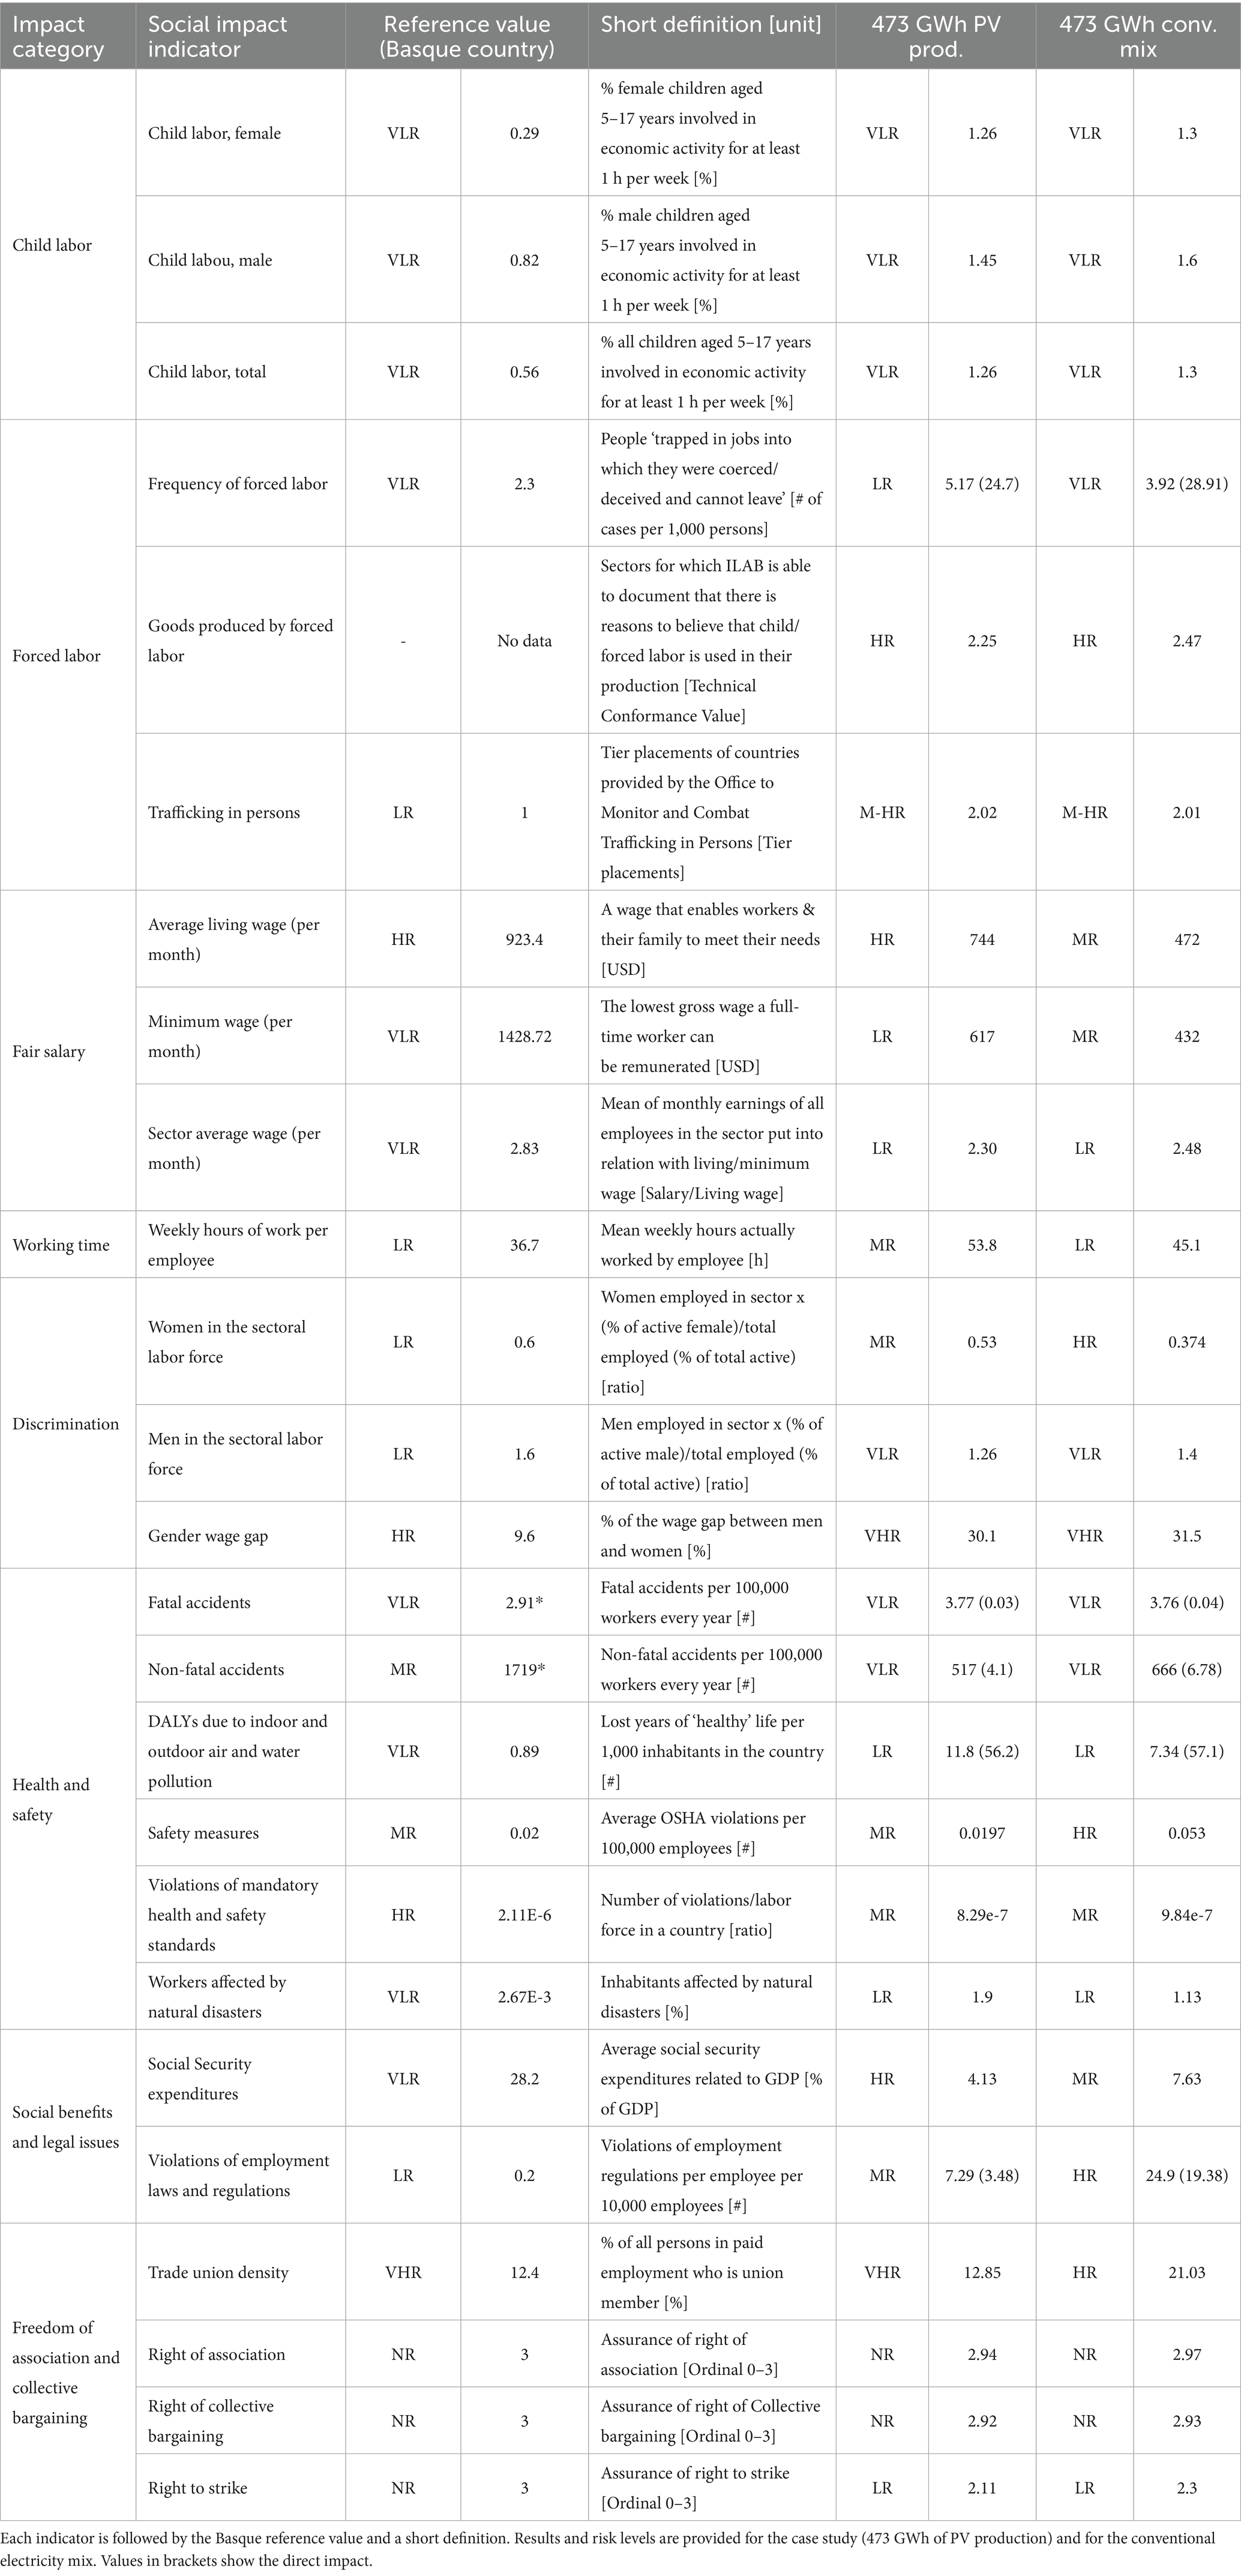
Table 5. Social impact categories and indicators for the workers stakeholder.
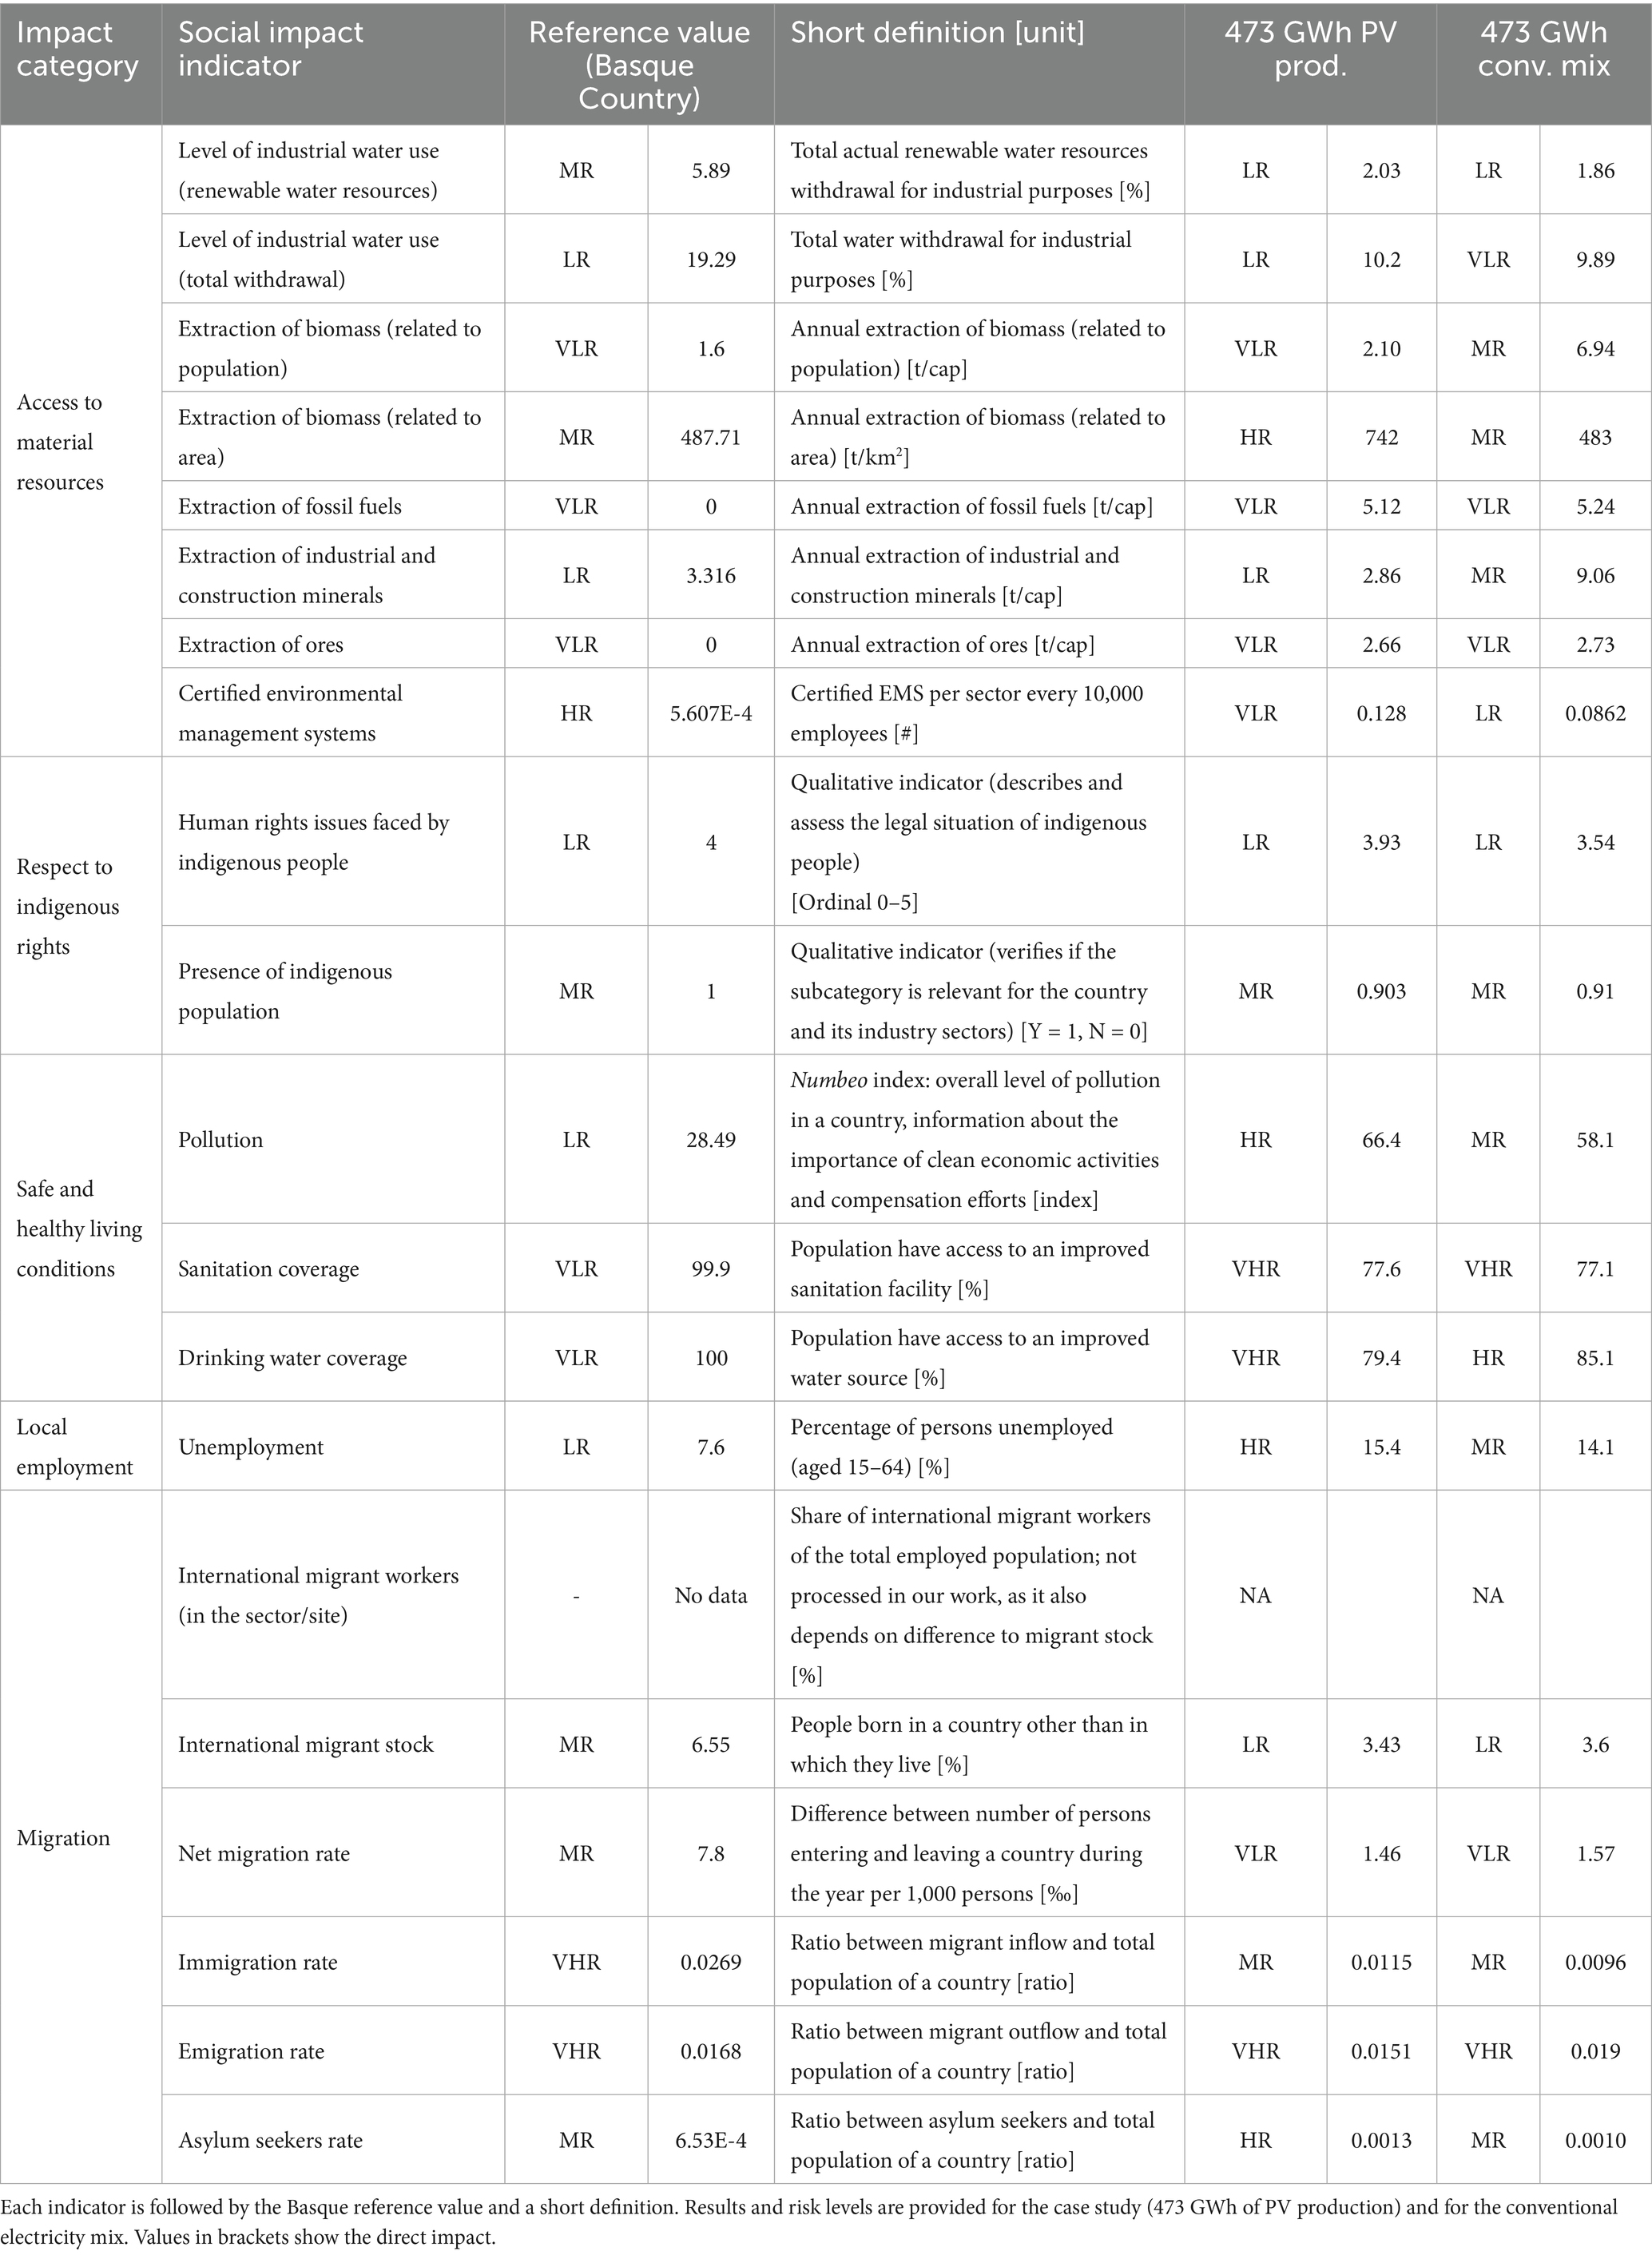
Table 6. Social impact categories and indicators for the Local Community stakeholder.
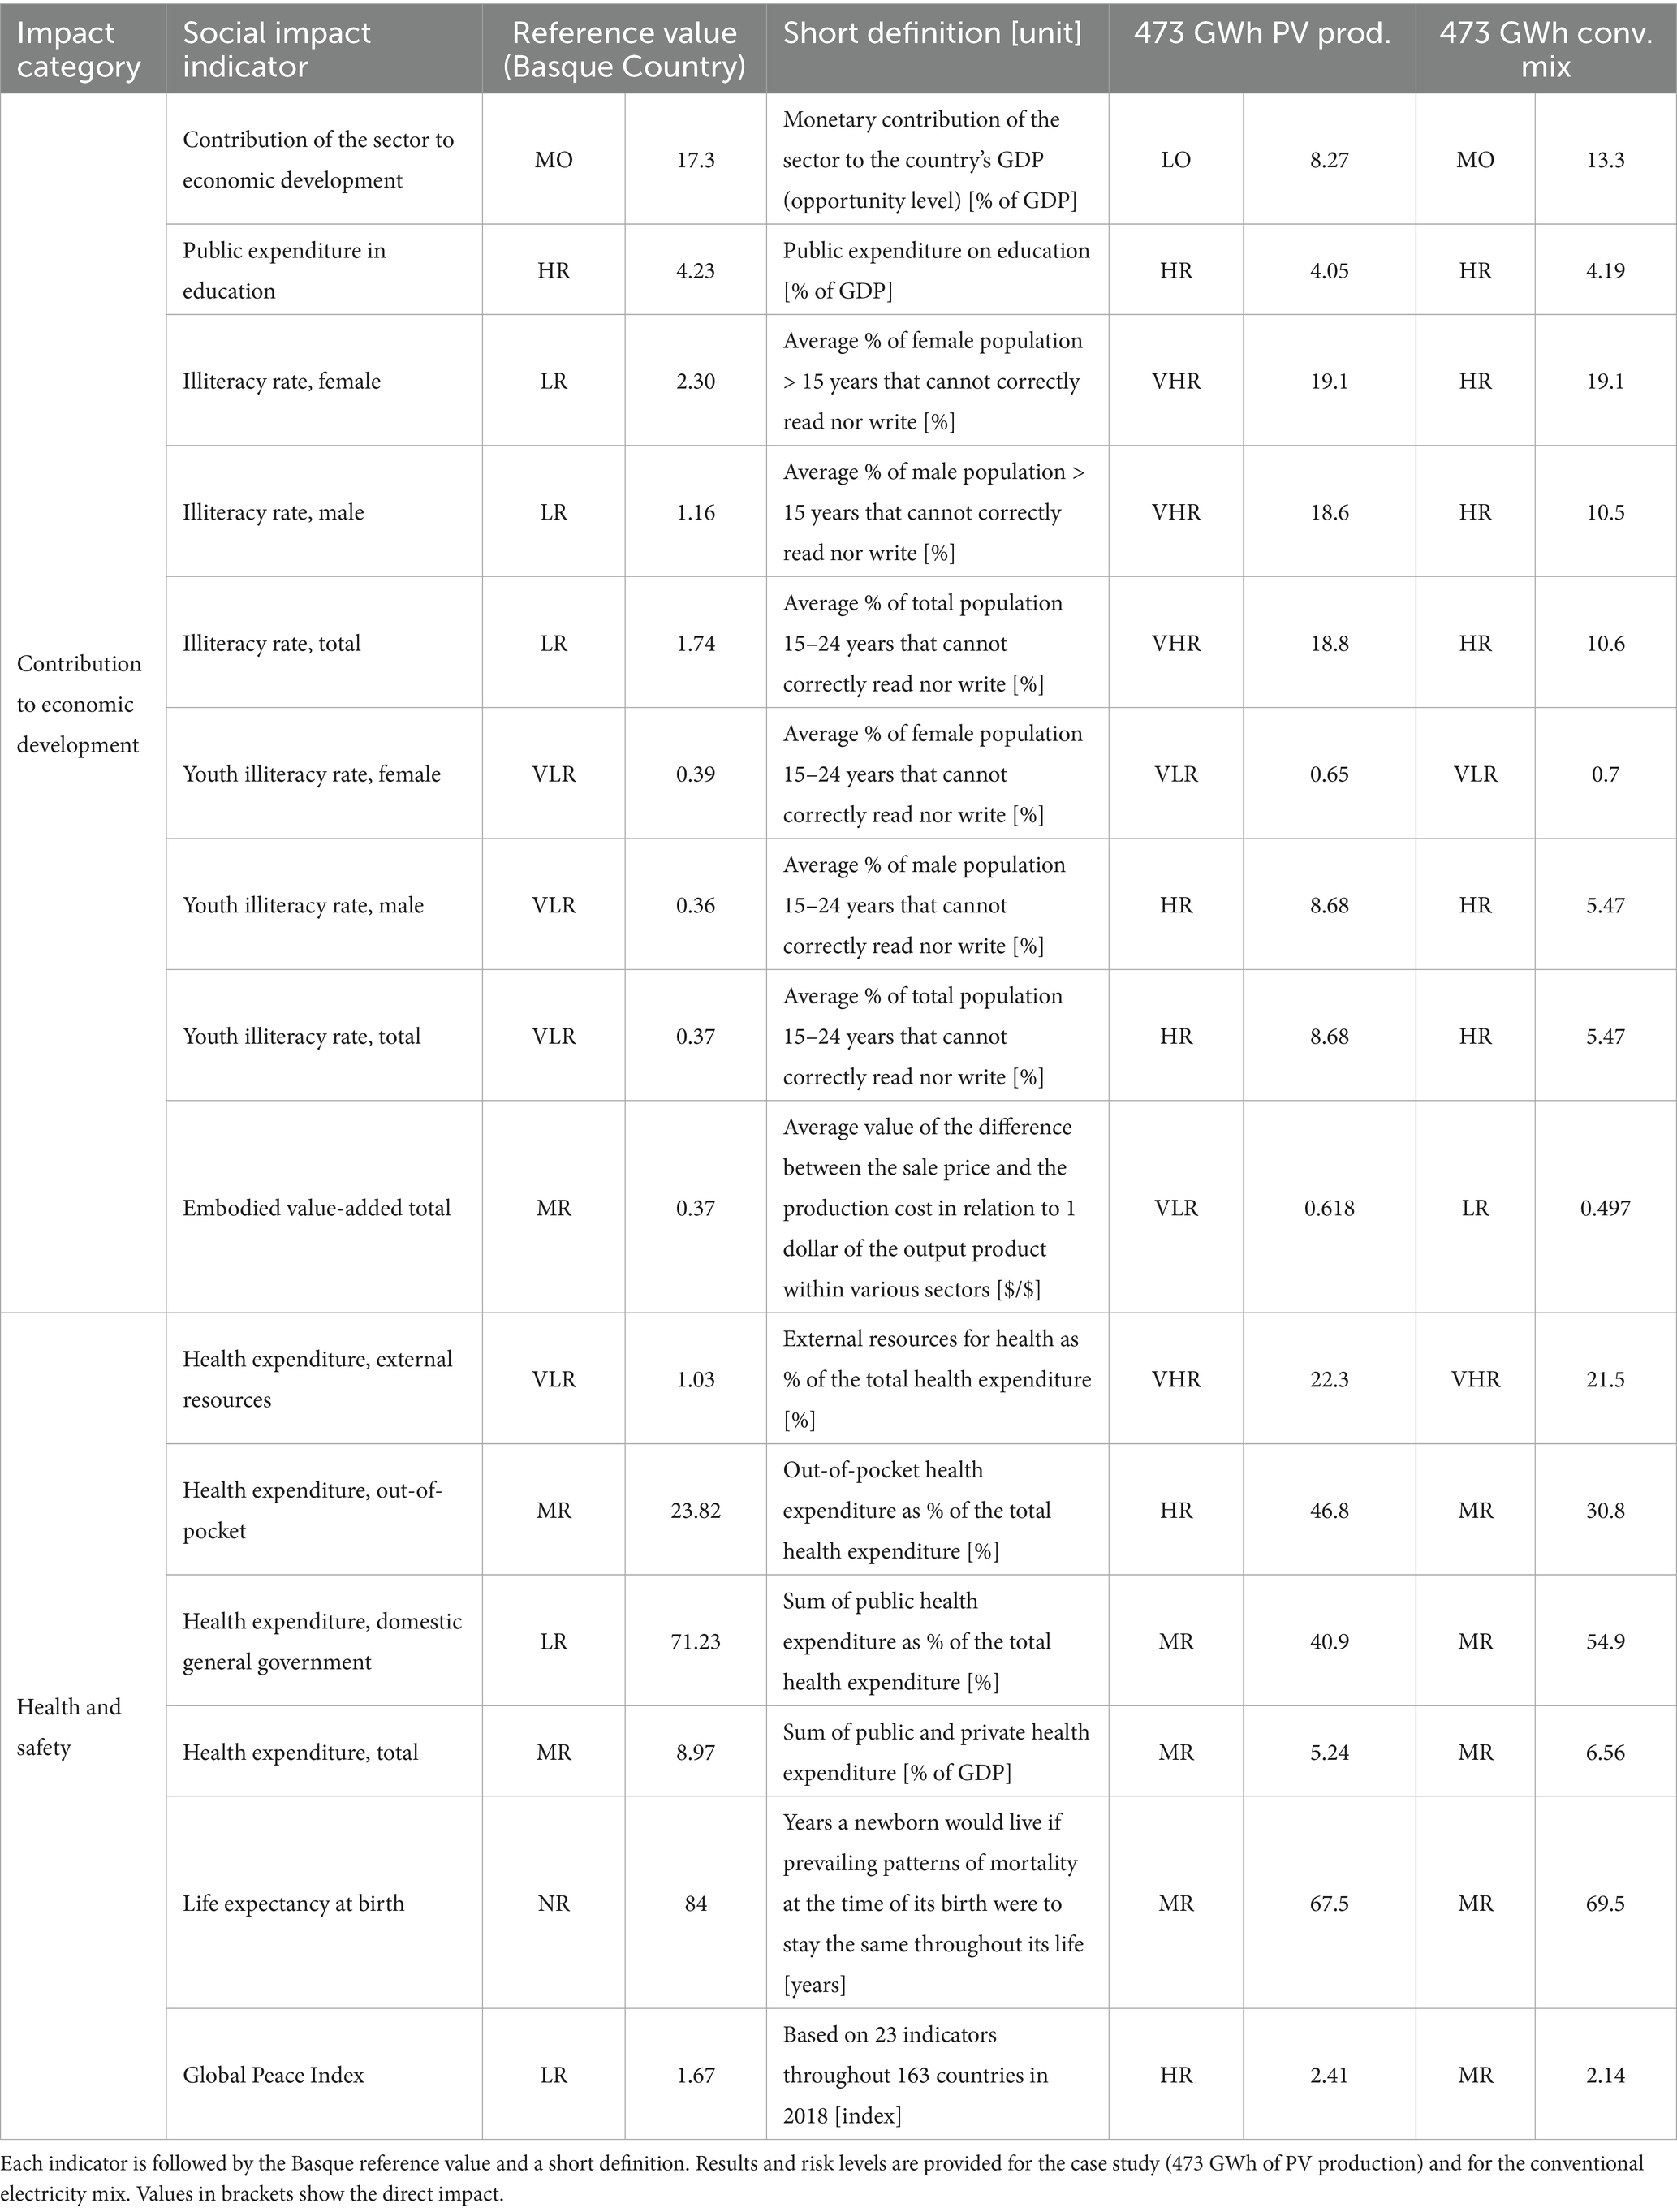
Table 7. Social impact categories and indicators for the society stakeholder.
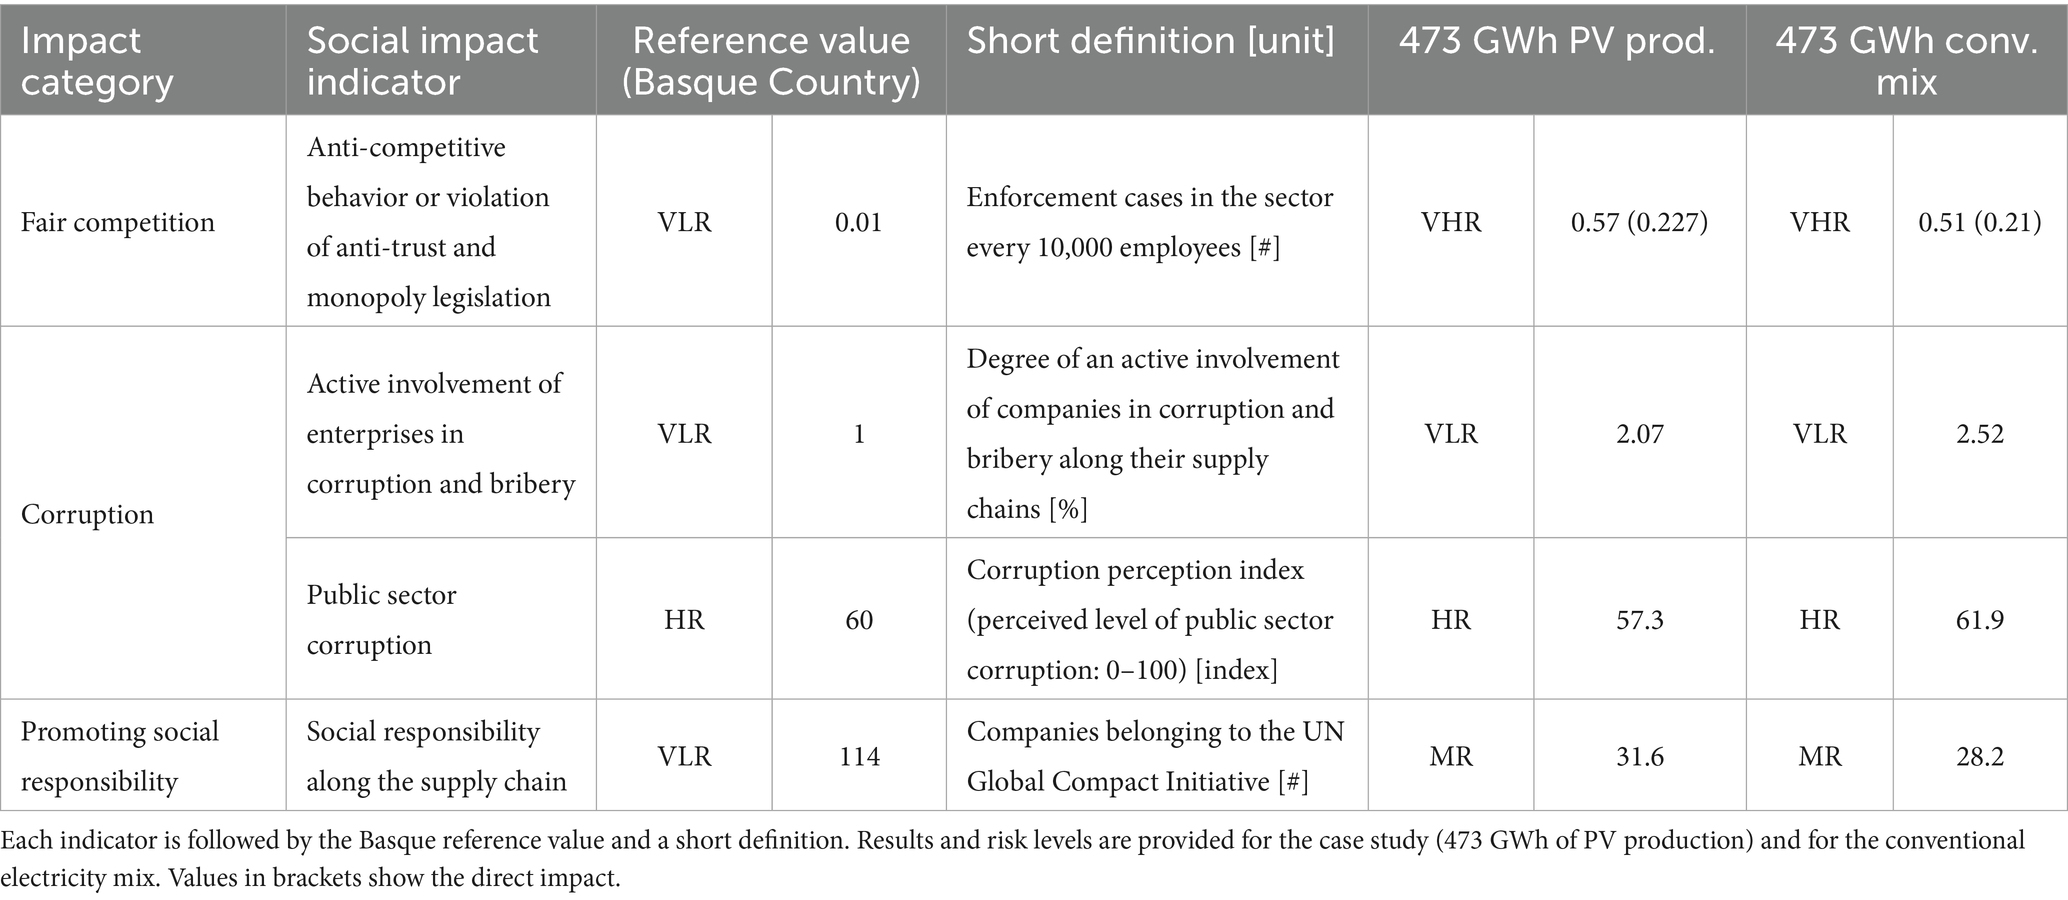
Table 8. Social impact categories and indicators for the Value-Chain Actors stakeholder.
Working hours, which are related to 1 USD of process output, are the activity variable considered by soca to calculate social impacts. openLCA based on the ratio of unit labor costs to mean hourly labor cost per employee is used for that calculation; the unit labor costs are obtained by dividing the employee compensation by the gross output (both in USD per country, sector and year). All working hours are related to a specific risk level (very low, low, medium, high, very high or no risk) for each social impact indicator. Hence, the results are measured in risk hours. In addition, total social impacts are provided by soca in terms of equivalent medium-risk hours. A factor of 10 is normally applied from one risk level to the next one (e.g., 10 low-risk hours are the same as one equivalent medium risk hour). However, the methodology of Erauskin-Tolosa et al. (2021) is followed in this paper in order to avoid the arbitrariness of these equivalence factors. Each risk level is assigned the central value from the value range considered by PSILCA for each social impact indicator. For example, in the case of forced labor, from 12 to 16 people “trapped in jobs into which they were coerced/deceived and cannot leave” per 1,000 inhabitants is considered a high risk; hence, we assign the high risk a value of 14. This way, by using the number of hours at each risk level and their assigned values, a weighted average of this risk value can be calculated for each indicator. In the case of forced labor, we obtained a risk value of 5.16, which corresponds to a low risk. This value corresponds to what has been called the indirect social impact indicator (Erauskin-Tolosa et al., 2021), which provides information on the socio-economic context of the studied process (i.e., the social footprint). However, the direct impact can be estimated by considering an annual total of 1,800 h per worker. The given example shows a total of 21.42 people in forced labor to produce 473 GWh of RPV electricity as modeled.
2.4 Methodology of the literature review on mining impacts
The bibliographic review followed a traditional non-exhaustive methodology (Codina, 2020). Two bibliographic databases were explored (Web Of Science and Google Scholar) for each of the critical minerals identified in the previous phase of the investigation: copper, silver, gold, tin, silicon and aluminum (we included the impact of coal mining as it appears to be a key resource due to the energy requirement of the transformation of silicon). The search was based in keywords: the mineral + “environmental impacts” or “social impacts” (the “review articles” keywords were added in some searches with too many outcomes). We discarded LCA studies to avoid redundancy with the present study, explored the 20/50 first results of each search and selected the articles related to our study. We also use the snowball technique to track references within the articles found. Finally, we analyzed 47 publications and selected and summarized the most relevant ones for this study.
3 Results
3.1 Primary extraction material requirements
Table 2 sets out the results obtained in kg/new MW, the case of Vitoria-Gasteiz, in kg per capita, and data of known global reserves, resources and in-use stocks, in kg per capita as well. Moreover, end-of-life recycling input rates (EOL-RIR) are also included for each material analyzed.
As illustrated in Figure 1, the ratio of primary extraction material requirements to reserves and resources is below 10% for aluminum, copper, iron, manganese, and nickel. However, the ratio to reserves for gold (28.5%, which is associated with inverters), silver (29.4%) and tin (56.2%) is very high. These values indicate that the large-scale deployment of solar PV modeled will substantially increase demand and pressure for new exploration and mining in the case of gold, silver and tin.
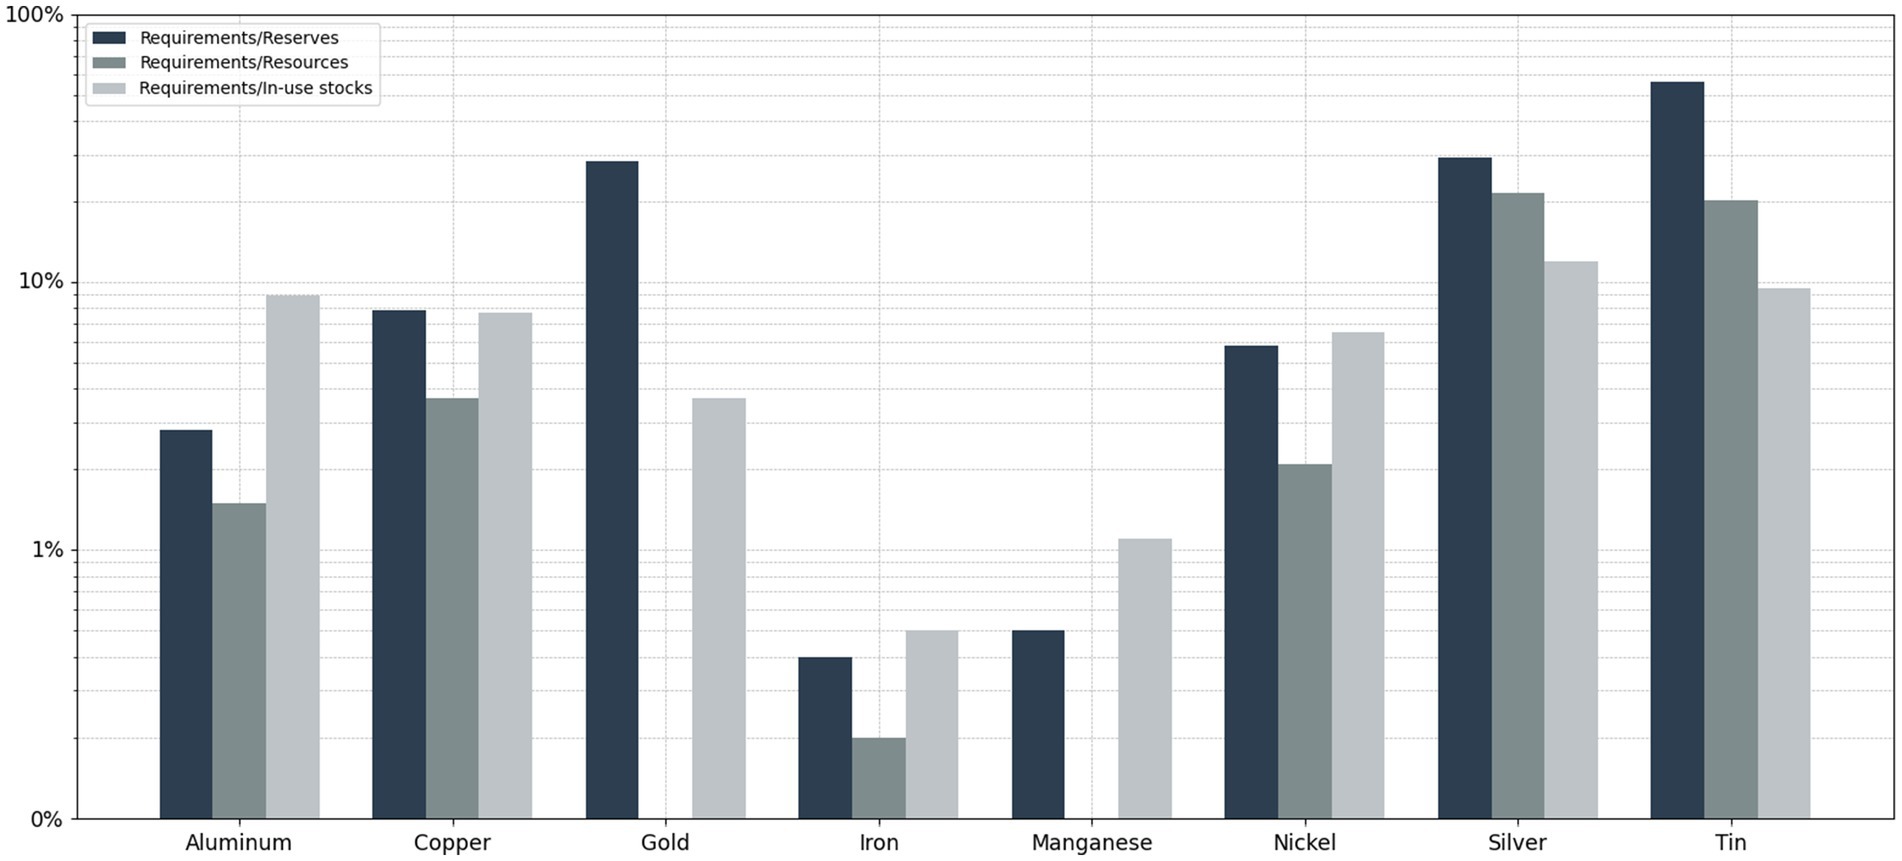
Figure 1. Primary extraction requirements vs. reserves, resources and in-use stocks (kg per capita) for RPV deployment of Vitoria-Gasteiz (460 MW installed).
Comparing primary extraction material requirements to in-use stocks provides a complementary perspective. Particularly, results show that the modeled deployment of solar PV would increase the in-use stocks of silver by 12%. In-use stocks of aluminum and tin would also increase substantially, both by 9%.
Whether recycling will be the key to lower the primary extraction material requirements, in order for the pressure for new exploration and mining not to be significant, will depend on several questions. In a 25-year scenario to 2050 of RPV global deployment at the level of the potential of Vitoria-Gasteiz, as shown in Table 3, RPVP deployment would require global production to be significantly increased for all elements, except iron and manganese, in percentages ranging between 12.2% (copper) and 27.8% (tin). In the case of solar-grade silicon (polysilicon), the production capacity would have to increase by more than triple. Therefore, secondary materials from recycling will become a lower fraction of total input requirements, and thus, the EOL-RIR may decrease, unless scrap collection and recovery expand significantly.
3.2 Environmental impacts
3.2.1 Results of the environmental-LCA
Table 4 presents the environmental impacts associated with generating 473 GWh of electricity through RPV deployment in Vitoria-Gasteiz, considering all impact categories defined by the Environmental Footprint (EF) v3.1 impact assessment method. Both absolute values and relative impacts—expressed as a percentage of the impacts from the Spanish conventional electricity mix, which contains only 6.7% of non-open ground PV and 11.2% for total PV (Wernet et al., 2016), for the same amount of energy generated—are provided to facilitate the interpretation of these result. This comparison allows for a clear understanding of the environmental benefits of RPV in contrast with conventional energy sources.
Results confirm that RPV technology has lower impacts across all impact categories when compared to the conventional electricity mix. Metals/minerals material resources, among the most relevant impact categories, presents the highest relative impact, accounting for 93% of the conventional mix impact, primarily due to the significant consumption of metals like gold (which is associated with inverters), silver and tin. The environmental impact of the mining of gold, copper, silver, and tin is summarized in section 3.2.2. This result may seem counterintuitive, since, as shown previously, RPV systems entail substantial primary extraction material demand. However, the high metals/minerals material resources impact in the conventional mix is mainly due to copper mining for distribution infrastructure (including transformation and transport), and while distributed generation—a key advantage of RPV—may reduce such needs, large-scale RPV deployment would still require certain distribution and storage systems, which remain beyond the scope of this study.
In contrast, non-renewable energy resources shows a much lower impact, at only 9% of the conventional mix, highlighting the advantage of photovoltaic systems in reducing fossil fuel dependence. The consumption of fossil fuels, despite being inexistent in the direct PV energy generation, concerns the extraction of raw materials and the manufacture of the different parts of the installations.
With an impact equivalent to 58% of the conventional mix, ecotoxicity is significant too, mainly attributed also to the extraction and processing of raw materials, which is often accompanied by pollution and tailings generation as explained in the review of the following section. In terms of climate change impacts, RPV technology demonstrates significantly lower emissions compared to the conventional mix, with the main contribution coming from fossil emissions (21%). Acidification and eutrophication impacts remain below 30% for all subcategories, with freshwater eutrophication being the most affected (65%), driven by phosphorus emissions related to module production. Land use and water use impacts are relatively noteworthy, at 30 and 37% of the conventional mix, respectively. Human toxicity (40%) and ozone depletion (50%) impacts, although present, remain moderate, and ionizing radiation is instead significantly lower, accounting for only 3% of the impact of the conventional mix.
The seven impact categories marked with an asterisk (*) in Table 4 have been further analyzed to identify their correlation with specific components of the PV system and the geographical location of their occurrence (see Figures 2, 3). These disaggregated analyses enable a deeper understanding of the hotspots within the photovoltaic value chain and potential areas for improvement. Regarding the contribution of the different parts of the RPV installation to the selected impact categories, the environmental impacts corresponding to operating the system are so negligible compared to the other ones that we do no longer refer to them in the environmental LCA.
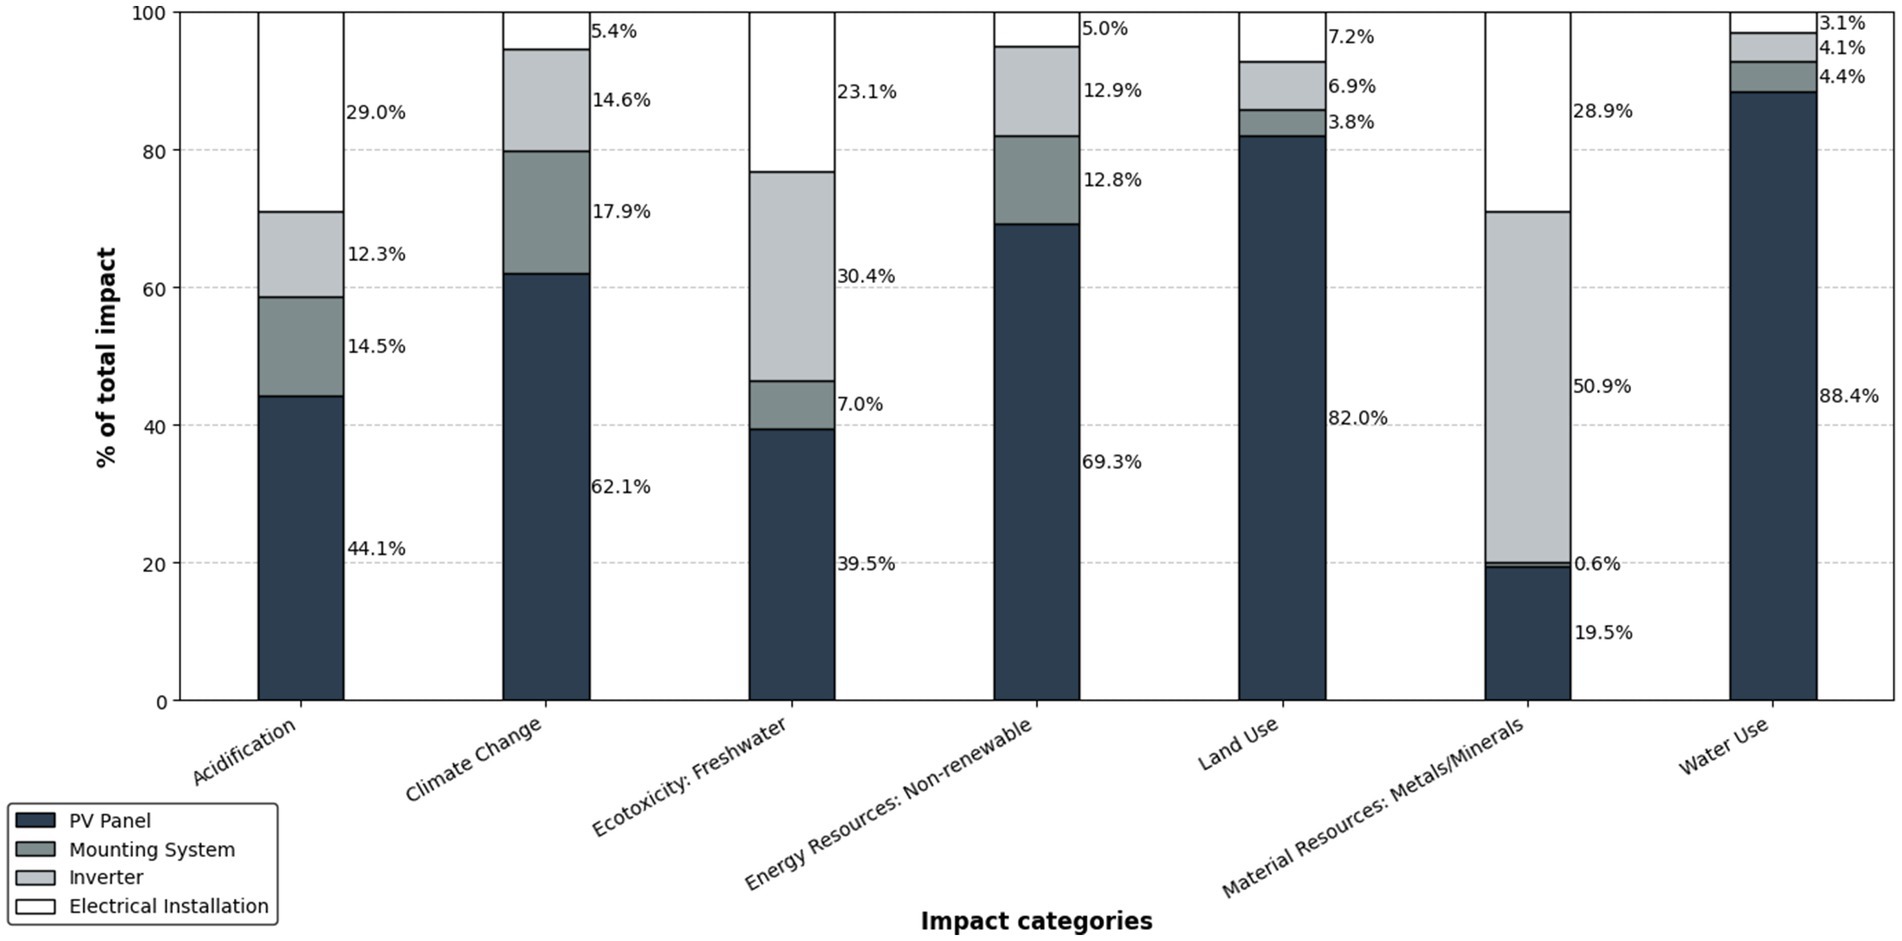
Figure 2. Relative contribution of the different parts of a RPV installation to the selected environmental impact categories for the case study (473 GWh of PV production).
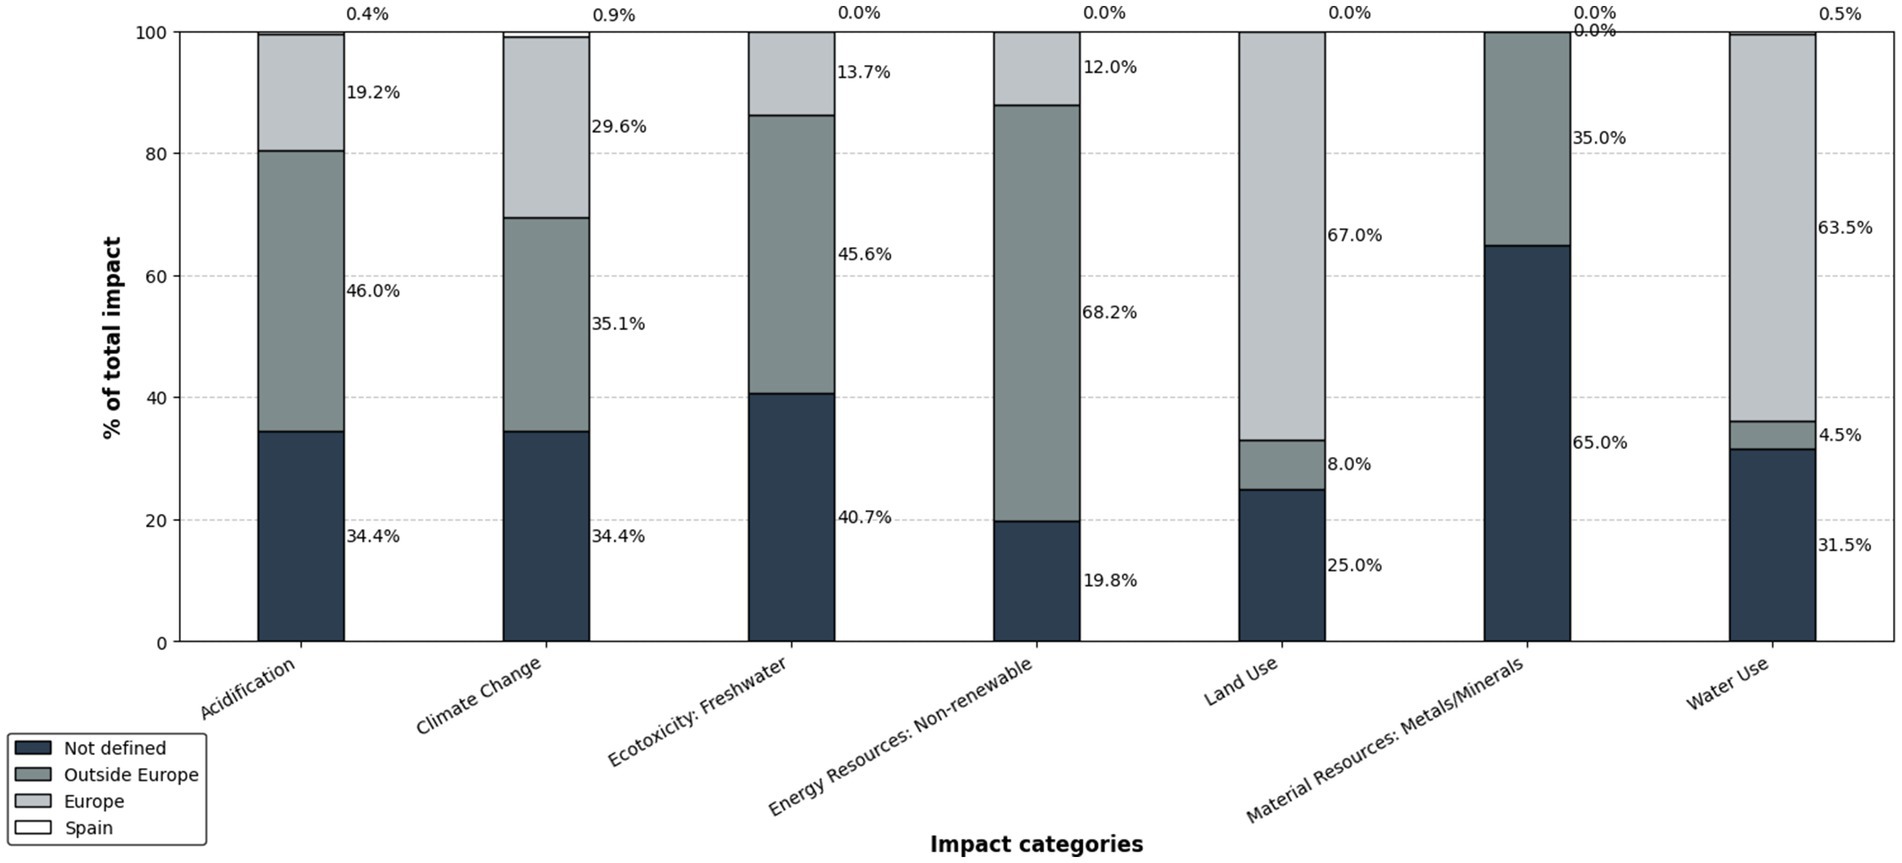
Figure 3. Location assigned to the selected environmental impact categories for the case study (473 GWh of PV production).
Figure 2 illustrates the relative contribution of the different components of the PV system to the total environmental impacts. Among these, the PV panel exhibits the highest contribution in most impact categories, particularly in climate change (62%), non-renewable energy resources (69%), land use (82%), and water use (88%). These impacts are mainly linked to the energy-intensive manufacturing of silicon wafers and the extraction of critical raw materials. Silicon itself accounts for 68% of the impact in water use and approximately 30% in both climate change and non-renewable energy resources. Furthermore, about 50% of the land use impact is associated with the production of wood boards, which are used for manufacturing flat pallets for transporting PV panels. This emphasizes the importance of logistics and packaging in the overall environmental footprint.
The inverter also entails a considerable share in metals/minerals material resources (51%) and in freshwater ecotoxicity (30%), reflecting the environmental burden associated with electronic components and metal use. In particular, the gold factory (which according to openLCA includes the extraction and processing of both gold and silver) is a key contributor, accounting directly for 25% of freshwater ecotoxicity and 48% of metals/minerals impacts. Similar to the inverter but on a smaller scale, the electrical installation also contributes to these two impacts, while additionally being notably relevant in terms of acidification (29%). This is primarily due to the extensive use of copper wiring and other conductive materials, which significantly influence the environmental burden of this component. In fact, the copper industry alone contributes to 28% of metals/minerals and 27% of acidification impacts, and is essential in all conductive elements. Finally, the mounting system plays a secondary but still notable role, especially in acidification (15%) and climate change (19%), due to the use of metal structures involving processes with significant emissions.
Figure 3 provides information on the localization of impacts. The results indicate that the greatest part of the environmental impacts occurs outside Europe, especially in the categories of freshwater ecotoxicity (46%) and non-renewable energy resources (68%). In terms of metals/minerals material resources, it is even more striking, as 100% of the geographically defined impact occurs outside Europe. This reveals a strong dependency on imported materials from regions beyond the continent, with significant environmental consequences.
Within Europe, the most notable impact is in the category of land use (67%). As explained above, a substantial portion of this impact (50%) is related to wood forestry for pallet production, principally linked to Sweden and Germany by the ecoinvent database used. Europe also has a considerable share of impacts related to climate change (30%) and water use (64%). The water consumption is down to the use of water resources for silicon processing. Moreover, this industry demands a significant amount of energy, mainly supplied both by hydropower generation—which further increases water consumption—and by fossil fuels, which substantially contribute to the climate change impact. Lastly, despite being the focus of the photovoltaic deployment raised in this study, Spain shows practically negligible environmental impacts in all categories, with values not exceeding 1%.
3.2.2 Literature review on the environmental impacts of mining
We can trace the environmental impacts of mineral mining for every time stage of the activity. Before the extraction starts, ecosystems and previous land uses are disrupted—particularly in open-pit mining, but also underground due to infrastructure. Luckeneder et al. (2021) found that 79% of global metal ore extraction in 2019 took place in five of the six most species-rich biomes, and half occurred within 20 km of protected areas. Further, 90% of sites are in areas of below-average water availability, with copper and gold mining often situated in water-scarce zones.
Metals such as copper, gold or silver is frequently extracted from sulfide ores, which also applies to some coalfields. A major issue is acid mine drainage, where sulfides exposed to air oxidize and acidify surrounding waters. This not only lowers pH but also dissolves heavy metals like lead, zinc, or nickel, contaminating ecosystems and communities downstream of a metal/coal mine (Pandey et al., 2007).
The generation of tailings in the world today is immense, since only ounces or pounds of metals are extracted for each ton of ore processed. In 2022, it was estimated that more than 14 billion tons of mining tailings were produced in the world (Cacciuttolo and Cano, 2022). For instance, the Xianjiang area is the most polluted area in China due to soil and water contamination by arsenic, partly natural and partly generated by cooper mining and tailings (Karn, 2015). In Northeast India, acid drainage from coal mining has turned farmland into wasteland (Choudhury et al., 2017).
The Ok Tedi mine is a relevant case. Operating in Papua New Guinea since 1984, it is considered a “slow-motion environmental disaster” (Kirsch, 2014). After an earthquake destroyed the tailings dam, 90 million tons of waste were annually dumped into rivers, affecting agriculture, fisheries, and livelihoods (Skrzypek, 2022). Even if operations ceased today, full recovery would take 150–300 years. Similar issues are seen at the Huanuni tin mine in Bolivia, where untreated tailings have polluted rivers, soils, and farmland for a century. The water below Huanuni is so contaminated it cannot support life or be used for irrigation or drinking (Perreault, 2013). In Chile, small-scale mining of copper, silver, and gold—while limited in output—causes significant pollution due to lack of treatment systems and high exposure to toxic materials (Castro and Sánchez, 2003). Acid drainage can persist for decades or centuries and spread over wide areas. Asia’s biggest copper mine (Malanjkhand, India), active since 1882, still shows contamination in water, sediments, and even in local plants and animals despite modern technologies (Pandey et al., 2007).
Tailings and contaminated water are typically collected in dams, but accidents still occur, with devastating effects. Examples include the Mariana (Brazil, 2015), Mount Polley (Canada, 2014), and Ajka (Hungary, 2010) disasters. In the Boac River (Philippines), a 1996 dam failure destroyed river-based livelihoods. Studies show acid leaching from tailings continues to pollute the area (Roche et al., 2017). Although water dam collapses have declined over recent decades, tailings dam failures—due to poor design, lack of oversight, or cost pressures—have become more severe (Roche et al., 2017). Climate change further increases risks to these structures. If companies are not legally bound to maintain post-closure pollution controls, the burden falls on the public, as seen in Summitville (United States), where cleanup cost taxpayers $150 million (Warhurst and Mitchell, 2000).
Certain inputs in mining are highly hazardous, notably mercury and cyanide used in gold extraction. These pose health and environmental risks during regular use and in case of accidents. Cyanide-contaminated water is deadly for wildlife, especially fish, birds, and bats (Eisler, 2004). In Baia Mare (Romania, 2000), a cyanide spill killed 200 tons of fish and harmed protected species (Eisler, 2004). Mining also causes sedimentation in rivers, severely affecting ecosystems. In Brazil, tin mining—legal and illegal—has altered river profiles, destroyed biodiversity, and created irreparable ecological damage (Andrade, 1999).
Aluminum, important in PV panel production, is environmentally damaging during both bauxite mining and smelting. In Malaysia, bauxite mining has caused dust, water and soil pollution, harmed crops, and increased cancer risk among communities (Lee et al., 2017). Aluminum smelting is highly electricity-intensive and closely linked to dam-building, which causes deforestation, habitat loss, displacement, and greenhouse emissions (Fearnside, 2016).
We can expect that the scale of mining’s social and environmental toll increases, as demand rises and lower-grade deposits are exploited, and impacts correlate with the massive volume of mine waste (Mudd et al., 2020; Prior et al., 2012).
3.3 Social impacts
3.3.1 Results of the social-LCA
Tables 5–8 show the social impacts and their associated risk level for the production of 473 GWh of PV electricity, modeled in this work for Vitoria-Gasteiz. Each social impact indicator in Tables 5–8 is followed by its reference value and a short definition. Reference values are those considered characteristic for the Basque Country and have been obtained from the EHU Aztarna project (Erauskin-Tolosa et al., 2021), except for the sectoral values, where the Spanish values of the electricity sector have been obtained from soca (Eisfeldt, 2017). Results are compared to the production of 473 GWh of electricity with the current mix, modeled by ecoinvent for the year 2020 (where fossil fuels have a share of 45.44%, renewable energies 43.45% and the remaining 8.11% comes from imported electricity). Each table shows the results for a different stakeholder: Workers (Table 5), Local community (Table 6), Society (Table 7), and Value-chain actors (Table 8). Direct impacts are also shown in brackets for some indicators. For example, according to the definition of the frequency of forced labor impact indicator (Table 5), the results show that there are 5.2 people “trapped in jobs into which they were coerced/deceived and cannot leave” for every 1,000 persons. However, taking into account the total amount of hours at every risk level, and considering that every person works an annual amount of 1,800 h, we calculated that 24.7 people would be in forced labor. Although that is not reflected in the tables, it is noteworthy that the activity hours are almost 40% higher for the current electricity mix (a total of 14.0 million hours), as compared to PV electricity production (8.6 million hours). Therefore, direct impacts can be greater for the current mix electricity production, even when the risk level is lower. This difference could be explained by the fact that PV system is simpler, as it requires less work after its installation. However, it is worth reminding that the distribution and storage stages are not being considered in this study, which could lead to an underestimation of the total activity hours.
As can be observed in Table 5, overall, the risk level increases when compared to the reference values for the Basque Country. Six out of 44 impact indicators for the Workers stakeholder present a high or a very high-risk level, as opposed to the four reference indicators that present a high/very high-risk level. However, the risk for the conventional electricity mix is even higher (seven high/very high-risk level categories). The risk level increases with respect to the reference for 13 indicators (frequency of forced labor, trafficking in persons, minimum wage per month, sector average wage per month, weekly hours per employee, women in the sectoral labor force, gender wage gap, DALYs due to indoor and outdoor air and water pollution, Social Security expenditures, violations of employment laws and regulations, workers affected by natural disasters and right to strike). As further explained below (see Figure 2), most of the working hours related to the PV electricity production throughout its life cycle are held outside Spain and Europe, probably in countries with a laxer labor legislation. The risk level decreases for three indicators (men in the sectoral labor force, non-fatal accidents and violations of mandatory health and safety standards) and it does not change with respect to the reference for the remaining indicators. Nevertheless, the risk does increase in some cases. For example, the risk level is very low for the child labor impact category in both the reference and the PV production scenarios, but when taking into account the whole life cycle (i.e., for the modeled PV production), the value of the total child labor indicator is more than doubled, as compared to the reference. Once again, the socioeconomic context of other countries where most of the labor activities are taking place gains relevance.
Regarding the Local community stakeholder (Table 6), the risk tends to increase. Seven out of 20 impact indicators present a high or very high-risk level. The number of high-risk-level indicators is greater than for the reference value, but also greater than for the conventional electricity (in both cases, three out of 20 indicators present a high/very high-risk level). In comparison to reference values, the risk level increases for six indicators (extraction of biomass related to area, pollution, sanitation coverage, drinking water coverage, unemployment and asylum seekers rate) and decreases for five indicators (level of industrial renewable water use, certified environmental management systems, international migrant stock, net migration rate, and immigration rate). The activities related to PV electricity production result in a high pollution level of the countries where they take place. As it can be seen from the results, they are countries with a scarce sanitation and drinking water coverage. These results match with some of the problems reported in the bibliographic search, such as the health problems derived from mining pollution. The low-risk levels within the category access to material resources is striking. The only indicator which presents a high-risk level is the biomass extraction related to area, which directly matches the dispossession of forest land, reported in the bibliographic search. Even if it still presents a very low risk level, the extraction of fossil fuels and ores increases with respect to the reference value (which is 0), but the extraction of industrial and construction minerals decreases. The reason is that this impact indicator is dominated by the hard coal mining operation, for the production of electricity consumed by the manufacturing of Si. This impact is located mainly in India, which is one of the main coal producers worldwide, but has a very high population. Hence, the risk level for this indicator, measured in annual t per capita, is very low. However, the social impacts of coal mining in India are not negligible at all as explained in section 3.3.2.
As Table 7 shows, Society is the stakeholder where the overall risk level increases most. Nine out of 15 indicators present a high or very high-risk level, a much higher number than for the reference scenario (where only one indicator presents a high-risk level) and also higher than the one for the conventional electricity mix (seven out 15 indicators have a high/very high-risk level). While the risk level of only one indicator decreases (embodied value-added total), the risk level associated to 10 indicators notably increases. The activities related to the PV production are shown not to contribute to the economic development of the countries where they take place. The contribution of the sector to economic development indicator presents a low level of opportunity, but what is especially noteworthy is the high illiteracy level, both for young people and for the total population. The impacts related to the health and safety category are also risky. While the domestic general government expenditure on health is moderate, the expenditure of households (out of pocket) and from external resources (such as international organizations) are high, which show that public health expenditures are not sufficient to cover health issues (Eisfeldt and Ciroth, 2016). Even if it presents a moderate risk level, the life expectancy at birth (67.5 years) is notably lower than the reference value (84 years). The Global Peace Index, which is related to political stability and the risk of conflicts of a certain country (Eisfeldt and Ciroth, 2016), also shows a much higher risk level than the reference. This matches the repression and violence environment reported in the bibliographic search.
Finally, as shown in Table 8, two out of the four indicators related to the Value-chain stakeholder, present a high and very high-risk level. This number is the same for the conventional electricity mix, but it is lower for the reference value (one out of four indicators). While the risk level of two indicators increases (anti-competitive behavior or violation of anti-trust and monopoly legislation and social responsibility along the supply chain), none of the categories presents a lower risk.
A detailed analysis of 14 social impact indicators is presented in Figures 4, 5. The indicators with highest risk levels and highest increases of the risk level with respect to the reference were chosen. Figure 4 shows the relative contribution to the impacts of the different sub-processes involved in the PV electricity production: panel production, inverter production, mounting system, electrical installation and system operation. It should be clarified that soca allocates a certain amount of activity hours to the modeled process in the form of “direct contribution,” which should be interpreted as activity hours associated to the system operation. The hours related to the system operation are not calculated through an inventory of the activity, but through the ratio of unit labor costs to mean hourly labor cost per employee (section 2.3.2). As stated in section 2.1, all sub-processes were modeled with a cradle-to-grave perspective, from the upstream to the end of life.
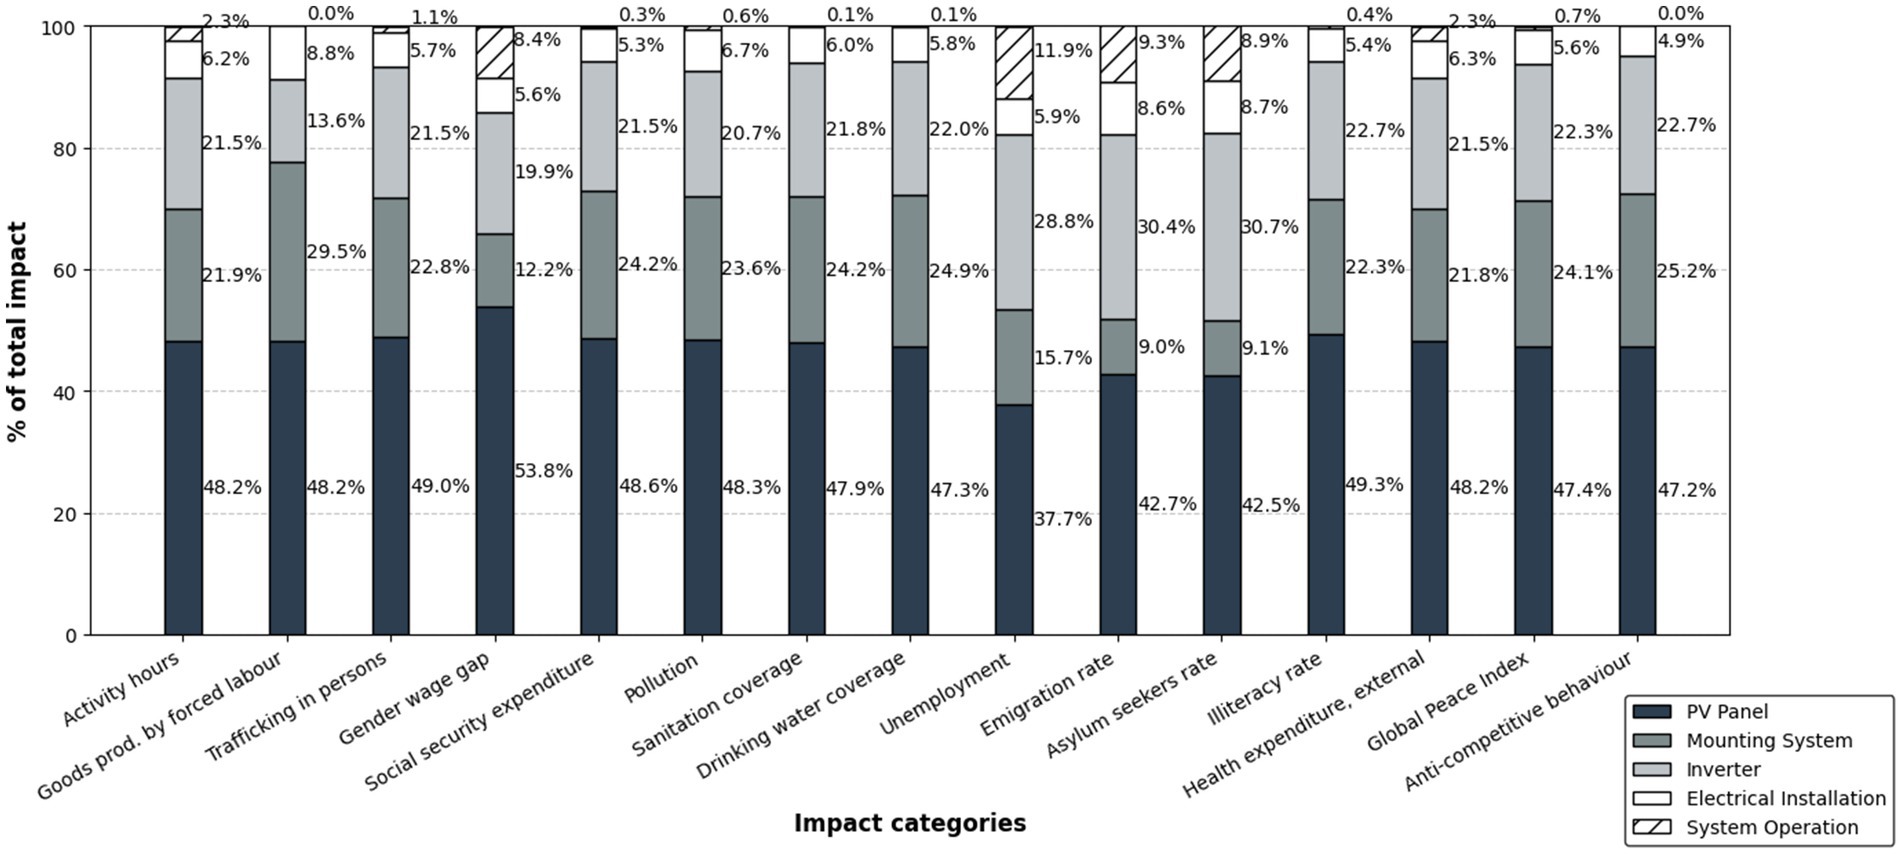
Figure 4. Relative contribution of the different sub-processes to the impacts for the case study (473 GWh of PV production). First column shows the share of the total activity hours.
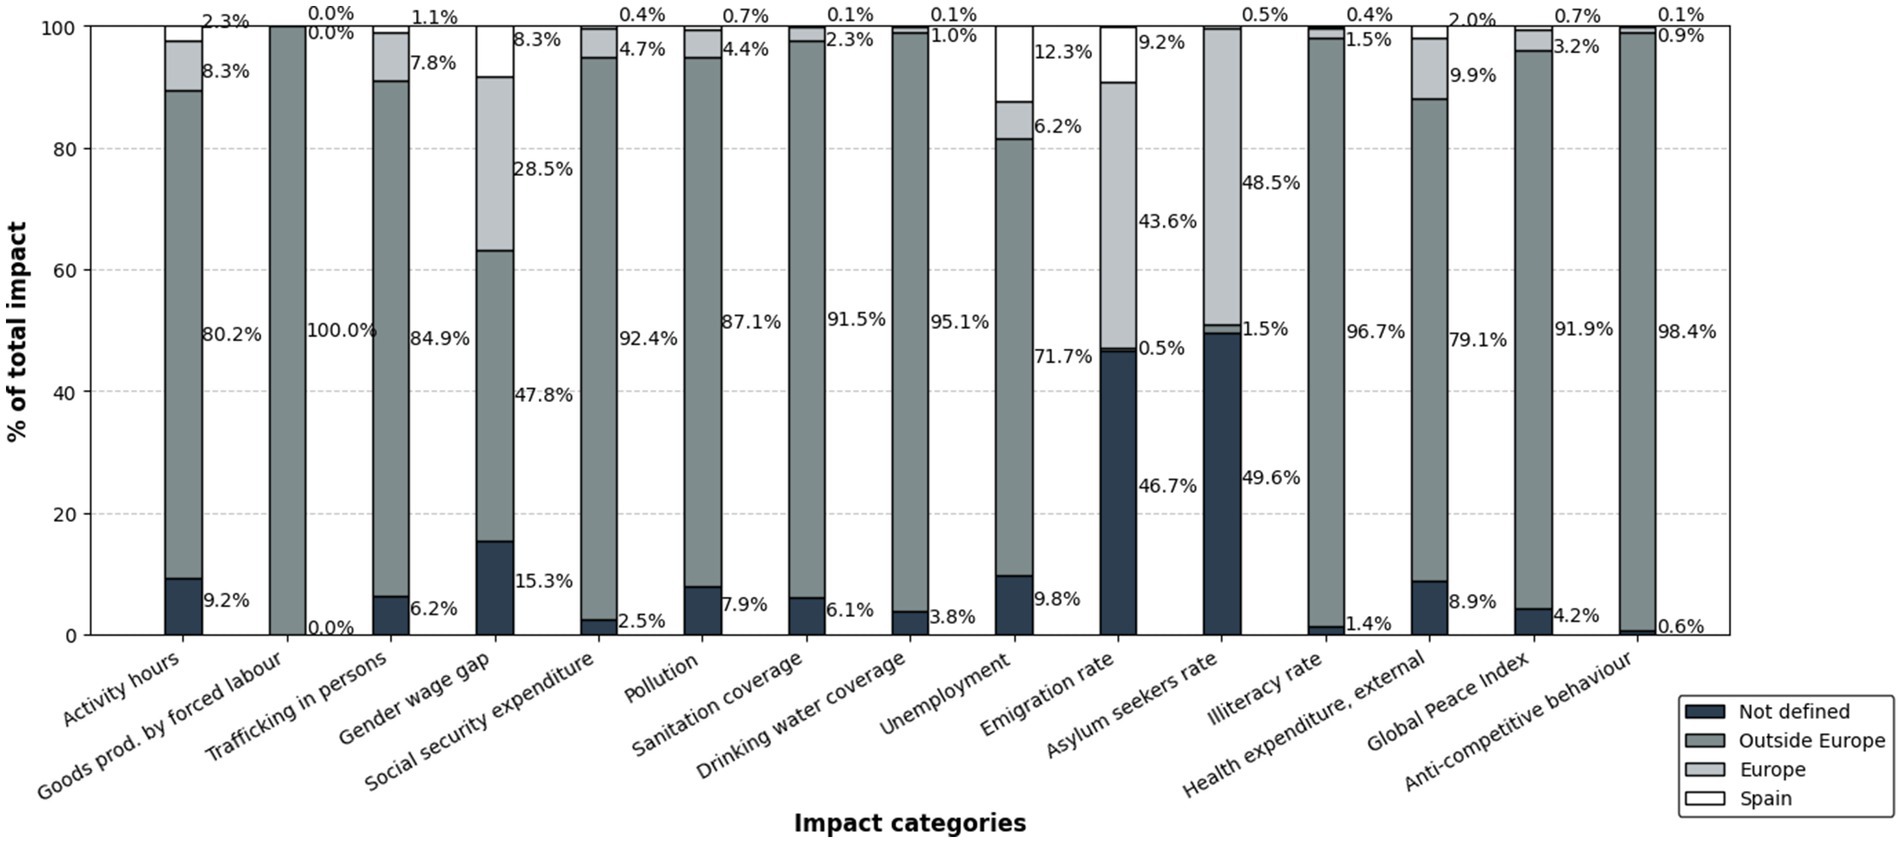
Figure 5. Location of the impacts related to each indicator for the case study (473 GWh of PV production). First column shows the share of the total activity hours.
The first column of the figure is not related to the impacts, but to the activity hours, i.e., it shows the share of each sub-process in the total number of hours involved in the process, regardless of their risk level. 48.2% of the activity hours corresponds to the panel production, 21.9% to the mounting system, 21.5% to the inverter production, 6.2% to the electrical installation and 2.3% to the system operation. 28.5% out of the total activity hours correspond to mining and production of metals. Most of them (20.8% of total activity hours) are related to Al production for the mounting system, followed by PV panel production, where 5.5% of total activity hours is related to metal production. On the other hand, only 3.5% of the activity hours are related to Silicon production, most of them related to the PV panel production.
Returning to Figure 4, the total number of hours of each sub-process was weighted by risk level, as previously performed (Erauskin-Tolosa et al., 2021), in order to account for the contribution of the sub-processes into the impact indicators in the remaining columns. The share of the sub-processes remains similar to what observed in the activity hours in the case of most of the indicators. The main differences arise for unemployment, emigration rate and asylum seekers rate, where system operation gains importance, with a share from 8.9 to 11.9%. Inverter production also increases in importance (28.8–30.7% share), which causes panel production to have a lower share (37.7–42.7%). System operation also shows a raise in importance for the gender wage gap impact (8.5%), where there is a drop in the share of mounting system (12.2%). The opposite occurs with goods produced by forced labor, where the share of system operation is null and the mounting system gains a weight of 29.5%.
Figure 5 shows the location of the impacts related to each indicator: Spain, Europe or outside. In the same way as for Figure 2, the total number of hours of each sub-process was weighted by risk level. The locations “Global” or as “Rest of the world” from the ecoinvent database were considered as not defined. 80.2% of the total activity hours are outside Europe and, with a few exceptions, this trend is more pronounced in the case of the impact indicators. Even though it is not shown in the figure, it is particularly worth noting that most of the high risk and very high-risk hours occur in Global Southern countries such as India, China and African or South American Countries.
The most prominent exceptions are emigration rate and asylum seekers rate. Although impacts related to displacements (high rates of temporary male immigration and accelerated social changes due to immigration) have been reported for the mining regions, results show that only 0.5 and 1.5% are outside Europe, respectively, even if the location of 46.7 and 49.6% of the impacts is not defined. These are followed by gender wage gap, where 36.8% of the impacts occur within Spain and Europe, and by unemployment, where 18.5% of the impacts occur in Spain and Europe. These four indicators are those where direct impact (related to system operation) gains importance. These are the kind of impacts that tend to have the greatest influence on the Global North.
Conversely, 100% of the risks related to goods produced by forced labor occur outside Europe. The highest risk hours are in India, related to gravel, cement and limestone production, and in China, related to hard coal and coke production. This impact is followed by anti-competitive behavior or violation of anti-trust and monopoly legislation, where 98.4% of the impacts are held outside Europe, particularly in India and South Africa, related to the hard coal mine operations. 96.7% of the impacts related to illiteracy are also outside Europe, mostly related to the hard coal mining in India.
3.3.2 Literature review on the social impacts of mining
From a production chain perspective, social impacts and conflicts can start before extraction itself. For instance, problems may emerge due to the access to resources, such as land or water, fostering processes of speculation and dispossession (Bebbington, 2013). This dispossession can be direct (lands bought at low prices or expropriated) or indirect (pollution). In the case of bauxite mining in Adivasi lands of Eastern India, the major impact claimed by communities are the land use changes and the loss of land-dependent rural livelihoods, forest lands, water resources and indigenous sacred hills (Oskarsson, 2017). Mining is the biggest source of displacement in India after dams, with victims potentially numbered in millions (Oskarsson, 2017). In the Bolivian altiplano, water can no longer be used for irrigation or human and cattle consumption, due to more than 100 years of tin mining (Perreault, 2013). Owen et al. (2022) signal that the majority of the world’s mining projects of the transition minerals are located either on or near Indigenous Peoples’ or Peasant lands with adverse conditions for human rights-compatible permitting, consultation, and consent. This can lead to the exacerbation of social inequalities in already vulnerable locations.
Social impacts also occur during mining operation and are related to the health problems derived from mining pollution. For instance, the notorious spill of 151 kg of liquid mercury in Choropampa, near the Yanacocha goldmine in the Peruvian Andes in the 2,000 s, poisoned over 900 villagers and fostered civil resistance (Arana-Zegarra, 2009). Health impacts are also associated with the daily processes of water pollution. An et al. (2004) report on the relationship between tin mining in Yunnan, arsenic contamination and cancer cases. Some 16 million artisanal miners in more than 70 countries, mostly in the Global South, (producing 12–15% of the gold mined worldwide) use mercury to separate gold from the rest of the ore: the harmful health effects of mercury for artisanal miners have been clearly established (Castro and Sánchez, 2003; Nkuba et al., 2019).
When it comes to labor conditions, the case of the region of Xiantiang is relevant. 95% of solar panels worldwide are made up of polysilicon (Department of Labor, 2021) and 35–45% of global polysilicon production and quartz mining takes place in the Xinjiang Uyghur Autonomous Region (Crawford and Murphy, 2023b). Different organizations denounce forced labor and other human rights violations against workers belonging to minoritized groups in the Uyghur region, among others, in the mining and polysilicon production industry (Crawford and Murphy, 2023a).
Other social impacts are related to high rates of temporary male immigration, alcohol problems (James et al., 2021), increased prostitution and male violence against women and children (Mishra et al., 2024), and local conflicts and repression (Arellano-Yanguas, 2023). Social conflicts can lead to community disintegration, repression and violence (EJAtlas, 2025). In Papua New Guinea, the widespread environmental and social impacts of Panguna copper mine resulted in a civil war (Mudd et al., 2020).
In the case of metal mining in Latin America, Arellano-Yanguas (2023) summarizes the main social impacts as follows: “(i) mismatch between expectations and final results; (ii) inequalities between social groups in access to employment and the benefits of mining activity; (iii) co-optation of authorities and distortion of the local political system through support for pro-company candidates in local and regional elections; (iv) growing dependence of society as a whole on the company; (v) accelerated social changes due to immigration; (vi) alcohol and drug abuse; (vii) increased sexual violence and gender inequality as mining activity is highly masculinized; and (viii) when resources are transferred to local governments, they are often accompanied by increased corruption of authorities and the emergence of criminal groups seeking to benefit from these resources”.
Regarding economic benefits, Fearnside (2016) states that aluminum processing fits into the “resource curse” paradigm: the seeming paradox of countries with the greatest natural resource wealth having the highest incidences of poverty and the lowest indices of social wellbeing. According to his study in Brazil, employment and economic benefits of primary aluminum production is very low in comparison to the large socio-environmental impacts (Fearnside, 2016).
Finally, we want to point out to the social impacts of coal mining, because of its relevance in the energy requirements of the transformation of silicon for panels. We focus on India due to the S-LCA results. The greatest social impact of coal mining in India is displacement (Chikkatur et al., 2009; Paltasingh and Satapathy, 2021; Singh, 2008), which implies landlessness/homelessness/joblessness even if resettlement occur (mainly for indigenous people due to their dependency on land and traditional livelihoods), breakdown of family and community structures, greater class and caste conflicts, risk of marginalization worsening of economic situation due to disruption, and cultural breakdown (Chikkatur et al., 2009; Paltasingh and Satapathy, 2021; Singh, 2008). Forceful eviction or involuntary displacement is a violation of human rights according to Paltasingh and Satapathy (2021). In addition, communities adjacent to coal mines suffer from health problems and agricultural impacts derived from air pollution (PM10), water pollution due to acid drainage, diminished water availability and deforestation (Chikkatur et al., 2009; Mishra, 2017), as is the case in Odisha (Hota and Behera, 2015). Water pollution from nearby coal mining can affect drinking water availability and many human activities such as cooking, fishing or swimming and air pollution fosters health problems such as elevated levels of heavy metals in children, birth defects and miscarriages, cancers, heart and kidney diseases and excess deaths (Morrice and Colagiuri, 2013). Other social impacts are related to the changes in population dynamics (rapid and temporary immigration), increased cost of living or addictions (Singh, 2008). It is estimated that up to 70% of India’s current coal work force is employed informally (Banerjee, 2022), leaving aside all the illegal coal scavenging economy. These tasks are primarily carried out by the members from extremely vulnerable Dalit and Adivasi communities (Chandra et al., 2025). Moreover, and given that land ownership and caste hierarchy is often correlated, women from vulnerable communities are often triple burdened with informal casual labor, illegal coal scavenging and social reproductive work (Chandra et al., 2025). Finally, in different locations around the world, difficulty of communities to capture economic benefits and to generate economic alternatives for the future has also been reported (Lockie et al., 2009).
4 Discussion
Large-scale deployment of rooftop solar PV will substantially increase demand and pressure for new exploration and mining. The comparison of primary extraction material requirements with reserves, in-use stocks and current global production leads us to this conclusion. The material constraint is especially relevant in the case of gold, silver, and tin. Silicon is not a limit in terms of available reserves, but there should be a remarkable increase in the world production of polysilicon needed for photovoltaics. Previous studies have proposed material efficiency measures increased module efficiency to overcome the material constraint, including improved material usage, novel module designs and production processes such as silicon epitaxial growth to reduce the amount of polysilicon required, and copper electroplating for metallization to reduce the amount of silver needed (Gervais et al., 2021).
Note that comparisons between material requirements and reported reserves or resources must be interpreted with caution. These figures, often derived from corporate data, primarily serve as signals for investors rather than precise estimates of available stocks. Companies may adjust their reported reserves based on market conditions, exploration investments, and technological advancements. For example, lithium reserves have increased from 17 million tons in 2018 to 26 million tons in 2023, not due to an actual increase in Earth’s lithium content, but rather as a reflection of growing market interest and improved extraction techniques. This variability underscores the difficulty of using reserves data at a given point in time to predict long-term material availability (McNeil et al., 2023).
There are several questions to address as regards recycling as the key to lower the primary extraction material requirements in order for the pressure for new exploration and mining not to be significant. First, solar PV technologies often require materials of very high purity, such as silver, for which recycled sources may not meet the necessary quality standards. Second, the current availability of recycled materials is insufficient to fully meet demand. Consequently, any increase in material requirements for the energy transition will inevitably lead to greater primary extraction—unless material demand is significantly reduced in other sectors. Let us take silver as an example to illustrate the second question. In a 25-year scenario to 2050 of RPV deployment in Vitoria-Gasteiz, the silver primary extraction requirements would annually increase the current global demand by 27.5% (population-weighted). Since the average end-of-life recycling-input-rate for silver is currently about 19% (BRGM, 2023), recycling activities should be more than doubled for the RPVP deployment not to imply an increase in mining. Similar conclusions may be reached for gold and tin, and to a lesser extent for all other materials. Silicon recycling from wafers and photovoltaic panels is in development, but the recycling input rate is estimated to remain low (BRGM, 2023). Recycling activities (scrap collection and recovery) depend on the overall metabolism of the economy and factors such as the amount and lifetime of consumer goods used and discarded annually by the different sectors. A deep analysis of the role of recycling as a factor to avoid increased mining requires a system dynamics methodology, beyond the scope of this study.
Moreover, the modeled deployment of solar PV in Vitoria-Gasteiz would only supply 38% of the city’s electricity consumption. RPV hypothetically achieving 100% of electricity demand would require substantially higher material inputs, as additional solar capacity and energy storage systems would need to be deployed. A defining characteristic of the energy transition may therefore be a significant expansion of in-use material stocks within society. The problem is even more pronounced if all the energy consumption is considered, as the per capita PV production calculated for Vitoria-Gasteiz covering less than a 5% of the total per capita primary energy footprint—41.8 MWh·cap−1·yr.−1 for an average inhabitant from the Basque Country (Akizu-Gardoki et al., 2024).
From an environmental-LCA perspective, the stark contrast between the proposed RPV deployment site and the geographically dispersed nature of the environmental impacts (most of them outside Europe and only 1% in Spain) highlights the ecological debt generated by dependence on external material and energy resources—many of which are sourced from the Global South. As territories such as Spain expand their photovoltaic capacity to transition toward cleaner energy, they inadvertently shift the environmental burden to regions that often bear the social and ecological consequences of extraction and production. This highlights the unequal distribution of environmental impacts between the Global North and Global South, raising critical questions about the sustainability and fairness of energy transitions that depend heavily on global supply chains. Accordingly, it remains crucial to address the upstream environmental impacts linked to mining and metal refining, particularly in the Global South, where these activities entail serious risks such as water contamination, ecosystem degradation, and long-term damage to local communities. The extraction and processing of key metals such as gold, silver, tin, and copper are especially problematic due to their contribution to water pollution and biodiversity loss.
However, despite the challenges associated with material extraction and processing, our findings reaffirm the environmental benefits of photovoltaic systems compared to conventional energy sources. In fact, all impact categories analyzed show significant reductions, particularly in terms of climate change (79%), acidification (71%), and land and water use (70 and 63%, respectively). These results highlight the overall environmental efficiency of rooftop PV systems in urban contexts.
On the contrary, metals/minerals material resources stand out among the most relevant impact categories, accounting for 93% of the conventional electricity mix impact—a consequence of the significant consumption of metals such as gold (mainly linked to inverters), silver, and tin. While PV technology does not drastically reduce this impact compared to fossil-based electricity, it is important to note that this result does not account for distribution and storage infrastructure, which would increase material demand in large-scale RPV deployment.
Regarding social-LCA, the results show a very different trend, as the risk level is higher than the reference value of the Basque Country for every stakeholder. In addition, when comparing PV electricity production with the current electricity mix, the risk level of the PV production is lower than the risk associated to the current mix for the Workers stakeholder, it remains constant for Value-chain Actors, but it increases for the Local community and Society stakeholders. Given that most of the activity hours and their associated impacts occur in developing countries, the socioeconomic context is probably similar regardless of the specific activity (i.e., the impacts associated to mining, or the impacts associated to fossil fuel extraction for electricity production are similar in terms of risk level). Nevertheless, PV electricity production is less intense in terms of activity hours than the current electricity mix production, as the total activity hours related to PV production are almost 40% lower. Hence, even when the risk level increases, total impacts might be lower. However, this could be underestimated from not having considered the distribution or storage of the exceeding PV electricity production.
28.5% of the total activity hours is related to mining and production of metals, but the social impact indicators from soca v3 are too limited to reflect some of the problems generated by the mining activity, as shown in the bibliographic search (e.g., dispossession, community disintegration, increasing dependency from the society to the company, consumption of alcohol and drugs, or increment of prostitution and gendered violence). Hence, both LCA and in situ documentation are complementary and necessary in order to understand the real magnitude of the impacts. In addition, a direct inventory of the analyzed processes could improve the accuracy of the results, as a process-based LCA was performed in this work, where the activity hours were calculated by openLCA based on the quantities of the modeled product and service flows, their prices and the estimates of the labor costs in the economic sectors.
Responsible supply chain management and mitigation strategies must become central pillars of sustainability efforts to fully harness the transformative potential of clean energy technologies. This involves fostering more ethical and transparent mining practices, developing recycling and circular economy infrastructures, and reinforcing global cooperation to reduce socio-environmental burdens, particularly in vulnerable territories.
Our findings demonstrate that the large-scale deployment of rooftop photovoltaic systems in cities like Vitoria-Gasteiz can substantially reduce greenhouse gas emissions, aligning local action with global climate goals such as the IPCC 1.5°C target. Yet, these environmental benefits come with material dependencies that externalize ecological and social costs to distant geographies. In this light, the city must be reimagined not merely as a passive recipient of sustainable technologies, but as an active agent in planetary stewardship. A living, sentient ecosystem that connects the local with the global, and where decarbonization pathways are pursued without detaching from their material and ethical foundations. By acknowledging the socio-environmental trade-offs embedded in the renewable transition, cities can become sites of critical engagement—capable of fostering a fair energy transition that is both materially grounded and ecologically conscious.
Data availability statement
The raw data supporting the conclusions of this article will be made available by the authors, without undue reservation.
Author contributions
AT-C: Writing – review & editing, Writing – original draft, Software, Visualization, Investigation, Data curation. RL-A: Investigation, Funding acquisition, Writing – original draft, Supervision, Conceptualization, Methodology, Writing – review & editing, Data curation. EV: Writing – review & editing, Supervision, Writing – original draft, Data curation, Visualization, Investigation. LU-A: Methodology, Writing – original draft, Investigation, Writing – review & editing. GB: Supervision, Writing – review & editing, Methodology. EA: Writing – review & editing, Data curation.
Funding
The author(s) declare that financial support was received for the research and/or publication of this article. This research was funded by the University of the Basque Country UPV/EHU, in the framework of the University-Enterprise-Society Programme (2024 call) for financing the Euskopvmap project (US 24/32). This research was also funded by MICIU/AEI/10.13039/501100011033, and FEDER (EU) under grant agreement PID2023-148401OB-100. The EKOPOL research group, recognized by the Basque Government (grant number IT-1259-19) and the University of the Basque Country UPV/EHU (GIC-18/22), also supported this work.
Acknowledgments
To the Sustainability Directorate and the Educational Advisory Service, whose members include the Vice-Chancellor’s Office for Innovation, Social Commitment and Social Action at the University of the Basque Country UPV/EHU, in the framework of the Campus Bizia Lab Programme (2019/20, 20/21, 21/22, 22/23, 23/24, and 24/25 calls) for financing the EHUkhi project.
Conflict of interest
The authors declare that the research was conducted in the absence of any commercial or financial relationships that could be construed as a potential conflict of interest.
Generative AI statement
The authors declare that no Gen AI was used in the creation of this manuscript.
Publisher’s note
All claims expressed in this article are solely those of the authors and do not necessarily represent those of their affiliated organizations, or those of the publisher, the editors and the reviewers. Any product that may be evaluated in this article, or claim that may be made by its manufacturer, is not guaranteed or endorsed by the publisher.
References
Akizu-Gardoki, O., Villamor, E., and Lizundia, E. (2024). Quantifying energy footprint inequalities across different socio-economic segments in Spain. Cleaner Environ. Syst. 14:100213. doi: 10.1016/j.cesys.2024.100213
Akizu-Gardoki, O., Wakiyama, T., Wiedmann, T., Bueno, G., Arto, I., Lenzen, M., et al. (2021). Hidden energy flow indicator to reflect the outsourced energy requirements of countries. J. Clean. Prod. 278:123827. doi: 10.1016/j.jclepro.2020.123827
An, Y., Gao, Z., Wang, Z., Yang, S., Liang, J., Feng, Y., et al. (2004). Immunohistochemical analysis of oxidative DNA damage in arsenic-related human skin samples from arsenic-contaminated area of China. Cancer Lett. 214, 11–18. doi: 10.1016/j.canlet.2004.04.005
Andrade, T. (1999). “Environmental issues in Brazilian tin production,” in Mining and the environment. Case studies from the Americas. Ed. A. Warhurst (Ottawa: International Development Research Centre).
Arana-Zegarra, M. (2009). El caso de derrame de mercurio en Choropampa y los daños a la salud en la población rural expuesta. Rev. Perú. Med. Exp. Salud Públ. 26:113–118.
Arellano-Yanguas, J. (2023). Transición energética, expansión minera y conflictos ecosociales en la Amazonía. Publicaciones de la Universidad de Deusto. Available at: https://www.alboan.org/es/node/2446
Banerjee, S. (2022). Just transition and informal Workers in Coal Regions in India. Sustainability Innovation and Advisories Private Limited. Available at: https://iforest.global/wp-content/uploads/2022/05/Informal-workers-in-coal-regions-in-India_final.pdf
Bebbington, A. (2013). Social conflict, economic development and the extractive industry: Evidence from South America (first issued in paperback). New York: Routledge.
Brandt, A. R. (2017). How does energy resource depletion affect prosperity? Mathematics of a minimum energy return on investment (EROI). Biophys Econ Resour Qual 2:2. doi: 10.1007/s41247-017-0019-y
BRGM. (2023). SCRREEN project. Available online at: https://scrreen.eu/crms-2023/
Cacciuttolo, C., and Cano, D. (2022). Environmental impact assessment of mine tailings spill considering metallurgical processes of gold and copper mining: case studies in the Andean countries of Chile and Peru. Water 14:3057. doi: 10.3390/w14193057
Capellán-Pérez, I., De Castro, C., and Arto, I. (2017). Assessing vulnerabilities and limits in the transition to renewable energies: land requirements under 100% solar energy scenarios. Renew. Sust. Energ. Rev. 77, 760–782. doi: 10.1016/j.rser.2017.03.137
Castro, S. H., and Sánchez, M. (2003). Environmental viewpoint on small-scale copper, gold and silver mining in Chile. J. Clean. Prod. 11, 207–213. doi: 10.1016/S0959-6526(02)00040-9
Chandra, R., Pai, S., Nayak, S., and Devagudi, S. H. (2025). India’s coal conundrum: decarbonization amidst a developmental legacy. WIREs Clim. Change 16:e928. doi: 10.1002/wcc.928
Chikkatur, A. P., Sagar, A. D., and Sankar, T. L. (2009). Sustainable development of the Indian coal sector. Energy 34, 942–953. doi: 10.1016/j.energy.2008.12.014
Choudhury, B. U., Malang, A., Webster, R., Mohapatra, K. P., Verma, B. C., Kumar, M., et al. (2017). Acid drainage from coal mining: effect on paddy soil and productivity of rice. Sci. Total Environ. 583, 344–351. doi: 10.1016/j.scitotenv.2017.01.074
Ciroth, A. (2007). ICT for environment in life cycle applications openLCA—a new open source software for life cycle assessment. Int. J. Life Cycle Assess. 12, 209–210. doi: 10.1065/lca2007.06.337
Codina, L. (2020). Cómo hacer revisiones bibliográficas tradicionales o sistemáticas utilizando bases de datos académicas. Rev ORL 11, 139–153. doi: 10.14201/orl.22977
Crawford and Murphy (2023a). Forced labor in the Uyghur region: the evidence. Sheffield: Helena Kennedy Center for International Justice.
Crawford and Murphy (2023b). Uyghur region exposure assessment for solar industry sourcing. Sheffield: Helena Kennedy Center for International Justice.
de Castro, C., and Capellán-Pérez, I. (2020). Standard, point of use, and extended energy return on energy invested (EROI) from comprehensive material requirements of present global wind, solar, and hydro power technologies. Energies 13:Article 12. doi: 10.3390/en13123036
Delucchi, M. A., and Jacobson, M. Z. (2011). Providing all global energy with wind, water, and solar power, part II: reliability, system and transmission costs, and policies. Energy Policy 39, 1170–1190. doi: 10.1016/j.enpol.2010.11.045
Department of Labor. (2021). Traced to forced labor: solar supply chains dependent on polysilicon from Xinjiang.
Dupont, E., Koppelaar, R., and Jeanmart, H. (2020). Global available solar energy under physical and energy return on investment constraints. Appl. Energy 257:113968. doi: 10.1016/j.apenergy.2019.113968
Eisfeldt, F. (2017). Soca v.1 add-on – adding social impact information to Ecoinvent [dataset]. Berlin: GreenDelta GmbH.
Eisfeldt, F., and Ciroth, A. (2016). Introducing PSILCA 1.0 a comprehensive and transparent database for social LCA. Available online at: https://www.greendelta.com/wp-content/uploads/2017/03/Presentation_PSILCA_Webinar_April2016.pdf
Eisler, R. (2004). “Cyanide hazards to plants and animals from gold mining and related water issues” in Reviews of environmental contamination and toxicology. ed. G. W. Ware, vol. 183 (New York: Springer), 21–54.
EJAtlas. (2025). Global atlas of environmental justice. Available online at: https://ejatlas.org/
Erauskin-Tolosa, A., Bueno, G., Etxano, I., Tamayo, U., García, M., de Blas, M., et al. (2021). Social organisational LCA for the academic activity of the University of the Basque Country UPV/EHU. Int. J. Life Cycle Assess. 26, 1648–1669. doi: 10.1007/s11367-021-01940-y
EU Commission. (2021). EU Commission recommendation 2021/2279 of 15 December 2021 on the use of the environmental footprint methods to measure and communicate the life cycle environmental performance of products and organisations. Publications Office. Available at: https://op.europa.eu/en/publication-detail/-/publication/867f763f-01d7-11ed-acce-01aa75ed71a1/language-en/
European Commission. (2018). A European strategic long-term vision for a prosperous, modern, competitive and climate neutral economy. Available at: https://eur-lex.europa.eu/legal-content/EN/TXT/?uri=celex:52018DC0773
European Commission and Joint Research Centre. (2022). Understanding product environmental footprint and organisation environmental footprint methods. Publications Office. Available at: https://data.europa.eu/doi/10.2760/11564
Fearnside, P. M. (2016). Environmental and social impacts of hydroelectric dams in Brazilian Amazonia: implications for the aluminum industry. World Dev. 77, 48–65. doi: 10.1016/j.worlddev.2015.08.015
Feltrin, A., and Freundlich, A. (2008). Material considerations for terawatt level deployment of photovoltaics. Renew. Energy 33, 180–185. doi: 10.1016/j.renene.2007.05.024
García-Olivares, A., Ballabrera-Poy, J., García-Ladona, E., and Turiel, A. (2012). A global renewable mix with proven technologies and common materials. Energy Policy 41, 561–574. doi: 10.1016/j.enpol.2011.11.018
Garmendia, E., Urkidi, L., Arto, I., Barcena, I., Bermejo, R., Hoyos, D., et al. (2016). Tracing the impacts of a northern open economy on the global environment. Ecol. Econ. 126, 169–181. doi: 10.1016/j.ecolecon.2016.02.011
Geological Survey, U. S. (2025). Mineral commodity summaries 2025 (mineral commodity summaries). : National Minerals Information Center.
Gervais, E., Shammugam, S., Friedrich, L., and Schlegl, T. (2021). Raw material needs for the large-scale deployment of photovoltaics – effects of innovation-driven roadmaps on material constraints until 2050. Renew. Sust. Energ. Rev. 137:110589. doi: 10.1016/j.rser.2020.110589
Gsodam, P., Lassnig, M., Kreuzeder, A., and Mrotzek, M. (2014). The Austrian silver cycle: a material flow analysis. Resour. Conserv. Recycl. 88, 76–84. doi: 10.1016/j.resconrec.2014.05.001
Hall, C. A. S., Balogh, S., and Murphy, D. J. R. (2009). What is the minimum EROI that a sustainable society must have? Energies 2, 25–47. doi: 10.3390/en20100025
Hallam, B., Kim, M., Zhang, Y., Wang, L., Lennon, A., Verlinden, P., et al. (2023). The silver learning curve for photovoltaics and projected silver demand for net-zero emissions by 2050. Prog. Photovolt. Res. Appl. 31, 598–606. doi: 10.1002/pip.3661
Hota, P., and Behera, B. (2015). Coal mining in Odisha: an analysis of impacts on agricultural production and human health. Extract Industr Soc 2, 683–693. doi: 10.1016/j.exis.2015.08.007
IEA. (2022). Solar PV global supply chains. International Energy Agency. Available online at: https://www.iea.org/reports/solar-pv-global-supply-chains
IEA. (2023). Energy statistics data browser Available online at: https://www.iea.org/
IPCC. (2021). Climate change 2021: The physical science basis. The Intergovernmental Panel on Climate Change. Available online at: https://www.ipcc.ch/report/sixth-assessment-report-working-group-i/
ISO. (2006a). Environmental management—life cycle assessment—principles and framework (ISO/DIS 14040). Available at: https://www.iso.org/standard/37456.html
ISO. (2006b). Environmental management—Life cycle assessment—Requirements and guidelines (ISO/DIS 14044). Available at: https://www.iso.org/standard/38498.html
ISO. (2024). Environmental management—principles and framework for social life cycle assessment (ISO/DIS 14075). Available at: https://www.iso.org/standard/61118.html
Jacobson, M. Z., Delucchi, M. A., Bauer, Z. A. F., Goodman, S. C., Chapman, W. E., Cameron, M. A., et al. (2017). 100% clean and renewable wind, water, and sunlight all-sector energy roadmaps for 139 countries of the world. Joule 1, 108–121. doi: 10.1016/j.joule.2017.07.005
James, C. L., Tynan, R. J., Bezzina, A. T., Rahman, M. M., and Kelly, B. J. (2021). Alcohol consumption in the Australian mining industry: the role of workplace, social, and individual factors. Workplace Health & Safety 69, 423–434. doi: 10.1177/21650799211005768
Karn, S. K. (2015). Arsenic (as) contamination: a major risk factor in Xinjiang Uyghur autonomous region of China. Environ. Pollut. 207, 434–435. doi: 10.1016/j.envpol.2015.05.005
King, L. C., and van den Bergh, J. C. J. M. (2018). Implications of net energy-return-on-investment for a low-carbon energy transition. Nature. Energy 3, 334–340. doi: 10.1038/s41560-018-0116-1
Kirsch, S. (2014). Mining capitalism: The relationship between corporations and their critics. Oakland: University of California Press.
Lambert, J. G., Hall, C. A. S., Balogh, S., Gupta, A., and Arnold, M. (2014). Energy, EROI and quality of life. Energy Policy 64, 153–167. doi: 10.1016/j.enpol.2013.07.001
Lee, K., Ly, H., Kh, T., Yy, T., Sp, L., and Am, Q. (2017). Environmental and occupational health impact of bauxite Mining in Malaysia: a review. IIUM Med. J. Malay. 16, 137–150. doi: 10.31436/imjm.v16i2.346
Lenzen, M., Kanemoto, K., Moran, D., and Geschke, A. (2012). Mapping the structure of the world economy. Environ. Sci. Technol. 46, 8374–8381. doi: 10.1021/es300171x
Lockie, S., Franettovich, M., Petkova-Timmer, V., Rolfe, J., and Ivanova, G. (2009). Coal mining and the resource community cycle: a longitudinal assessment of the social impacts of the Coppabella coal mine. Environ. Impact Assess. Rev. 29, 330–339. doi: 10.1016/j.eiar.2009.01.008
Luckeneder, S., Giljum, S., Schaffartzik, A., Maus, V., and Tost, M. (2021). Surge in global metal mining threatens vulnerable ecosystems. Glob. Environ. Chang. 69:102303. doi: 10.1016/j.gloenvcha.2021.102303
McNeil, B., Billy, R., Aguilar Lopez, F., Petavratzi, E., and Muller, D. (2023). Insufficient Lithium supply is likely to slow down the transition to electrified transport. SSRN Scholarly Paper. Rochester, NY: Social Science Research Network. doi: 10.2139/ssrn.4662605
Michaux, S. P. (2021). The Mining of Minerals and the limits to growth. Geological Survey of Finland Unit, Report number: 16/2021.
Mishra, N. (2017). Coal mining and local environment: a study in Talcher coalfield of India. Air, Soil and Water Research 10:117862211772891. doi: 10.1177/1178622117728913
Mishra, P. P., Sravan, C., and Mishra, S. K. (2024). Extracting empowerment: a critical review on violence against women in mining and mineral extraction. Energy Res. Soc. Sci. 109:103414. doi: 10.1016/j.erss.2024.103414
Moriarty, P., and Honnery, D. (2016). Can renewable energy power the future? Energy Policy 93, 3–7. doi: 10.1016/j.enpol.2016.02.051
Morrice, E., and Colagiuri, R. (2013). Coal mining, social injustice and health: a universal conflict of power and priorities. Health Place 19, 74–79. doi: 10.1016/j.healthplace.2012.10.006
Mudd, G. M., Roche, C., Northey, S. A., Jowitt, S. M., and Gamato, G. (2020). Mining in Papua new Guinea: a complex story of trends, impacts and governance. Sci. Total Environ. 741:140375. doi: 10.1016/j.scitotenv.2020.140375
Murphy, D. J. (2014). The implications of the declining energy return on investment of oil production. Philos. Trans. R. Soc. A Math. Phys. Eng. Sci. 372:20130126. doi: 10.1098/rsta.2013.0126
Nkuba, B., Bervoets, L., and Geenen, S. (2019). Invisible and ignored? Local perspectives on mercury in Congolese gold mining. J. Clean. Prod. 221, 795–804. doi: 10.1016/j.jclepro.2019.01.174
Owen, J. R., Kemp, D., Harris, J., Lechner, A. M., and Lèbre, É. (2022). Fast track to failure? Energy transition minerals and the future of consultation and consent. Energy Res. Soc. Sci. 89:102665. doi: 10.1016/j.erss.2022.102665
Paltasingh, T., and Satapathy, J. (2021). Unbridled coal extraction and concerns for livelihood: evidences from Odisha, India. Min. Econ. 34, 491–503. doi: 10.1007/s13563-021-00272-5
Pandey, P. K., Sharma, R., Roy, M., and Pandey, M. (2007). Toxic mine drainage from Asia’s biggest copper mine at Malanjkhand, India. Environ. Geochem. Health 29, 237–248. doi: 10.1007/s10653-006-9079-4
Perreault, T. (2013). Dispossession by accumulation? Mining, water and the nature of enclosure on the Bolivian Altiplano. Antipode 45, 1050–1069. doi: 10.1111/anti.12005
Prior, T., Giurco, D., Mudd, G., Mason, L., and Behrisch, J. (2012). Resource depletion, peak minerals and the implications for sustainable resource management. Glob. Environ. Chang. 22, 577–587. doi: 10.1016/j.gloenvcha.2011.08.009
Raugei, M. (2019). Net energy analysis must not compare apples and oranges. Nat. Energy 4, 86–88. doi: 10.1038/s41560-019-0327-0
Raugei, M., Sgouridis, S., Murphy, D., Fthenakis, V., Frischknecht, R., Breyer, C., et al. (2017). Energy return on energy invested (ERoEI) for photovoltaic solar systems in regions of moderate insolation: a comprehensive response. Energy Policy 102, 377–384. doi: 10.1016/j.enpol.2016.12.042
REN21 (2021). Renewables in Cities 2021 Global Status Report (Paris: REN21 Secretariat). Available at: https://www.ren21.net/wp-content/uploads/2019/05/REC_2021_full-report_en.pdf
Roche, C., Thygesen, K., and Baker, E.UNEP & GRID-Arendal (2017). Mine tailings storage: safety is no accident: a rapid response assessment. GRID-Arendal.
Romero Rodríguez, L., Duminil, E., Sánchez Ramos, J., and Eicker, U. (2017). Assessment of the photovoltaic potential at urban level based on 3D city models: a case study and new methodological approach. Sol. Energy 146, 264–275. doi: 10.1016/j.solener.2017.02.043
Singh, G. (2008). Mitigating environmental impacts of coal mining in India. Min. Eng. J. 2008, 8–24. Available at: http://sa.indiaenvironmentportal.org.in/files/Mitigating%20Environmental%20and%20Social%20Impacts%20of%20Coal%20Mining%20in%20India.pdf
Skrzypek, E. (2022). The justice dimensions of extracting energy transition metals from the Pacific : The British Academy.
Tro-Cabrera, A., Lago-Aurrekoetxea, R., Martínez-de-Alegría, I., Villamor, E., and Campos-Celador, A. (2025). A methodology for assessing rooftop solar photovoltaic potential using GIS open-source software and the EROI constraint. Energ. Buildings 331:115401. doi: 10.1016/j.enbuild.2025.115401
United Nations Environment Programme & International Resource Panel. (2010). Metal stocks in society: scientific synthesis. International Panel for Sustainable Resource Management. Available at: https://wedocs.unep.org/20.500.11822/8438
Urbina, A. (2023). Sustainability of photovoltaic technologies in future net-zero emissions scenarios. Prog. Photovolt. Res. Appl. 31, 1255–1269. doi: 10.1002/pip.3642
Wachtmeister, H., Henke, P., and Höök, M. (2018). Oil projections in retrospect: revisions, accuracy and current uncertainty. Appl. Energy 220, 138–153. doi: 10.1016/j.apenergy.2018.03.013
Warhurst, A., and Mitchell, P. (2000). Corporate social responsibility and the case of Summitville mine. Resources Policy 26, 91–102. doi: 10.1016/S0301-4207(00)00019-2
Watari, T., and Yokoi, R. (2021). International inequality in in-use metal stocks: what it portends for the future. Resources Policy 70:101968. doi: 10.1016/j.resourpol.2020.101968
Wernet, G., Bauer, C., Steubing, B., Reinhard, J., Moreno-Ruiz, E., and Weidema, B. (2016). The ecoinvent database version 3 (part I): overview and methodology. The International Journal of Life Cycle Assessment, [online] 21, 1218–1230. Available at: http://link.springer.com/10.1007/s11367-016-1087-8
Keywords: polycrisis, urban ecologies, material footprint, social footprint, life cycle assessment, rooftop photovoltaics, reserves, resources
Citation: Tro-Cabrera A, Lago-Aurrekoetxea R, Villamor E, Urkidi-Azkarraga L, Bueno G and Aramendia E (2025) Material and social footprint of rooftop photovoltaics in the city of Vitoria-Gasteiz. Front. Sustain. Cities. 7:1612815. doi: 10.3389/frsc.2025.1612815
Edited by:
Roberto Alonso González-Lezcano, CEU San Pablo University, SpainReviewed by:
Hasim Altan, Prince Mohammad bin Fahd University, Saudi ArabiaMohammad Afrazi, New Mexico Institute of Mining and Technology, United States
Copyright © 2025 Tro-Cabrera, Lago-Aurrekoetxea, Villamor, Urkidi-Azkarraga, Bueno and Aramendia. This is an open-access article distributed under the terms of the Creative Commons Attribution License (CC BY). The use, distribution or reproduction in other forums is permitted, provided the original author(s) and the copyright owner(s) are credited and that the original publication in this journal is cited, in accordance with accepted academic practice. No use, distribution or reproduction is permitted which does not comply with these terms.
*Correspondence: Alex Tro-Cabrera, YWxleC50cm9AZWh1LmV1cw==