 John Adekunle Adesina
 Xiaolan Tang1,3*
 Hongchao Jiang
- 1College of Landscape Architecture, Nanjing Forestry University, Nanjing, China
- 2Department of Architecture, University of Lagos, Lagos, Nigeria
- 3NFU Academy of Chinese Ecological Progress and Forestry Studies, Nanjing, China
- 4College of Economics and Management, Nanjing Forestry University, Nanjing, China
Urban watershed and drainage infrastructure and networks provide cities with a wide range of benefits, solving a myriad of problems facing urban settlements. Due to the neglect of the wetlands over the years, this study examines the application of hydrological assessment through landscape modeling to uncover environmental problems facing the densely populated Lagos metropolis. Data for the study were collected through direct surveys, remote sensing, and physical observation of the 145.68 km2 study area and green corridor. The adoption of Geographical Information System (GIS) analysis to identify flood direction, peaks, and depressions, as well as watersheds, aims to develop a spatial model that identifies and prioritizes this waterway corridor, thereby improving landscape connectivity within the metropolis. The study obtained topographical data reports using a simple kriging predictor to determine the geostatistics and spatial analysis used to examine rainfall threats, flood hazards, and susceptibility, which was conducted at the community levels following the highlights of six zones. Aligning the study with established Flood Risk Index (FRI) ranging from 0 to 100%, the Urban River Restoration Index (URRIx), ranging from 0 to 1 and flood factor risk score ranging from 1 to 10 which shows that whenever it is equal to zero (on the scale of 0–1), there are no risk and threat whatsoever and 1/10 risk score indicates that there are minimal risk. The continuous decrease in watershed biodiversity due to an increase in anthropogenic activities has disrupted the integrity of habitats and the environmental sustainability of the metropolis, as well as areas susceptible to high flood impacts. The conclusion called for immediate restoration action by policymakers, stakeholders, and researchers to prioritize waterways for sustainable development and metropolitan transitioning, considering the findings that maintaining a balance between human–nature connectivity in urban areas where natural ecosystems are quickly replaced by human activities is worrisome.
1 Introduction
The vast network of navigable inland waterways has faced numerous challenges, stemming from ineffective urban management, regulatory deficiencies, and outdated drainage infrastructure within the metropolis. The maritime sector in developing countries in sub-Saharan Africa, particularly from the Lagos Lagoon, has faced numerous flood risk hazards, hence the need for an increase in the sizes of the water channels and urban regeneration of the green corridor along both the concretized and vegetated canals. All the bodies of water, including rivers, wetlands, streams, canals, and estuaries, have watersheds. The land area that releases water into a designated receiving basin, like a lake or river, is known as the drainage area (Yessoufou et al., 2024; Zhang et al., 2024; Chen S. et al., 2024; Aliyu et al., 2021).
Sediment and other debris are collected, transported, and deposited into the receiving water bodies, canals, streams, and rivers by the watershed's downstream runoff of precipitation or melting snow (Yessoufou et al., 2024; Zhang et al., 2024). Chen S. et al. (2024) explained the process of applying land use and water management techniques to safeguard and enhance the quality of the waterways and other natural resources within a watershed by controlling the use of such assets holistically, known as watershed governance. A strategy for watershed management is an approach that produces a plan or framework for effectively preserving and enhancing a watershed's biodiversity, including its water quality. Frequently, watershed territories transcend political borders into neighboring states and/or cities (Asempah et al., 2024; Mateso et al., 2024). Dube et al. (2023), however, opined that watershed management sustainability thus depends on an extensive planning procedure that includes all impacted communities within the watershed, and large volumes of pollutants can enter a lake or river by runoff from rain or snowfall (Dube et al., 2023; Chen S. et al., 2024). Watershed management identifies the various types of pollution present in the watershed, how those pollutants are transported, and suggests strategies to minimize or eradicate them (Singh, 2024; Xie et al., 2024). This helps regulate the contamination of the urban waterways and other natural resources within the river basins.
Di Fazio and Modica (2018) stated that the biodiversity and wellbeing of a reservoir are impacted by every activity that occurs within and around the microclimate. The ecological integrity of the natural assets within a basin can be impacted by a variety of factors, including new land expansion, discharge from established regions, farming procedures, and personal behaviors, including landscaping, greenbelt care, septic system use and maintenance, water redirection, and auto repair (Gatwaza and Wang, 2023). Omanga et al. (2024) opined that to mitigate the negative effects of contamination, catchment governance planning thoroughly analyzes the processes that affect the watershed's health and offers suggestions on how to appropriately treat them. Everyone involved in the watershed forms an arrangement as a result of the planning process. The physical health of the watershed is important for the effective management of land and water resources within its borders, particularly in the spectrum of the metropolis, as it enhances the habitat quality of the urban outdoor spaces, benefiting all stakeholders (Mwalwimba et al., 2024).
The disconnection between waterways and roadway transport networks, which has an impact on urban health and wellbeing as well as the resilience of cities, is a result of poor urban governance (Herath et al., 2023; Zhu et al., 2024; Chen S. et al., 2024). To address the issues and opportunities, there are considerations for urban interventions and designs that incorporate off-road non-motorized bike lanes, aiming to strengthen an integrated transportation policy framework. This framework would enhance the waterway connectivity and land transportation systems, and interconnectivity within the metropolis (Czyża and Kowalczyk, 2024; Giudice et al., 2023; Miller, 2023). To increase intermodal connections and linkages for efficiency and effectiveness in the forested water region, government agencies should renovate and repair both the roadways and maritime infrastructure (Duan et al., 2023; Karkee et al., 2022; Faye et al., 2024). The concept of Green and Blue Infrastructure (GBI), also known as open travel routes or pathways, gradually spread to other environmental structures in both urban and rural areas, including biodiversity zones, ecological corridors and riparian buffers that had long been, exploited, reclaimed, degraded, misused, overused and deteriorated as a result of urbanization (Zhu et al., 2024; Chen X. et al., 2024; Zehang et al., 2024).
Metropolitan waterways, also referred to as “blue infrastructure,” have a distinct benefit over green spaces, or “the environment necessary facilities,” in that they serve as biodiversity's reservoirs and corridors (Masruroh et al., 2024; Alam et al., 2024; Asempah et al., 2024; Mateso et al., 2024). The correlation between ecosystem services and multifunctionality is one of the issues facing watershed governance (Omanga et al., 2024; Mwalwimba et al., 2024; Berhanu et al., 2024). Given the intricacy of urban ecosystems, incorporating this idea into the decision-making process can assist efforts to preserve biodiversity in urban settings (Singh, 2024; Xie et al., 2024; Zou et al., 2023). Municipal authorities' Green and Blue Infrastructure initiatives through well-designed outdoor landscapes, waterways, and greening of the canals ought to minimize the consequences of warming temperatures and are essential to the creation of more resilient and sustainable cities (Di Fazio and Modica, 2018; Balgah et al., 2023; Gatwaza and Wang, 2023).
This study empirically addressed the following queries: In what ways do the watersheds of the urban area change in terms of the watershed management and restoration system (Figure 1)? How do the general population and residents of a city feel about the current situation of the waterways and the condition of the drainage networks? How do urban dwellers perceive and evaluate blue spaces within the metropolis, their usage, and the primary source of drainage and the final destination? While some studies have measured the health advantages of watershed scenery settings using other health element indicators and evaluation methods, many have employed remote sensing and satellite imagery data and planning tools for geographic analysis and measurement (Tang and Adesina, 2022a,b; Okonkwo et al., 2023; Sarfo et al., 2024). Munyaka et al. (2024) defined ecohydrology and watershed management systems as an urban intervention system that connects both ecological processes and hydrological patterns. An understanding of these systems has been established through the collection of information from many authors. Still, only a small number of these studies employed objective metrics, such as health-related and emotional measurements, to evaluate the impact of mental health promotion (Munyaka et al., 2024, 2023; Amini Alaoui et al., 2024; Fotsing Metegam et al., 2024). Furthermore, a wider range of empirical techniques, primarily regression analysis, analysis of variance, and drainage analysis, are used to investigate green-blue health and wellbeing (Yessoufou et al., 2024; Zhang et al., 2024; Chen X. et al., 2024; Aliyu et al., 2021). Few studies have examined the mediating effects of the population itself on environmental preferences for sensory stimulation, motivation to visit nature, need for leisure time, and need to safeguard their privacy (Adeyemi and Ayinde, 2022; Isaac et al., 2021). The majority of the published articles reviewed, however, have examined the cause-and-effect relationship between wetlands, riparian buffers, waterway conditions, and human wellbeing (Seun et al., 2022; Odoh et al., 2024; Ali et al., 2025).
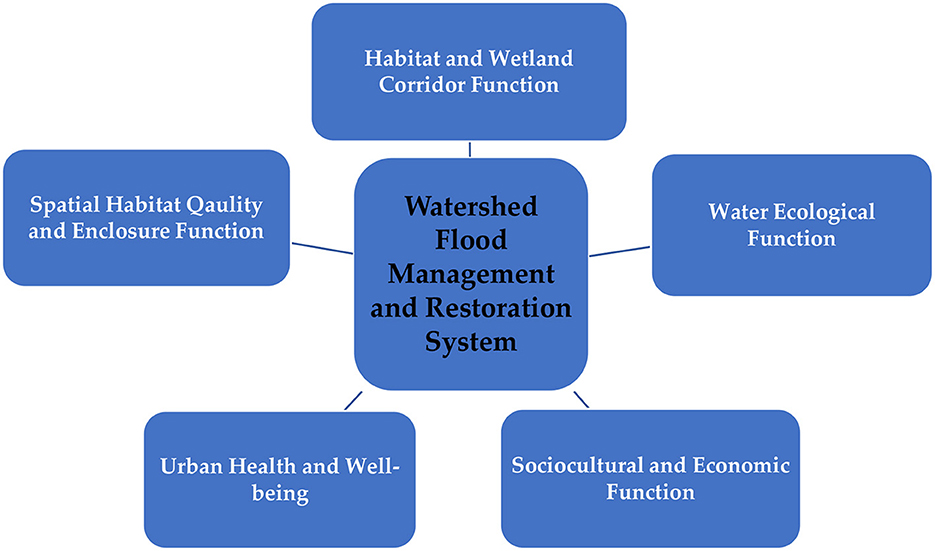
Figure 1. Landscape management strategies and a comprehensive evaluation indicator include five major functions. Source: Adopted and modified from Dube et al. (2023) and Birhanu et al. (2023).
For initiatives that are dependent on the environment, ecology, and hydrology, they are inseparable. Ecohydrology combines hydrological research with assessments that benefit the environment and ecosystem to provide a well-informed evaluation of the mechanisms behind the creation and maintenance of flooded area habitats (Xie et al., 2024; Janauer, 2000). Both “hydroecology” and “ecohydrology,” which includes the subfield of ecohydraulics, refer to studies conducted at the intersection of the natural (ecological) and hydrological sciences (Olden et al., 2012). This study highlights the importance of examining the etymologies of terminology before exploring the range of meanings available (King and Caylor, 2011). Since “ecohydrology” is a modifier of the term “hydrology” (also known as “ecology”), the prefix “eco” (also known as “hydro”) suggests that the field should focus more on hydrology than ecology (and vice versa). Intended to offer a critical viewpoint, especially regarding determining the theoretical foundation of ecohydrology and hydroecology, as well as the transdisciplinary (or multifaceted) character of the fields. Following this study, “ecohydrological” or “hydroecological” investigations of wetlands, canal waterways, natural and altered rivers, shallow groundwater systems, and whole watersheds were conducted. The disciplines of ecology and hydrology have developed concurrently (Rinaldo and Rodriguez-Iturbe, 2022).
Environmental reports for renewable energy projects, as well as studies to assist local authorities with prioritizing habitat regeneration and enhancement. Water-dependent terrestrial habitats and ecosystems are evaluated hydrologically, and the Wetland Water Supply Mechanisms (WETMECS) are evaluated (King and Caylor, 2011; Olden et al., 2012). Bog water level monitoring and Water Level Range Gauges (WaLRaGs) are part of peat, wetland, and bog hydrology. Hydrological models for wetland habitats that are both theoretical and quantitative, as well as evaluations of water runoff quality (Zhen et al., 2022; Hannah et al., 2004). Wetlands' relationship to river flood patterns and groundwater basins.
Creating mitigation, restoration, and enhancement plans to restore the quantity and integrity of groundwater, and conducting physicochemical investigations for topographic waters through watershed modeling (Zhen et al., 2022; Zehang et al., 2024). This study, however, presents a valuable and well-grounded approach to assessing urban water systems in Lagos, combining ecohydrological tools, spatial analysis using Geographical Information System (GIS), and field observations. The inclusion of indices such as the Flood Risk Index (FRI) and the Urban River Restoration Index (URRIx) offers practical insights and potential for empirical contributions to ecological restoration, sustainable urban planning/design, and environmental management.
2 Methods
This study aimed to examine how the landscape has changed and how urban watercourses have served multiple purposes in relation to the social and environmental aspects of urban area growth, with a focus on a section of Lagos Mainland (near the Lagos Lagoon), Lagos State (Figure 1). First, the data for the study were obtained through direct surveys, remote sensing, and physical observation of the 145.68 km2 study area and green corridor. Second, the study employed GIS analysis to identify the flood direction, peaks and depressions, and watersheds, aiming to develop a spatial model to identify and prioritize this waterway corridor and enhance landscape connectivity within the metropolis. This was accomplished by utilizing the Digital Elevation Model (DEM) to create the city's hydrographic grid, topographic data report using the simple kriging approach obtained from an average of 60 coordinate points selected at a calculated distance of 500 m along the water channels and canals (Figures 2–4). This was then manually vectorized after field trips and examination of high-resolution photos. Third, an analysis of geohistorical data regarding the genesis and development of the metropolis within the six zones (Figure 4) within the sampled frame selected for this study is necessary to comprehend processes of natural hazard, flood risk impacts, and sociocultural change (Ishaku et al., 2021; Fasona et al., 2022). Fourth, the study documented the perceptions and viewpoints of selected stakeholders involved in the management of Lagos' urban waterways and wetlands. There were a few interviews conducted with 24 residents and homeowners within the 6 zones (an average of 4 residents per zone) and along the four waterways, as shown in Figure 4. These 24 respondents were randomly selected and represented different categories of urban land use, predominantly built-up areas and mixed-use (Tables 1, 2). The criteria for selecting the respondents were either ownership of a property within the sampled frame or having lived in the area for at least 30 years, and they were interviewed to gain insight into the flood risk hazards along the urban watercourses in Lagos. The study subsequently noted that the watercourses and the surrounding areas had largely lost their ecological, interpersonal, and commercial purposes, remaining only as drainage systems (Ojeh et al., 2022; Ojo et al., 2022).
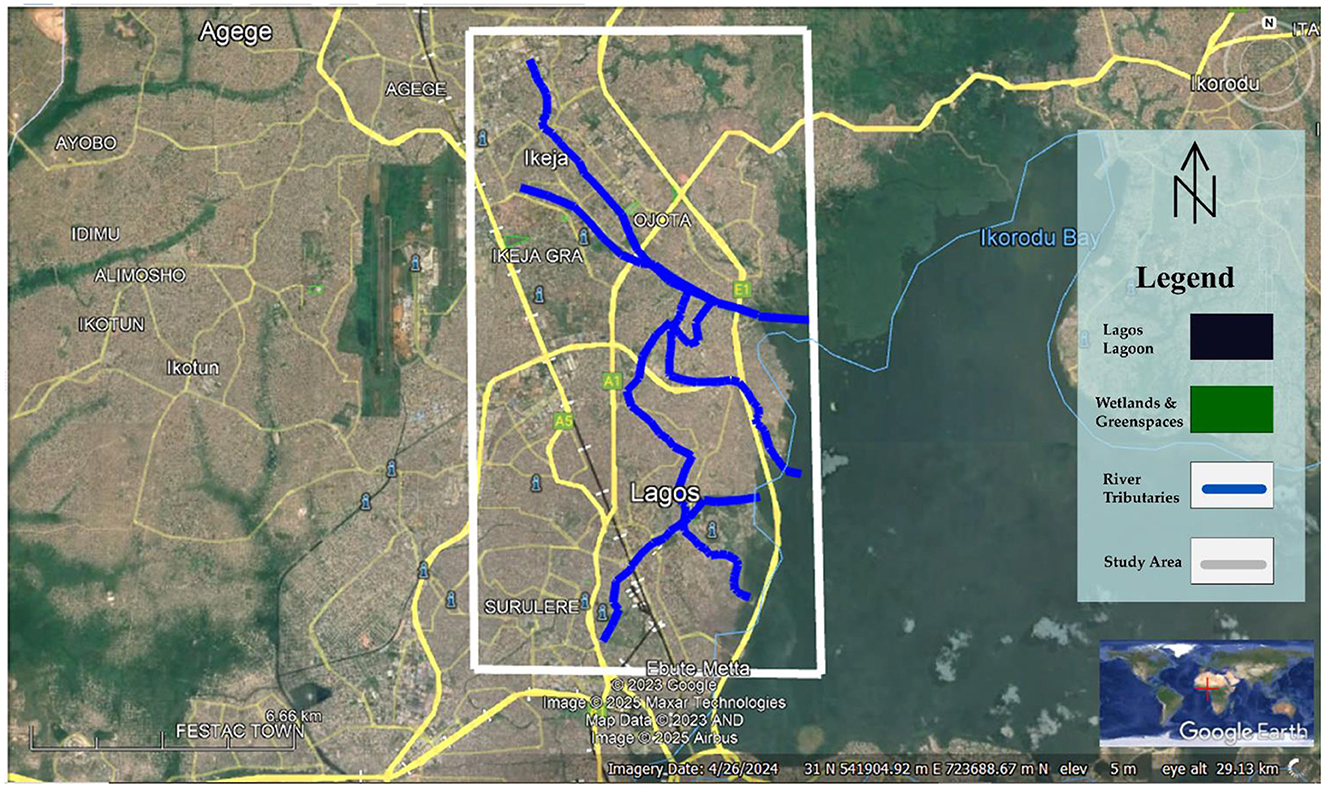
Figure 2. Map of Lagos showing a section of Lagos Mainland and Lagos Lagoon.
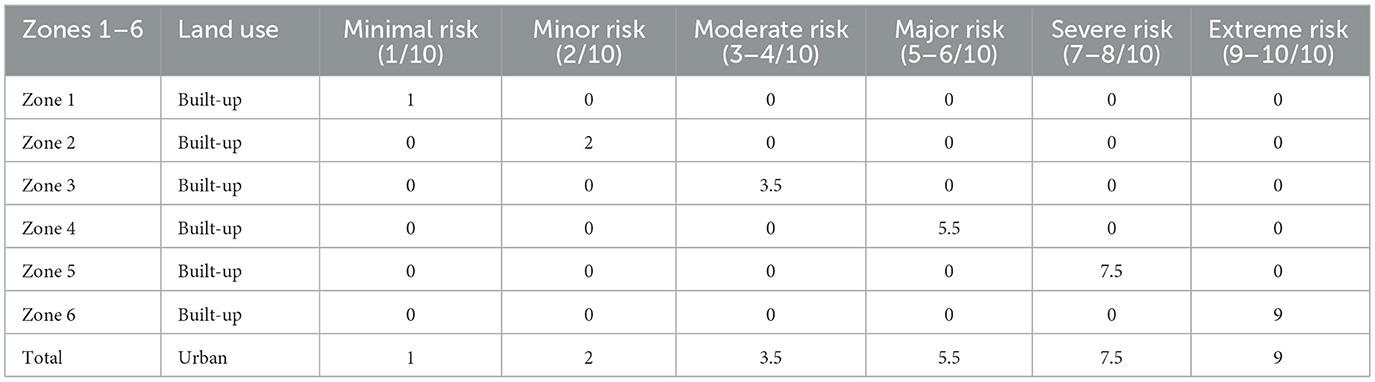
Table 1. Respondent's flood risk factor mean scores in the selected zones.
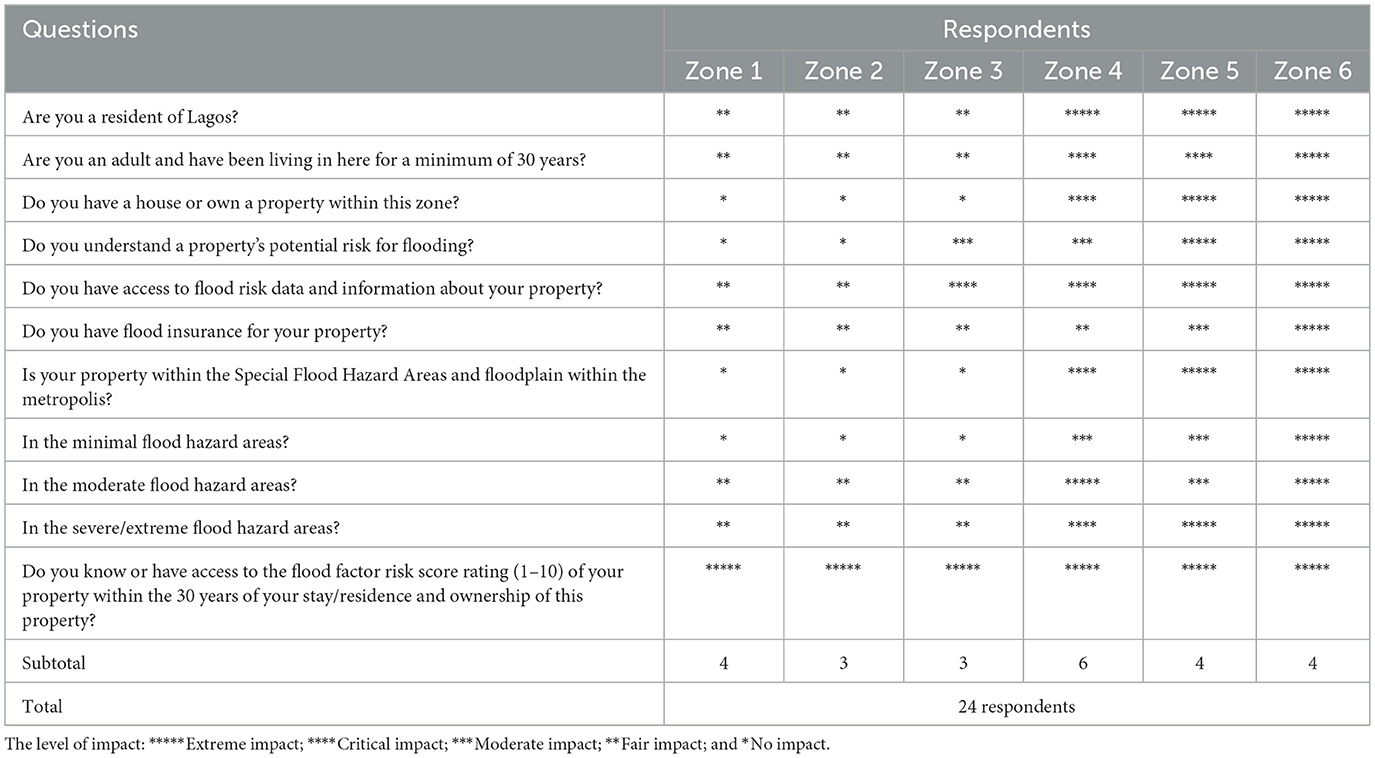
Table 2. Survey questions and checklist, and respondents' feedback.
2.1 The study area
To gather pertinent data and information that addressed the study's purpose and objectives, a contemporaneous triangulation research design was employed in conjunction with a direct research survey. The research area covers a total of 145.68 km2 along the Agindingbi-Obafemi Awolowo Road in Ikeja, passing across the Opebi and Oregun link bridges that connect Ojota and Maryland. The four major waterways and green corridors are all interconnected, covering a total approximate distance of 47 km, as represented in blue color in Figures 2–4. This green corridor continues through the Bariga district via Akoka, home to the University of Lagos, and it ends at Iwaya. The study area is composed of green corridors, rivers, wastewater, and wetlands of all kinds (bogs, marshes, and swamps). The host neighborhoods around the study area include Yaba, Bariga, Gbagada, Anthony, Maryland, Mende, Somolu, Oworonshoki, Ogudu, Ifako, Ojota, and Ikeja. All of these neighborhoods are connected by lush vegetation, transportation corridors, and river basins.
The physical location of the Lagos metropolitan region includes its principal watersheds, as well as the city of Lagos. The focus area is the area that lies inside the Lagos municipality's urban limits. Lagos, Nigeria, is located at latitude 6.457171 and longitude 3.327709. Figure 2 shows the GPS coordinates of 6 ° 27′ 25.8156″ N and 3 ° 19′ 39.7524″ E. According to the Nigerian Meteorological Agency (NiMet) (https://nimet.gov.ng/), the weather is tropical and rainy-tempered (mesothermal), with dry Harmattan (Winter) and wet in the Summer (Spring) months. According to the official Climate chart of Lagos (https://www.climatestotravel.com/climate/nigeria/lagos), Lagos has year-round tropical heat, with a dry season from November to March and a wet season from April to October. The city is on the Gulf of Guinea coast in southwest Nigeria. Every year, but particularly during the rainy season, the humidity is considerable. Particularly from May to July, rainfall is abundant. The dry season is when the greatest temperatures are reported. In comparison to north-central Nigeria, Lagos experiences fewer visits from the Harmattan, the arid and dusty wind from the Sahara. In Lagos, the average temperature is 78.1 °F in August, the coldest month, and 85.1 °F in March, the hottest month.
With an annual total of 61.0 inches, precipitation is plenty. The wettest month (June) has 11.5 inches, while the driest month (December) has 0.9 inches. The average precipitation is shown here. In August, the sea is 78 °F, while in March, April, and May, it is 84 °F. These are the average sea temperatures. An average of 1,845 h of sunlight is experienced annually. Some important sources of information from the transportation industry include the Lagos State Ministries of Physical Planning and Urban Development and Transportation. Following the kriging model used for the analysis of the canals, the study analyzed 225 active data counts with X duplicate Tolerance (0.0011) and Y duplicate Tolerance (0.002) along the wetland's corridor (Appendix).
The study area sampled for this study within the metropolis has an approximated distance of 47 km (the total canal distance of the four waterways selected as shown in Figures 2, 4) within the understudy areas and are divided among the Local Council Development Areas (LCDA) and five local government areas of Lagos Mainland, within the worldview of Lagos metropolis close to the Lagos Lagoon. However, Figure 3 shows only the 18 km distance of the waterways and the areas of concretized canals within the Yaba district of Lagos. The site's location and user-friendliness, as well as its openness/accessibility, including automobile, bicycle, and pedestrian entry and exit, are important considerations. The size of the site and its potential for future growth should be sufficient acreage to support the various uses and provide space for upcoming development and growth.
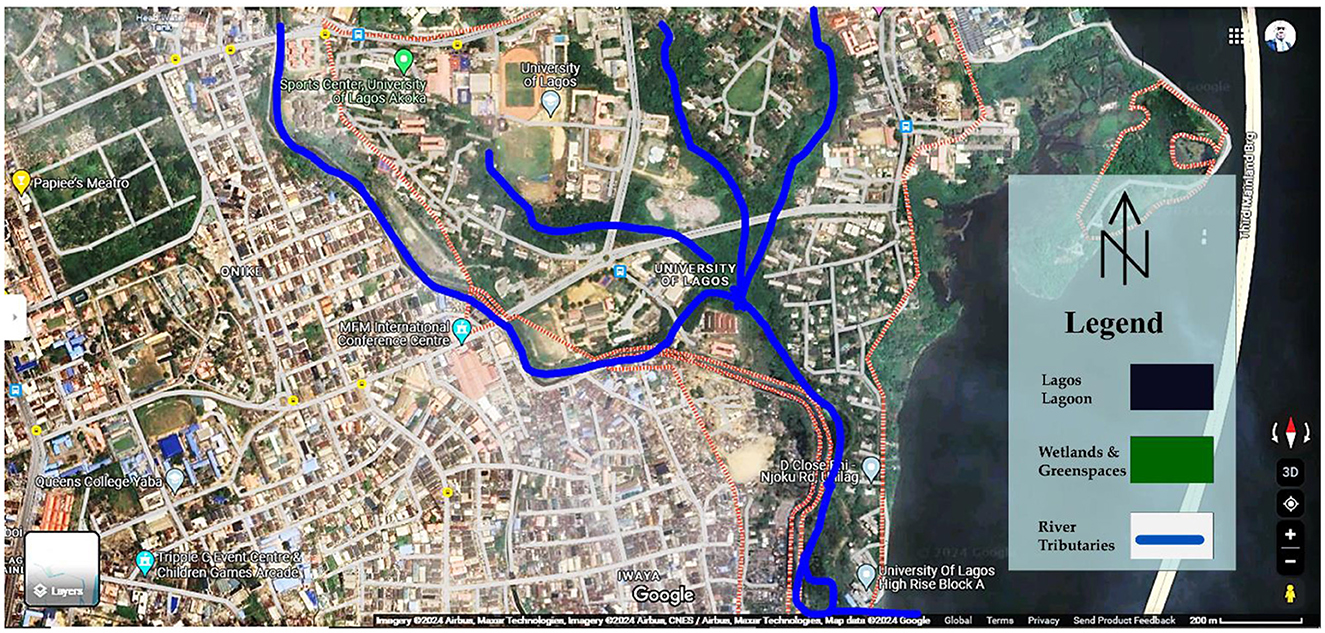
Figure 3. A section of Lagos Mainland, specifically Akoka-Yaba, shows the water tributaries (blue) and runoff from the city flowing into Lagos Lagoon.
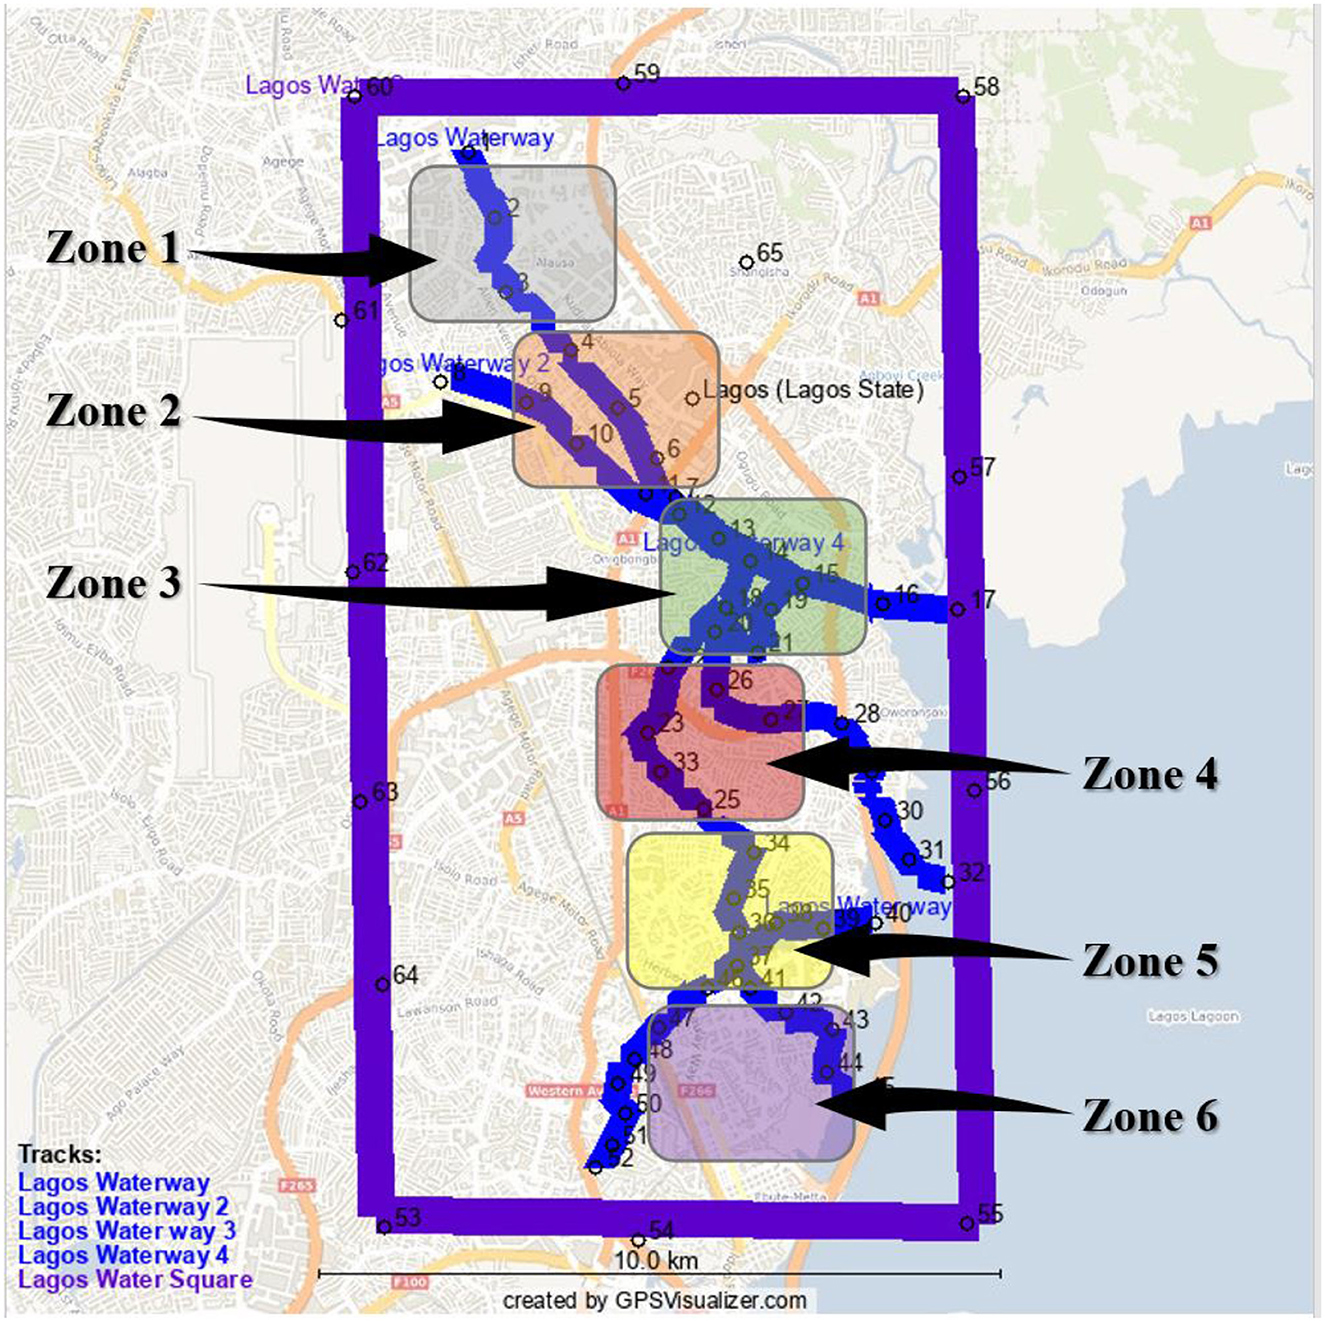
Figure 4. A section of Lagos Mainland, showing the four selected canals and six zones.
2.2 Data collection
The study's methodological framework, particularly integrated both qualitative and quantitative approaches during the direct survey. This study noted that the way the community perceives its surroundings is influenced by any modifications it makes, and its perceptions in turn influence how it responds to those modifications. The economics, modes of travel and interaction, plans for urban growth, governmental regulations, and the conduct of the populace are some of the variables that affect how a body of water is integrated into an urban environment. The perception of the selected residents on the open spaces in the city was also captured to determine how the various societal segments view the areas surrounding waterways and to discover if they possess a concept of versatility. This study, however, relied on the spatial analysis workflow as illustrated in Figures 4, 5. By also strengthening the methodological justification regarding the weighting of sub-indices and statistical validation of the models used, and by deepening the analysis of social perceptions as prescribed and illustrated in Figure 5.
Figure 5. Indicator-based geostatistics and spatial analysis workflow of the study.
2.3 Creating a framework for the drainage pattern
The field of hydrology studies how the earth's fluids move through the hydrologic process and how contaminants and debris are carried by the water as it travels. The primary goal of GIS applications is to utilize location-referenced data that describes the shape and nature of geographic features (Figure 5). Applying GIS databases, operational drainage modeling replicates the movement of water in a given area of the planet. Within the region, water flow can occur both vertically and horizontally; hence, hydrologic processes must be characterized across a volume of space rather than an area (Tang and Adesina, 2022a; Okonkwo et al., 2023; Mshelia et al., 2024). One way to create such a volume is to project the lines that make up the geometry border upward into the earth and environment, and then use horizontal planes to close the top and bottom of the volume. The surface that surrounds such a volume is referred to as the control surface, and in fluid mechanics, such a volume is termed a control volume. Developing models that connect the rates at which the water characteristics in the control volume shift to the flow of those qualities over the surface under control is part of the research's objective of developing a hydrologic model and workflow, as shown in Figure 5.
Adopting Equation 1 reviewed the basic soil water equilibrium model, for instance, is as follows for a control zone shown surrounding a piece of ground (Veról et al., 2020):
where
P(t) represents precipitation;
E(t) refers to evaporation;
Q(t) denotes soil moisture surplus (which provides streamflow and replenishes groundwater, making up the flow throughout the control surface during the interval);
S(t) denotes the volume of soil humidity maintained at the start of the time frame t; and
S(t+1) is stored periodically thereafter.
The chronological sequence of the four parameters—S, P, E, and Q—as well as any additional factors connected to them, must be addressed to solve this problem. A data set for each of the factors previously mentioned must be created for any ground unit in the study area, as it is inherent in the construction of a territorial hydrological framework that the method's characteristics would vary geographically (Veról et al., 2020). Therefore, deciding which parameters will be computed on how many geographical units for a certain number of periods represents the first step in building a GIS hydrological model. To construct complicated models, the entire problem must be divided into several sub-models that communicate with a shared database. Multiple models linking different components of the hydrologic cycle within a particular geographic region are made viable by GIS's ability to define this collection of data precisely. A GIS analysis describing the area is the first step, and simulation then adds more information to the spatial characterization. Table A1 presents the data statistics of the geographical coordinates of the study area, Tables A2, A3 show the peaks and depressions report, and the gridding report of the study area. This study used geospatial and multicriteria decision-making methodologies to assess the flood hazard assessments in Lagos Mainland. The Urban River Restoration Index (URRIx) serves as a tool for evaluating the enhancement of waterway habitat quality and ecological integrity through urban flooding reduction initiatives.
2.4 Theoretical foundations: simple kriging mathematical formulation and equations
The impact of flood risk is plotted using GIS; for instance, the topographical report works well for interpolating terrain values, as one might anticipate, since identical values are consistently found near one another (Figure 5). Kriging is more effective with data sources that exhibit intricate spatial patterns and require precise uncertainty assessment and quantification. Kriging may be thought of as a two-step procedure: interpolating values for unsampled points or blocks throughout the spatial field using weights derived from the spatial covariance structure of the sampled points, which is initially established by fitting a variogram. Given that it offers a reliable technique for interpolating data in the environment, simple kriging is essential in geostatistics and spatial analysis (Figure 6).
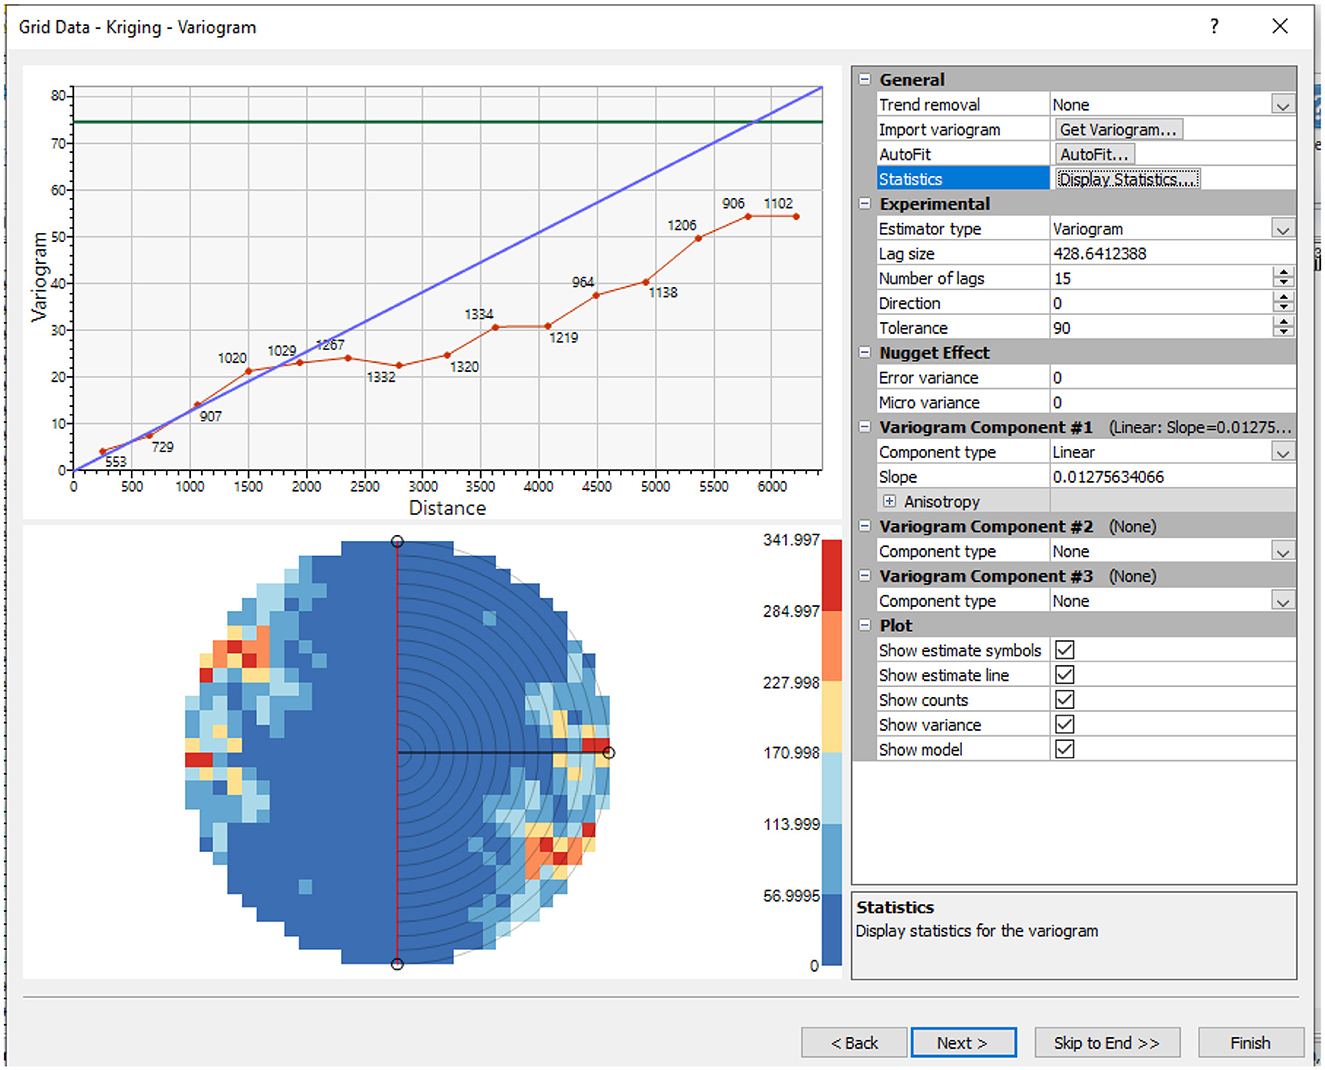
Figure 6. Interpolating terrain values of the topographic data.
While working with data that shows spatial autocorrelation—a feature common to many natural phenomena—it is beneficial. Simple kriging can generate more precise and reliable estimates than techniques that disregard geographic links by taking into consideration the spatial structure of the information under consideration used in this study.
Theories, computational design, and the function of variograms and covariance functions are foundational concepts that determine the success of basic kriging (Figure 6). Equation 2 gives us the basic kriging indicator.
where Z(xi) represents the observed values at place xi, Z*(x0) represents the predicted value at position x0, and λi represents the weights given to each observation. Solving the following set of equations yields the weights:
where Z(xi) and Z(xj) coefficients are denoted by C(xi, xi). Both the first and second equations guarantee that the predictor is impartial and that the weights are selected to minimize the variance of the prediction error. In basic kriging, the variograms and covariance functions are crucial because they depict the spatial dependency of the data (Figure 5). The covariance coefficient amongst entries distanced by an interval h is measured by the covariance function, C(h), whereas the variogram, γ(h), measures the average squared difference between values separated by h. They are connected by:
where C(0) represents the variable's range. The empirical variogram calculated from the data must be fitted to a proper variogram model to be used in basic kriging computations as represented in Equations 2–5.
Table 3 shows that the topographical and volumetric data captured in this study are computed, and the median of the water cycle and turbulent flow measurements made five or more times for every waterway that crosses the river's edge into the Lagos Lagoon (Figure 4; Table A1). The total volume of runoff within the metropolis into the waterways can be calculated by adding volumetric data, and another technique to determine stream flow is by the use of a “V” pitch concretized canals following the mean and the frequency distribution, as shown in Equations 6, 7. The purpose is to monitor the outflow using a barrier, or canal, to modify the way a waterway flows inside dams, much as it does inside the reservoir, but flows over the top when it is in the shape of an obstacle along a river. It can translate the volume inside the canals into their velocity, considering the configuration and contours of the canal's top and how much water flows across it.
where
Xi = value of the ith case on variable X (incidentally, Σ Xi = Nμ);
N = land size; and
Σ = summation.
It means adding the values for all N cases.
where
Xi = value of the ith category;
fi = number of times that value occurs (incidentally, Σ fi = N); and
c = number of categories or groups.
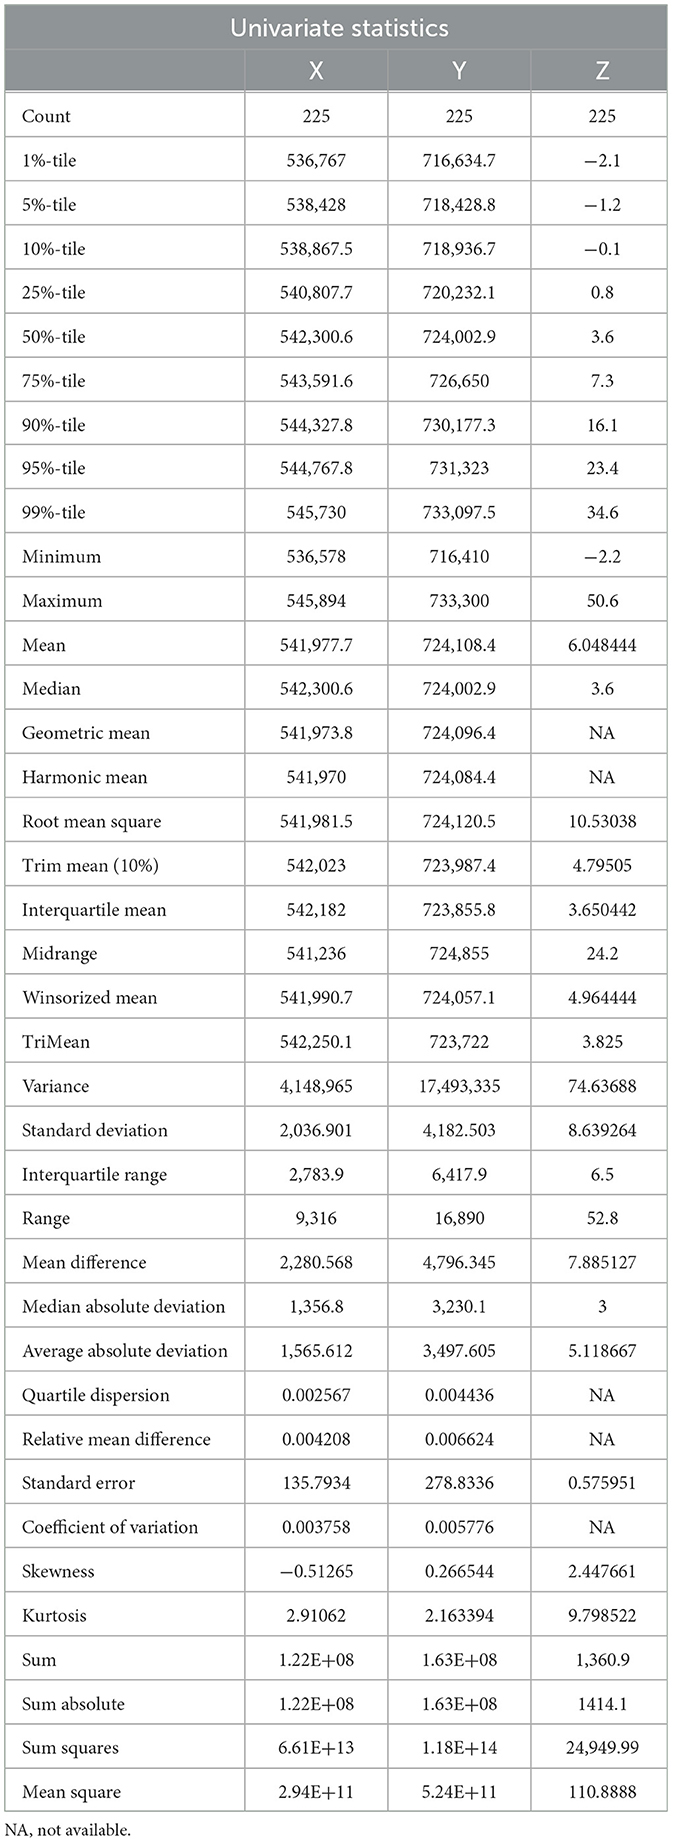
Table 3. Topographical data report.
2.5 Adopting the flood risk index (FRI) and urban river restoration index (URRIx) models
As stated by Veról et al. (2020), the FRI is a numerical multicriteria index that combines sub-indices representing susceptibility (which encompasses sociological aspects) and overflow attributes (which reflect disaster-related attributes). Equation 4, which combines an indexed product of stacked quantities, displays the FRI's ultimate expression. Only if one of the sub-indices (FP, which deals with swamped characteristics, or C, which deals with city repercussions) is zero does the probability in this equation become void.
where
FRI is the Flood Risk Index (ranging from 0 to 100%);
FP is the flooded properties sub-index, representing hazard (ranging from 0 to 1);
C is the consequences sub-index, jointly representing exposure and vulnerability (ranging from 0 to 1);
Qi is the weight of sub-index i (0–1), with i = FP or C;
Ij: indicator j (0–1), j responds to D = depth;
DF = duration factor;
DD = dwelling density;
In = income per capita;
IS = inadequate sanitation;
Pj: weight of each indicator j (0–1).
To build an all-encompassing index, these indices are employed to further combine the parameter ratings and scale factors (Zhen et al., 2022). The built environment vulnerability index (VI) is determined by weighting building indicators, while the flood hazard index (FHI) and Flood Risk Index (FRI) are determined by incorporating flood intensity and contaminants factor indicators. This is due to data limitations, which also mean that the building vulnerability index (VI) is based on the GT combination weights and is computed using Equations 9–12.
According to Zhen et al. (2022), the flood hazard index (FHI) and the building vulnerability index (VI) of the built environment are combined to create the Flood Risk Index (FRI), as shown in Equation 8.
Utilizing the equal interval approach, built environment are categorized into five risk groups based on FRI: very low (10–28), low (28–46), medium (46–64), high (64–82), and very high (82–100) to enable contrasts between structures in different spots under various flood circumstances and scenarios.
Additionally, an adaptation of the initial URRIX approach was applied in this work, mainly to assess and incorporate the (potential) ecosystem enhancement of urban watersheds in the design process associated with solutions in the hydrological framework. The model URRIx provides an empirical standard for comparing potential interventions. In its composition, it takes into account the ideas of the river restoration strategy. The topic of potential flood mitigation is rarely discussed in relation to urban waterways. Regardless of whether the outcomes are modest, it is crucial to recognize and appreciate initiatives aimed at enhancing the integrity of rivers and streams, as well as the relationship between the natural and built environments. While URRIx projects activities that impact metropolitan watercourse networks, it might introduce a threat to the environment. First, the general health of the watershed is emphasized, with an emphasis on impervious rates, sanitation conditions that impact water quality, and potential metropolitan populations. Second, the waterway connection is considered. Third, floods are the factors that make up the URRIx composition. Municipal dynamics that are typically overlooked throughout all environmental restoration assessments are included in this method, which also relates to the potential for streamlining the process of selecting among various mitigation options. The intent is to assess the severity of catastrophes that can occur in a built-up region from any cause, particularly the areas close to the watershed, minor water management problems, and excessive groundwater runoff from the pavement. The proportional total of the sub-indices, as shown in Equation 12, is used to compute the URRIx. The weights assigned to each component taken into consideration are decided on an individual basis.
where
URRIx id the Urban River Restoration Index (0–1);
GSW is the general state of the watershed sub-index;
C is the connectivity sub-index;
HRR is the hydraulic risk sub-index;
wGSW is the weight attributed to the general state of the watershed sub-index;
wC is the weight attributed to the connectivity sub-index; and
wHRR is the weight attributed to the hydraulic risk reduction sub-index.
Civilization can better comprehend when systems are pushed to the edge of their safe zone and control interactions between people to prevent irreversible alterations in the circumstances required for environmental and economic accomplishments by comparing overall effects to a safe functioning area (Greaves et al., 2025). Throughout political and scientific initiatives toward consolidated coastal management, problems including fractured nearer, various borders, and insufficient policy coordination still exist. Pictures from the shoreline environments (Table 2) depict distinct and delicate systems of society and the environment. Several empirical conversations still employ a binary approach, which limits the real potential of landscape governance, even though it provides considerable promise for reimagining coastal administration by highlighting the integrating capacity of landscapes. Furthermore, there is still a dearth of studies on the evolution of landscape conceptualization and its adoption in urban waterfront management (Gonçalves and Pinho, 2025; Barbara, 2024).
2.6 Flood zone rating
In the six zones shown in Figure 4, the investigation also revealed different flood zone ratings. According to the Lagos State climate report, Zones 1 and 2 have moderate flood risk and indeterminate flood zones, while Zones 4–6 are high-risk locations. Zone 3 has low risk. A property's overall danger of flooding is indicated by the flood risk factor mean scores in these zones, which range from 1 (minimum) to 10 (extreme). The probability of water reaching the structure during 30 years is calculated using this flood factor, which takes into account floods from rain, rivers, tides, and storm surge. Flood risk is represented by several zone types, and the Lagos State Emergency Management Agency (LASEMA) builds a collection of flood maps that illustrate possible hazards based on historical flood directions and patterns.
Insurance policies for flooding and construction code requirements are determined using these maps. A legal norm utilized by banks, lenders, and insurance firms, flood risk ratings are represented by zones, do not distinguish by flooding depth, presume that the whole zone is similarly at risk, and are not specific to particular premises. The study offers precise, publicly accessible flood risk assessments for individual properties, illustrating the risk of flooding from rain, rivers, tides, and storm surge. It also projects how these risks will evolve due to environmental factors, taking into account precipitation as an extra risk, historical flood trends, and present and potential shifts in the environment.
Applying a risk score that ranges from 1 to 10, Tables 1, 2 present a compilation of the respondents' answers and show the likelihood and severity of flooding on a property over a 30-year period. To enhance the analysis of social data, a methodological summary of the fieldwork conducted throughout the research period was recorded and presented in Tables 1, 2, which also included theme coding or organized interpretation of survey responses. Table 1, however, revealed that the selected area within the urban settlement is fully built up. Zone 1 has the least impact, at 1/10, while Zone 6 has the majority of impact, at 9/10.
With an average of four respondents, Table 2 shows the feedback of the selected respondents within the six zones sampled in this study. The respondent's responses further reinforced the onsite assessment, showing that the last four zones downstream are mostly affected. The likelihood of a flood increases over time, as risk accumulates. Identify any potential hazards and ensure your house is properly secured. While flood danger frequently lowers a home's value, it might not have a big impact in popular tourist destinations. Even after taking flood insurance into account, residents of the metropolis who are prepared for any problems and are ready to accept the risk may be able to purchase a house that would otherwise be beyond their means. Flood insurance premiums for residences in high-risk flood zones are higher than those for homes in moderate or low-risk areas (Figure 7). An alternative name for them is Special Flood Hazard Areas (SFHAs). The respondents also stated that they are required to get insurance against flooding if they have a government-backed mortgage and own an investment in an extremely susceptible region. Typically, the coverage requirement is the entire cost of replacing the property, the maximum amount permitted by the insurance companies, or the remaining mortgage debt, whichever is lower.
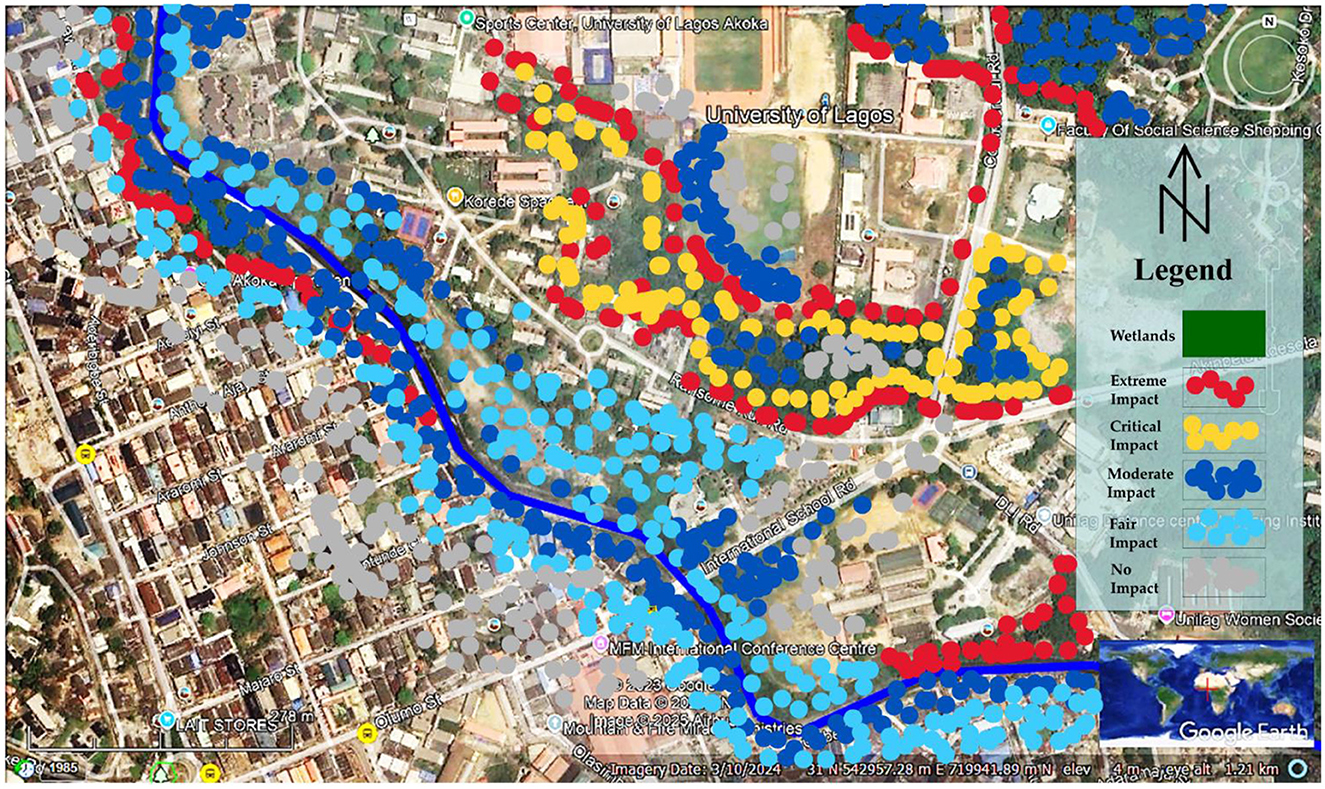
Figure 7. Aerial imagery illustrating the level of flood susceptibility, human displacement, and environmental impacts caused by devastating floods is represented in five color codes. Source: Edited from Google Maps (2024).1
This study highlights the importance of adhering strictly to land use regulations, as the location must fall within the state's master plan category for recreational development. Landforms, rocks, crops, hills, valleys, streams, rivers, natural flora, and any other distinctive characteristics that distinguish the location and lend themselves to the planned project are examples of environmental elements. Broad examination of the site's characteristics, existing site conditions (Tables 1, 2), and microclimate, while taking risks into account to maximize the benefits. Lagos's flood susceptibility was evaluated using the watershed and flood risk map mapping approach. Data for this study were obtained from various sources, including government organizations, public records, books, research journals, and libraries. The selection criterion for the site comprised several components, such as assessing the area's topographical features and the use of the slope.
To comprehend how various land uses affect the risk of flooding, accessibility to highways and rivers, and how transportation infrastructure impacts floods. Knowing the rainfall intensity to assess the influence of significant rainfall events on the urban settler and their immediate built environment. Elevation is used to assess the vulnerability of low-lying areas. The data collected on-site assessed the efficacy of drainage systems using drainage density (DD), an indicator of a terrain's moisture content, as well as the Topographic Wetness Indicator (TWI). An evaluation of the site is depicted in Figure 7, where the red dots indicate areas with the greatest number of displaced people in the communities and the most severe flood-related displacement impacts. The yellow dots, on the other hand, have a critical impact, despite relatively few displaced people; however, the volume of heavy rain or downpours and water retention in those areas is concerning, causing wild reptiles to migrate into the streets. The floodplains with mild effects and minimal house displacement are shown by the blue dots. The light-blue dots indicate the region with fair effect with no reported damages; nonetheless, some individuals may have experienced catastrophic losses following the heavy downpours. During the on-site assessment, no obvious damages were noticed in this instance, as during site inspections. Finally, the gray dots indicate the locations with the least amount of influence; these regions continue to preserve their rich landscapes and natural vistas free from deterioration and misuse (Figure 7).
Subsequently, this research identifies the basin's natural assets and determines its features by establishing a baseline for the watershed's general characteristics, as quality is crucial for both planning and assessing modifications to its resources. This includes mapping the watershed's boundaries and smaller drainage basins, inventorying and mapping the watershed's resources, mapping its natural and artificial waterways, mapping its utilization of land and land cover, mapping its soils, identifying areas susceptible to flooding, such as riverbanks and building sites, and determining the existing quality of the watershed's reservoirs (Table 4). Additionally, this study mapped and documented the sources of pollution, including both non-point sources such as urban wastewater infrastructure, failed sewage canals, and illegal outflows, as well as targeted industrial outflows like waste from factory gutters. The study took into account the necessity for references about the government's previous management of drainage systems. They are required to compare the current approach with the earlier one, or with the next approach (Table 4).
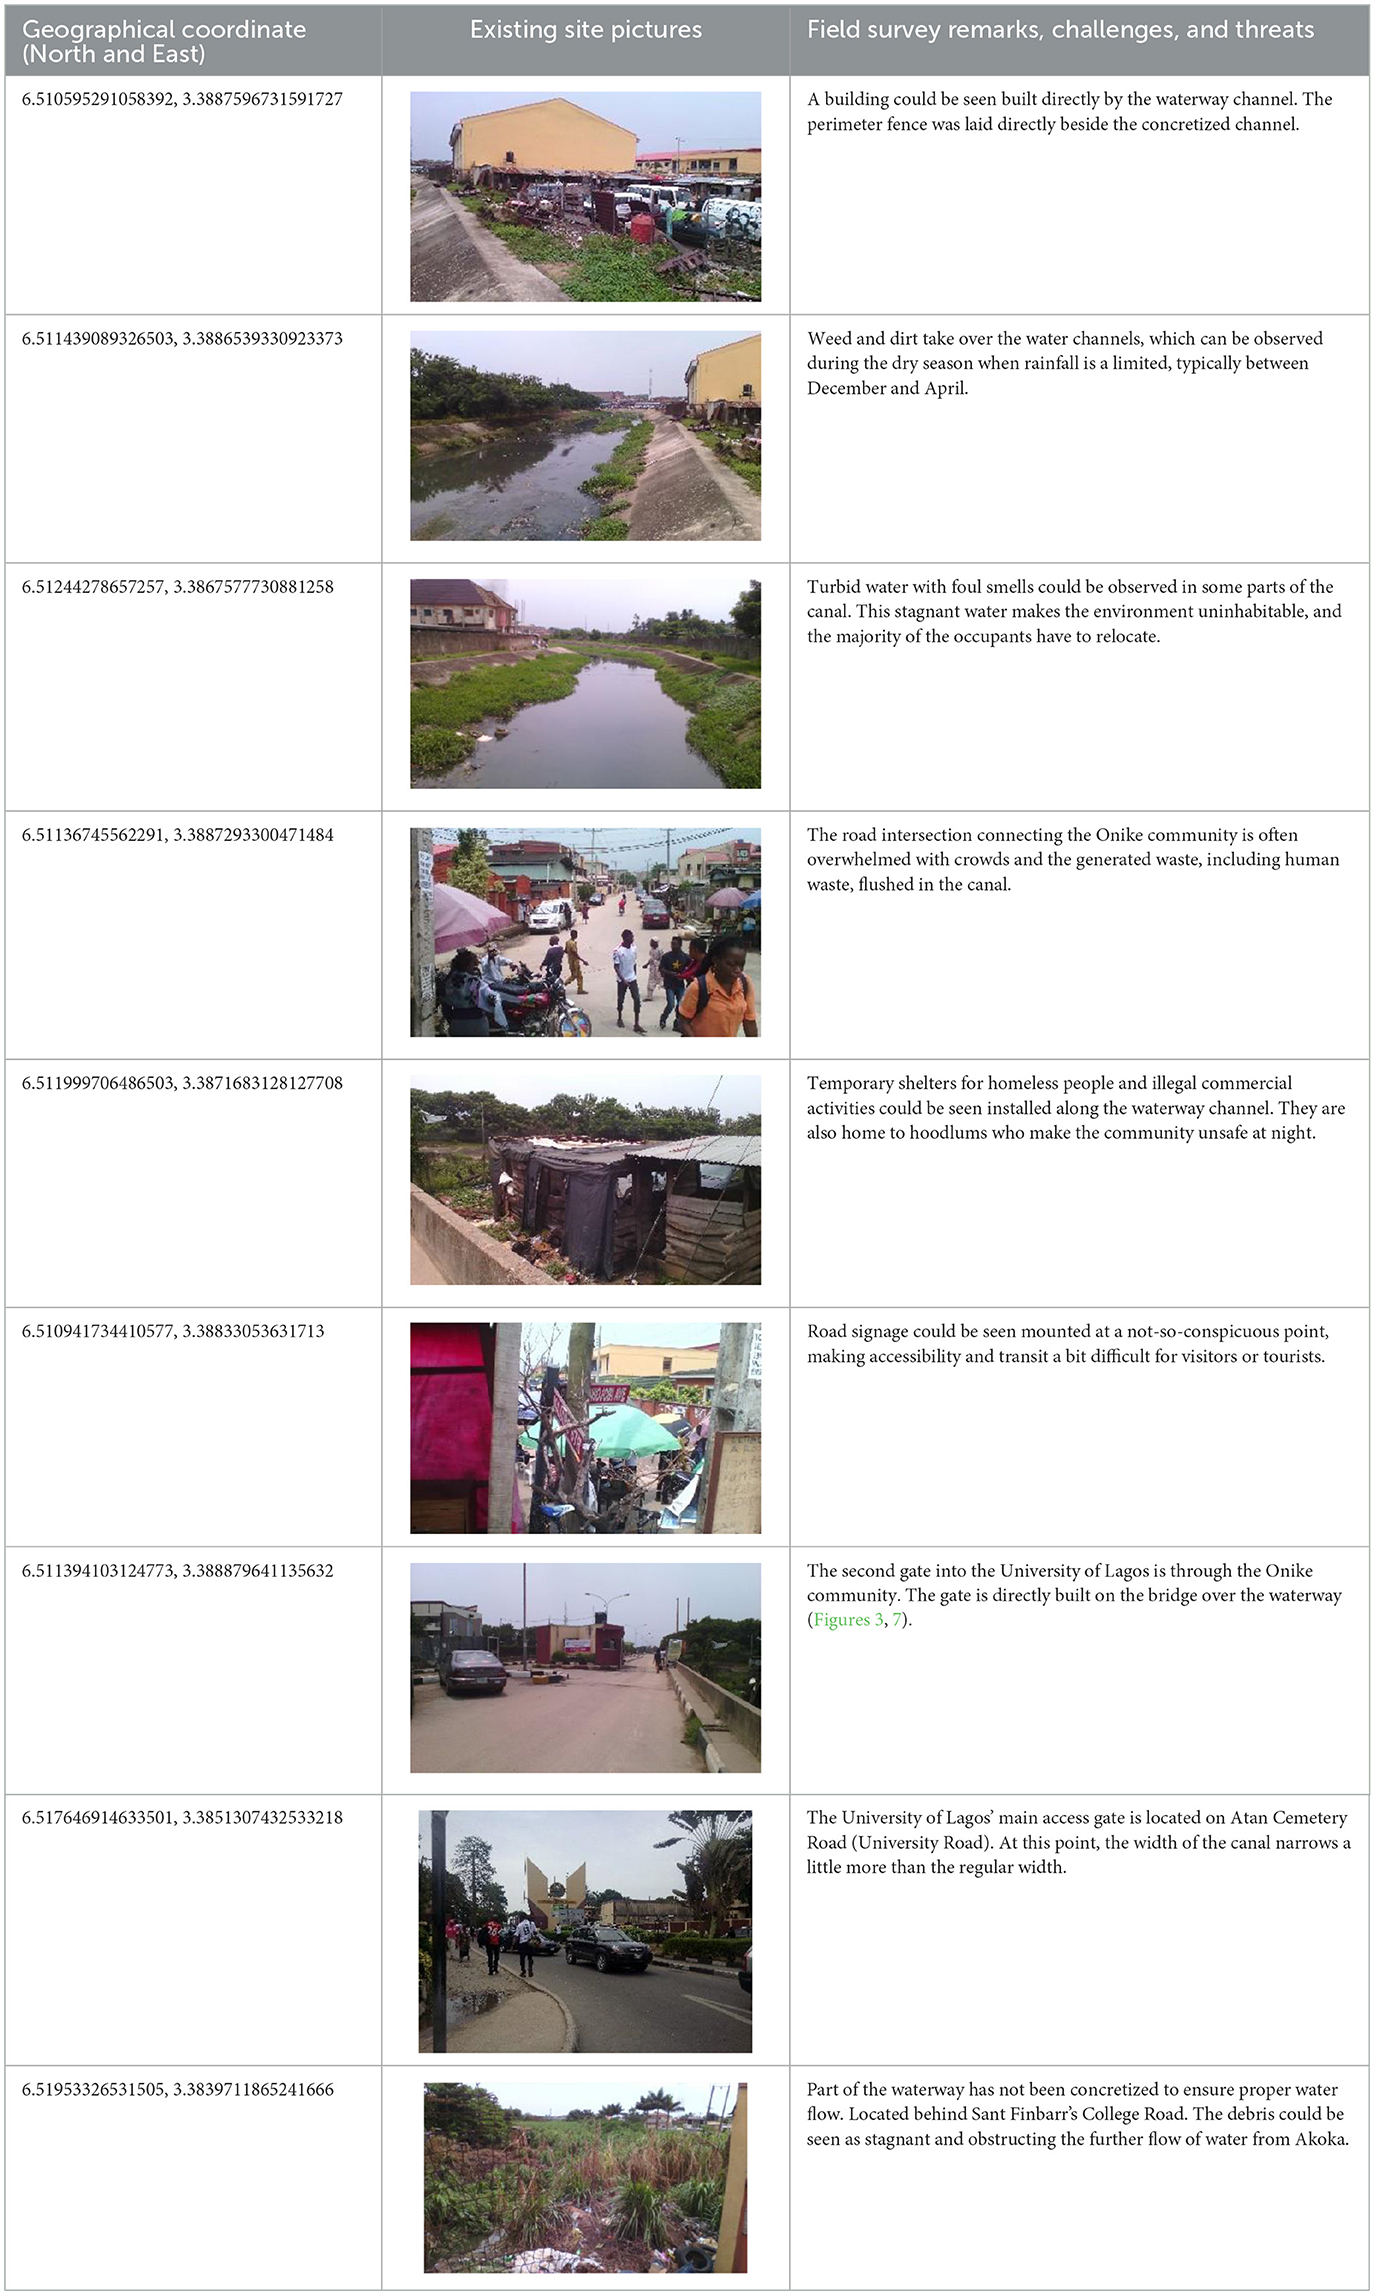
Table 4. Showing the existing situation on-site and research problems.
The informal settlement around the Onike (Majaro Street) community did not adhere to the physical planning and development setbacks, as the buildings were visible on the verge of the canal. The extreme impact is due to urbanization, while the communities behind the University of Lagos have a moderate impact. The average setback of 7 m from the perimeter fence is from the Human Resource Development Center and over 20 m behind the green line, which marks the property line of the University. However, the situation is different on the opposite side of the canal (see Table 3 for details), and this abuse of the setbacks, due to human factors, has impacted the water and the effluents, including human waste from the toilets and kitchens. This study identifies one of the main components of the waterways. It is one part of watershed runoff through land to reservoirs of freshwater; precipitation from the surface is the other part. Water that enters channels is released from pipes, surface runoff from nearby hillslopes, and groundwater flows from the earth. Stream gauges are used to measure the amount of water that is discharged from a waterway. A graphic representation of water is a time-series hydrological track. Whenever the amount of water in the drainage system is more than its maximum capacity, a flood occurs, and the discharge of a stream or canal can be gathered in several ways.
The study suggested using and installing flow meters or wetlands for tiny streams—a few meters in width, broad or narrow—is an option for applications that typically do not require continual river flow monitoring over time. Fundamental stream analysis of stream flows involves determining the area of the stream that is prone to flooding, as well as the torrent bed, and charting the ecosystem next to the stream, creating a segment of the stream environment at multiple sites. The release, which is generally measured in cubic meters per second, is the amount of water that flows along a waterway or stream in a certain amount of time. Typically, the area of water in a canal's segmentation is multiplied by the mean speed of water that passes in that subsection to determine the discharge of the river. This study selects a location where it is safe to move upstream and downstream for approximately fifty meters and collects measurements across the selected canals within the metropolis.
2.7 Findings: landform and ecological watercourses formation
The topographic data was used to create the city's hydrographic maps, which were then manually inputted following expeditions, direct on-site survey, and large-scale picture assessment. The study found that there was room for integration between the water and road transportation systems in the study area; however, interconnectivity and interlinkage between the two systems were hindered by certain outdated and poorly maintained technologies. Considering the poor standard and challenging availability of places near waterways, people consider freshwater as an essential element in the composition of green spaces. This study also found that the waterway conditions in which these zones are located fall short of what the populace expects from the presence of water-based networks in the city.
These watersheds play a significant role in the creation of green and blue infrastructure (Table 5). They also assist in conserving or reviving natural rivers that run through cities by increasing their attraction. Additionally, public gardens in the form of urban agriculture have been established in certain locations along the creeks and wetlands to promote urban farming.
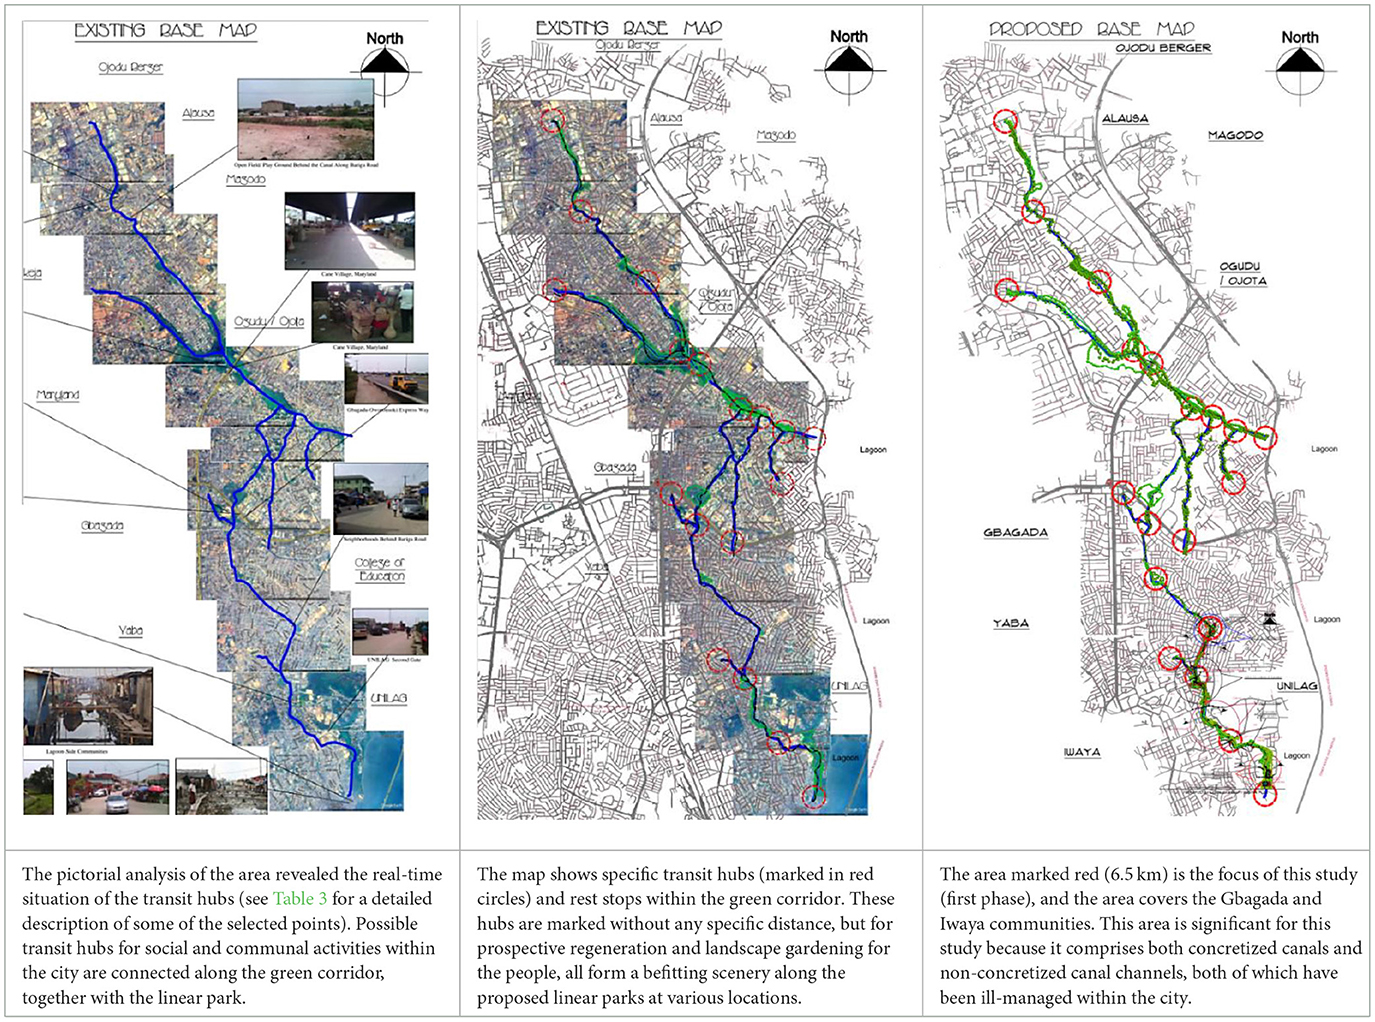
Table 5. Base maps of the study area of the 47-km green corridors within the metropolis.
Using the aforementioned criteria, the potential risk of flooding layers was created using a GIS following the direction of natural runoff and drainage flow. Indicators of risks associated with flooding in the study area are represented spatially by the different stages. When utilizing the maps to make urban restoration decisions, each criterion is analyzed at the same level and given the same significance. An additional analysis of susceptibility, encompassing various possibilities for flooding in Lagos, may be conducted after evaluating risk through multihierarchical classifications of threats. Examining certain criteria to determine the city's flood-prone zones provides valuable insights into flood risks and receptivity within the research region, utilizing a variety of data sources and satellite navigation instruments through GIS methodologies, as illustrated in Figures 8–10.
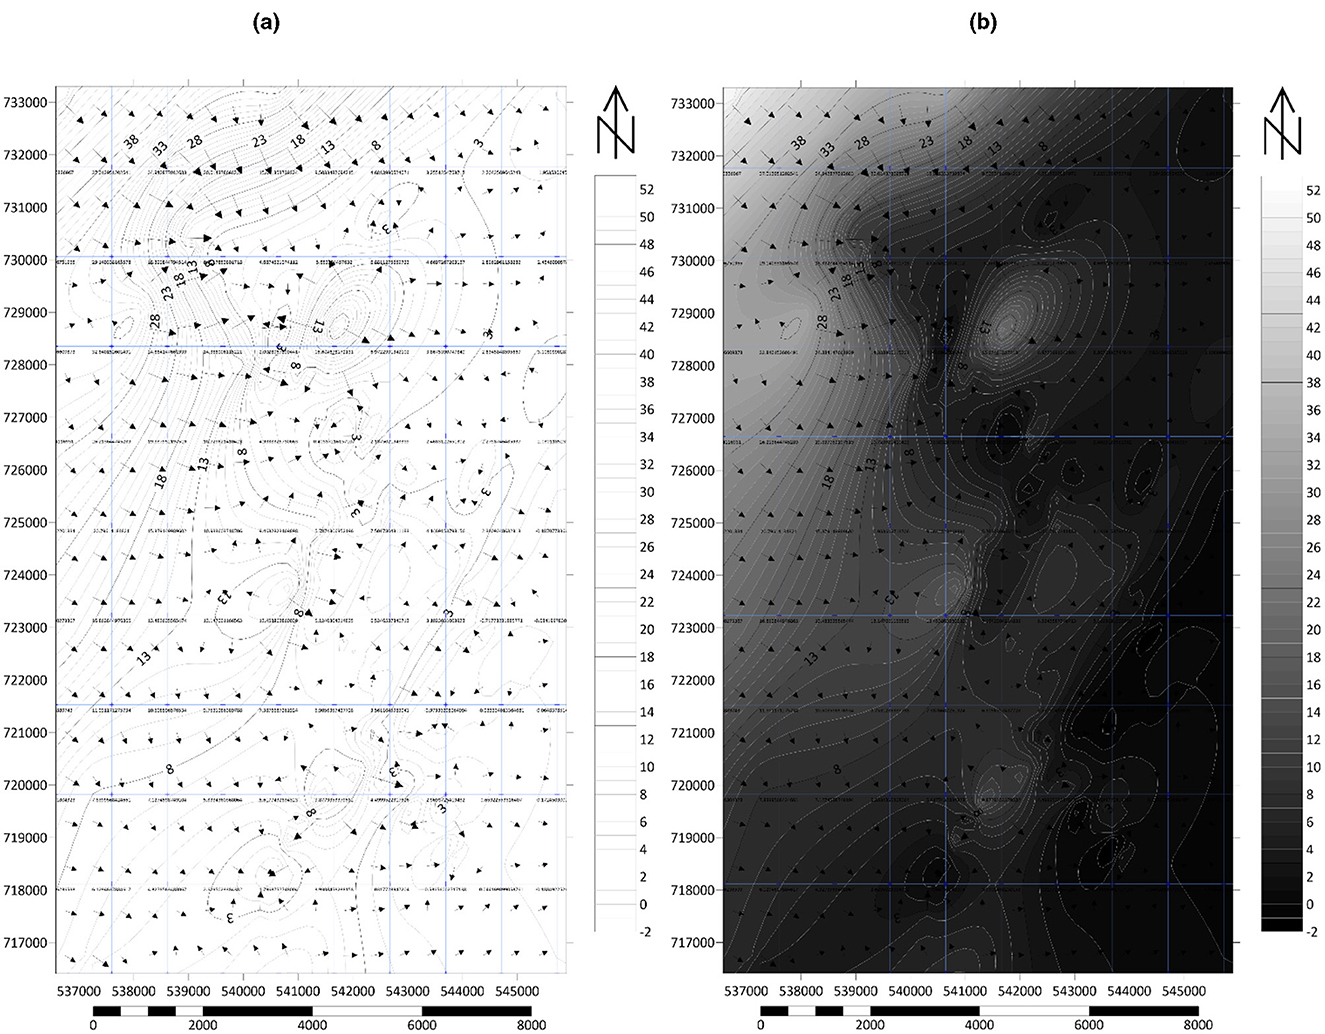
Figure 8. A section of Lagos Mainland. (a) Contour and drainage networks/directions (right). (b) Landscape relief showing the topographical gradient (left).
3 Results
The data studied revealed that all areas surrounding creeks, rivers, and streams need to be identified and secured for the introduction of newly acquired and restored wetlands (Table 5). The respondent also notes that determining uses for these regions is challenging, just like communicating with community members and ecological government agencies, especially when it comes to outlining principles like repair and conservation that need to be utilized to address the challenges noticed. Regarding the governmental supervision of those regions, the planning divisions like the Lagos State Ministry of Environment (MoE) and the Lagos State Parks and Gardens Agency (LASPARK) must address the decreased personnel and administration, alongside the challenge of forming alliances with private stakeholders. Second, the data revealed that specific streams, which were previously maintained in the metropolis, still serve a natural purpose when public sector representatives were questioned concerning the role of rivers and streams in the metropolitan area (Tables 1, 2); nevertheless, typical waterways in older destinations have been identified as drainage channels. Concerning concentrated and densely populated areas, exposed waterways, and canalized creeks, no steps have been implemented to enhance connectivity or foster more contact between residents and Lagos' rivers and lakes (Figure 9). Figure 10a shows the Peaks and Depressions Map, and the Report shows a peak count of 14 and 8 depression counts, and the minimum and maximum statistical details of the average, mean, and median (Tables 6, 7).
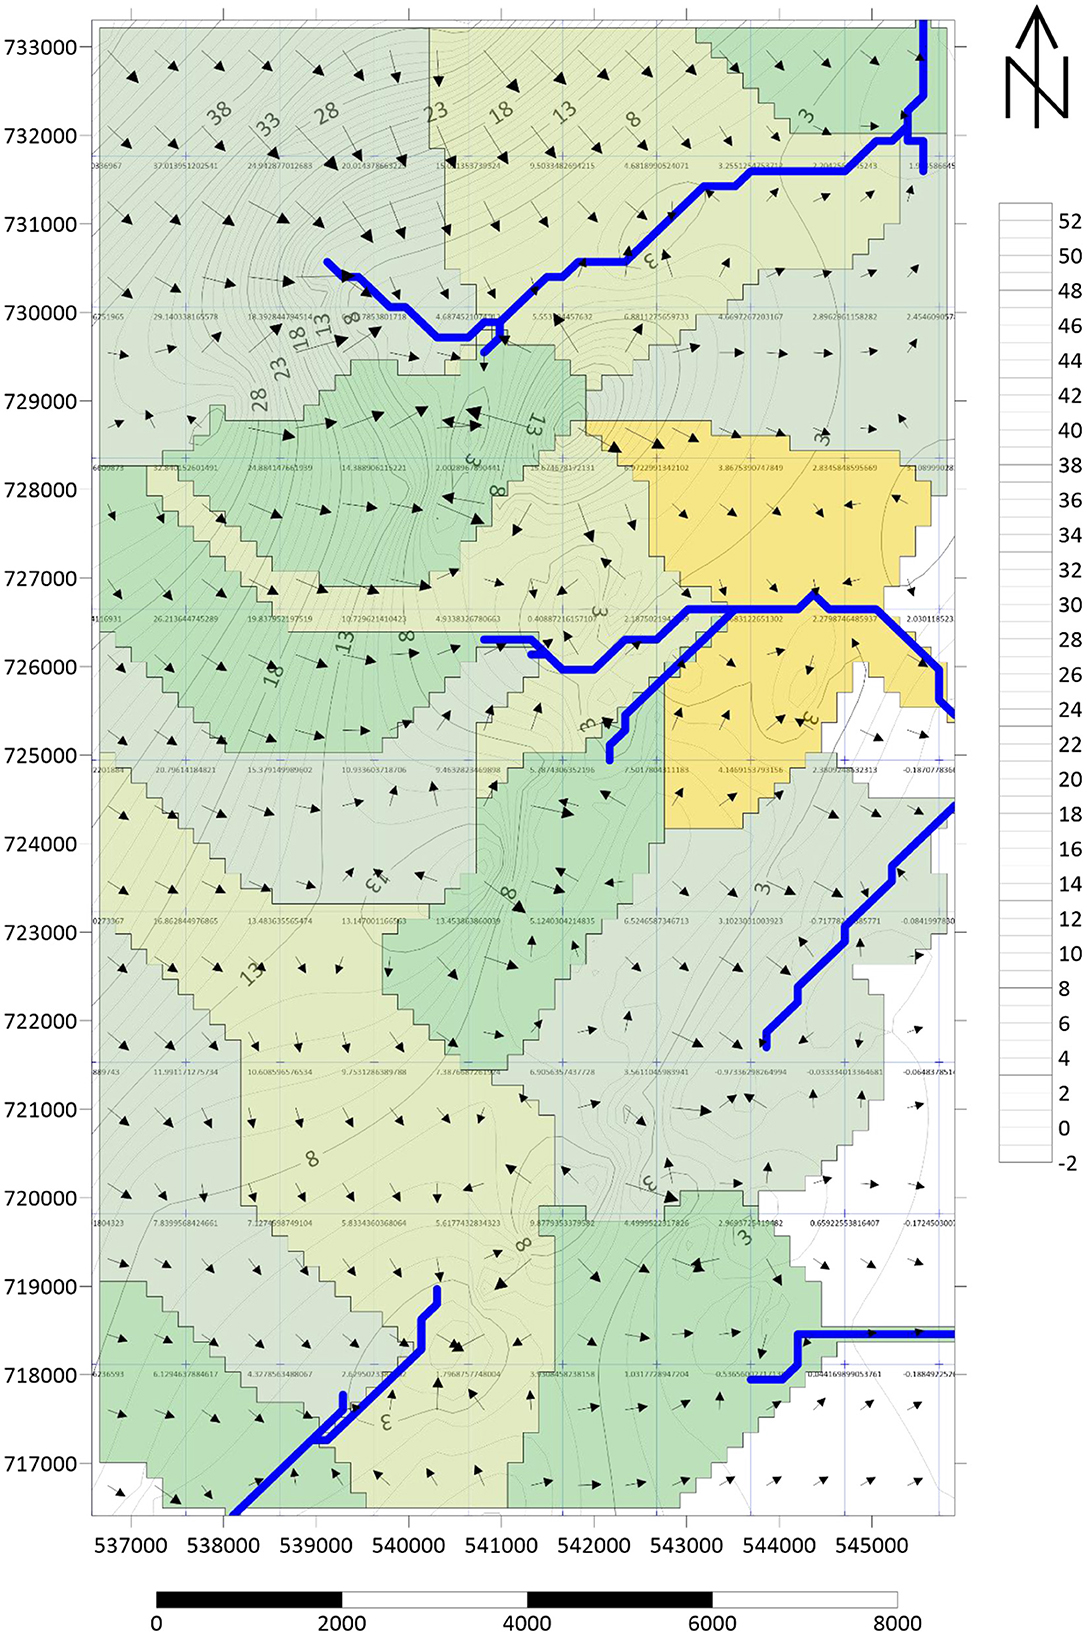
Figure 9. Waterway tributaries through the metropolis showing the watersheds and flood risk map.
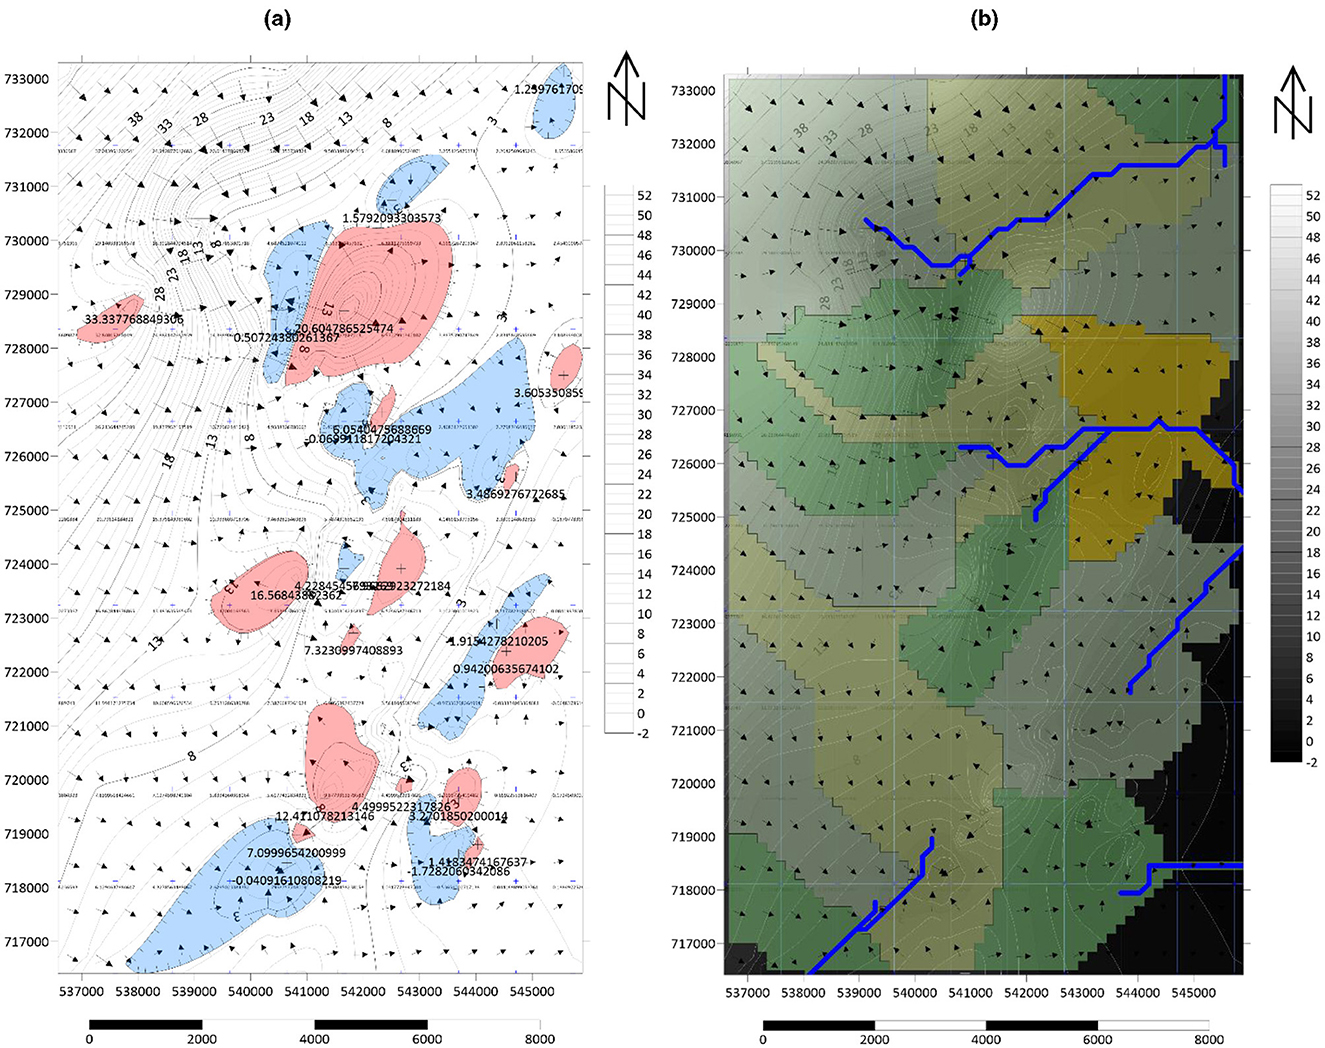
Figure 10. Maps showing (a) peaks (red) and depressions (blue) (right) and (b) the watersheds analysis and soil relief pattern (left).
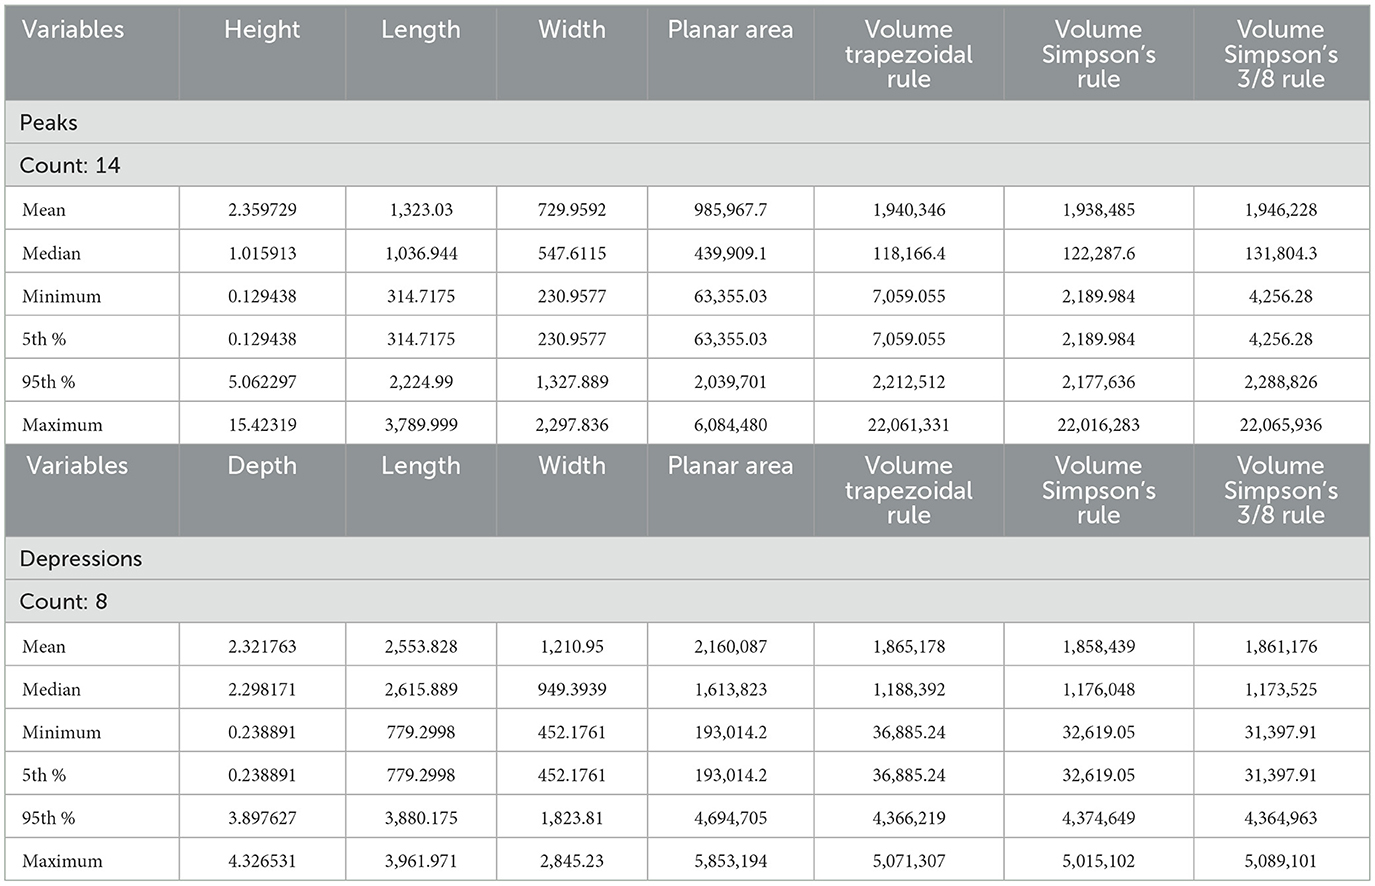
Table 6. Data statistics of peaks and depressions report.
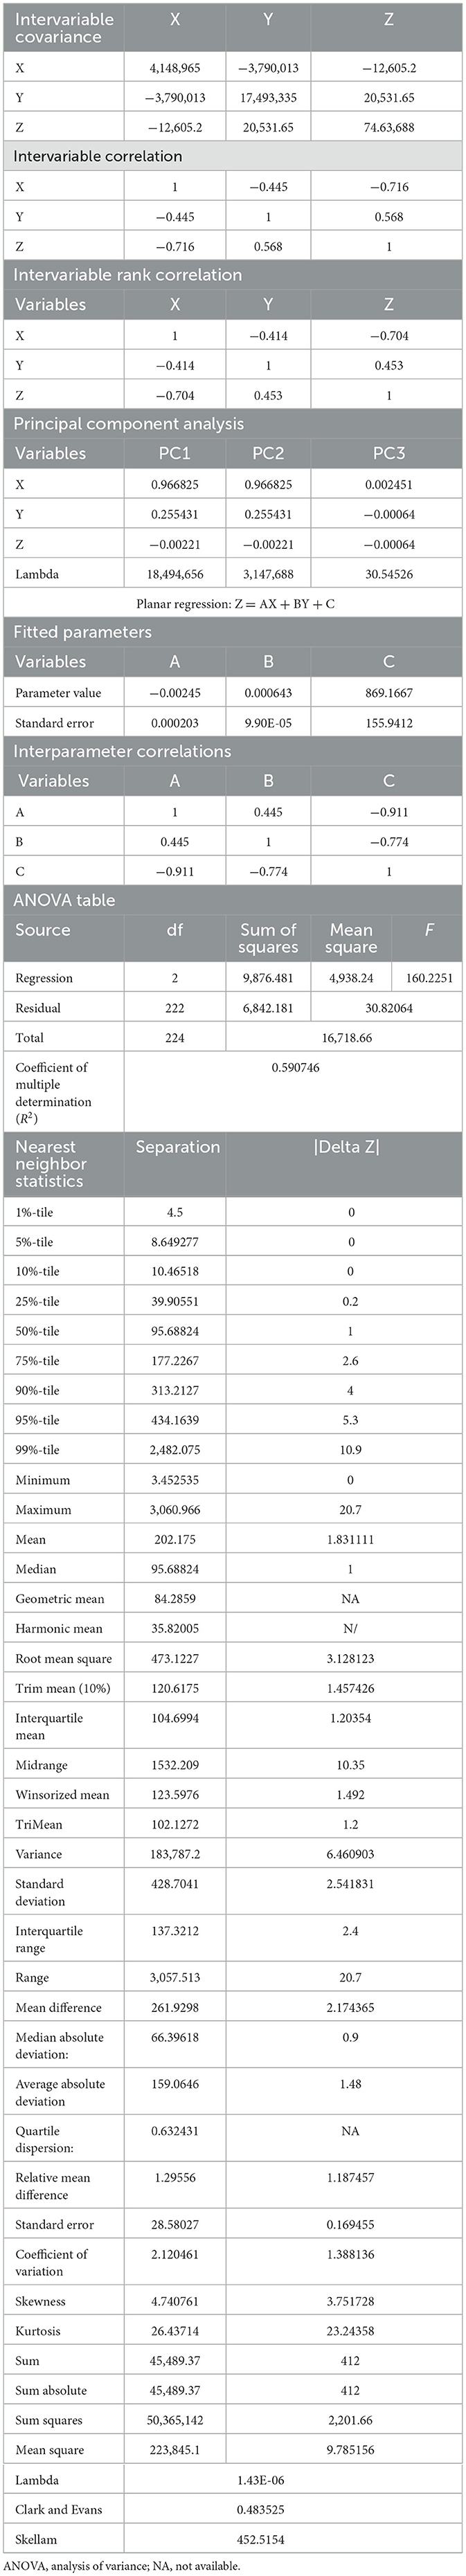
Table 7. Data statistics, intervariable covariance, and nearest neighbor statistics.
Third, following the physical assessment, a few users were spotted in the surrounding areas and shared their thoughts on how the flood-related issues facing the city need to be addressed. They suggested that the best course of action would be to make significant investments in canal maintenance and rainfall discharge to hasten surface runoff. Suggesting that both the state and local governments needed to make significant investments in rainfall irrigation. Nonetheless, the study has significantly reduced the amount of water from thunderstorm drainage, and things have greatly improved since then. Overflows will occur along the waterways corridor if the waterways that run through the city are not maintained, and if the route is not cleared of debris and vegetation before the onset of rainfall.
This research examined only the industrialized region within the urban perimeter and tracked its development. As represented in Figures 11–13 and Table 7, through geo-historical terrain analysis and geospatial evaluation of land use and habitation surrounding streams, the flood susceptibility, soil type, and elevations, the investigation attempted to analyze how the contemporary metropolitan geography relationships manifest in the natural environment surrounding city waterways, as well as how government regulations impact this. All relevant charts and pictures from the air were used for the geo-historical study of the terrain and surrounding watercourses. The aerial photographs were georeferenced and processed using updated maps. Following that, identification data were used to assess changes in the watercourse and spring landscapes in terms of their social, economic, and environmental components. The discoveries were analyzed about the up-to-date social, environmentally friendly, and economic uses for such spaces to find working mixtures of uses, such as the setup of green as well as blue networks, which are allowed for in the municipality's urbanized classification for certain regions surrounding rivers and lakes, for some analysis and topographic descriptions (Tables 5, 8).
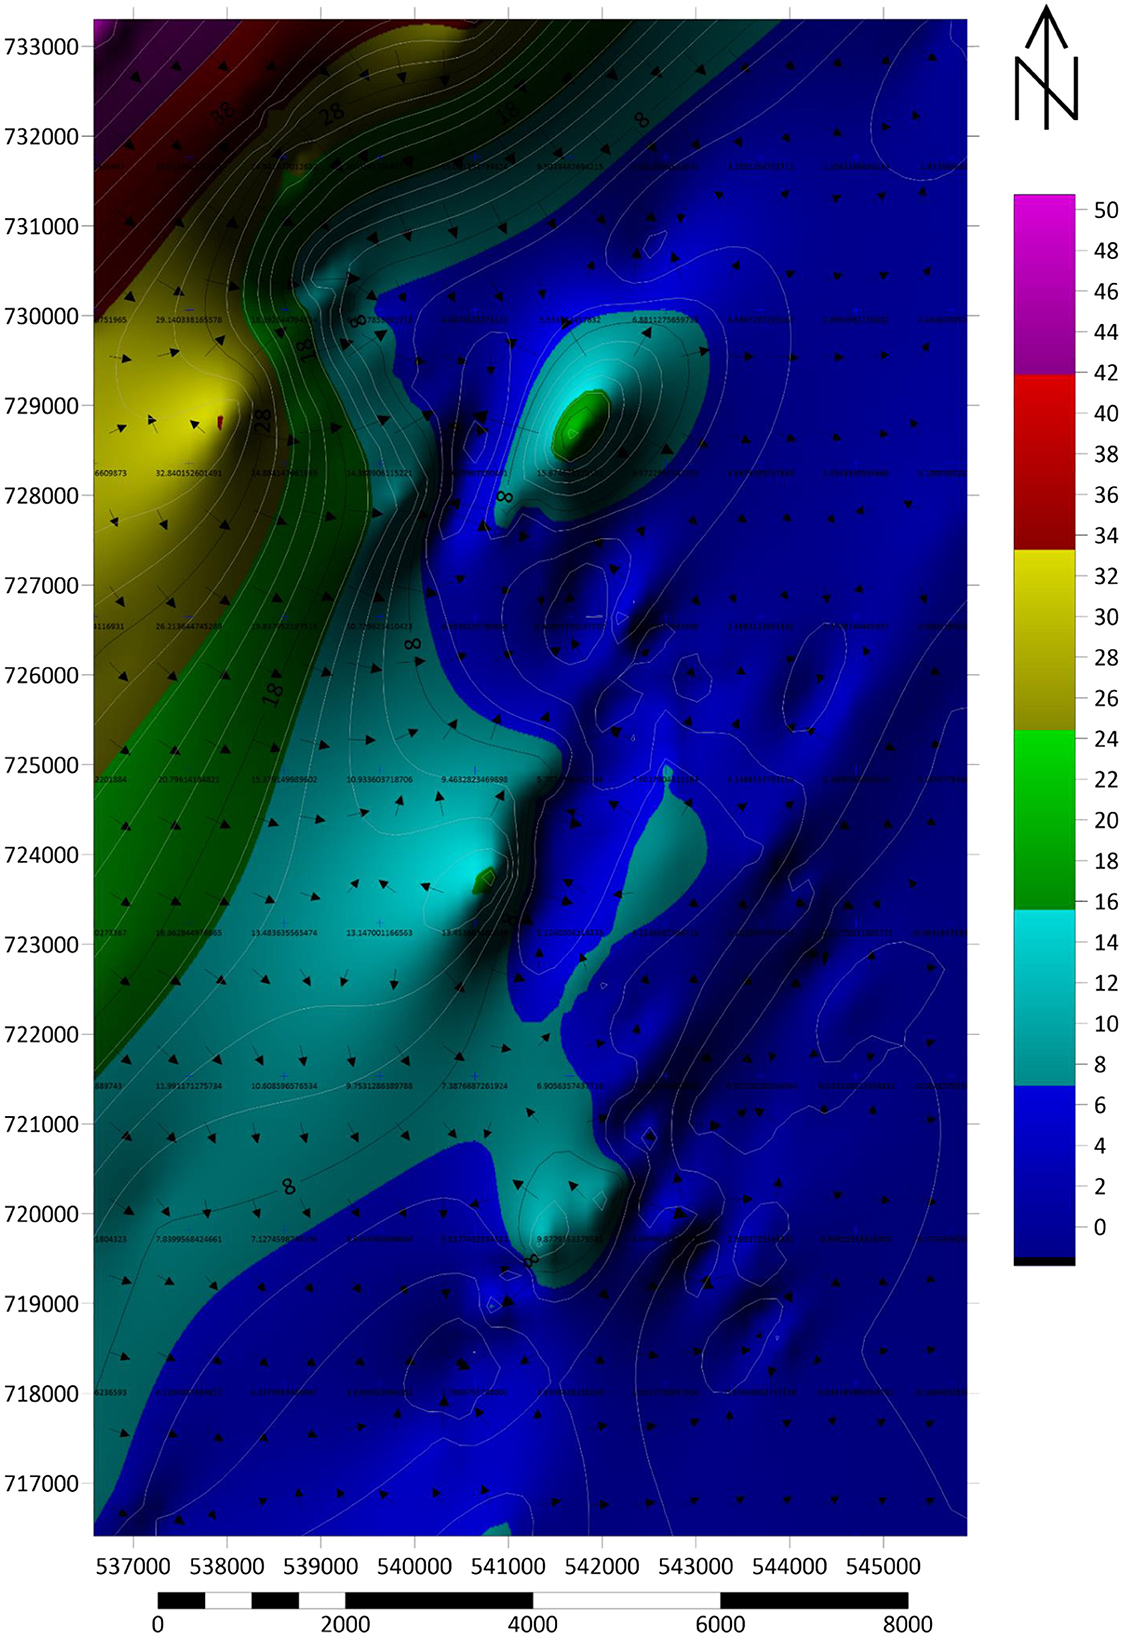
Figure 11. Flood susceptibility zones 1–6 within a total of 145.68 km2 area covered.
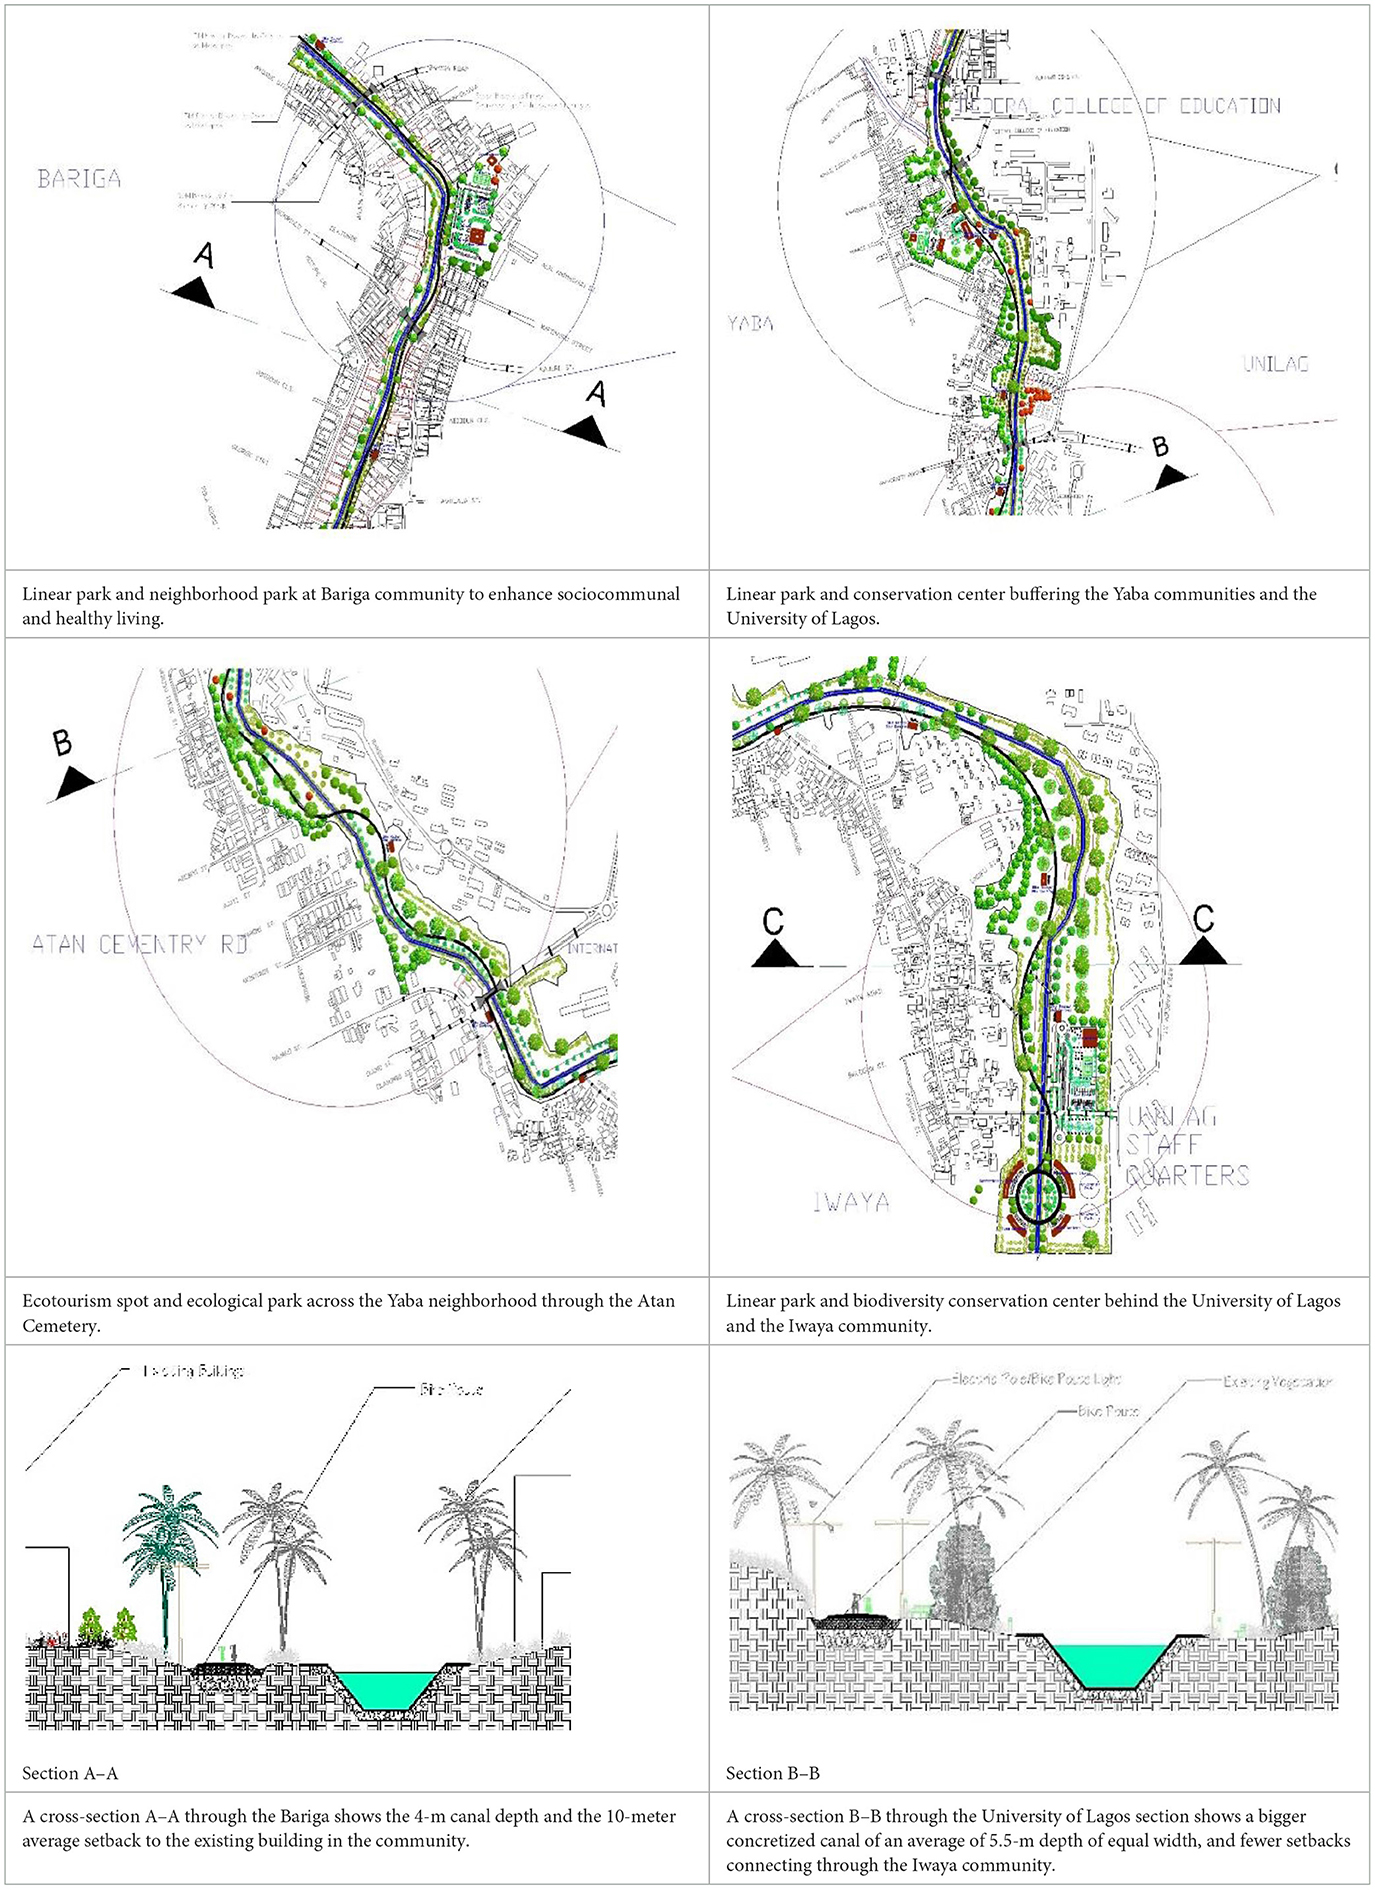
Table 8. Proposed ecotourism landscape design (linear parks urban design proposal).
At the local, district, and metropolitan levels, non-motorized modes of transportation, such as biking and jogging, are given precedence over passive movement to reduce the impact of traffic on the city and preserve ecological connectivity within it (Table 8). Along with maintaining natural spaces that wind throughout urban areas, these systems offer a genuine connection between the various terrain categories. Table 8 proposes an action plan for linear landscape design along the green belt that cuts across the city, accompanied by a principle and the growth of potential urban environmental tourism initiatives. The results of the assessment showed that the continuous and linear park is practical and will improve the city's overall resilience, health, and wellbeing, regenerate the landscape, minimize urban heat, and preserve wildlife.
4 Discussions
Figure 12 shows the variations in soil type, soil profiles, and elevation across a total of 145.68 km2 area. The soil in the selected region is mainly sandy and loose. Following the illustrations in Figures 12, 13, the FRI gauges “how severe” a flood is based only on hydrological factors. The least recorded value is “0%.” The largest deluge of records in 2024 is approximately 60% higher, considering the volume of rainfall. With an annual likelihood of less than 1% for flooding, Zone 1, the urbanized area in purple color (Figure 8), is the least dangerous. With a 1% likelihood from rivers and a 5% chance from the Lagoon, Zone 2, the urbanized area, indicated by red, yellow, and green, indicates medium danger. With a 20% or greater likelihood from rivers and a 60% chance from the sea, Zone 3, the urbanized area depicted in blue and light blue, is the most vulnerable, frequently supported by past flood data (Figure 8). Figure 9 gives a clear illustration of the worst runoff scenario as represented by an FRI value between 0 and 100%. This study confirms Rinaldo and Rodriguez-Iturbe's (2022) proposition on ecohydrology principles. The index is divided into three stages: the occurrence stage, the impact stage, and the recovery stage, and it advances continuously over a period (intermittent). Following the implementation of an alternative urban river restoration design proposal (Table 6), the URRIx was used to track the success of the river restoration over time. With a multicriteria composition, the URRIx goes from 0 (the most negative outcome) to 1 (the most positive).
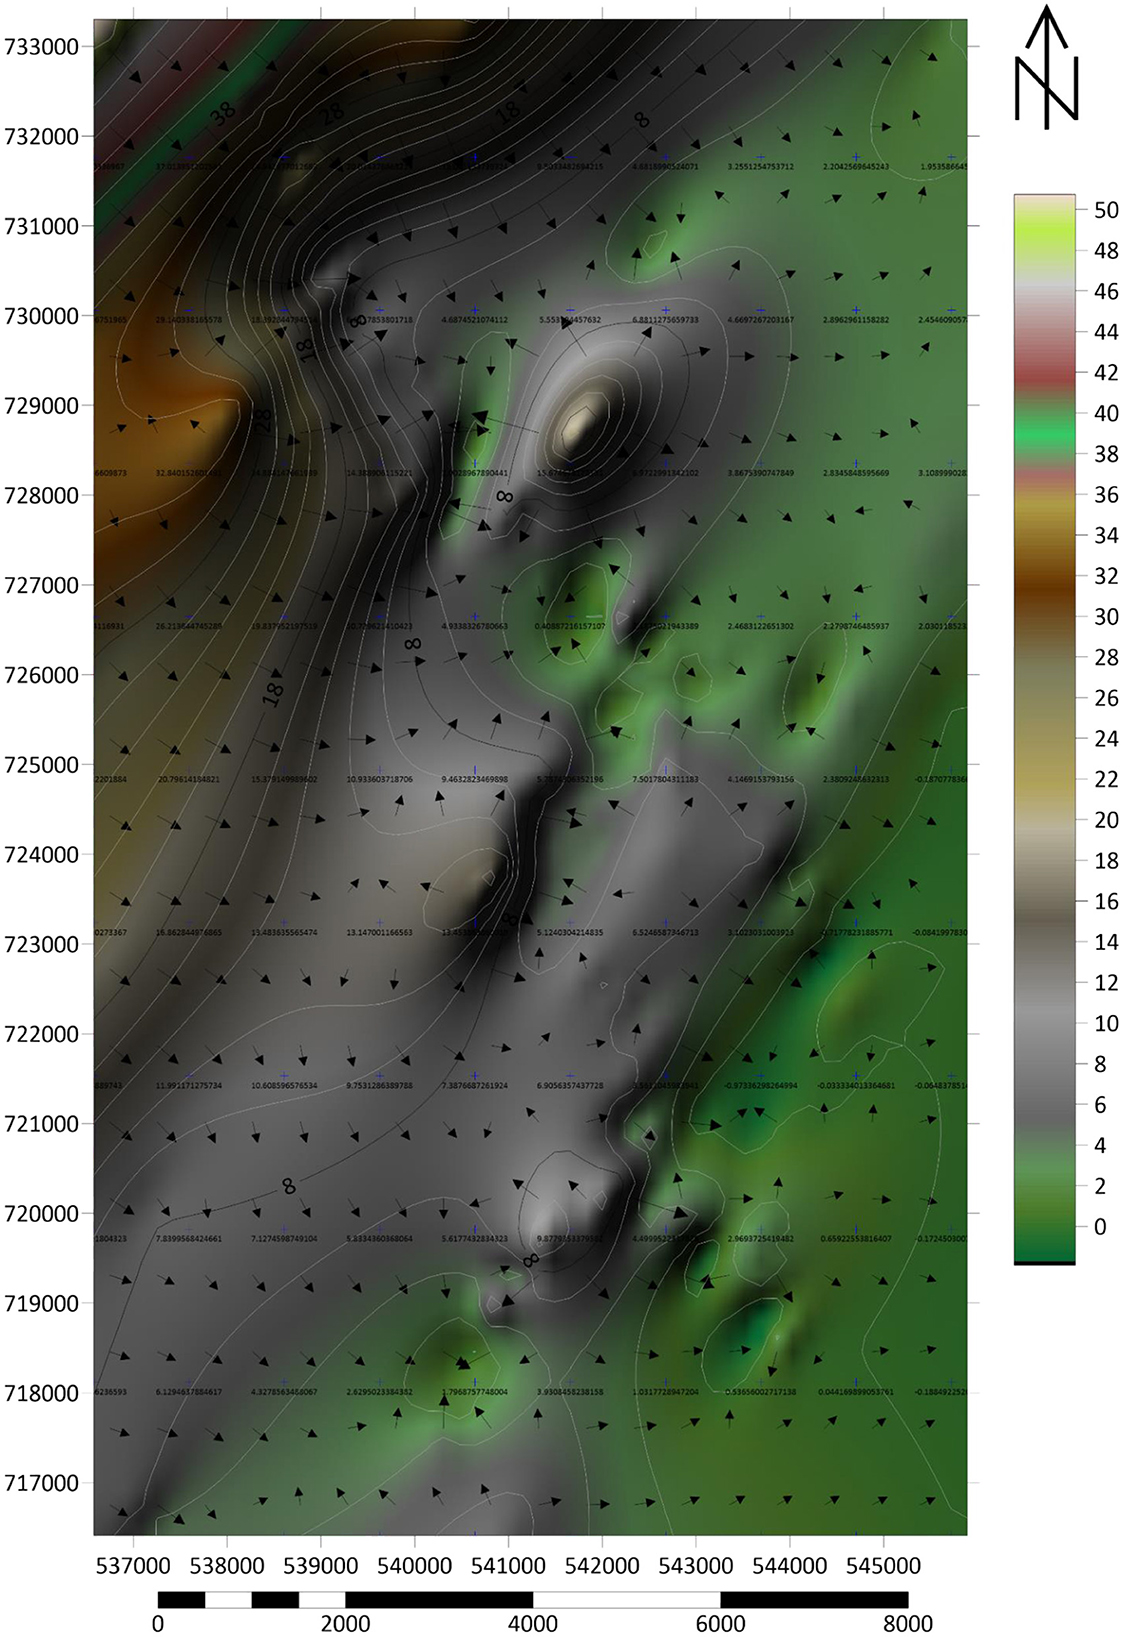
Figure 12. Maps showing the soil type and elevation of a total of 145.68 km2 area covered.
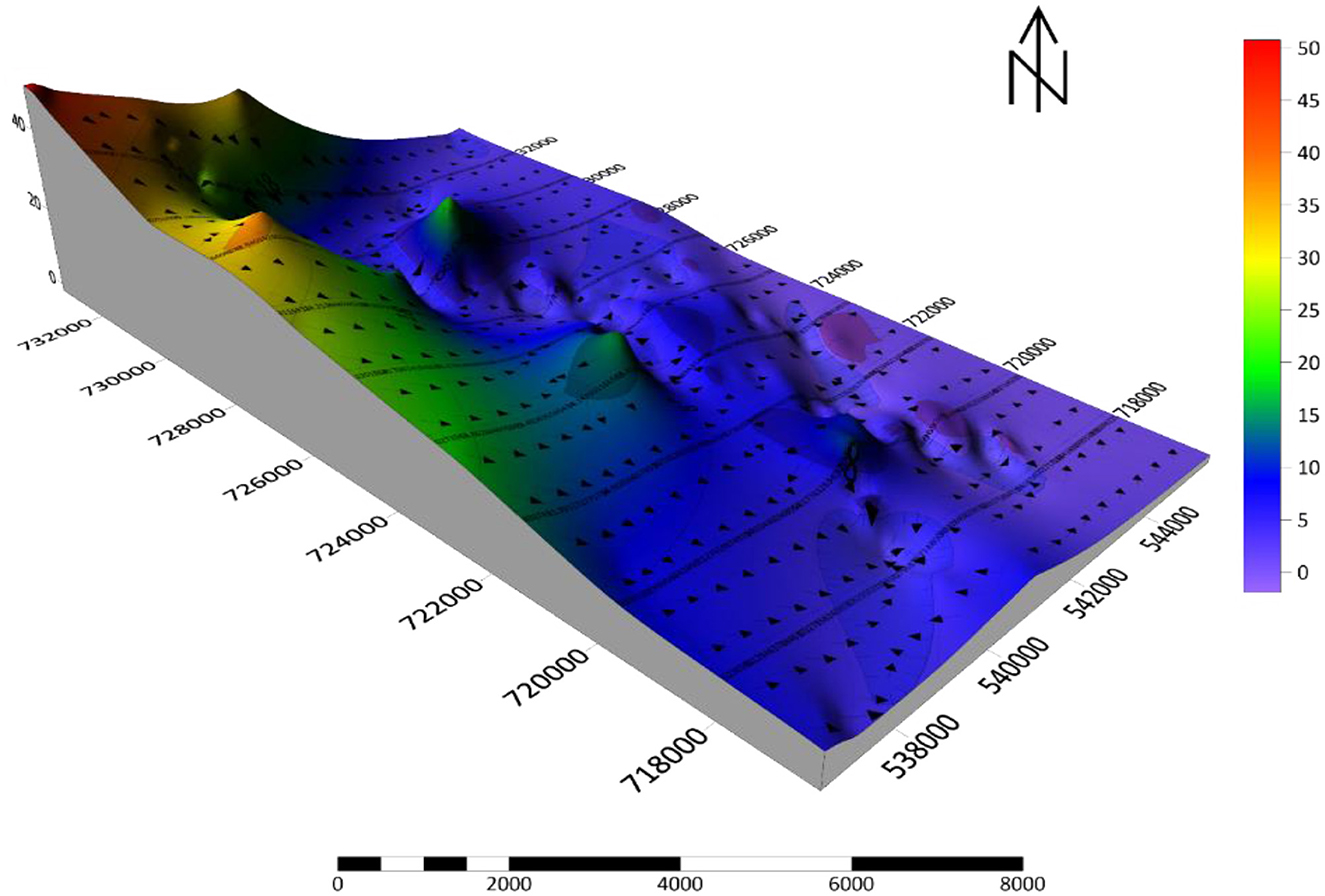
Figure 13. The DEM of the study area covers a total of 145.68 km2.
The data gathered from the analysis of the study area revealed that metropolitan plans reflect the prevailing ideologies regarding watersheds and the environment (Table 6). Actual influences the foreseeable structure of the city by imagining developments earlier than they happen, while rendering various components and patterns in the urban setting apparent or unnoticed. Findings revealed that the decomposition of several bodies of water is underway across numerous of the surveyed metropolitan areas, indicating a growing curiosity regarding urban watercourses. Practical responses to social needs include the creation of public spaces (e.g., bicycle/pedestrian routes, promenades, and linear parks), the revegetation of riverbanks, various degrees of wastewater treatment, and the relocation of communities from floodplain areas.
These actions nearly always harm low-income and vulnerable populations. Major redevelopment projects and property expansions often accompany restorative efforts. In addition to the Blue-Green Infrastructure and urban drainage networks (including wetlands, forested networks, breathable and soft landscapes, floodable open green spaces, and marshes), some towns also have physical disaster constraints (such as ditches, slopes, and retaining walls).
4.1 Waterways ecology and channelization of waterways
Typical ecological preservation ecosystems along the Lagos watershed corridors, including woodlands, waterways, and swamps, are currently being integrated with green and blue components, such as canal systems, stream gardens, sidewalk planting, and buffer areas, all within the urban area arrangement. Initially, environmental categories, including waterways, riparian zones, and floodplains, were recognized as essential ecological connectors, focused on safeguarding biological diversity but overlooking built environments. This indicates a shift from the widespread belief in land use policy that every region serves a particular purpose to the incorporation of blue–green–gray components on multiple scales, flexibility, and interconnectedness. While wetland vegetation helps to limit channels and recesses, which are abundant in Lagos' metropolitan domain, its deterioration is essential for the upkeep of hydrological reservoirs. Additionally, it helps preserve the ecology in urban regions. When implementing open spaces for the community, the presence of woodland creatures and dense growth is crucial, as it serves sustainable, aesthetic, and recreational purposes. Moreover, because it provides greenery and water-free areas, this particular type of greenery enhances the metropolitan area's visually appealing, effective, and ecological qualities. Given that many regions around rivers, lakes, and watersheds in Lagos lack basic urban infrastructure that permits people to access them for leisure use.
Reclaiming downtown communal areas, including creeks and swamps, has been made possible in large part by the organizing and engagement of citizens. This aligns with the ideas discussed in a study by Birhanu et al. (2023), which stated that the improvements in ecosystem connection, cross-scale cohesion, healthy water conservation, stream versatility, and collaborative leadership. Nowadays, flooding in urban areas is a problem everywhere, and Lagos is not a case in point. Due to centuries of land reclamation, stream management practices that reduce riparian zones, and increasing development, the city's green cover has decreased, resulting in flooding has become a regular occurrence. The majority of flood zones are found in reclaimed areas because neither of these areas evolves alongside genuine changing circumstances, such as constant surges of water, particularly elevated tide circumstances, or higher water levels.
4.2 Reduce environmental impacts
Lowering pollutants, strengthening infrastructure to maintain neighborhood wetlands more often, upgrading or replacing insufficient stormwater treatment systems, and locating and removing unauthorized (i.e., non-stormwater) connections to municipal stormwater systems. Decreasing impermeable surfaces, such as paved areas, particularly when wetlands, lakes, and rivers are present. Revisions to boundaries and subdivision laws can address problems, including decreasing the amount of impervious cover or lot responsibility, narrowing roads, promoting small-scale development and cluster housing, restricting land modifications, such as grading and clearing, and increasing construction setbacks from resources. Along waterbodies and wetland regions, suitable locations for corridor development, nature preserve acquisition, and the creation of landscaped hedges must be determined.
This study agrees with that of Chen X. et al. (2024), which reiterated that fostering restorations for malfunctioning drainage systems and expanding septic system servicing and inspections, determining additional suitable housekeeping measures for landowners and homeowners. Such as promoting the use of vegetated buffers next to wetland ecosystems and waterbodies, minimizing the size of lawns and the fertilizers and chemicals used on them, and suggesting that cars be washed on lawns rather than paths to allow rinse water to drain into the lawn rather than runoff into storm drains; determining the priorities for the rehabilitation of natural environments and resources; enhancing garbage disposal, prevention of pollution, and recycling initiatives at city waste establishments and companies that fall within the river basin; broadening and advocating open spaces and avenues for wildlife, and determining which location would be beneficial to do so; and determining and evaluating possibilities to implement biodiversity loss and flood risk reduction initiatives.
4.3 Geostatistics and spatial analysis workflow
The findings of this study are compared to those of urban studies to broaden the context and support the generalization of wetlands, canals, and waterways management (King and Caylor, 2011). The restoration of a naturally occurring purpose is given priority in the expanding regions, but there is little motivation to perform social and economic purposes. The installation of blue and green construction materials is still not given priority due to the economic significance of wetlands. It established the need for the landscape management and restoration strategies and models that provide rivers and their watersheds with several purposes have mainly kept developed cities, similar to Lagos's urban watercourses, single-purpose (Zhang et al., 2024; Zhou et al., 2023). Dávila-Hernández et al. (2022) affirm that this had little effect on the reintroduction of watercourses into the urban landscape or the expansion of the city's green spaces. Strategies for expanding cities and municipal plans have been the subject of many national and global studies and expert examination. The study revealed that, within the framework of global master planning standards, this research seeks to evaluate how effectively a city master plan fosters livable and resilient urban growth.
The study established that given the water movement within the watershed is dependent on geomorphological features, it is recommended that DEM-based hydrological studies define the resolution and the parametrization algorithms to verify the research's rigidity and enhance the estimation of high hydrological risk areas. Given that the water movement within the watershed is dependent on geomorphological features, it is recommended that DEM-based hydrological studies define the resolution and the parametrization algorithms to verify the research's rigidity and enhance the estimation of high hydrological risk areas. A thorough examination of the factors involved is necessary for hydrological cycle studies to fully comprehend the behavior of watersheds. A thorough examination of the urban development strategies outlined in Lagos State master plans is part of the study approach, with the subsequent research requirements kept in mind. The findings of this study further suggest that to better comprehend the cities' urban problems, the first step involves conducting a brief historical review of the growth patterns and dynamics of the cities (Asempah et al., 2024; Mateso et al., 2024). Upon closer inspection, we discover that the blueprints in Lagos are subject to regular upgrades and modifications roughly every 10 years, which means they are environmentally friendly. The methodological approach evaluated to what extent rivers and watercourses through the city, as essential elements of urban Green and Blue Infrastructure, figure in Lagos's regional authority's strategy. Which are community planning systems handling metropolitan river regeneration? What are the takeaways from the enhancement of rivers and resilient metropolitan forecasting? This choice provides important context for our evaluation and sheds light on the disparate planning strategies used around the city. To summarize and graphically depict the results of the DEM study of the terrain, a comparison table will be built in the last phase. Following a qualitative assessment of sample inquiries, a conceptual design of the elements impacting consumption was created. The geographic framework was then examined utilizing network design techniques.
5 Conclusion
Through an integrated assessment of Lagos metropolitan flood mitigation, urban revitalization, and river improvement, the URRIx was used to evaluate urban river improvement. Results from this study highlight a pertinent area for considering urban river restoration as a practical and beneficial strategy, even in delicate and complicated situations, despite its limitations. The urban design alternatives evaluated were constantly represented by the URRIx findings. According to the results, the option that used the river restoration strategy was the best one, as was theoretically anticipated given the index's primary nature. The study concludes that rivers were largely overlooked, as cities were the focal point of life in Lagos. There is a continual stream of new initiatives and regulations aimed at enhancing and reintegrating green and blue areas into cities. Lagos is emerging as the region's leader in this regard, with several river restoration initiatives in both big and small communities. Metropolitan, the regeneration of rivers is becoming increasingly common as a viable strategy for regaining certain natural processes lost due to development, reestablishing citizen connections with waterways, and creating sustainable and resilient cities.
The examination of the natural environment suggests a trend regarding imbalanced rehabilitation targets, with a preference for ecological connection, tourist places, and catastrophe mitigation, whereas purposes relating to social involvement, equity, and inclusion are generally overlooked. Given Lagos's history of ecological inequity and its susceptibility to extreme global warming, this is especially worrisome. To demonstrate that waterways in cities are widely acknowledged and taken into account in urban development, this study focused on a crucial municipal strategy: metropolis planning. Through territorial planning, catastrophe risk reduction, climate change adaptation, and community spaces, municipalities can now express and safeguard their natural environment with a crucial theoretical and procedural foundation, thanks to the foundational environmentally friendly framework. The following parties must be involved in local collaboration: local companies and industry leaders, landowners, federal, state, and local government representatives, floodplain organizations and other humanitarian and environmentalist organizations, agrarian users, developers, educators, and tourists. Along with identifying opportunities to reduce pollution or address other urgent environmental challenges, watershed management planning should also prioritize these possibilities and provide a timeline for implementing economic and ecosystem enhancements, as well as waste reduction.
The research concluded that increased awareness of the unforeseen occurrence of catastrophes in the backdrop of growing metropolitan Lagos, alongside other urban spaces, is the main goal of an urban-level investigation into watershed actions and metropolitan layout in the metropolis, employing spatial modeling to examine land improvement in vulnerable areas with heavy rainfall areas. Through simulations and geospatial research, the investigation establishes a link between the people (urban dwellers) and the flood patterns, offering recommendations regarding potential ecologically friendly adaptation measures for extremely dangerous regions. The primary objective is to create patterns for the restoration of regional drainage networks in the urban landscape that preserve ephemeral communal areas and freshwater vistas while minimizing the impact on residents. One of the primary goals of the concept is to create landscapes for managing torrential rains, which takes into account the terrain, existing facilities, and conventional water management sequences to avoid significant damage and casualties, enhance the quality of life of residents within outdoor open spaces, and promote sustainable urban ecosystems. Metropolitan policymakers, administrators, state institutional officials, landscape managers, and designers may find the study useful in implementing design ideas for current and future watersheds and river basin projects.
Data availability statement
The original contributions presented in the study are included in the article/Supplementary material, further inquiries can be directed to the corresponding authors.
Author contributions
JA: Software, Writing – original draft, Resources, Investigation, Writing – review & editing, Formal analysis, Methodology, Data curation, Visualization, Project administration, Conceptualization, Validation. XT: Funding acquisition, Writing – review & editing, Project administration, Validation, Supervision. YR: Writing – review & editing, Supervision, Project administration. HJ: Writing – review & editing, Software. WF: Writing – review & editing, Project administration. YZ: Project administration, Writing – review & editing, Funding acquisition.
Funding
The author(s) declare that no financial support was received for the research and/or publication of this article.
Conflict of interest
The authors declare that the research was conducted in the absence of any commercial or financial relationships that could be construed as a potential conflict of interest.
Generative AI statement
The author(s) declare that no Gen AI was used in the creation of this manuscript.
Any alternative text (alt text) provided alongside figures in this article has been generated by Frontiers with the support of artificial intelligence and reasonable efforts have been made to ensure accuracy, including review by the authors wherever possible. If you identify any issues, please contact us.
Publisher's note
All claims expressed in this article are solely those of the authors and do not necessarily represent those of their affiliated organizations, or those of the publisher, the editors and the reviewers. Any product that may be evaluated in this article, or claim that may be made by its manufacturer, is not guaranteed or endorsed by the publisher.
Supplementary material
The Supplementary Material for this article can be found online at: https://www.frontiersin.org/articles/10.3389/frsc.2025.1616421/full#supplementary-material
Footnotes
1. ^Google Maps (2024). Available online at: https://www.google.com/maps/place/Akoka (Accessed June 15, 2025).
References
Adeyemi, A. A., and Ayinde, M. O. (2022). Evaluation of land-use and land-cover changes in Oba Hills Forest Reserve, Osun State, Nigeria. Forestist 72:21039. doi: 10.5152/forestis.2022.21039
Alam, M., Khan, M. Z., Begum, F., and Baig, T. R. (2024). Assessing the climate vulnerability of mountain agriculture: a case study of Haramosh Valley in Central Karakoram, Pakistan. Environ. Dev. Sustain. 27, 18745–18773. doi: 10.1007/s10668-024-04636-z
Ali, J., Haoran, W., Mehmood, K., Hussain, W., Iftikhar, F., Shahzad, F., et al. (2025). Remote sensing and integration of machine learning algorithms for above-ground biomass estimation in Larix principis-rupprechtii Mayr plantations: a case study using Sentinel-2 and Landsat-9 data in northern China. Front. Environ. Sci. 13:1577298. doi: 10.3389/fenvs.2025.1577298
Aliyu, M. A., Maharazu, A. Y., Suleiman, K., and Lawan, B. Y. (2021). Biophysical mapping and land use attributes of kano ecosystems, North-western Nigeria. Bayero J. Pure Appl. Sci. 14, 115–124. doi: 10.4314/bajopas.v14i2.14
Amini Alaoui, K., Radoine, H., and Nahiduzzaman, K. M. (2024). Rural planning evaluation and sustainable development potential in rural communes of Rehamna province (Morocco). J. Urban Manage. 13, 624–638. doi: 10.1016/j.jum.2024.07.002
Asempah, M., Shisanya, C. A., and Schütt, B. (2024). Modeling of soil erosion risk in a typical tropical savannah landscape. Sci. Afr. 23:e02042. doi: 10.1016/j.sciaf.2023.e02042
Balgah, R. A., Ngwa, K. A., Buchenrieder, G. R., and Kimengsi, J. N. (2023). Impacts of floods on agriculture-dependent livelihoods in sub-Saharan Africa: an assessment from multiple geo-ecological zones. Land 12:334. doi: 10.3390/land12020334
Barbara, L. (2024). Resilience and the shift of paradigm in ecology: a new name for an old concept or a different explanatory tool? HPLS 46:2. doi: 10.1007/s40656-023-00600-8
Berhanu, A. A., Ayele, Z. B., Dagnew, D. C., Melese, T., Fenta, A. B., and Kassie, K. E. (2024). Smallholder farmers' vulnerability to climate change and variability: evidence from three agroecologies in the Upper Blue Nile, Ethiopia. Heliyon 10:e28277. doi: 10.1016/j.heliyon.2024.e28277
Birhanu, B. Z., Sanogo, K., Traore, S. S., Thai, M., and Kizito, F. (2023). Solar-based irrigation systems as a game changer to improve agricultural practices in sub-Saharan Africa: a case study from Mali. Front. Sustain. Food Syst. 7:1085335. doi: 10.3389/fsufs.2023.1085335
Chen, S., Wang, X., and Lin, Q. (2024). Spatial pattern characteristics and influencing factors of mountainous rural settlements in metropolitan fringe area: a case study of Pingnan County, Fujian Province. Heliyon 10:e26606. doi: 10.1016/j.heliyon.2024.e26606
Chen, X., Rong, F., and Li, S. (2024). Driving force–pressure–state–impact–response-based evaluation of rural human settlements' resilience and their influencing factors: evidence from Guangdong, China. Sustainability 16:813. doi: 10.3390/su16020813
Czyża, S., and Kowalczyk, A. M. (2024). Applying GIS in blue-green infrastructure design in urban areas for better life quality and climate resilience. Sustainability 16:5187. doi: 10.3390/su16125187
Dávila-Hernández, S., González-Trinidad, J., Júnez-Ferreira, H. E., Bautista-Capetillo, C. F., Morales de Ávila, H., Cázares Escareño, J., et al. (2022). Effects of the digital elevation model and hydrological processing algorithms on the geomorphological parameterization. Water 14:2363. doi: 10.3390/w14152363
Di Fazio, S., and Modica, G. (2018). Historic rural landscapes: sustainable planning strategies and action criteria. The Italian experience in the global and European context. Sustainability 10:3834. doi: 10.3390/su10113834
Duan, Y., Chen, S., Zhang, L., Wang, D., Liu, D., and Hou, Q. (2023). Spatial distribution characteristic and type classification of rural settlements: a case study of Weibei Plain, China. Sustainability 15:8736. doi: 10.3390/su15118736
Dube, T., Dube, T., and Marambanyika, T. (2023). A review of wetland vulnerability assessment and monitoring in semi-arid environments of sub-Saharan Africa. Phys. Chem. Earth Parts A/B/C 132:103473. doi: 10.1016/j.pce.2023.103473
Fasona, M. J., Akintuyi, A. O., Adeonipekun, P. A., Akoso, T. M., Udofia, S. K., Agboola, O. O., et al. (2022). Recent trends in land use and cover change and deforestation in southwest Nigeria. GeoJournal 87, 1411–1437. doi: 10.1007/s10708-020-10318-w
Faye, B., Du, G., Li, Q., Faye, H. V. M. T., Diéne, J. C., Mbaye, E., et al. (2024). Lessons learned from the influencing factors of forested areas' vulnerability under climatic change and human pressure in arid areas: a case study of the Thiès Region, Senegal. Appl. Sci. 14:2427. doi: 10.3390/app14062427
Fotsing Metegam, I. F., Bomeni, I. Y., Chara-Dackou, V. S., Njomo, D., and Tchinda, R. (2024). Assessment of the geographic and technical potential for large-scale wind energy production using a GIS-based MCDM-AHP multi-criteria analysis method and sensitivity analysis: case of Cameroon. Preprints. doi: 10.20944/preprints202402.0122.v1
Gatwaza, O. C., and Wang, X. (2023). Predicting the future of protected areas in the region of the highest population density in sub-Saharan Africa. J. Sustain. Forestry 42, 22–42. doi: 10.1080/10549811.2021.1933538
Giudice, B., Novarina, G., and Voghera, A. (2023). Green Infrastructure: Planning Strategies and Environmental Design. Springer Nature. Available online at: https://books.google.com/books?hl=enandlr=andid=WnjAEAAAQBAJandoi=fndandpg=PR5anddq=green+infrastructure%3B+resilience%3B+waterways%3B+watershed+planning%3B+ecological+degradation%3B+urban+designandots=jjESiFeTBwandsig=PQZ8s5-EHemeFm6TTUFcIfeZqs0 (Accessed January 10, 2025).
Gonçalves, C., and Pinho, P. (2025). The governance of the coastal region: evolutionary changes in the conceptualization and integration of landscape in Portuguese coastal planning institutions. Landsc. Ecol. 40:41. doi: 10.1007/s10980-025-02053-9
Greaves, C., Wei, X., and Parrott, L. (2025). Setting the limit for cumulative effects: a regional safe operating space for maintaining ecological resilience. Environ. Manage. doi: 10.1007/s00267-025-02122-4
Hannah, D. M., Wood, P. J., and Sadler, J. P. (2004). Ecohydrology and hydroecology: a ‘new paradigm'? Hydrol. Process. 18, 3439–3445. doi: 10.1002/hyp.5761
Herath, H. M. M. S. D., Fujino, T., and Senavirathna, M. D. H. J. (2023). A review of emerging scientific discussions on green infrastructure (GI)-prospects towards effective use of urban flood plains. Sustainability 15:1227. doi: 10.3390/su15021227
Isaac, O. O. O., Olufemi, A. B., Emmanuel, D., Adekunle, S. A., Nene, E. O. A., and Isioma, N. J. (2021). Dynamism of landscape transformation in Ibiono-Ibom, Akwa-Ibom State, Nigeria. J. Landsc. Ecol. 14, 19–38. doi: 10.2478/jlecol-2021-0002
Ishaku, A. R., Isah, A., Isa, M. S., Abdullahi, I., Umar, A. A., Mohammed, B. B., et al. (2021). GIS and remote sensing analysis of the impact of land use and land cover change on forest degradation: evidence from the Central Part of Taraba State, Nigeria. J. Geogr. Environ. Earth Sci. Int. 25, 27–39. doi: 10.9734/jgeesi/2021/v25i1130318
Janauer, G. A. (2000). Ecohydrology: fusing concepts and scales. Ecol. Eng. 16, 9–16. doi: 10.1016/S0925-8574(00)00072-0
Karkee, K., Gurung, S., and Joshi, A. (2022). “Assessing terrain hazards for sustainable human settlements in Chāngunārāyan municipality of Kathmandu Valley, Nepal,” in Nature, Society, and Marginality. Perspectives on Geographical Marginality, Vol. 8, eds. P. K. Pradhan and W. Leimgruber (Cham: Springer), 85–99. doi: 10.1007/978-3-031-21325-0_6
King, E. G., and Caylor, K. K. (2011). Ecohydrology in practice: strengths, conveniences, and opportunities. Ecohydrology 4, 608–612. doi: 10.1002/eco.248
Masruroh, H., Irawan, L. Y., and Anam, C. (2024). Comprehensive spatial analysis of landslide susceptibility modeling, spatial cluster analysis, and priority zoning for environmental analysis. Int. J. Environ. Sci. Technol. 22, 5555–5576. doi: 10.1007/s13762-024-05950-9
Mateso, J. C. M., Dewitte, O., and Bielders, C. L. (2024). Living with landslides: land use on unstable hillslopes in a rural tropical mountainous environment in DR Congo. Sci. Total Environ. 925:171624. doi: 10.1016/j.scitotenv.2024.171624
Miller, C. (2023). Planning for long-term sustainability: addressing the downfalls of green infrastructure planning (Master's thesis, Vancouver Island University). Available online at: https://www.proquest.com/openview/688ecd956fbd9615adaac4992da3f6b5/1?pq-origsite=gscholarandcbl=18750anddiss=y (Accessed January 10, 2025).
Mshelia, Z. H., Nyam, Y. S., Moisès, D. J., and Belle, J. A. (2024). Geospatial analysis of flood risk hazard in Zambezi Region, Namibia. Environ. Challenges 15:100915. doi: 10.1016/j.envc.2024.100915
Munyaka, J.-C. B., Chenal, J., de Roulet, P. T. H., Mandal, A. K., Pudasaini, U., and Otieno, N. O. (2023). Multi-level participatory GIS framework to assess mobility needs and transport barriers in rural areas: a case study of rural Mumias East, a Sub-County of Kakamega, Kenya. Sustainability 15:9344. doi: 10.3390/su15129344
Munyaka, J.-C. B., Chenal, J., Mabaso, S., Tfwala, S. S., and Mandal, A. K. (2024). Geospatial tools and remote sensing strategies for timely humanitarian response: a case study on drought monitoring in Eswatini. Sustainability 16:409. doi: 10.3390/su16010409
Mwalwimba, K. I., Manda, M., and Ngongondo, C. (2024). Towards a framework for flood vulnerability assessment for rural and urban informal settlements in Malawi. J. Geogr. Nat. Disasters 14:305. doi: 10.21203/rs.3.rs-2757046/v1
Odoh, B. I., Nwokeabia, C. N., and Ezealaji, P. I. (2024). Integrated geological and geomorphological analysis for sustainable land use planning in the Abia Region of southeastern Nigeria. Int. J. Sci. Res. Arch. 12, 1526–1538. doi: 10.30574/ijsra.2024.12.2.1420
Ojeh, V. N., Yusha'u, A. M., and Usman, D. S. (2022). Assessment of changes in land cover by deforestation in Kurmi LGA, Taraba State, Nigeria using remote sensing/geographic information system. Aswan Univ. J. Environ. Stud. 3, 67–87. doi: 10.21608/aujes.2022.114556.1055
Ojo, A. O., Ojo, M. A., Ajani, Y. O., Oseghale, A. I., and Busari, A. O. (2022). Assessment of Effects of Land Degradation on Productivity of Arable Crop Farmers in Selected Local Government Areas of Ogun State, Nigeria. Available online at: http://repository.rjt.ac.lk/handle/123456789/4820 (Accessed January 10, 2025).
Okonkwo, C. C., Chukwuma, E. C., Orakwe, L. C., and Okafor, G. C. (2023). Geospatial-based analysis for soil erosion susceptibility evaluation: application of a hybrid decision model. Model. Earth Syst. Environ. 9, 987–1007. doi: 10.1007/s40808-022-01527-y
Olden, J. D., Kennard, M. J., and Pusey, B. J. (2012). A framework for hydrologic classification with a review of methodologies and applications in ecohydrology. Ecohydrology 5, 503–518. doi: 10.1002/eco.251
Omanga, A. M., Sichangi, A. W., Makokha, G. O., and Waswa, R. N. (2024). Assessing the Effect of Change in Climate and Land Use on Groundwater Recharge Suitability in the Thiba River Sub Basin, Kenya. doi: 10.21203/rs.3.rs-4432589/v1
Rinaldo, A., and Rodriguez-Iturbe, I. (2022). Ecohydrology 2.0. Rend. Lincei Sci. Fis. Nat. 33, 245–270. doi: 10.1007/s12210-022-01071-y
Sarfo, I., Qiao, J., Yeboah, E., Puplampu, D. A., Kwang, C., Fynn, I. E. M., et al. (2024). Meta-analysis of land use systems development in Africa: trajectories, implications, adaptive capacity, and future dynamics. Land Use Policy 144:107261. doi: 10.1016/j.landusepol.2024.107261
Seun, A. I., Ayodele, A. P., Koji, D., and Akande, S. O. (2022). The potential impact of increased urbanization on land surface temperature over South-West Nigeria. Curr. Res. Environ. Sustain. 4:100142. doi: 10.1016/j.crsust.2022.100142
Singh, R. G. (2024). A multi-scale study of wind erosion susceptibility along the South African Wild Coast. Dissertation presented in fulfillment of the requirements for the degree of Doctor of Philosophy in the Faculty of Science at Stellenbosch University. Available online at: https://scholar.sun.ac.za/server/api/core/bitstreams/eb55c9f8-24a7-483d-b449-836f36f18a6e/content (Accessed January 10, 2025).
Tang, X., and Adesina, J. A. (2022a). Biodiversity conservation of national parks and nature-protected areas in West Africa: the case of Kainji National Park, Nigeria. Sustainability 14:7322. doi: 10.3390/su14127322
Tang, X., and Adesina, J. A. (2022b). Integrated watershed management framework and groundwater resources in Africa—a review of West Africa Sub-Region. Water 14:288. doi: 10.3390/w14030288
Veról, A. P., Bigate Lourenço, I., Fraga, J. P. R., Battemarco, B. P., Linares Merlo, M., Canedo de Magalhães, P., et al. (2020). River restoration integrated with sustainable urban water management for resilient cities. Sustainability 12:4677. doi: 10.3390/su12114677
Xie, H., Sun, Q., and Song, W. (2024). Exploring the ecological effects of rural land use changes: a bibliometric overview. Land 13:303. doi: 10.3390/land13030303
Yessoufou, A. N. D., Kumar, S., Houessionon, P., Worou, O. N., Wane, A., and Whitbread, A. (2024). Vulnerability and resilience in the face of climate change in Senegal's drylands: measurement at the household level and determinant assessment. Front. Clim. 6:1330025. doi: 10.3389/fclim.2024.1330025
Zehang, W., Jianwei, S., Liu, Y., Jing, L., and Qiuyu, Z. (2024). Vulnerability and influencing factors for rural settlements' land use in karst mountains of China: a case study on Qixingguan District. J. Resourc. Ecol. 15, 720–732. doi: 10.5814/j.issn.1674-764x.2024.03.018
Zhang, X., Li, J., and Xu, J. (2024). Micro-scale analysis and optimization of rural settlement spatial patterns: a case study of Huanglong Town, Dayu County. Land 13:966. doi: 10.3390/land13070966
Zhen, Y., Liu, S., Zhong, G., Zhou, Z., Liang, J., Zheng, W., et al. (2022). Risk assessment of flash flood to buildings using an indicator-based methodology: a case study of mountainous rural settlements in Southwest China. Front. Environ. Sci. 10:931029. doi: 10.3389/fenvs.2022.931029
Zhou, L., Zhao, Y., Yang, X., He, J., and Wang, H. (2023). Identification of important terraced visual landscapes based on a sensitivity-subjectivity preference matrix for agricultural cultural heritage in southwestern China. Ecol. Indic. 154:110573. doi: 10.1016/j.ecolind.2023.110573
Zhu, S., Sun, J., Wu, Y., Lu, Q., Ke, Y., Xue, Z., et al. (2024). Vertical spatial differentiation and influencing factors of rural livelihood resilience: evidence from the mountainous areas of Southwest China. Agriculture 14:1295. doi: 10.3390/agriculture14081295
Keywords: flood plain, urban green infrastructure, urban design, watershed management, wetlands
Citation: Adesina JA, Tang X, Ren Y, Jiang H, Fuh WN and Zhang Y (2025) Ecohydrological assessment of densely canalized urban waterways for ecological reconnection and landscape restoration in Lagos metropolis: nexus for human–nature connectivity. Front. Sustain. Cities 7:1616421. doi: 10.3389/frsc.2025.1616421
Received: 22 April 2025; Accepted: 28 August 2025;
Published: 02 October 2025.
Edited by:
Michael Nones, Polish Academy of Sciences, PolandReviewed by:
Sebastián Valencia, Universidad Católica de Santa María, PeruFadly H. Yusran, Universitas Lambung Mangkurat Fakultas Pertanian, Indonesia
Carlos Sanchez-Carigga, Universidad Católica de Santa María, Peru
Copyright © 2025 Adesina, Tang, Ren, Jiang, Fuh and Zhang. This is an open-access article distributed under the terms of the Creative Commons Attribution License (CC BY). The use, distribution or reproduction in other forums is permitted, provided the original author(s) and the copyright owner(s) are credited and that the original publication in this journal is cited, in accordance with accepted academic practice. No use, distribution or reproduction is permitted which does not comply with these terms.
*Correspondence: Xiaolan Tang, eGlhb2xhbnRAbmpmdS5lZHUuY24=