Abstract
Addressing global climate change and advancing sustainable development necessitates bolstering urban green technology innovation, since cities are the main source of energy consumption and carbon emissions. This study focuses on China’s Fuel Cell Vehicle Demonstration policy to explore its influences on urban green technology innovation performance. By employing a quasi-natural experimental method and the Difference-in-Differences model, combined with data from 283 Chinese cities from 2014 to 2023, this paper provides an in-depth analysis of the impact of the policy on urban green technology innovation. It was found that the policy significantly enhances urban green technology innovation in demonstration cities. Heterogeneity analysis reveals that the policy exerts a more pronounced effect on promoting urban green technology innovation in cities in eastern China and non-resource-based cities. Spatial analysis indicates that the policy exhibits a positive spatial spillover effect on urban green technology innovation in neighboring cities. However, a siphon effect was also observed between urban green technology innovation levels across them. The study recommends that central authorities tailor strategies to cities’ geographic and resource profiles. It also recommends establishing intercity collaboration platforms and innovation resource compensation mechanisms. These measures aim to mitigate regional disparities and siphon effects, ensuring inclusive green technology development. These findings provide actionable insights for China’s national development strategy for the fuel cell vehicle industry and global low-carbon transportation transitions.
1 Introduction
The global imperative to mitigate climate change has intensified the urgency for decarbonization across all economic sectors. The transportation sector accounts for approximately 15% of global greenhouse gas emissions (Statista, 2025). As nations strive to meet the Paris Agreement’s 1.5 °C target, the transportation sector—now the second-largest source of global greenhouse gas emissions—has emerged as a focal point for systemic transformation. According to the Emissions Gap Report released by the United Nations Environment Programme (2024) (UNEP), 42% of greenhouse gases will be cut by 2030 and 57% by 2035 to get on track for the Paris Agreement’s 1.5 °C goal. This underscores the need for a quicker transition to low-carbon transportation, necessitating unprecedented innovation acceleration in green mobility solutions.
Boosting innovation is considered a priority action to prepare for the next phase of the transition. Clean energy innovation must accelerate rapidly, with governments putting research and design (R&D), demonstration, and deployment at the core of energy and climate policy (International Energy Agency, 2021). Such innovation gaps are particularly acute in heavy-duty transport, where hydrogen fuel cell vehicles (FCVs) emerge as critical for decarbonizing long-haul freight and energy-intensive logistics (Intergovernmental Panel on Climate Change, 2023). Consequently, FCVs have been elevated to the strategic priority status in national climate agendas. Major economies have enacted policy instruments positioning innovation as a cornerstone pathway to advance hydrogen transportation development. China, the world’s largest carbon emitter, has positioned green transportation at the core of its dual-carbon strategy. When compared with developed economies, China continues to exhibit disparities in the depth and quality of innovation, as well as in achieving breakthroughs in critical core technologies. The enabling role of green technologies requires systematic enhancement to meet evolving sustainability demands (Luo, 2023). As China continues to shift to a green development model, its technological innovation capabilities can bring about changes in the economic and social structure and promote endogenous economic growth (Aghion et al., 2015), thereby driving the level of green development (Bai et al., 2024).
The Fuel Cell Vehicle Demonstration (FCVD) policy is a crucial initiative by the Chinese government to promote green and low-carbon transportation transformation. Departing from the conventional subsidy-driven policy framework (2009–2022) historically employed by the Chinese government to bolster the electric vehicle industry, the FCVD policy innovatively introduced a “performance-based incentives” framework to propel the development of the fuel cell vehicle industry. In 2021, the demonstration areas were jointly initiated by five units of the People’s Republic of China. These units include the Ministry of Finance, Ministry of Industry and Information Technology, Ministry of Science and Technology, National Development and Reform Commission, and National Energy Administration. The demonstration areas encompass three direct-controlled municipalities and 35 prefecture-level cities. The geographical distribution of demonstration cities is displayed in Figure 1. Extant literature predominantly focuses on low-carbon pilot policy (Wang and Chu, 2024; Zhao et al., 2025), new energy demonstration policy (Hu and Xu, 2025), and renewable energy policies (Wu et al., 2023; Zha et al., 2023), with scarce research on the hydrogen fuel cell vehicle demonstration program and limited empirical assessments of its effectiveness. Given the FCVD initiative has been in effect for a considerable period and datasets are now available, this study addresses the following questions: Within China’s green transition trajectory, does the establishment of FCVD areas effectively elevate urban green technology innovation (UGTI) capacity? Do heterogeneous impacts emerge in UGTI from such initiatives across cities with divergent geographical positioning and resource endowments? Furthermore, what spatial spillover mechanisms, if any, characterize the policy and the UGTI development? To systematically investigate these questions, we conduct a quasi-experimental analysis of panel data covering 283 Chinese cities from 2014 to 2023 by employing a Difference-in-Differences (DID) model, Spatial Durbin Difference-in-Differences model (SDM-DID) and heterogeneity analysis, rigorously evaluating both the direct innovation-enhancing effects of demonstration policy implementation and the cross-regional spillover effects.
Figure 1
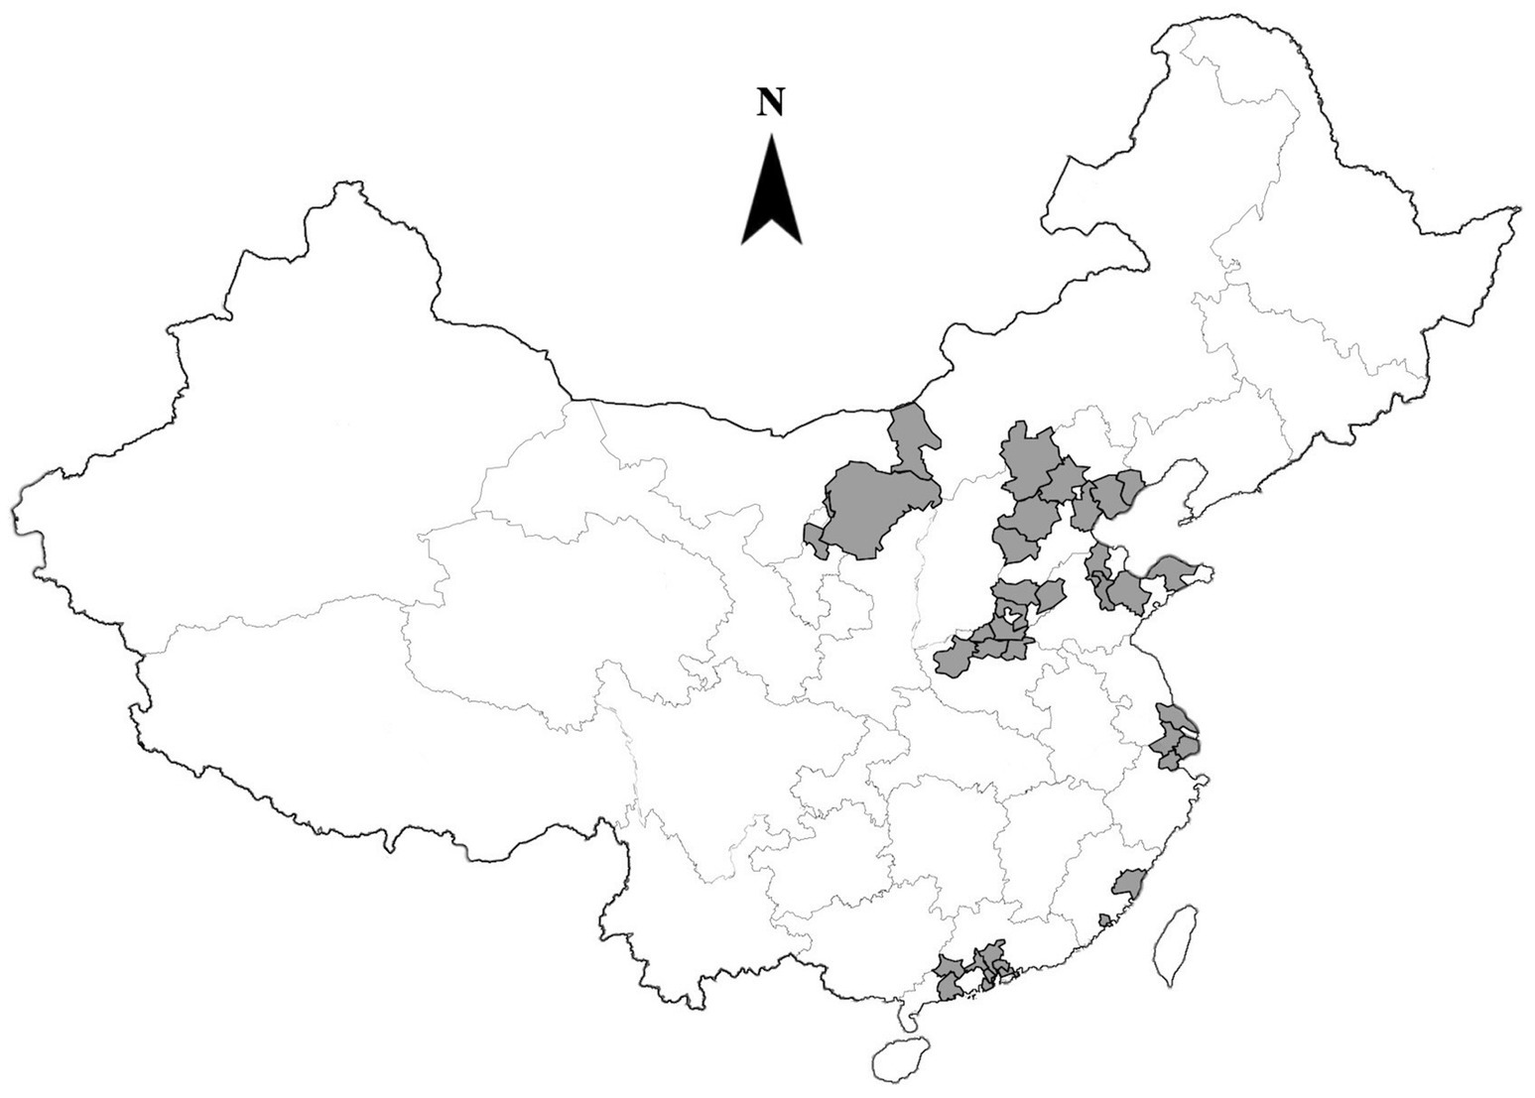
Geographical distribution of the demonstration cities.
2 Research hypotheses
Environmental regulations play a significant role in promoting green innovation and industrial green development (Peng et al., 2021; Zhang, 2022). Existing studies reveal that energy transition policies can promote urban green innovation through multiple pathways, including enhancing green total factor productivity, rectifying land-use inefficiencies, alleviating resource dependence (He, 2025), and industry evolution (Yu et al., 2024). As a pivotal policy instrument to advance fuel cell vehicle industry development, the FCVD initiative, particularly, aims to stimulate breakthroughs in core technologies and foster the adoption of hydrogen fuel cell vehicles. Through its performance-based incentives, this framework mobilizes demonstration cities to prioritize and intensify R&D investments and scale pilot deployments. It drives the adoption of cutting-edge technologies and materials and catalyzes green innovation across industrial supply chains. By integrating technological advancement with market-driven experimentation, the policy can establish a synergistic ecosystem for low-carbon transitions. In light of this, this paper proposes:
Hypothesis 1: The FCVD policy effectively stimulates UGTI.
China boasts a vast expanse, with substantial disparities prevailing across its regions in terms of geographical and natural conditions, economic development levels, degree of international openness, and historical development trajectories (Pan et al., 2022). The spatial distribution of FCVD cities is quite uneven, with 27 located in the eastern region (accounting for 71.1% of total FCVD cities), 7 in the central region (18.4%), and 4 in the western region (10.5%). Studies demonstrated that the location of pilot programs directly affects the success of reforms (Heilmann, 2008; Wang and Yang, 2021). Given the inherent technical complexities, capital-intensive requirements, and multidisciplinary nature of fuel cell technology development, advanced R&D infrastructure and highly specialized professionals become particularly imperative. The eastern region demonstrates significant advantages over the central and western regions in industrial green transformation, macroeconomic growth, a higher-skilled workforce, and transportation convenience (Lyu et al., 2019), which collectively contribute to its substantially stronger technological innovation capabilities. In light of this, this paper proposes:
Hypothesis 2a: FCVD policy exhibits a stronger innovation stimulation effect in cities in eastern China compared to cities in the central and western regions.
The trajectory of urban low-carbon transformation is influenced by the dynamic changes in urban resource endowments (Liu et al., 2024), a principle that equally governs the strategic deployment of fuel cell technologies as critical enablers in this process. Resource-based cities serve as crucial strategic hubs for China’s energy and resource reserves. Historically reliant on extracting and processing abundant natural resources, these cities have developed a characteristic high-carbon development pattern (Wang et al., 2025). This dependence ultimately hinders sustainable economic growth. The transformation towards the green development pattern becomes imminent (Cong et al., 2019). In contrast, non-resource-based cities exhibit a greater capacity to overcome the lock-in effects of energy infrastructure owing to their diversified economic structures and reduced reliance on traditional resources (Guo and Yu, 2024). The economic development of these cities is primarily driven by emerging industrial policies. This dynamic enables swift responses to policy incentives and facilitates effective integration of innovative technologies across multiple sectors (Liu et al., 2024). In light of this, this paper proposes:
Hypothesis 2b: FCVD policy exhibits a stronger innovation stimulation effect in cities in non-resource-based cities compared to resource-based cities.
Geographical context plays a significant role in determining the factors affecting regional innovation (Xiao et al., 2024). Empirical studies (Chen et al., 2023; Shang et al., 2022; Ma et al., 2024) established that urban pilot and demonstration policies targeting advanced technology development generate significant spatial spillover effects on urban green innovation in China. First, demonstration regions adopting advanced fuel cell technologies and innovative practices can create demonstration effects. Neighboring regions can subsequently learn from and emulate these effects. Second, policy incentives and market mechanisms in demonstration regions can stimulate the adoption of green innovations, thereby facilitating the development of sustainable industrial ecosystems. Such dynamics compel enterprises in non-demonstration regions to undertake technological modernization through environmentally conscious production methodologies. Third, policy can heighten social awareness of green technology adoption for sustainable transitions in demonstration regions. This also stimulates greater environmental protection focus in surrounding regions and inspires them to adopt eco-friendly lifestyles. In light of this, this paper proposes:
Hypothesis 3: The FCVD policy will generate a positive spillover effect on UGTI in non-demonstration areas.
3 Research design
3.1 Model establishment
3.1.1 Benchmark regression model
We employs a quasi-natural experiment (QNE) approach with a DID model to rigorously assess the impact of China’s FCVD policy on UGTI. The core concept of this methodology centers on treating new policy introductions as a “quasi-natural experiment” exogenous to the economic system (Baker et al., 2022). The QNE leverages the exogenous variation and mitigates endogeneity risks by treating policy implementation as a quasi-random event, allowing for a credible assessment of causality. The DID model complements this design by explicitly controlling for time-invariant heterogeneity and common time trends through the double differencing mechanism. The DID model is particularly appealing for addressing the challenge of using observational data to assess policy intervention effectiveness when randomized controlled trials are infeasible. Additionally, the DID model demonstrates robustness even with limited observations. Unlike parametric models sensitive to sample size, the DID model relies on the parallel trends assumption, which can be validated through pre-treatment period tests (Angrist and Pischke, 2009). In this study, the 38 demonstration cities and 245 control cities provide sufficient variation to detect policy effects while maintaining statistical power, especially when combined with fixed effects to absorb unobserved heterogeneity. In combination, this integrated framework offers a methodologically robust approach to establishing causal identification in the evaluation of FCVD policy. The specific model is as follows:
where, i and t represent cities and years, respectively; GIPGit (green invention patent grants) represents the number of green invention patent grants of the city i in the year t. If city i is a demonstration city in year t, then didit = 1; otherwise, didit = 0. Thus, the didit is the core explanatory variable in this study. Controlit represents the control variable set. μi is the city-related fixed effect; γt is the time-related fixed effect. εit represents the random error. This research focuses on the positive and negative direction of coefficient α1 and its significance.
3.1.2 Spatial DID model
According to Hypothesis 3, the FCVD policy not only affects demonstration cities but also generates effects across neighboring regions, indicating the presence of spatial spillover effects. Following the hierarchical testing principle in spatial econometrics (Elhorst, 2014; LeSage and Pace, 2009) and empirical studies (Lee et al., 2022; Dian et al., 2024), we prioritize the SDM-DID to further examine the spatial effect of FCVD policy in this context.
where, ω is a geospatial weight matrix generated from latitude and longitude distances; ρ is the spatial autocorrelation coefficient of the dependent variable; α2 is the policy spillover effect; and β2 is the spillover effect of the control variable.
This paper verifies the model selection by conducting the Likelihood Ratio (LR) and the Wald tests to ensure its reasonableness. The results of both tests reject the null hypothesis, which indicates that the SDM does not deteriorate into the Spatial Lag Model (SLM) or the Spatial Error Model (SEM). The Hausman test is used to ascertain if it applies to fixed or random effects.
3.1.3 Spatial weight matrix
This study draws on Feng and Li (2021) and Wang et al. (2023) to adopt the inverse distance matrix for spatial measurement analysis. The inverse distance matrix is:
where , dij stands for the straight-line distance between city i and j, and the main diagonal elements are all 0. We compute inter-city distances using latitude and longitude data from China’s National Basic Geographic Information System. The matrix is standardized in the regression analysis.
3.2 Variable definition
3.2.1 The dependent variable and independent variable
Based on the existing literature, the number of GIPG intuitively quantifies the performance of green innovation. Green invention patent grants refer to the legally conferred invention patents in environmentally sustainable technologies, as classified by International Patent Classification (IPC) codes aligned with the World Intellectual Property Organization (WIPO) Green Inventory. Hence, city-level GIPG serves as the dependent variable. The independent variable did captures the implementation of the FCVD policy. The dummy variable did equals 1 if a city i was designated as an FCVD demonstration area in a given year t, and 0 otherwise. Specifically, did represents a Difference-in-Differences indicator we created, constituting an interaction between the treatment variable “Treated” and before/after variable “Post.” The treatment variable “Treated” is a dummy variable equal to 1 for the treatment group and 0 for the control group. The treatment group comprises the 38 demonstration cities designated by China’s central government, whereas the control group includes the remaining 245 cities in the sample. The before/after variable “Post” is a dummy variable equal to 1 for 2021–2023 (policy implementation period) and 0 otherwise. The variable did is central to our quasi-experimental design, as its coefficient represents the treatment effect of FCVD policy on UGTI.
3.2.2 Control variable
In addition to policy variables, the city’s investment in innovation system construction, government support, and regional economic and social development level will also affect the optimal allocation of green innovation resources. Thus, we select the following as control variables:
Economic development level (econ) is measured using the natural logarithm of per capita GDP at the city level.
Government fiscal pressure (fis) is assessed by the fiscal deficit/surplus at the city level.
Government investment in science and technology (sci) is measured by the proportion of government science and technology fiscal expenditure to local GDP at the city level.
Level of Industrialization (industry) is assessed by the proportion of added value of the secondary industry to local GDP at the city level.
Financing capacity (fin) is demonstrated by the ratio of year-end RMB-denominated total deposit and loan balances held by financial institutions to local GDP at the city level.
Information technology development level (info) is indicated by the ratio of the volume of post and telecommunications services at the end of the year to local GDP at the city level.
Government investment in energy conservation and efficiency (eco) is measured by the government expenditure on energy conservation and efficiency to local GDP at the province level.
Human capital accumulation (human) is measured by the ratio of enrolled students in regular higher education institutions to the year-end resident population at the province level.
Economic openness (open) is indicated by the ratio of foreign direct investment to local GDP at the province level.
3.3 Sample selection and data sources
This study utilized panel data from 283 Chinese cities spanning 2014–2023. Within this sample, 38 cities participated in the Fuel Cell Vehicle Demonstration (FCVD) program during its implementation phase (2021–2023). These 38 cities constitute the treatment group, while the remaining 245 cities serve as the control group. When specific districts or zones were designated FCVD areas, the entire city was adopted as the observational unit given the economic significance of these zones and the use of municipal-level data. Cities in less developed regions (e.g., Xizang Autonomous Region and Xinjiang Uygur Autonomous Regions) were excluded due to severe data limitations. Data were sourced from China City Statistical Yearbook, China Statistical Yearbook, and the China National Intellectual Property Administration database. Table 1 presents descriptive statistics for all variables.
Table 1
| Variable | Count | Mean | S.D. | Min | Max |
|---|---|---|---|---|---|
| GIPG | 2,830 | 0.1337 | 0.5289 | 0 | 11.7600 |
| did | 2,830 | 0.0403 | 0.1967 | 0 | 1 |
| econ | 2,830 | 1.7028 | 0.5298 | 0.0170 | 3.2760 |
| fis | 2,830 | 2.3705 | 2.1177 | −1.6728 | 28.6379 |
| info | 2,830 | 0.5807 | 0.7259 | 0.0253 | 13.5697 |
| sci | 2,830 | 0.0186 | 0.0196 | 0.0005 | 0.2068 |
| industry | 2,830 | 0.4250 | 0.1056 | 0.1068 | 0.7553 |
| fin | 2,830 | 2.8068 | 1.2729 | 0.7167 | 21.3015 |
| eco | 2,830 | 0.0065 | 0.0037 | 0.0019 | 0.0434 |
| human | 2,830 | 0.0221 | 0.0046 | 0.0092 | 0.0437 |
| open | 2,830 | 0.6548 | 3.2174 | 0.0503 | 91.4019 |
Summary statistics.
4 Empirical results
4.1 Benchmark regression results
The empirical analysis begins by estimating the impact of the FCVD policy on UGTI using the baseline model outlined in Equation 1. To systematically isolate the policy’s causal effect, the regression framework progressively introduces control variables and fixed effects. In Table 2, Columns (1) and (2) present initial estimates without control variables, isolating the raw association between the FCVD policy (did) and UGTI. Column (1) employs a simple regression structure, while Column (2) incorporates city-fixed effect and year-fixed effect to account for unobserved heterogeneity across regions and temporal trends. Column (3) builds on this foundation by introducing a comprehensive set of control variables to mitigate potential confounding bias. This incremental approach ensures robustness, as the coefficient of did remains statistically significant (at the 5% level). Further refinement is applied in Column (4), which adds city-year interactive terms (specifically, interactions between city dummies and linear time trends) to control for heterogeneous time trends specific to individual cities. This specification addresses concerns that pre-existing divergent growth trajectories between treated and control cities might distort policy effect estimates. Compared with the non-demonstration cities, policy implementation enhanced the UGTI of the demonstration cities by 0.2237. Across all columns, the coefficient of did consistently demonstrates a positive and statistically significant relationship (p < 0.05), confirming that the FCVD policy robustly stimulates UGTI in demonstration cities. These results validate Hypothesis 1 and underscore the policy’s effectiveness as a catalyst for green innovation.
Table 2
| Variable | (1) | (2) | (3) | (4) |
|---|---|---|---|---|
| GIPG | GIPG | GIPG | GIPG | |
| did | 0.7146** | 0.4203** | 0.3345** | 0.2237** |
| (2.4954) | (2.3839) | (2.2129) | (2.2294) | |
| econ | −0.1067 | −0.0882** | ||
| (−1.2339) | (−2.2244) | |||
| fis | 0.1037*** | −0.0305 | ||
| (3.4785) | (−1.2340) | |||
| info | −0.0070 | −0.0201 | ||
| (−0.4026) | (−1.3661) | |||
| sci | 2.8850*** | −1.3291* | ||
| (3.1225) | (−1.6829) | |||
| industry | −0.1005 | −0.0670 | ||
| (−0.4785) | (−0.7038) | |||
| fin | −0.0008 | 0.0045 | ||
| (−0.1055) | (1.0697) | |||
| eco | −8.9632 | 4.7703 | ||
| (−0.8183) | (1.5850) | |||
| human | −40.9529** | −2.4167 | ||
| (−2.3282) | (−0.4984) | |||
| open | −0.0013 | −0.0004 | ||
| (−0.9411) | (−0.4581) | |||
| Constant | 0.1049*** | 0.1168*** | 1.0143*** | 0.4219*** |
| (5.8206) | (16.4442) | (2.8056) | (3.0963) | |
| Observations | 2,830 | 2,830 | 2,830 | 2,830 |
| R-squared | 0.071 | 0.812 | 0.840 | 0.968 |
| City FE | No | Yes | Yes | Yes |
| Year FE | No | Yes | Yes | Yes |
| City × Year FE | No | No | No | Yes |
Benchmark regression results.
t statistics are shown in parentheses; ***, **, and * represent significance at the 1, 5, and 10% levels, respectively.
4.2 Robustness tests
4.2.1 Parallel trend test
The use of the DID model requires meeting the parallel trends assumption to ensure the unbiasedness of the estimates. In the benchmark model, the parallel trends assumption assumes that before the implementation of the FCVD policy, the GIPG of both demonstration cities and non-demonstration cities were largely consistent over time. The breaking of parallel trends between the treatment group and the control group after the implementation of the FCVD policy indicates a trend change in UGTI of demonstration cities compared to non-demonstration cities. The first year is designated as the base year in the regression, and Figure 2 is generated using the regression results. As shown in Figure 2, with the horizontal axis at 0 representing the first year of policy implementation, the coefficient estimates of key explanatory variable did for all periods before the FCVD policy are not statistically significant. This suggests that before the implementation, there were no significant differences in the changes in UGTI between the experimental and control group cities, and the research sample passes the parallel trends test.” Furthermore, starting from the policy’s first implementation year, the FCVD policy significantly stimulated UGTI in participating cities. As the demonstration period extended, the policy impact progressively intensified.
Figure 2
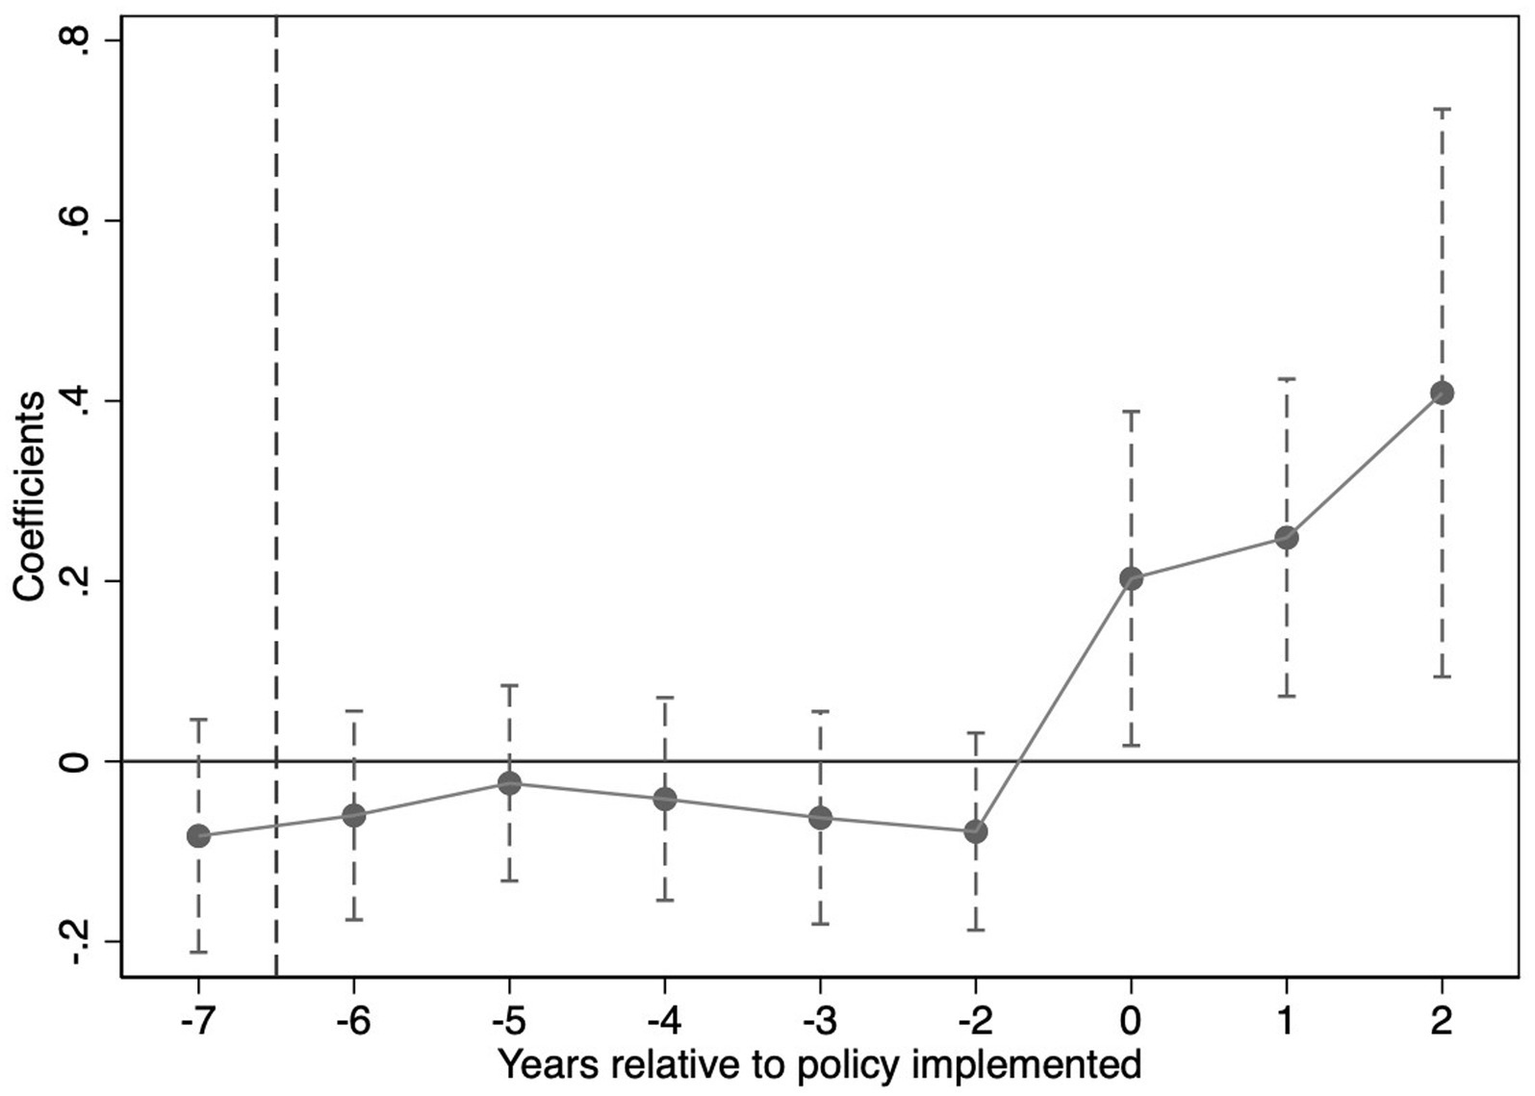
Parallel trend test for GIPG.
However, the latest DID theoretical literature indicates that pre-treatment trend tests cannot serve as effective empirical evidence for the parallel trend assumption. Traditional pre-treatment trend tests have low statistical power and may distort estimates and inferences. To address this limitation, Rambachan and Roth (2023) developed a sensitivity analysis framework for violations of the parallel trend assumption. This framework involves conducting a sensitivity analysis of the post-treatment point estimates and confidence intervals. Specifically, the test comprises two parts: (a) constructing the maximum degree of deviation from the parallel trends assumption (Mbar), and (b) constructing the confidence interval of the post-treatment point estimate corresponding to this degree of deviation. The confidence interval of the post-treatment point estimate does not include zero under the scenario of maximum deviation, which suggests that the treatment effect is robust to deviations from the parallel trend assumption. Following the approach of Biasi and Sarsons (2022), this paper sets the maximum deviation Mbar = 1 × standard error, to test the sensitivity of the treatment effect to parallel trends following the implementation of the policy. Panel (A) and panel (B) in Figure 3 present sensitivity analysis results for the treatment effect in the first policy year under bounding relative magnitudes and smoothness restrictions, respectively. The analysis demonstrates robust parallel trends in both specifications. Even at 60% pre-treatment trend bias under smoothness restrictions, the policy effect remains statistically significant in the implementation year. The results indicate that FCVD significantly boosts UGTI despite potential parallel trend violations.
Figure 3
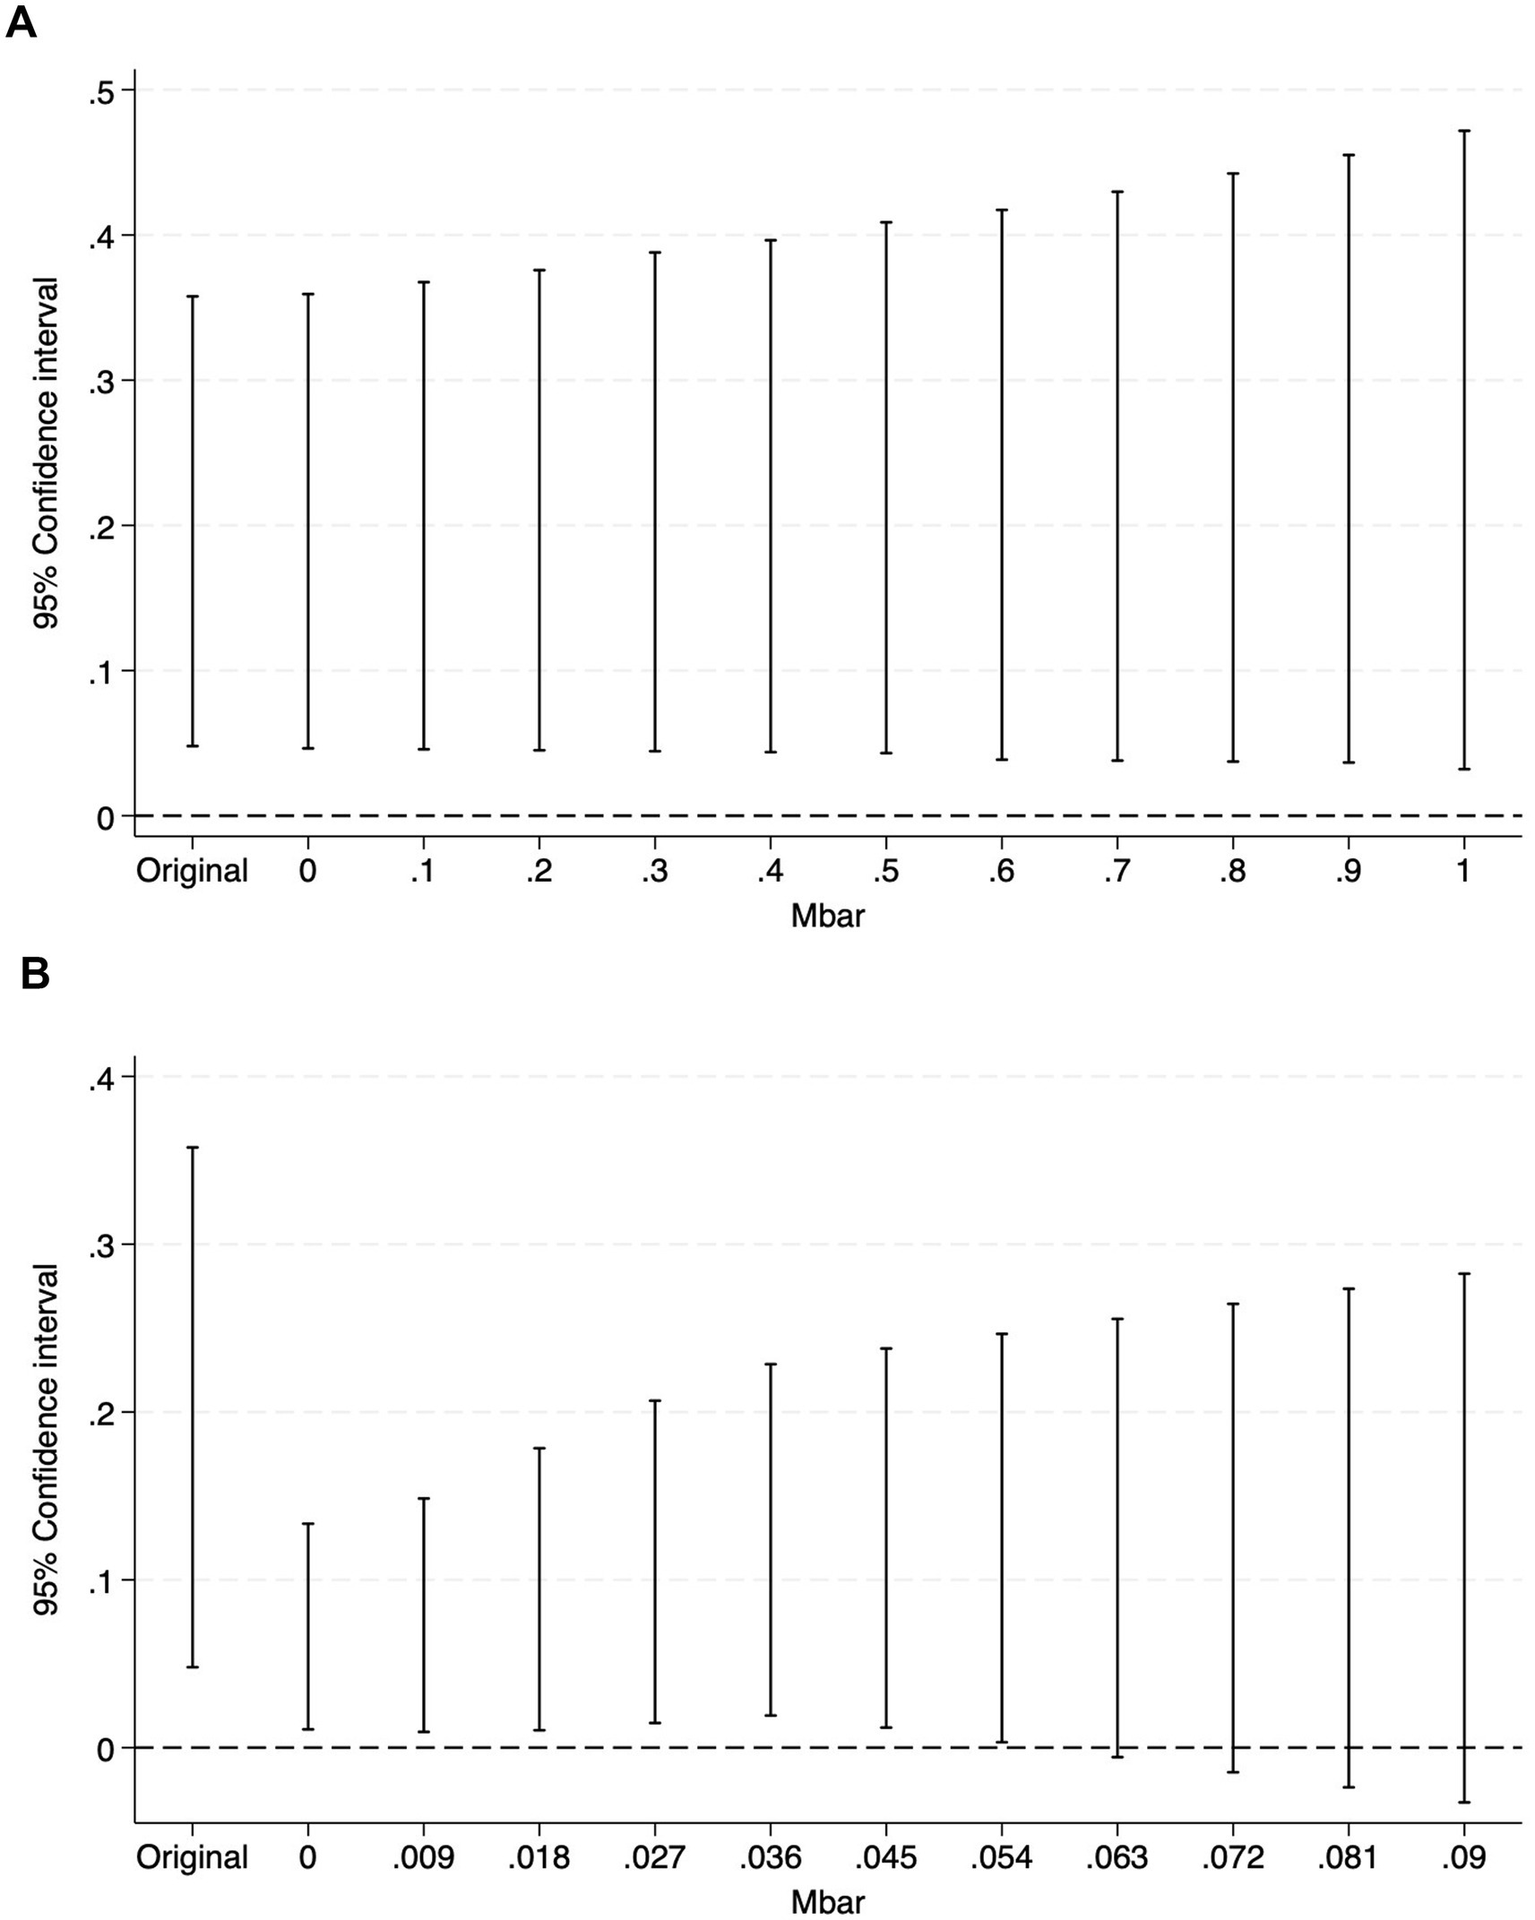
(A,B) Parallel trend sensitivity tests.
4.2.2 Placebo test
Placebo tests can further eliminate the influence of other policy-related or random factors on experimental results. We implement double randomization: (1) select 38 control cities matching treatment group size, and (2) assign random policy timings. Specifically, 38 virtual treatment groups and their respective policy implementation periods were randomly chosen each time, and repeated 500 times, resulting in 500 regression coefficients and their corresponding p-values. Figure 4 displays the kernel density distribution of these 500 coefficient estimates and p-values. The placebo coefficients are centered around 0 and on the left side of the true value of 0.3345. The majority of p-values are greater than 0.1, indicating most of the regression results are not significant. The attenuation of treatment effects under placebo tests provides strong evidence for the robustness of the benchmark regression results.
Figure 4
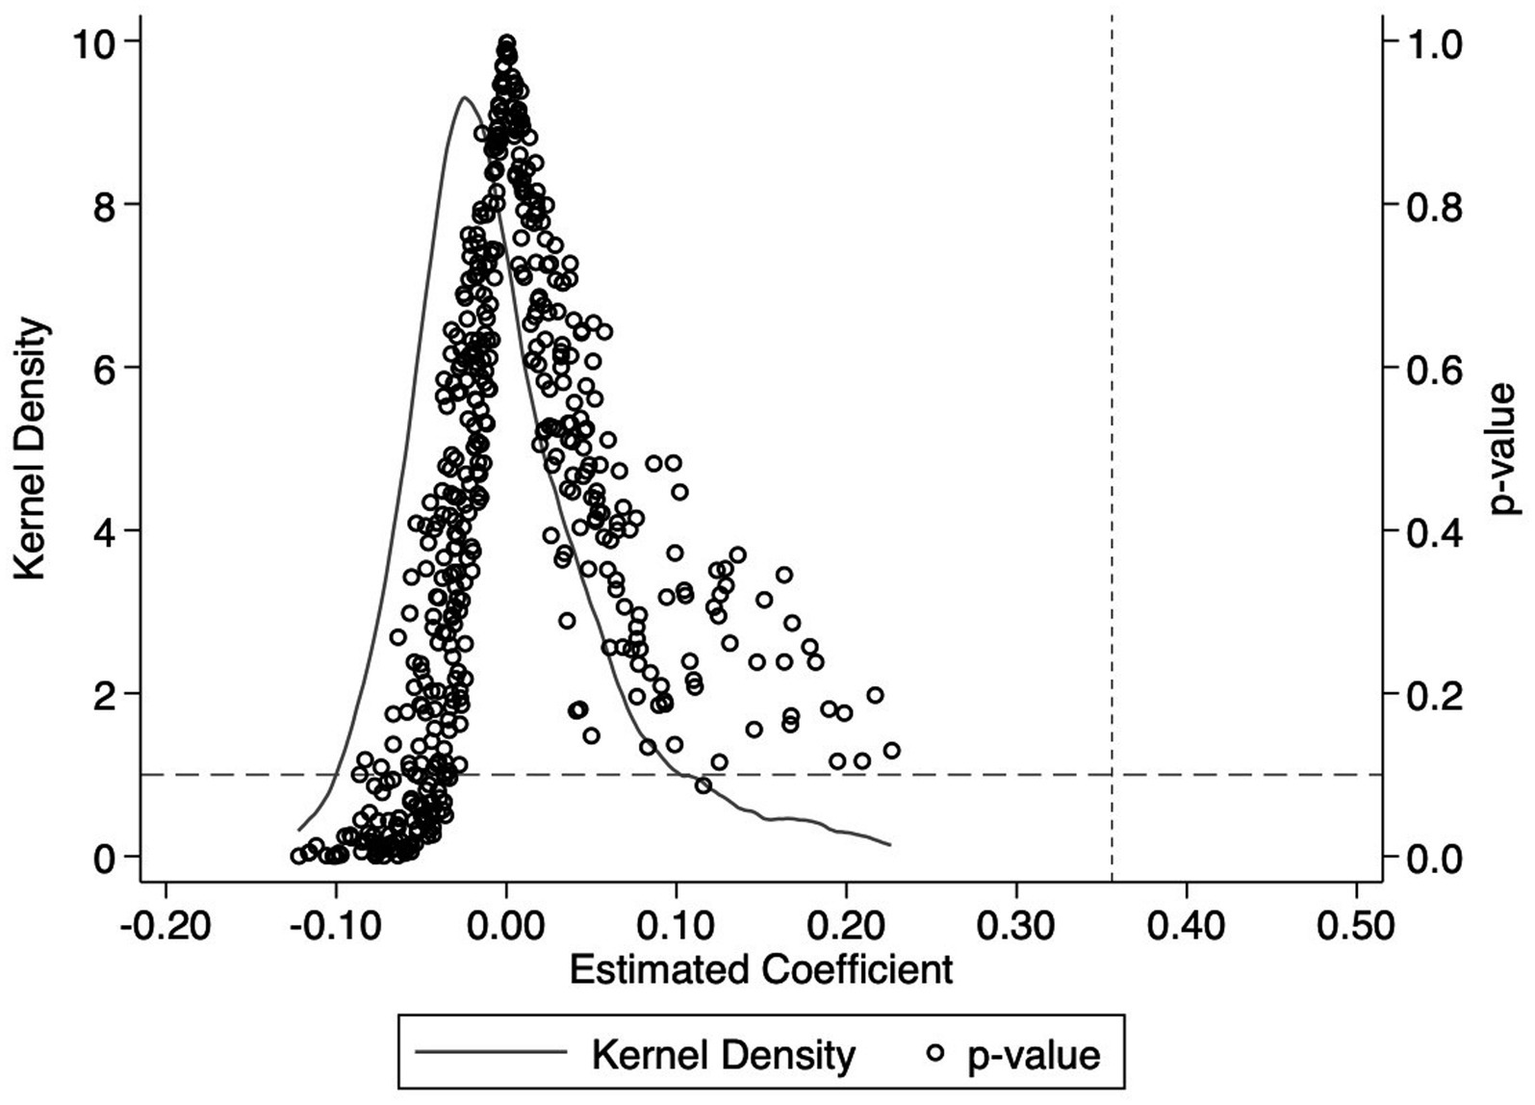
Results of the placebo test.
4.2.3 Other robustness tests
4.2.3.1 Exclusion of COVID-19 pandemic influence
To address the potential confounding effects of the COVID-19 pandemic, we conduct the robustness test by excluding panel data from 2020 and 2021. This period is characterized by unprecedented disruptions in supply chains and regulatory priorities, which might have independently influenced UGTI. As presented in Table 3, column (1), after adjusting dataset, the coefficient of the core explanatory variable did remains significantly positive at the 5% level. This reinforces the conclusion that the FCVD policy exerts a robust stimulative effect on UGTI, even when controlling for exogenous shocks.
Table 3
| Variable | (1) Exclusion of COVID-19 | (2) Substitution of Core Dependent Variable | (3) Substitution of Core Dependent Variable |
|---|---|---|---|
| GIPG | GPG | GIPA | |
| did | 0.3678** | 0.8821*** | 0.3354* |
| (2.2387) | (2.8785) | (1.9590) | |
| Constant | 0.8772*** | 2.7228*** | 1.4810** |
| (2.6628) | (3.9779) | (2.5726) | |
| Observations | 2,264 | 2,830 | 2,830 |
| R-squared | 0.820 | 0.883 | 0.920 |
| Controls | Yes | Yes | Yes |
| City FE | Yes | Yes | Yes |
| Year FE | Yes | Yes | Yes |
Other robustness tests.
t statistics are shown in parentheses; ***, **, and * represent significance at the 1, 5, and 10% levels, respectively.
4.2.3.2 Substitution of Core Dependent Variable
To further verify the robustness of our findings, we conduct additional analyses by replacing the dependent variable GIPG with two alternative measures: (a) green patent grants (GPG) at the city level and (b) green invention patent applications (GIPA) at the city level. These substitutions address potential measurement biases in assessing regional innovation performance, as GPG provides broader coverage while GIPA represents distinct stages of the innovation life cycle. Columns (2)–(3) in Table 3 show statistically significant positive coefficients for the DID estimator at the 1 and 10% levels, respectively. These results accord with the benchmark model, confirming that the FCVD policy robustly stimulates green innovation outputs across alternative metrics.
5 Heterogeneity analysis
Neglecting the differences among FCVD cities may lead to a mismatch between policies and local realities. Therefore, this study conducts sub-sample estimations to examine the effects of the policy on different regions and cities with distinct characteristics.
5.1 Heterogeneity analysis of city location
Due to the great differences in the economic development of eastern, central, and western regions of China, we conduct regressions for the eastern, central, and western regions. Building upon Equation 1, we conduct separate regressions for each region to capture geographically differentiated impacts. The results in columns (1)–(3) of Table 4 reveal a spatially heterogeneous policy influence. Specifically, the regression results indicate that the FCVD policy notably promotes UGTI in eastern cities at the 5% significance level, but its impact on central and western regions is not significant.
Table 4
| Variable | City location | City features | |||
|---|---|---|---|---|---|
| (1) East | (2) Center | (3) West | (4) Resource | (5) Non-resource | |
| GIPG | GIPG | GIPG | GIPG | GIPG | |
| did | 0.4926** | 0.0062 | −0.0219 | 0.0226 | 0.4311** |
| (2.3135) | (0.1236) | (−0.7863) | (1.6135) | (2.1276) | |
| Constant | 3.1542* | 0.7125** | −0.0423 | 0.0634 | 1.4878*** |
| (1.9620) | (2.4292) | (−0.3633) | (1.6572) | (3.0470) | |
| Observations | 990 | 1,000 | 840 | 1,130 | 1,700 |
| R-squared | 0.852 | 0.821 | 0.836 | 0.774 | 0.847 |
| Controls | Yes | Yes | Yes | Yes | Yes |
| City FE | Yes | Yes | Yes | Yes | Yes |
| Year FE | Yes | Yes | Yes | Yes | Yes |
Heterogeneity test results.
t statistics are shown in parentheses; ***, represent significance at the 1, 5, and 10% levels, respectively.
5.2 Heterogeneity analysis of city features
There is significant variation in resource endowments among cities in China. To further assess the heterogeneity of urban resource dependence levels, this study classifies China’s prefecture-level cities into resource-based cities and non-resource-based cities according to the National Sustainable Development Plan for Resource-Based Cities (2013–2020) issued by the State Council of China and conducts regressions based on Equation 1. The results in columns (4) and (5) of Table 4 show that, for the non-resource-based city sample, the FCVD policy has a significant impact on GIPG at the 5% significance level, while this improvement is not observed for the resource-based city sample. A possible explanation is that cities with a high degree of dependence on natural resources tend to develop resource-based industries and suffer from the “resource curse,” which would inhibit the FCVD policy’s effect of improving UGTI.
6 Spatial spillover effect analysis
6.1 Spatial correlation test
Prior to estimating the SDM-DID model, we conduct a Moran’s I spatial correlation test—a prerequisite for this specification—to validate spatial dependence. The Moran’s I index, proposed by Moran (1950), is a spatial statistical measure quantifying spatial autocorrelation, determining whether observed values exhibit clustering (positive Moran’s I), dispersion (negative Moran’s I), or randomness (near zero) across geographical units. It is widely applied in spatial econometrics to validate spatial dependencies, ensuring models account for spillover effects. The results in Table 5 show that the global Moran’s I indices are consistently greater than 0, and strongly reject the null hypothesis of no spatial correlation at the 5 and 1% significance levels. This indicates that during the period of 2014–2023, there was not only a significant spatial correlation among the 283 cities but also distinct spatial clustering patterns.
Table 5
| Year | Moran’s I | Year | Moran’s I |
|---|---|---|---|
| 2014 | 0.005** | 2019 | 0.010*** |
| 2015 | 0.006*** | 2020 | 0.008*** |
| 2016 | 0.007*** | 2021 | 0.008*** |
| 2017 | 0.008*** | 2022 | 0.009*** |
| 2018 | 0.012*** | 2023 | 0.009*** |
Spatial correlation test (Moran’s I).
*** and ** represent significance at the 1, 5, and 10% levels, respectively.
6.2 Model testing
Given the adoption of the SDM-DID, we conduct LR and Wald tests (Elhorst, 2014) to statistically verify SDM’s necessity over nested SAR/SEM alternatives. Table 6 shows both LR-spatial lag and Wald-spatial lag test reject the null hypothesis that the spatial lag terms of explanatory variables are jointly insignificant. Similarly, LR-spatial error and Wald-spatial error test refute the possibility of omitting spatially autocorrelated error structures. These robust results confirm that the SDM cannot degenerate to SLM or SEM. As LeSage and Pace (2009) emphasize, SDM’s incorporation of endogenous and exogenous interaction effects ensures unbiased coefficient estimates under conditions of unobserved spatial heterogeneity. Rejecting simplification hypotheses further substantiates the presence of complex spatial interdependencies in our dataset. Specifically, neighboring units’ characteristics systematically influence local outcomes. Consequently, retaining SDM is statistically warranted and essential for generating policy-relevant insights into direct and indirect spatial effects, a capability absent in SLM/SEM frameworks (Elhorst, 2010).
Table 6
| Test | Statistic | p-value | Conclusion |
|---|---|---|---|
| Wald-spatial lag | 59.11 | 0.000 | SDM |
| LR-spatial lag | 58.26 | 0.000 | |
| Wald-spatial error | 61.65 | 0.000 | |
| LR-spatial error | 58.49 | 0.000 | |
| Hausman | 781.02 | 0.000 | Fixed effect |
Model testing and estimation.
6.3 Spatial DID regression results
Table 7 presents three key findings from our SDM-DID estimation, based on the model in Equation 2, using inverse distance spatial weights. First, both the spatially lagged term coefficient of the key explanatory variable did (Main) and the coefficient of the spatially weighted term (WX) for did are significantly positive at the 1% level. This indicates that the FCVD policy has generated positive direct incentives and spatial spillover effects for enhancing UGTI. Second, to systematically disentangle these effects, we employ Elhorst’s (2014) partial differential decomposition method, which distinguishes local impacts from spatial spillovers. LR Direct captures the direct improvement effect, representing the FCVD policy’s impact on GIPG in demonstration cities. Conversely, LR Indirect measures the indirect improvement effect on GIPG in surrounding cities, while LR Total constitutes the sum of both effects. The decomposition results demonstrate that all coefficients are positive and statistically significant at the 1% level, confirming the policy’s efficacy in boosting green innovation performance both locally and regionally.
Table 7
| Variable | Main | WX | Direct effect | Indirect effect | Total effect |
|---|---|---|---|---|---|
| did | 0.3166*** | 1.0250*** | 0.3148*** | 0.4953*** | 0.8100*** |
| (10.9680) | (3.8204) | (10.4998) | (2.9148) | (5.1056) | |
| ρ | −0.6567*** | ||||
| (−3.0841) | |||||
| sigma2_e | 0.0437*** | ||||
| (37.5575) | |||||
| Observations | 2,830 | 2,830 | 2,830 | 2,830 | 2,830 |
| R-squared | 0.114 | 0.114 | 0.114 | 0.114 | 0.114 |
| Controls | Yes | Yes | Yes | Yes | Yes |
| City FE | Yes | Yes | Yes | Yes | Yes |
| Year FE | Yes | Yes | Yes | Yes | Yes |
The spatial effects of FCVD policy on urban green innovation.
z statistics are shown in parentheses; *** represent significance at the 1, 5, and 10% levels, respectively.
Third, the spatial autocorrelation coefficient ρ is significantly negative (ρ = −0.6567, p < 0.01), revealing a “siphon effect” within urban green innovation ecosystems. Specifically, UGTI of one city tends to be negatively influenced by the improvement in UGTI of its neighboring cities. This suggests that while the FCVD policy fosters positive spillovers, competitive behaviors simultaneously emerge that suppress UGTI in neighboring regions. This duality aligns with findings from high-tech industrial clusters where cooperative and competitive forces coexist (Bathelt et al., 2004), underscoring the need for policy designs that balance incentive structures with intercity coordination mechanisms.
7 Discussion
Government policies are seen as a key factor in driving technological innovation according to the innovation system theory (Jiang et al., 2024). This study advances the understanding of renewable energy policy impacts by addressing a critical gap in the energy transition literature. Against global decarbonization efforts, China’s FCVD policy exhibits distinctive characteristics. While sharing similarities with the US Hydrogen Program Plan 2020 fuel cell truck projects (U.S. Department of Energy, 2020) and Japan’s Revised Basic Hydrogen Strategy (The Ministerial Council on Renewable Energy, Hydrogen and Related Issues, Japan, 2023) in taking the transportation sector as policy focus, leveraging government funding to catalyze private investment, and fostering transboundary supply chains integration, China’s approach demonstrates unique features. The FCVD policy distinguishes itself through multi-sectoral deployment, decentralized implementation, and localization-oriented strategy. Whereas U.S.’s FCV programs focus on long-haul heavy-duty vehicles, fleets, freight, and corridors, China’s FCVD policy deploys fuel cell vehicles across multiple sectors including logistics, public transit, and industry. China employs a decentralized approach where demonstration cities lead execution without direct central government deployment. As Japan prioritizes global supply chain integration due to resource scarcity and limited domestic market, China’s FCVD policy prioritizes supply chain localization, leveraging its industrial scale to foster a self-reliant domestic ecosystem.
Our empirical findings align with prior studies on China’s new energy transition policies. Results confirm the FCVD policy significantly promotes UGTI, consistent with effects observed under China’s New Energy Demonstration City policy (Chen et al., 2023; Jiang et al., 2024; He, 2025).
Within the framework of the FCVD policy, local governments have rolled out a suite of targeted measures including financial support, government procurement, and demand-side incentives. Governments in several demonstration cities have allocated direct grants for R&D projects of fuel cell vehicle manufacturers and continuously expanded the application scenarios for FCVs through government procurement and deployment. Take the municipal governments of Shanghai and Xinxiang as examples: Shanghai provides hydrogen fuel cell enterprises with an R&D grant of up to 30%, whereas Xinxiang innovatively deploys fuel cell powered sanitation vehicles and refuse dump trucks.
On the demand side, purchase subsidies from demonstration city governments effectively reduce financial pressure for enterprises adopting FCVs and related technologies. This is critical for potential adopters to overcome cost-related adoption barriers (Breetz and Salon, 2018) and enhances the overall market viability of FCVs. Phased subsidy mechanisms could further optimize policy impact. Local subsidies could initially support high-emission vehicle retirement to accelerate the phase-out of fossil fuel vehicles and related infrastructure. During the intermediate stage, subsidies could shift towards FCV purchases and refueling support, providing direct stimulus for market penetration. In later phases, support could transition exclusively to hydrogen fuel price subsidies, stabilizing the market foundation for FCV industry development. Additionally, imposing mandatory emission-based surcharges on commercial vehicles could fund this transition while accelerating decarbonization. These policy interventions foster conducive environments for research, development, and application of fuel cell technologies, thereby strengthening urban capacities for green innovation. Beyond that, the FCVD policy drives transformation across interconnected industrial sectors by aligning public and private efforts. Cities including Beijing, Shanghai, Foshan, and Guangzhou have strategically set up hydrogen industry funds, formed cross-sectoral industrial alliances, and established fuel cell industrial parks, to attract corporate investment and cultivate robust fuel cell vehicle value chains. The collaborative synergy between governments and enterprises has given rise to dynamic innovation ecosystems where technological innovations can be converted into practical applications more rapidly (Yang et al., 2022).
The FCVD policy exerts a stronger effect on promoting UGTI in cities in eastern and non-resource-based cities, mirroring findings from China’s Low Carbon City Pilot policy (Liu et al., 2025), another central initiative within China’s Comprehensive Green Transition framework. With respect to city location, compared to central and western cities, eastern cities exhibit notable advantages attributable to their strong innovation capacity, manifested in the agglomeration of high-tech enterprises, research institutes, and skilled personnel (Zheng and Li, 2020). This enables them to demonstrate greater responsiveness and efficiency in policy implementation. In addition to this, the low population density in western China further limits its ability to accept energy substitution (Chen et al., 2023). The varying resource endowments and distinct historical development paths between resource-based and non-resource cities lead to different impacts of the New Energy Demonstration policy on urban green innovation (Zhang et al., 2024). As noted by Xu et al. (2022), non-resource cities, owing to the historical absence of traditional energy reserves, tend to prioritize new energy industries as a core strategy to revitalize local economies. In contrast, resource-based cities face the serious challenge of phasing out outdated production facilities and technologies to achieve energy transition, a process that requires more robust investment and strategic interventions (Cheng et al., 2021). Thus, local governments of central and western cities, especially resource-based cities, should develop targeted measures focused on converting traditional energy infrastructure into hydrogen energy infrastructure. Drawing reference from Germany’s “eFarm” project, these cities could leverage their advantages in abundant land resources, lower population density, and rich natural resources to prioritize hydrogen fuel production, thereby facilitating the transition of traditional energy sectors.
Spatial analysis reveals significant spillover effects, with FCVD policy enhancing neighboring cities’ UGTI, consistent with the findings of Shang et al. (2022) and Ma et al. (2024). The sharing of information and experiences can accelerate innovation in green technology in other cities within the region (Peng et al., 2021). Many FCVD cities have implemented cross-regional collaboration and technology promotion initiatives. For example, Beijing and Shanghai have established the Beijing-Shanghai Hydrogen Energy Corridor, which spans six provinces, spurring surrounding cities to invest in the hydrogen energy industry. Additionally, Shanghai has hosted the International Hydrogen and Fuel Cell Vehicle Congress and Exhibition as well as the X-GAME New Energy Vehicle Big Data Competition, attracting technical talents from neighboring cities to participate and facilitating cross-regional knowledge diffusion. Furthermore, the FCVD policy fosters a social atmosphere conducive to green innovation through sustainability initiatives, with the sustainability culture cultivated in demonstration cities extending beyond municipal borders. This radiating influence shapes a regional social context in which residents of neighboring areas develop heightened awareness of and acceptance toward new energy vehicles. The enhanced public engagement not only normalizes low-carbon transportation choices but also creates a demand-driven impetus for local enterprises to invest in green technology R&D. However, a concurrent siphon effect emerges. It is shown that the UGTI of FCVD cities exerts a siphon effect on the UGTI of neighboring cities, a finding that aligns with Liu et al. (2025). Demonstration cities’ strengthened green innovation capacity and optimized ecosystems attract green resources from neighboring areas, redirecting critical innovation inputs toward policy-supported cities. When competing for green technology investments, the robust R&D environment in demonstration cities provides a decisive advantage over non-demonstration neighbors. This competitive dynamic suppresses UGTI in surrounding regions by diverting essential resources, thereby slowing their technological progress. Mitigating this siphon effect is crucial for achieving balanced regional development under the FCVD policy. One potential policy mechanism to counteract this unintended consequence could involve the establishment of a centrally coordinated compensation scheme. For instance, the central government could mandate demonstration cities to contribute a fixed share of policy-generated tax revenues to a regional “Hydrogen Innovation Compensation Fund.” This fund would provide targeted support—such as R&D tax deductions for green tech firms or university hydrogen lab funding in non-demonstration cities—directly compensating for innovation resource outflows while bolstering neighboring regions’ green R&D capacity. Such intervention would ensure more equitable regional distribution of innovation benefits.
8 Conclusion and policy implications
This study provides robust evidence that China’s FCVD policy significantly boosts UGTI in designated cities. The policy’s impact exhibits heterogeneity, with stronger effects emerging in eastern and non-resource-based cities compared to their central/western and resource-based counterparts. The policy also generates positive spatial spillovers that elevate neighboring cities’ UGTI. However, a concurrent siphon effect constrains innovation development in surrounding areas. This siphoning partially offsets the policy’s beneficial spillovers. Collectively, while the FCVD policy effectively drives UGTI within cities, it generates complex spatial dynamics involving both positive spillovers and resource siphoning.
Based on these findings, we propose targeted recommendations to optimize China’s FCVD implementation and accelerate UGTI diffusion in FCV-related industries. The central government should clarify functional positioning of cities according to location and resource endowments within the FCV industrial landscape. Eastern cities ought to leverage their robust innovation capacity, while non-resource-based cities should capitalize on policy responsiveness to focus on technological innovation and high-end manufacturing. For resource-based cities confronting the “resource curse,” supply-side priorities must emphasize hydrogen production projects that harness local resource advantages to reduce blue/green hydrogen production costs and advance related technologies. Local governments can stimulate traditional energy enterprises to invest in hydrogen manufacturing through targeted subsidies or tax incentives, countering the resource curse’s inhibitory effects on green innovation. On the demand side, measures like phased subsidy reallocation could enhance societal participation in the green transition. Addressing regional disparities and the siphon effect necessitates robust coordinated governance frameworks. Centralized mechanisms, such as knowledge-sharing platforms and inter-municipal R&D partnerships, are essential to harmonize regional imbalances and amplify network-driven innovation. Critically, innovation benefit redistribution or compensatory support for non-demonstration cities should be integrated into regional coordination efforts to mitigate the siphon effect’s constraining impact. This would foster equitable distribution of innovation dividends and strengthen regional green innovation ecosystems. The central government could establish a national communication and cooperation platform to facilitate the exchange of best practices among cities with similar functional roles and matching between cities with complementary specializations. Concurrently, compensating non-demonstration cities for innovation resource outflows must be prioritized within this coordinated framework to counteract the siphon effect.
While this investigation provides valuable insights, several constraints inherent to data availability and methodological choices warrant explicit acknowledgment. Further expansion of the scope and more in-depth investigation are required in future research. First, while GIPG effectively proxy innovation output, they may fail to capture incremental or non-patented green technologies. Future studies should develop a more comprehensive assessment framework to capture holistic green technology innovation performance. Second, the reliance on inverse-distance spatial weights, though standard, overlooks economic or institutional connectivity. Multi-dimensional spatial matrices could be used to refine spillover mechanisms. Third, the 2021–2023 post-implementation period enables timely evaluation but captures only short-to-medium-term effects. Assessing long-term sustainability and path dependence remains critical for hydrogen technologies requiring extended maturation.
Statements
Data availability statement
The original contributions presented in the study are included in the article/supplementary material, further inquiries can be directed to the corresponding author.
Author contributions
YY: Resources, Writing – original draft, Software, Visualization, Conceptualization, Formal analysis, Project administration, Methodology, Data curation, Writing – review & editing. YL: Writing – review & editing, Methodology, Supervision, Conceptualization, Validation. BC: Project administration, Software, Writing – review & editing, Resources.
Funding
The author(s) declare that no financial support was received for the research and/or publication of this article.
Acknowledgments
The authors would like to thank Office of Research and Development Affairs of Beijing Jiaotong University for their valuable guidance on journal selection during the preparation of this manuscript.
Conflict of interest
The authors declare that the research was conducted in the absence of any commercial or financial relationships that could be construed as a potential conflict of interest.
Generative AI statement
The authors declare that no Gen AI was used in the creation of this manuscript.
Any alternative text (alt text) provided alongside figures in this article has been generated by Frontiers with the support of artificial intelligence and reasonable efforts have been made to ensure accuracy, including review by the authors wherever possible. If you identify any issues, please contact us.
Publisher’s note
All claims expressed in this article are solely those of the authors and do not necessarily represent those of their affiliated organizations, or those of the publisher, the editors and the reviewers. Any product that may be evaluated in this article, or claim that may be made by its manufacturer, is not guaranteed or endorsed by the publisher.
Supplementary material
The Supplementary material for this article can be found online at: https://www.frontiersin.org/articles/10.3389/frsc.2025.1617346/full#supplementary-material
Glossary
- FCVs
fuel cell vehicles
- FCVD
fuel cell vehicle demonstration
- UGTI
urban green technology innovation
- DID
Difference-in-Differences
- SDM-DID
spatial Durbin Difference-in-Differences model
- GIPG
green invention patent grants
- GPG
green patent grants
- GIPA
green invention patent applications
References
1
Aghion P. Akcigit U. Howitt P. (2015). The Schumpeterian growth paradigm. Annu. Rev. Econ.7, 557–575. doi: 10.1146/annurev-economics-080614-115412
2
Angrist J. D. Pischke J.-S. (2009). Mostly Harmless Econometrics: An Empiricist’s Companion. Princeton University Press.
3
Bai D. Li M. Wang Y. Mallek S. Shahzad U. (2024). Impact mechanisms and spatial and temporal evolution of digital economy and green innovation: a perspective based on regional collaboration within urban agglomerations. Technol. Forecast. Soc. Chang.207:123613. doi: 10.1016/j.techfore.2024.123613
4
Baker A. C. Larcker D. F. Wang C. C. Y. (2022). How much should we trust staggered difference-in-differences estimates?J. Financ. Econ.144, 370–395. doi: 10.1016/j.jfineco.2022.01.004
5
Bathelt H. Malmberg A. Maskell P. (2004). Clusters and knowledge: local buzz, global pipelines and the process of knowledge creation. Prog. Hum. Geogr.28, 31–56. doi: 10.1191/0309132504ph469oa
6
Biasi B. Sarsons H. (2022). Flexible wages, bargaining, and the gender gap. Q. J. Econ.137, 215–266. doi: 10.1093/qje/qjab026
7
Breetz H. L. Salon D. (2018). Do electric vehicles need subsidies? Ownership costs for conventional, hybrid, and electric vehicles in 14 U.S. cities. Energy Policy.120, 238–249. doi: 10.1016/j.enpol.2018.05.038
8
Chen M. Su Y. Piao Z. Zhu J. Yue X. (2023). The green innovation effect of urban energy saving construction: a quasi-natural experiment from new energy demonstration city policy. J. Clean. Prod.428:139392. doi: 10.1016/j.jclepro.2023.139392
9
Cong J. Yang J. Zhang Q. Zhou Z. (2019). “Strategies to promote green development in coal resource-based regions with China’s Shanxi Province as an example” in Challenges towards ecological sustainability in China. JFGES 2017. eds. YangX.JiangS. (Cham: Springer).
10
Cheng Z. Li X. Wang M. (2021). Resource curse and green economic growth. Resources Policy.74:102325. doi: 10.1016/j.resourpol.2021.102325
11
Dian J. Song T. Li S. (2024). Facilitating or inhibiting? Spatial effects of the digital economy affecting urban green technology innovation. Energy Econ.129:107223. doi: 10.1016/j.eneco.2023.107223
12
Elhorst J. P. (2010). “Spatial panel data models” in Handbook of applied spatial analysis: software tools, methods and applications. eds. FischerM. M.GetisA. (Berlin: Springer), 377–407.
13
Elhorst J. P. (2014). Spatial econometrics: from cross-sectional data to spatial panels. Heidelberg: Springer Berlin Press.
14
Feng W. Li J. (2021). International technology spillovers and innovation quality: evidence from China. Econ. Anal. Pol.72, 289–308. doi: 10.1016/j.eap.2021.09.003
15
Guo C. Yu J. (2024). Determinants and their spatial heterogeneity of carbon emissions in resource-based cities, China. Sci. Rep.14:5894. doi: 10.1038/s41598-024-56434-2
16
He J. (2025). The impact of energy transition policies on urban green innovation: evidence from the new energy demonstration cities in China. Econ. Change Restruct.58:34. doi: 10.1007/s10644-025-09867-2
17
Heilmann S. (2008). Policy experimentation in China’s economic rise. Stud. Comp. Int. Dev.43, 1–26. doi: 10.1007/s12116-007-9014-4
18
Hu Z. Xu Y. (2025). Can new energy demonstration cities break through the multiple carbon lock-in? Evidence based on double machine learning. Energy Policy199:114522. doi: 10.1016/j.enpol.2025.114522
19
Intergovernmental Panel on Climate Change . (2023). Climate change 2022: mitigation of climate change. Chapter 10: transport. Available online at: https://www.ipcc.ch/report/ar6/wg3/chapter/chapter-10/ (accessed April 22, 2025).
20
International Energy Agency . (2021). Net Zero by 2050. Available online at: https://www.iea.org/reports/net-zero-by-2050 (accessed April 22, 2025).
21
Jiang Y. Fan M. Fan Y. (2024). Does energy transition policy enhance urban green innovation capabilities?–a quasi-natural experiment based on China’s new energy demonstration city policy. Front. Environ. Sci.12:1377274. doi: 10.3389/fenvs.2024.1377274
22
Lee C. Feng Y. Peng D. (2022). A green path towards sustainable development: the impact of low-carbon city pilot on energy transition. Energy Econ.115:106343. doi: 10.1016/j.eneco.2022.106343
23
LeSage J. Pace R. K. (2009). Introduction to spatial econometrics. Boca Raton, Florida: CRC Press.
24
Liu M. Chen L. Sheng X. Xu Y. Yuan X. Wang Q. et al . (2024). Zero-waste city pilot and urban green and low-carbon transformation: quasi-experimental evidence from China. Resour. Conserv. Recycl.206:107625:107625. doi: 10.1016/j.resconrec.2024.107625
25
Liu K. Huang T. Xia Z. Xia X. Wu R. (2025). The impact assessment of low-carbon city pilot policy on urban green innovation: a batch-time heterogeneity perspective. Appl. Energy377:124489. doi: 10.1016/j.apenergy.2024.124489
26
Luo Y. (2023) Driving green and low-carbon development through green technology innovation, Guangming Daily, 6 February. Available online at: https://epaper.gmw.cn/gmrb/html/2023-02/06/nw.D110000gmrb_20230206_2-02.htm (accessed April 22, 2025).
27
Lyu L. Sun F. Huang R. (2019). Innovation-based urbanization: evidence from 270 cities at the prefecture level or above in China. J. Geogr. Sci.29, 1283–1299. doi: 10.1007/s11442-019-1659-1
28
Ma S. Li L. Zuo J. Gao F. Ma X. Shen X. et al . (2024). Regional integration policies and urban green innovation: fresh evidence from urban agglomeration expansion. J. Environ. Manag.354:120485. doi: 10.1016/j.jenvman.2024.120485
29
Moran P. A. P. (1950). Notes on continuous stochastic phenomena. Biometrika37, 17–23. doi: 10.1093/biomet/37.1-2.17
30
Pan X. Guo S. Xu H. Tian M. Pan X. Chu J. (2022). China's carbon intensity factor decomposition and carbon emission decoupling analysis. Energy239:122175. doi: 10.1016/j.energy.2021.122175
31
Peng H. Shen N. Ying H. Wang Q. (2021). Can environmental regulation directly promote green innovation behavior?——based on situation of industrial agglomeration. J. Clean. Prod.314:128044. doi: 10.1016/j.jclepro.2021.128044
32
Rambachan A. Roth J. (2023). A more credible approach to parallel trends. Rev. Econ. Stud.90, 2555–2591. doi: 10.1093/restud/rdad018
33
Shang H. Jiang L. Pan X. Y. Pan X. F. (2022). Green technology innovation spillover effect and urban eco-efficiency convergence: evidence from Chinese cities. Energy Econ.114:106307. doi: 10.1016/j.eneco.2022.106307
34
Statista . (2025). Transportation emissions worldwide. Available online at: https://www.statista.com/topics/7476/transportation-emissions-worldwide/#topicOverview (accessed April 22, 2025).
35
The Ministerial Council on Renewable Energy, Hydrogen and Related Issues, Japan . (2023). Basic hydrogen strategy. Available online at: https://www.meti.go.jp/shingikai/enecho/shoene_shinene/suiso_seisaku/pdf/20230606_5.pdf (accessed April 22, 2025).
36
U.S. Department of Energy . (2020). Energy department releases its hydrogen program plan. Available online at: https://www.energy.gov/articles/energy-department-releases-its-hydrogen-program-plan (accessed April 22, 2025).
37
United Nations Environment Programme . (2024). Emissions Gap Report 2024. Available online at: https://www.unep.org/resources/emissions-gap-report-2024 (accessed April 22, 2025).
38
Wang Z. Chu E. (2024). The path toward urban carbon neutrality: how does the low-carbon city pilot policy stimulate low-carbon technology?Econ. Anal. Pol.82, 954–975. doi: 10.1016/j.eap.2024.04.029
39
Wang N. Qu Z. Li J. Zhang Y. Wang H. Xi H. et al . (2025). Spatial-temporal patterns and influencing factors of carbon emissions in different regions of China. Environ. Res.276:121447. doi: 10.1016/j.envres.2025.121447
40
Wang S. Yang D. (2021). Policy experimentation in China: the political economy of policy learning. J. Polit. Econ.133:4. doi: 10.1086/734873
41
Wang S. Yang C. Hou D. Dai L. (2023). How do urban agglomerations drive economic development? A policy implementation and spatial effects perspective. Econ. Anal. Pol.80, 1224–1238. doi: 10.1016/j.eap.2023.10.014
42
Wang J. Zhang Y. Gui N. Siddiqui F. (2024). Driving change: unveiling the dynamics of transportation resource efficiency and low-carbon urban development in China's provinces. Res. Transp. Bus. Manag.56:101150. doi: 10.1016/j.rtbm.2024.101150
43
Wu J. Chen Y. Yu L. Li G. Li J. (2023). Has the evolution of renewable energy policies facilitated the construction of a new power system for China? A system dynamics analysis. Energy Policy183:113798. doi: 10.1016/j.enpol.2023.113798
44
Xiao F. Wang J. Xiong M. Mo H. (2024). Does spatiotemporal heterogeneity matter? Air transport and the rise of high-tech industry in China. Appl. Geogr.162:103148. doi: 10.1016/j.apgeog.2023.103148
45
Xu H. Liu B. Qiu L. Liu X. Lin W. Liu B. (2022). Does the new energy demonstration cities construction reduce CO2 emission? Evidence from a quasi-natural experiment in China. Environ Sci Pollut Res.29, 50408–50426. doi: 10.1007/s11356-022-19436-z
46
Yu Z. Xie W. Guo J. Yang Z. (2024). Green effect of energy transition policy: a quasi-natural experiment based on new energy demonstration cities. Financ. Res. Lett.66:105669. doi: 10.1016/j.frl.2024.105669
47
Yang X. Wang W. Wu H. Wang J. Ran Q. Ren S. (2022). The impact of the new energy demonstration city policy on the green total factor productivity of resource-based cities: empirical evidence from a quasi-natural experiment in China. J. Environ. Plan. Manag.66, 293–326. doi: 10.1080/09640568.2021.1988529
48
Zha D. Jiang P. Zhang C. Xia D. Cao Y. (2023). Positive synergy or negative synergy: an assessment of the carbon emission reduction effect of renewable energy policy mixes on China’s power sector. Energy Policy183:113782. doi: 10.1016/j.enpol.2023.113782
49
Zhang D. (2022). Environmental regulation, green innovation, and export product quality: what is the role of greenwashing?Int. Rev. Financ. Anal.83:102311. doi: 10.1016/j.irfa.2022.102311
50
Zhang Z. Li P. Wang X. Ran R. Wu W. (2024). New energy policy and new quality productive forces: a quasi-natural experiment based on demonstration cities. Econ. Anal. Pol.84, 1670–1688. doi: 10.1016/j.eap.2024.10.039
51
Zhao K. Gao Y. Liu X. (2025). The impact of environmental regulation on industrial structure upgrading: a case study of low carbon city pilot policy. Energy Policy197:114432. doi: 10.1016/j.enpol.2024.114432
52
Zheng S. Li Z. (2020). Pilot governance and the rise of China’s innovation. China Econ. Rev.63:101521. doi: 10.1016/j.chieco.2020.101521
Summary
Keywords
urban sustainability, renewable energy, fuel cell vehicle, hydrogen policy, low-carbon transportation, urban green technology innovation, difference-in-differences model, spatial spillover effects
Citation
Yan Y, Liu Y and Cai B (2025) Neighbors’ gain or neighbors’ pain? Exploring the impact of China’s fuel cell vehicle demonstration policy on urban green technology innovation: quasi-natural experiment evidence from China. Front. Sustain. Cities 7:1617346. doi: 10.3389/frsc.2025.1617346
Received
24 April 2025
Accepted
04 August 2025
Published
05 September 2025
Volume
7 - 2025
Edited by
Imran Khan, China University of Mining and Technology, China
Reviewed by
Zaid Ashiq Khan, Northwest A&F University, China
Khan Baz, Zhejiang Agriculture and Forestry University, China
Updates
Copyright
© 2025 Yan, Liu and Cai.
This is an open-access article distributed under the terms of the Creative Commons Attribution License (CC BY). The use, distribution or reproduction in other forums is permitted, provided the original author(s) and the copyright owner(s) are credited and that the original publication in this journal is cited, in accordance with accepted academic practice. No use, distribution or reproduction is permitted which does not comply with these terms.
*Correspondence: Yangtian Yan, 24125522@bjtu.edu.cn
Disclaimer
All claims expressed in this article are solely those of the authors and do not necessarily represent those of their affiliated organizations, or those of the publisher, the editors and the reviewers. Any product that may be evaluated in this article or claim that may be made by its manufacturer is not guaranteed or endorsed by the publisher.