Abstract
The Belt and Road (B&R) initiative has strengthened trade ties among participating nations over the past decade, while contributing over 50% of global carbon footprint, which has exerted growing pressure on climate governance. This paper uses the multi-regional input–output (MRIO) model to build the B&R trade embodied carbon emission network across 66 countries and 26 industrial sectors from 2004 to 2020, and combines social network analysis to observe the flow relationship and evolution process from the regional and industry perspective. The research shows that in 2020, the total carbon emissions of countries along the B&R increased by 66% compared with 2004, the trade links were closer, and the connectivity of the embodied carbon network was gradually enhanced. China, India, and Russia are at the core of the network, with countries such as China, Russia and UAE playing a bridging role. Carbon leakage has gradually shifted from China to Southeast Asian countries with relatively lenient environmental regulations such as India and Vietnam. From the perspective of industry, the B&R industrial agglomeration effect is strengthened, and the carbon link can be reached quickly. Industries such as electricity, gas and water dominate the network, while electrical and machinery plays important regulatory function, exerting strong control over embodied carbon flows across sectors. The findings offer a factual basis for B&R countries to coordinate cross-regional and cross-sector carbon emission control, clarifying emission responsibilities, identifying reduction pathways, and promoting the high-quality construction of the B&R.
1 Introduction
In 2013, China proposed to jointly build the B&R, aiming to guide developing countries to achieve common prosperity (Zhao et al., 2019). Over the past decade, 152 countries and 32 international organizations have signed over 200 cooperation agreements with China. Since the B&R initiative was put forward, the trade volume between China and countries along the B&R has increased significantly. According to the data of the General Administration of Customs of the People’s Republic of China, from 2013 to 2022, the volume of goods trade between China and countries along the B&R has doubled from US $1.04 trillion to US $2.07 trillion, with an average annual growth of 8%. The economic development of countries along the route is rapid, with a per capita GDP growth rate of 4.1–13.1%, higher than the world average of 3.5% (Han et al., 2020).
The huge scale of international trade and investment will lead to a reconfiguration of energy consumption (Chen et al., 2021), thereby affecting the carbon emissions of importing and exporting countries (Hubacek et al., 2021; Yang et al., 2020). With the increase of trade activities among countries along the B&R, the embodied carbon transfer is also increasing, and the transfer mode is also changing (Hubacek et al., 2021). Currently, up to 127 countries and regions have committed to achieving carbon neutrality by the mid-20th century (Wang and Yao, 2022). Dealing with climate change has become a common goal of the international community, and many countries and regions have taken effective policy measures to address it. In fact, half of the world’s top 10 carbon dioxide emitters are located along the B&R, and the B&R countries contributed to over 50% of global carbon footprint (Lu et al., 2020), which has brought great pressure to curb global warming. The B&R is a double-edged sword. On the one hand, it promotes the development of the global economy, especially the growth of trade among developing countries, and improves energy efficiency by fully leveraging their own advantageous technologies (Peng et al., 2021). On the other hand, large-scale infrastructure construction may increase global carbon emissions (Wei et al., 2022). Therefore, a comprehensive analysis of the structure and evolution of the B&R trade embodied carbon transfer network has important practical significance for fully understanding the role of countries and departments in the B&R trade embodied carbon transfer network, clarifying the issue of embodied carbon emission responsibility, exploring effective carbon emission reduction paths, and promoting the high-quality construction of the B&R.
2 Literature review
At present, research on international carbon emissions mainly includes three aspects: international carbon emission measurement, international carbon leakage, and embodied carbon in international trade. Currently, countries around the world have successively set carbon peak and carbon neutrality goals that are in line with their national conditions, and accurate measurement of international trade carbon emissions is the basis for policy-making. Firstly, the IPCC method is internationally recognized as one of the commonly used carbon emission measurement methods (Reilly et al., 2001). The greenhouse gas emission accounting guidelines developed by the Intergovernmental Panel on Climate Change (IPCC) provide a reliable method for countries around the world to establish national greenhouse gas inventories and comply with emission reductions. Hashimoto (2008) used the IPCC method to account for harvested wood products in the national greenhouse gas inventory and studied their incentive effects on relevant policy objectives. Lu et al. (2023) used an improved IPCC method to calculate carbon intensity from 2021 to 2030 and predicted whether China could achieve its carbon peak target by 2030. In addition, another method is the Life Cycle Assessment (LCA), which quantifies the carbon dioxide consumed and released by a product throughout its entire lifecycle based on the specific product lifecycle at the micro level. Branco et al. (2013) conducted a lifecycle assessment of a coal-fired power plant located in Brazil, exploring the emission reduction potential of CO2 capture technology. Li and Wang (2023) used the life cycle assessment method to calculate the carbon emissions from coal mining, transportation, and consumption from 2001 to 2018, and analyzed the factors affecting carbon emissions from coal resource extraction to utilization. Finally, the input–output method is also a fundamental method for measuring carbon emissions, commonly used to calculate the embodied carbon in international trade. The input–output method can be divided into single region input–output method (SRIO) and multi region input–output method (MRIO). SRIO is commonly used to measure the embodied carbon emissions caused by final demand within an economy (Wiedmann, 2009), or the embodied carbon emission relationships between industrial sectors in the production process (Shi et al., 2017). The MRIO model compensates for the deficiency of SRIO in describing production and supply path differences, and extends embodied carbon analysis from within countries to between countries (Su et al., 2021), providing a practical and feasible way to quantitatively describe the cross regional transfer of embodied carbon emissions. Fan et al. (2021) used the MRIO model to establish the link between embodied carbon and the global value chain, and measured the carbon efficiency of international trade. They found that the export carbon intensity of developing and emerging economies was significantly higher than the import carbon intensity, while developed countries had the opposite. Tian et al. (2024a) used an environmentally extended MRIO model to estimate the environmental footprints of 201 consumption groups, revealing that adjustments in the consumption patterns of the top 20% global consumers could reduce environmental pressures by 25–53%.
The emergence of carbon leakage is due to the varying degrees of policies adopted by countries toward carbon emissions (Yu et al., 2021; King and van den Bergh, 2021). Countries with strict policies transfer carbon emissions to countries with relatively loose policies through global trade (Kuik and Hofkes, 2010). The Kyoto Protocol and the Paris Agreement only consider direct carbon emissions from countries and ignore transfers between countries, leading to an increased risk of carbon leakage (King and van den Bergh, 2021). In this field, Zhou et al. (2020) studied the relationship between China’s carbon emissions trading and carbon leakage, and identified the direction and channels of carbon leakage. Fan et al. (2019) studied the impact of trade openness on carbon emissions and carbon leakage, and pointed out that efforts should be made to increase trade openness while adapting to new trade models and environmental regulatory standards. To prevent carbon leakage, the EU formally approved the Carbon Border Adjustment Mechanism (CBAM) in 2023. Scholars have conducted studies on the impact of CBAM on embodied carbon in trade. Li et al. (2024) evaluated the impact of CBAM on the embodied carbon emissions in global steel trade, and found that CBAM can encourage the major steel producing economies to reduce the embodied carbon emissions in the steel exports to the EU and the whole world by 31 and 21%. Tanaka and Nagashima (2025) explored the potential economic impacts of retaliatory tariffs by affected countries, revealing that while CBAM effectively reduces carbon leakage, it imposes substantial economic burdens on exporting countries.
Under the concept of low-carbon economy, in order to meet the quantitative evaluation of carbon emissions, the United Nations Framework Convention on Climate Change provides a clear definition of embodied carbon, which refers to the entire process of carbon dioxide emissions from raw material acquisition, manufacturing and processing, transportation and sales to becoming a product (Hou et al., 2021). The main method for measuring embodied carbon is the input–output model. The input–output table can transform the value relationship between industrial sectors into a carbon flow relationship, clearly describing the production and consumption relationships between various industrial sectors and regions (Tian et al., 2024b). As an important component of carbon emissions, trade embodied carbon is directly related to the determination of carbon emission responsibilities of both trading parties, directly affecting the implementation of emission reduction targets in various regions and the allocation of carbon emission rights. Therefore, research on the flow process of trade embodied carbon is becoming increasingly in-depth. Examining the allocation of carbon emission responsibilities is critical to achieving fair and equitable climate mitigation (Tian et al., 2025). Zhang and Zhang (2018) believe that the embodied carbon emissions generated with the flow of trade materials should also be considered in the allocation of carbon emission rights. Han et al. (2018) used the MRIO model for analysis and found that consumption in countries such as the United States and the European Union accounts for about 30% of carbon emissions. They believe that measuring embodied carbon emission responsibilities from a consumer perspective is more equitable. Kim and Tromp (2021) used the MRIO model to calculate the embodied carbon flow in trade between major industries in China and Brazil from 2000 to 2014. The results showed that China was in a surplus position in terms of embodied carbon in trade with Brazil. On the one hand, this indicates that China needs to improve its level of clean production technology and reduce its embodied carbon output. On the other hand, it indicates that the two countries should jointly bear the responsibility for carbon reduction through carbon tariffs and other means. Peng et al. (2016) used the MRIO model to study the embodied carbon in international trade, pointing out that developed countries import large amounts of energy intensive products from developing countries, resulting in the transfer of embodied carbon and exacerbating environmental inequality. For the study of embodied carbon in international trade, scholars have found that developed countries are mostly net importers of embodied carbon, while developing countries are mostly net exporters of embodied carbon. Developed countries should consider helping developing countries share the pressure of carbon reduction.
Most of the previous studies, which are only from the global perspective, construct the embodied carbon network in global trade around the world’s major economies (Hu and Wu, 2022; Di et al., 2022). From an industry perspective, existing literature mostly studies the trade network characteristics of a single industry, such as agricultural products (Fair et al., 2017; Gutiérrez-Moya et al., 2020; Wang et al., 2023), energy (Chen et al., 2018), copper (Dong et al., 2017; Wang et al., 2020) and natural gas (Peng et al., 2021), without linking it to embodied carbon emissions. Few scholars have studied the embodied carbon transfer network of the B&R trade based on national and industrial perspectives.
Therefore, based on the existing research, this paper intends to develop the following aspects. First, by constructing the embodied carbon emission network of B&R trade and analyzing its flow relationships and evolutionary process, key node countries and major carbon transfer paths will be identified. Second, from the perspective of carbon leakage, the net embodied carbon in trade will be quantified to explore potential transfer pathways for carbon leakage. Finally, an inter-sectoral embodied carbon emission network will be further constructed to investigate the roles of different sectors within the network, thereby laying the foundation for carbon emission reduction governance at the sectoral level.
3 Methods and data
3.1 Methods
3.1.1 Multi-regional input–output analysis
This paper constructs a multi-regional input–output model (MRIO) to calculate the embodied carbon emissions of trade between countries along the B&R. The calculation is based on the MRIO table (see Table 1).
Table 1
| Intermediate use | Final demand | Total output | |||||||
|---|---|---|---|---|---|---|---|---|---|
| Country 1 | … | Country m | Country 1 | … | Country m | ||||
| Sector 1…n | … | Sector 1…n | Category 1…r | … | Category 1…r | ||||
| Intermediate input | Country 1 | Sector 1…n | X11 | … | X1m | Y11 | … | Y1r | X1 |
| … | … | … | … | … | … | … | … | … | |
| Country m | Sector 1…n | Xm1 | … | Xmm | Ym1 | … | Ymr | Xm | |
| Value added | V1 | … | Vm | ||||||
| Total input | X1 | … | Xm | ||||||
MRIO table.
The model assumes that there are m countries and n sectors, and the relationship between intermediate use, final demand, and total output is:
In Equation 1, is the total output of sector i in region p; is the intermediate input generated by sector i in region p to meet the final demand of sector j in region q; is the amount of final demand of category s from sector i in region p to region q.
The direct consumption coefficient represents the intermediate input of sector i in region p when sector j produces one unit of output in region q. The calculation method is shown in Equation 2.
Therefore, Equation 1 can be transformed into Equation 3.
We define the direct consumption coefficient matrix as:
, where, =
Combined with Equations 3, 4 can be obtained in matrix notation.
is the Leontief inverse, describing the total inputs of various sectors in different regions required for production to meet the per unit final demand of a particular sector.
The calculation method of carbon emission coefficient is shown in Equation 5.
Where, is the carbon emission of sector i in region p, and is the total output of sector i in region p.
The carbon emission coefficient matrix is:
, where,
Therefore, the final demand-driven carbon emission matrix is shown in Equation 6.
Where,, =
Equation 7 represents the carbon transfer from region q to region p.
The net carbon emission of region p is shown in Equation 8.
3.1.2 Social network analysis
This paper uses the social network analysis method to build the embodied carbon transfer network of trade among countries along the B&R, and analyzes its overall network characteristics and node characteristics. For the overall network characteristics, network density, clustering coefficient, and average path length are selected to measure the closeness, accessibility, and stability of the network. For node characteristics, degree centrality, betweenness centrality, and closeness centrality are selected to determine the position and role of each country (industry) in the embodied carbon transfer network.
In the process of constructing the embodied carbon network of trade among countries (industries) along the B&R, the countries (industries) were taken as nodes, and the embodied carbon flow relationship of each country (industry) was taken as an edge. If the net embodied carbon transfer from country (industry) X to country (industry) Y is greater than 0, then there exists an edge (eXY) that points from node X to node Y. The weight of the edge (ωXY) is the net embodied carbon transfer from country (industry) X to country (industry) Y. The adjacency matrix () of the net transfer network is defined as Equation 9.
The overall network characteristics were measured in terms of network density, clustering coefficient, and average path length. D represents network density, reflecting the tightness of the embodied carbon network (Equation 10). The higher the network density indicator, the more frequent the embodied carbon transfer connections between countries (industries). In the network, M represents the number of edges and N represents the number of nodes.
The clustering coefficient is represented by C, which represents the degree of clustering between nodes in the network. is the number of adjacent nodes of node i, and is the number of connections between adjacent nodes of node i. The calculation equation for clustering coefficient is shown in Equation 11.
The average path length (L) refers to the average number of steps of embodied carbon emissions between any two nodes. represents the shortest path between node i and node j. The equation for calculating the average path length is shown in Equation 12.
Centrality is used to analyze the importance of a node in a network. The higher the centrality, the more central a country (industry) is in the network. Centrality is generally divided into three types, namely degree centrality, betweenness centrality, and closeness centrality.
indicates the degree centrality of country (industry) i. In a directed network, the degree centrality of nodes is divided into in-degree and out-degree, as shown in Equations 13, 14. is the number of valid associations from other nodes to node i; is the number of valid associations from node i to other nodes.
The betweenness centrality () is used to measure the frequency of a country (industry) appearing on the shortest path of carbon transfer networks. It can be represented by Equation 15:
represents the closeness centrality of country (industry) i, which is a measure of the centrality of country (industry) i from the perspective of distance between nodes. Assuming that the shortest path between node i and node j is represented by , as shown in Equation 16:
3.2 Data
The Eora database is an MRIO database developed by the Australian Research Council, covering trade and environmental accounts from 189 countries and regions around the world and 26 sector categories from 1990 to 2020. Compared to other MRIO databases, the Eora database covers a wider range of countries. In addition, it can fully reflect the economic connections between 189 countries and regions around the world, and is currently one of the most important value-added trade accounting databases. The B&R is an open and inclusive regional cooperation initiative that is not limited to a specific spatial scope. This study mainly uses the world input–output table of 2004, 2008, 2012, 2016 and 2020 in Eora database to select the carbon dioxide emissions of 66 countries and regions (see Supplementary Table S1) and 26 industrial sectors (see Supplementary Table S2) along the B&R.
4 Results
4.1 Evolution of the regional embodied carbon network
4.1.1 Carbon emissions transfer between China and other countries
The total carbon emissions of B&R countries were 19,864 Mt. in 2020, an increase of 66% over 2004. As the largest carbon emitter, China’s carbon emissions are 9,262 Mt., an increase of 111% compared to 2004. In addition to domestic emissions, 505 Mt. was discharged to other countries along the B&R.
Figure 1 shows the carbon transfer between some key countries (with large import and export) and China. As shown in Figure 1a, in 2004, there were significant differences in carbon transfer between different countries and China. Russia and South Korea transferred 31.38 Mt. and 24.02 Mt. of carbon dioxide to China respectively, followed by Malaysia, India, Indonesia, and Kazakhstan, with the amount below 10 Mt. From Figure 1c, it can be seen that in 2020, Russia transferred 77.56 Mt. of carbon dioxide to China, ranking first. India surpassed South Korea and transferred 66.18 Mt. to China. South Korea transferred 65.21 Mt. of carbon dioxide to China. Vietnam, Kazakhstan, Malaysia, Indonesia, Thailand, and Iran all transfer carbon emissions of over 10 Mt. to China. We found that in 2020, the carbon emission imports of China from most countries have almost doubled compared to 2004.
Figure 1
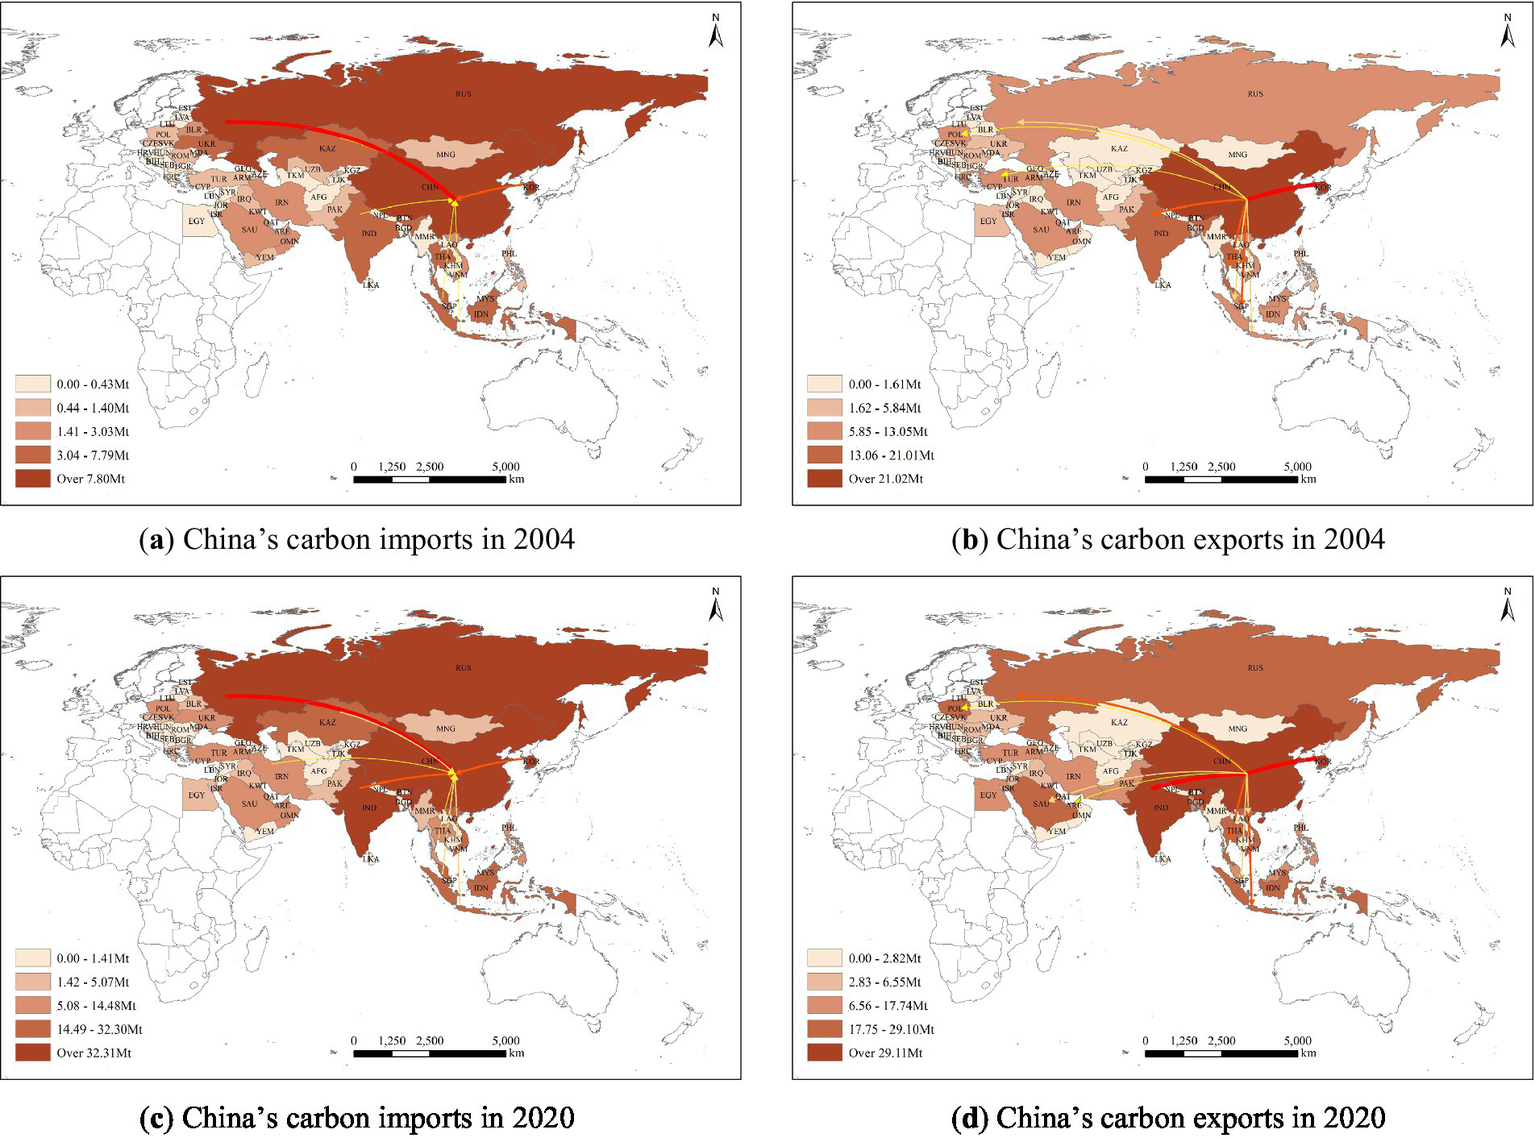
Carbon transfer between China and the B&R countries in 2004 and 2020.
The amount of export from China to other B&R countries is generally greater than its import. As shown in Figure 1b, in 2004, South Korea imported 55.11 Mt. of carbon emissions from China, followed by India and Singapore at 21.01 Mt. and 20.08 Mt., respectively. In addition, China exported more than 10 Mt. of carbon emissions to Thailand, Russia, Indonesia, Malaysia, Turkey and Poland. The carbon emissions to other countries (such as Saudi Arabia, UAE, Vietnam, Greece, and Iran) did not exceed 10 Mt. From Figure 1d, it can be seen that the carbon emissions of China’s exports to other countries in 2020 have significantly increased compared to 2004. South Korea and India imported 78.36 Mt. and 71.83 Mt. of carbon respectively, ranking first and second. Thailand, Indonesia, Russia, Singapore, Vietnam, and Saudi Arabia imported more than 20 Mt. There were 15 countries, including South Korea and India, imported over 10 Mt. of carbon from China. This may be because since the B&R initiative was put forward in 2013, China has strengthened cooperation with other B&R countries, which has not only promoted economic development, but also increased carbon transfer between countries.
4.1.2 Overall network characteristics and evolution of embodied carbon transfer in trade among countries along the B&R
This paper calculates the embodied carbon emissions transfer caused by trade among countries along the B&R from 2004 to 2020. On this basis, the adjacency matrix of net embodied carbon transfer of 66 countries/regions is constructed, and the net embodied carbon transfer network is drawn. The embodied carbon network between countries and regions along the B&R is densely connected, including 2,145 edges every year. In order to clearly observe the main embodied carbon relationships in the entire network, we draw on the approach of Lv et al. (2019) and use the cumulative distribution function of edge weights to screen the original network. Figure 2 shows the cumulative distribution of embodied carbon transfers among countries and regions. We retained the edges with the largest edge weights that contribute 95% of the sum of all weights in the network for discussion. The screened network removes a large number of weak relationships, retains the key connections of the network, and can more clearly reflect the structural characteristics of the B&R trade embodied net carbon transfer network (Figure 3).
Figure 2
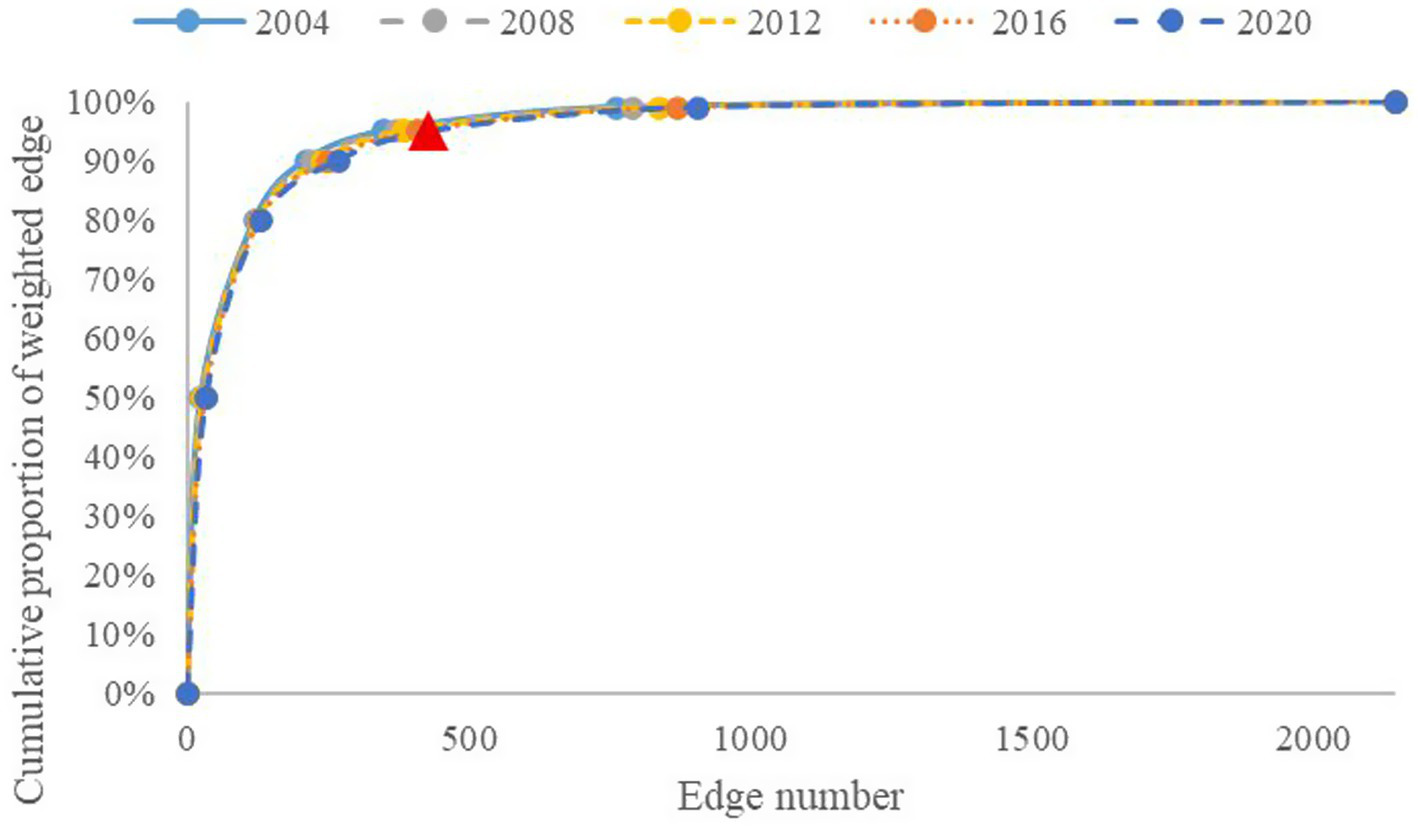
Cumulative distribution of embodied carbon transfers among countries and regions.
Figure 3
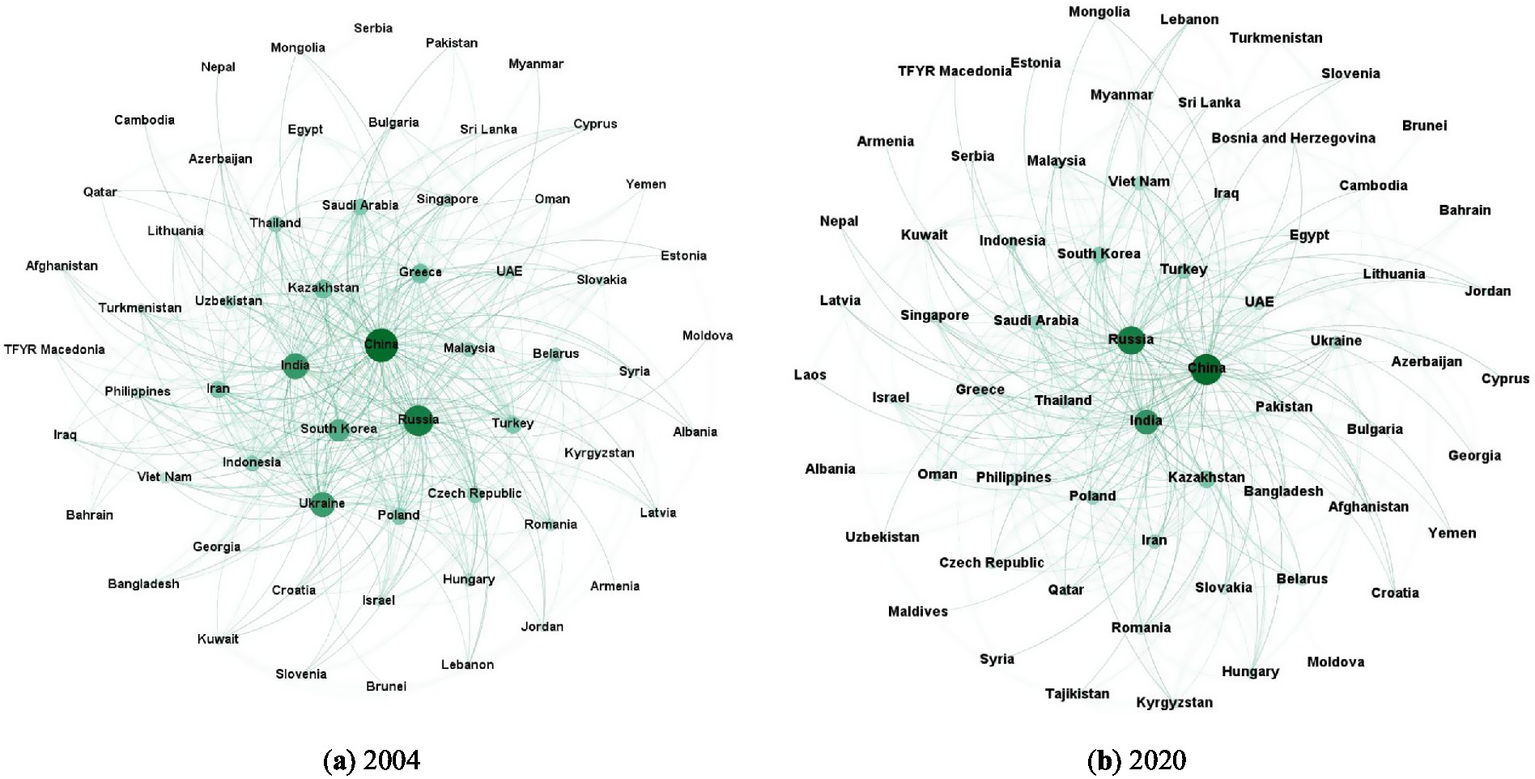
The B&R trade embodied carbon transfer network in 2004 and 2020.
As shown in Figure 3, the main countries and regions can be divided into two categories. One group consists of economically developed countries, which are mainly importers of embodied carbon emissions, and the other group is composed of economically developing countries, mainly exporters of embodied carbon emissions. In addition, a solid network has been formed among countries along the B&R, and the density and connection of the network and the intensity of net embodied carbon transfer are gradually increasing.
Specifically, China, Russia and Ukraine had larger nodes and more ties in 2004, indicating that these three countries had close trade links with countries along the B&R, and the net transfer of embodied carbon was also greater, playing a central role in the entire network. In contrast, Armenia, Brunei, Moldova, Serbia, and Tajikistan had smaller shapes and sparse connections, which means that these five countries had less net embodied carbon transfer compared to other countries. Laos, Maldives, Bosnia and Montenegro were isolated in the network due to their small trade links with other countries, so the net embodied carbon transfer can be ignored. In 2020, there was a significant increase in network nodes and ties, and the network tended to tighten, but the network characteristics remained basically consistent with those of 2004. China and Russia continued to consolidate their position as central countries, while India was rising rapidly and squeezing into the center position. Brunei, Maldives and Moldova were located in the periphery of the B&R, with less carbon transfer with countries and regions along the line. The entire network has roughly formed a “multipolar” distribution pattern centered around India, China, and Russia.
Figure 4 shows the overall network characteristics of trade net embodied carbon transfer in 2004, 2008, 2012, 2016, and 2020. The overall density of the embodied carbon transfer network of countries along the B&R is a sign of the strength of the relationship between countries. The greater the overall density, the closer the relationship between countries’ carbon emissions. The network density of embodied carbon transfer increased from 0.2758 in 2004 to 0.3434 in 2020, indicating that countries and regions along the B&R have closer trade links and greater flow of embodied carbon transfer, and also implying that carbon leakage is being widely dispersed among much more economies than before. The clustering coefficient is used to measure the density and tightness of connections around node countries, thereby revealing the influence of nodes in the network. The clustering coefficient increased from 0.41 in 2004 to 0.418 in 2020, indicating that nodes tend to form closer groups and the integration degree of the hidden carbon network along the route is deeper. The average path length decreased from 1.916 in 2004 to 1.817 in 2020, indicating that the embodied carbon flow from one country along the route to another requires less than two countries on average, and the trade links between countries along the route continue to increase. In addition, the embodied carbon transfer network among countries along the B&R has a large clustering coefficient and a small average path length, which conforms to the nature of a small world network. The embodied carbon flow relationship between countries along the route is close, and the network has high connectivity. This means that changes in carbon emissions of a country will drive changes in trading partner countries, providing ideas and opportunities for coordinated emission reduction among countries along the route.
Figure 4
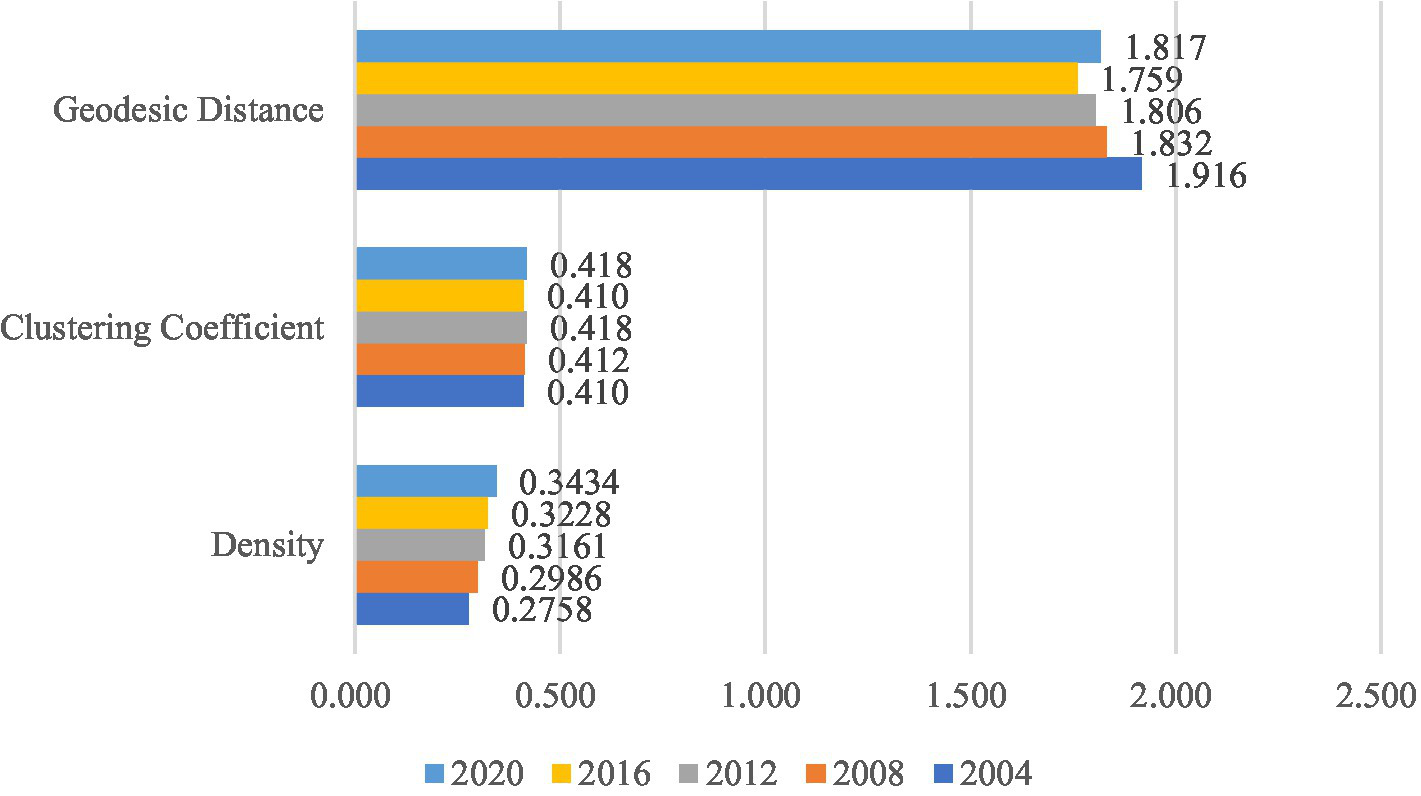
Calculation results of overall network characteristic indicators.
4.1.3 Centrality analysis of trade embodied carbon transfer network among countries along the B&R
In order to observe the individual characteristics of countries and regions along the B&R in the embodied carbon transfer network, this paper calculates the degree centrality, betweenness centrality and closeness centrality of each node in the B&R trade embodied carbon transfer network in 2004 and 2020, as shown in Table 2. Overall, the embodied carbon connections in trade have become more frequent, and the status of countries and regions along the route has changed. From the perspective of degree centrality, in 2004, China, Russia, India and Ukraine had more trade links with countries along the B&R, significantly surpassing South Korea, Greece and Kazakhstan. China, Russia and Ukraine ranked higher in the out-degree, while Greece, South Korea and Turkey ranked higher in the in-degree. China, South Korea, and Saudi Arabia ranked among the top three in terms of betweenness centrality, indicating that these countries had a higher frequency of appearing on the shortest path of the global embodied carbon transfer network and had a strong influence and bridging role in spatial correlation. Serbia, Brunei, and Yemen were on the periphery of the trade embodied carbon network and had weak trade links with other countries. In 2020, China, India and Russia had established more trade ties with countries along the B&R, and the degree of centrality had increased. In terms of out-degree, India, China, and Russia maintained a core position. The out-degree of emerging economies such as Kazakhstan had significantly increased. Technology spillovers in emerging fields such as photovoltaic and ultra-high voltage reduce the carbon emission intensity per unit of product while expanding the export scale of high value-added products. This significantly expands the spatial correlation range of embodied carbon outflow, thereby driving an increase in out-degree centrality. Conversely, resource-intensive countries like Ukraine exhibit insufficient absorption of low-carbon technology spillovers. Coupled with restrictions from low-carbon policies, the demand for their high-carbon resource exports shrinks during the global low-carbon transition. This reduces the destinations of embodied carbon outflow, leading to a decline in out-degree centrality. South Korea, Singapore, and Saudi Arabia were higher in terms of in-degree, indicating their strong dependence on resource imports. China continued to maintain its status as a bridge of embodied carbon trade network. Russia and the UAE have strengthened their positions as technical hubs by upgrading energy infrastructure and transferring renewable energy technologies, significantly enhancing their betweenness centrality. Specifically, China’s centrality in the trade embodied carbon net transfer network is significantly higher than that of other countries, and it’s out-degree is higher than its in-degree, mainly as an “exporter” of the trade embodied carbon network.
Table 2
| (a) 2004 | ||||||||||
|---|---|---|---|---|---|---|---|---|---|---|
| Rank | Out-degree | In-degree | Degree | Betweenness | Closeness | |||||
| 1 | China | 41 | Greece | 22 | China | 50 | China | 384 | Serbia | 557 |
| 2 | Russia | 41 | South Korea | 21 | Russia | 45 | South Korea | 380 | Brunei | 541 |
| 3 | Ukraine | 34 | Turkey | 17 | India | 37 | Saudi Arabia | 366 | Yemen | 533 |
| 4 | India | 29 | Iran | 15 | Ukraine | 36 | India | 317 | Bahrain | 528 |
| 5 | Kazakhstan | 21 | Saudi Arabia | 14 | South Korea | 31 | Poland | 240 | Moldova | 527 |
| 6 | Belarus | 17 | Hungary | 13 | Greece | 25 | UAE | 234 | Armenia | 527 |
| 7 | Uzbekistan | 15 | Singapore | 13 | Kazakhstan | 25 | Turkey | 207 | Kyrgyzstan | 523 |
| 8 | Indonesia | 14 | Philippines | 12 | Turkey | 22 | Oman | 198 | Nepal | 522 |
| 9 | Czech Republic | 13 | Poland | 12 | Iran | 22 | Iran | 138 | Macedonia | 521 |
| 10 | Malaysia | 12 | Israel | 10 | Poland | 21 | Greece | 84 | Georgia | 520 |
| (b) 2020 | ||||||||||
|---|---|---|---|---|---|---|---|---|---|---|
| Rank | Out-degree | In-degree | Degree | Betweenness | Closeness | |||||
| 1 | India | 45 | South Korea | 20 | China | 56 | China | 559 | Moldova | 306 |
| 2 | Russia | 44 | Singapore | 20 | India | 52 | Saudi Arabia | 461 | Brunei | 290 |
| 3 | China | 43 | Saudi Arabia | 19 | Russia | 52 | Russia | 374 | Tajikistan | 263 |
| 4 | Kazakhstan | 40 | Philippines | 17 | Kazakhstan | 40 | UAE | 337 | Estonia | 262 |
| 5 | Ukraine | 28 | Romania | 14 | Turkey | 33 | Greece | 292 | Laos | 259 |
| 6 | Turkey | 21 | China | 13 | Ukraine | 31 | Turkey | 260 | Maldives | 259 |
| 7 | Viet Nam | 21 | Serbia | 13 | UAE | 27 | Belarus | 191 | Syria | 259 |
| 8 | Czech Republic | 18 | Belarus | 12 | Poland | 26 | Indonesia | 190 | Yemen | 258 |
| 9 | Iran | 18 | Poland | 12 | Iran | 26 | Qatar | 153 | Nepal | 257 |
| 10 | Malaysia | 16 | Turkey | 12 | Viet Nam | 26 | Pakistan | 145 | Cambodia | 256 |
Centrality measure results.
4.1.4 Carbon leakage among countries along the B&R
To measure the carbon emission embodied in imports and exports among countries along the B&R, this paper calculates the net carbon emission for each country in 2004 and 2020 (Figure 5). Between 2004 and 2020, the net carbon emission landscape among major countries underwent significant transformation. In 2004, the top five emitters were China (145.7 Mt), Ukraine (78.7 Mt), Belarus (54.5 Mt), Russia (51.1 Mt), and Uzbekistan (26.2 Mt). By 2020, however, India had risen to the top (134.06 Mt), followed by Russia (93.42 Mt), Kazakhstan (77.97 Mt), China (59.39 Mt), and Vietnam (31.02 Mt). Net carbon emissions from China, Ukraine, and Belarus decreased substantially, while India, Russia, Kazakhstan, and Vietnam emerged as the new major emitters. This change is closely linked to industrial relocation driven by disparities in carbon emission regulations. Countries like India and Vietnam, leveraging their relatively lenient environmental regulations and lower labor costs, have attracted substantial manufacturing transfers, resulting in a sharp rise in net carbon emissions. Meanwhile, China has seen a decline in net carbon emissions due to industrial offshoring and domestic low-carbon transition. Ukraine and Belarus have gradually exited the ranks of high emitters through industrial restructuring and tightened regulations. This process profoundly reflects the phenomenon of carbon leakage in the context of global industrial relocation.
Figure 5
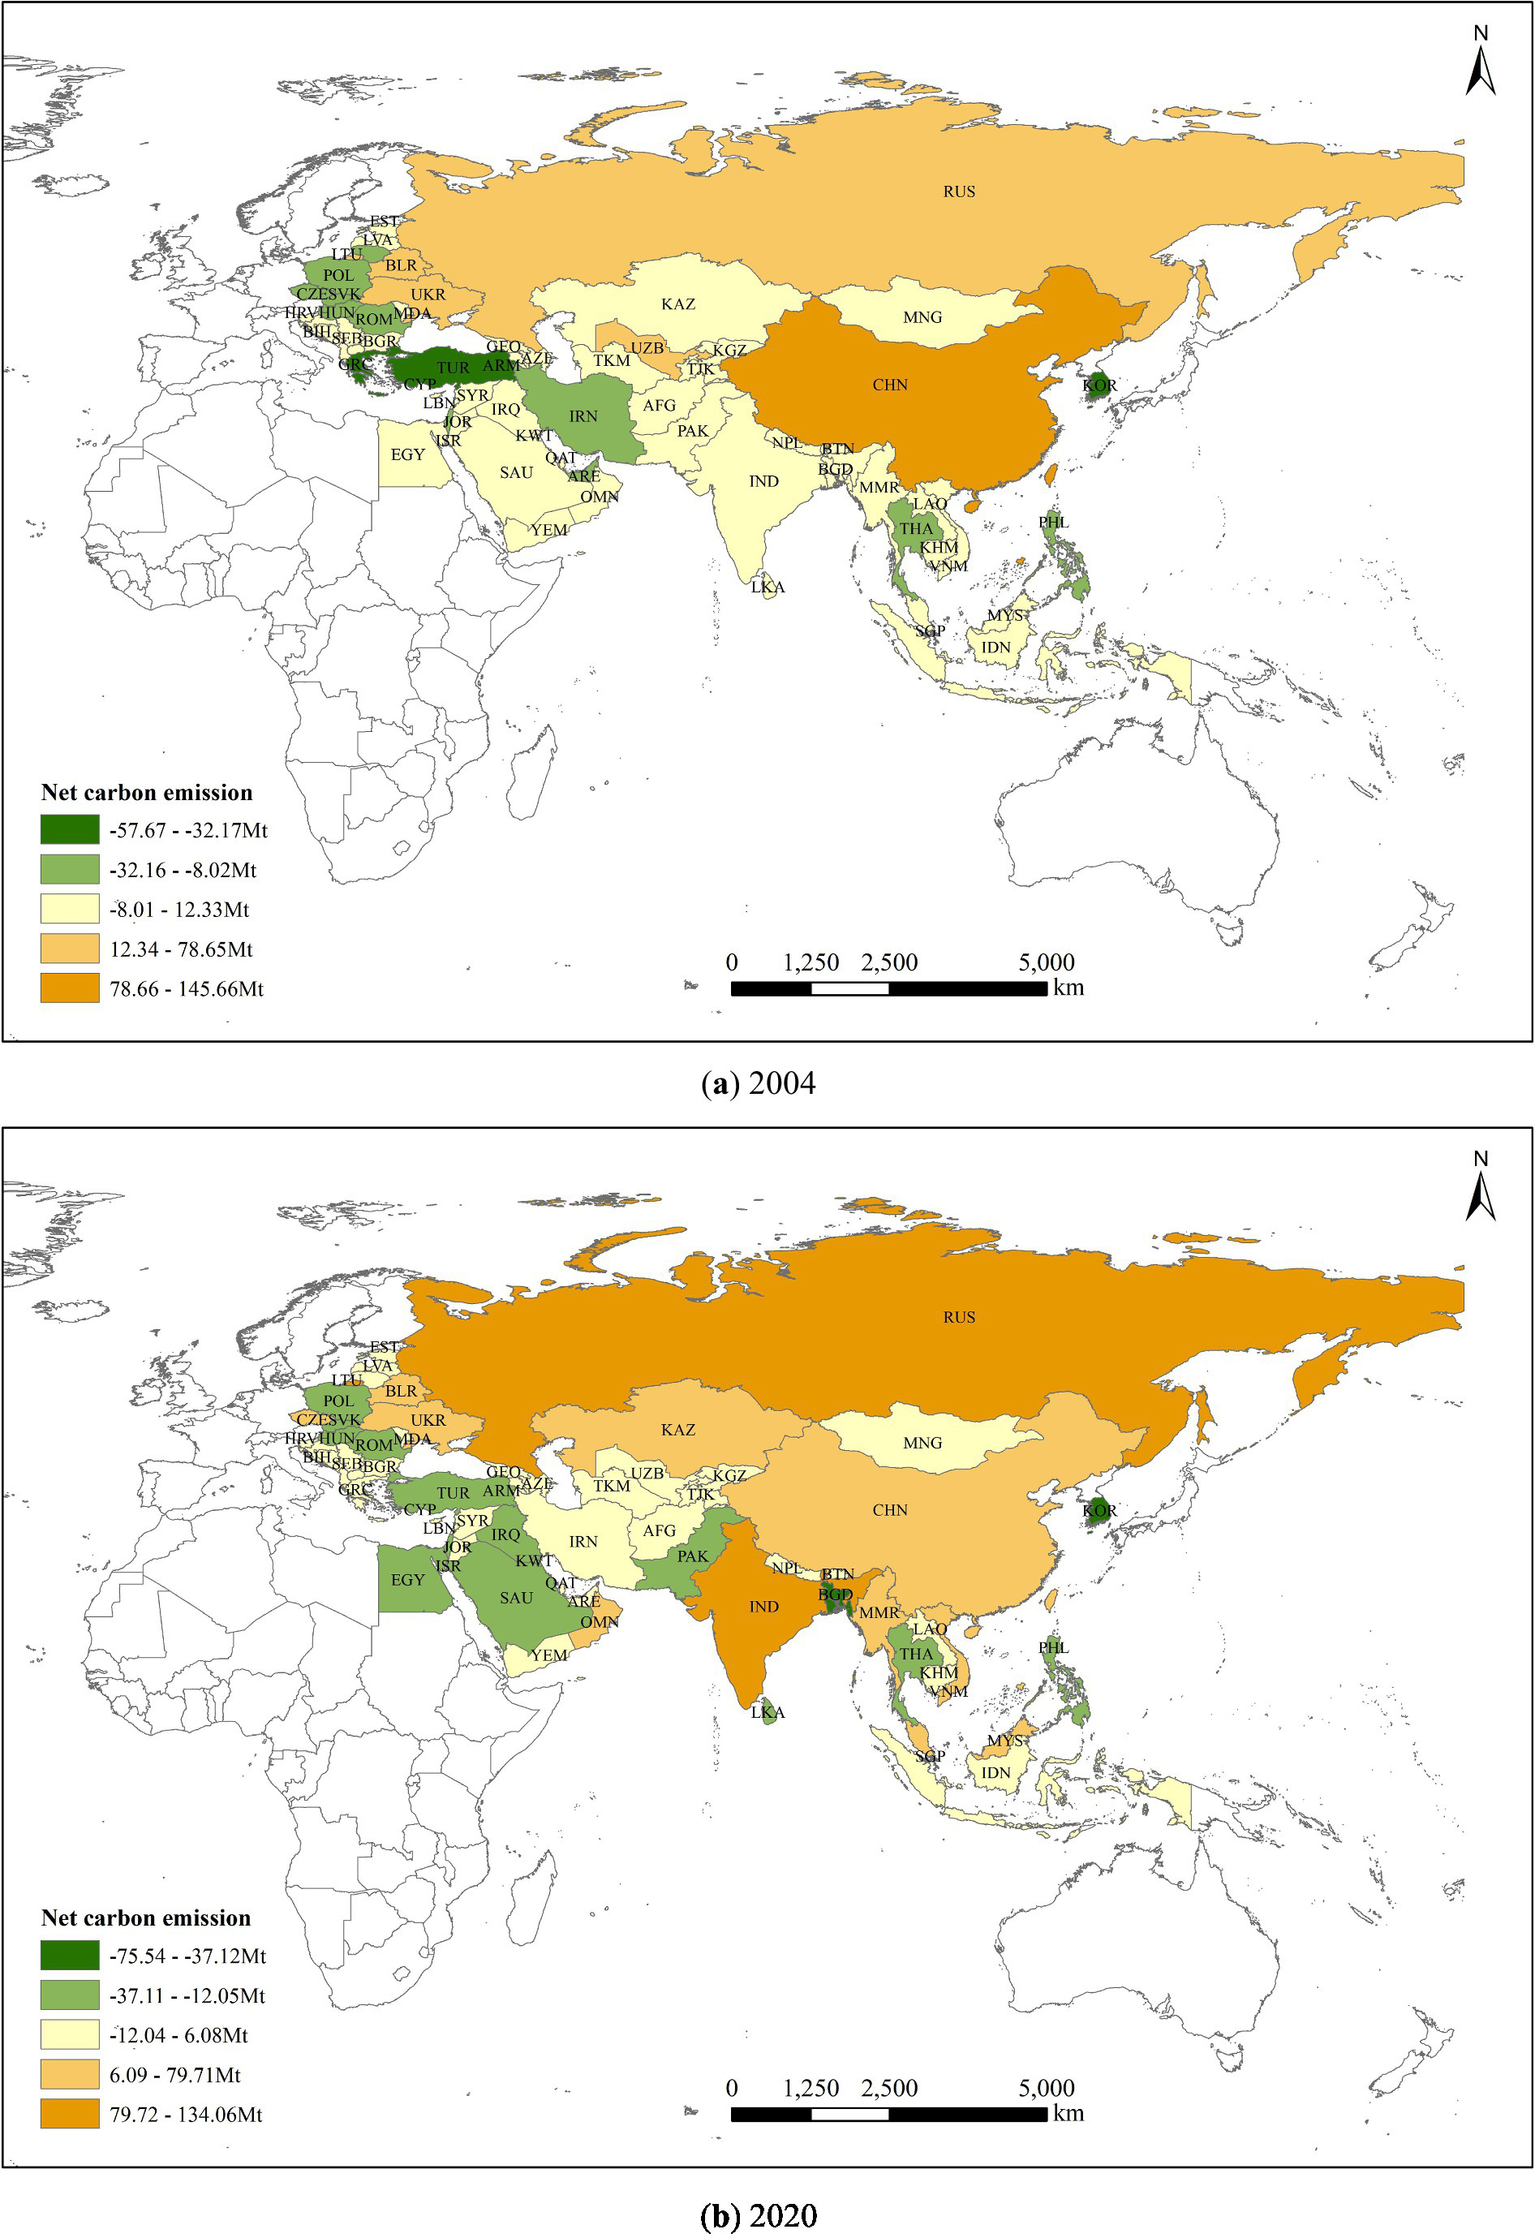
Net carbon emission of the B&R countries in 2004 and 2020.
4.2 Evolution of the industrial embodied carbon network
4.2.1 Carbon emissions transfer between China and other countries from the industry perspective
Figure 6 indicates the carbon emission export and import between China and some major trading countries. Among the 26 industrial sectors, the Electricity, gas and water (I13) is the largest carbon import and export industry for China with the amount of 187.12 Mt. carbon emission exports and 63.34 Mt. carbon emission imports in 2020, which is almost doubled compared to 2004. The results also confirm the close relationship between water, energy and carbon in the production and consumption processes (Tian et al., 2022). Between 2004 and 2020, China’s embodied carbon exports to India surged by 240%, while imports from India grew by 160%. This resulted in a dramatic widening of China’s embodied carbon trade surplus with India, escalating from 7.96 Mt. to 27.47 Mt. In contrast, China’s embodied carbon exports to South Korea exhibited more moderate growth: exports increased by 33%, and imports rose by 27%, leading to a comparatively smaller surplus expansion from 7.7 Mt. to 11.08 Mt. India’s reliance on Chinese production systems for energy- and water-intensive goods has intensified, effectively outsourcing a significant share of its consumption-based emissions to China.
Figure 6
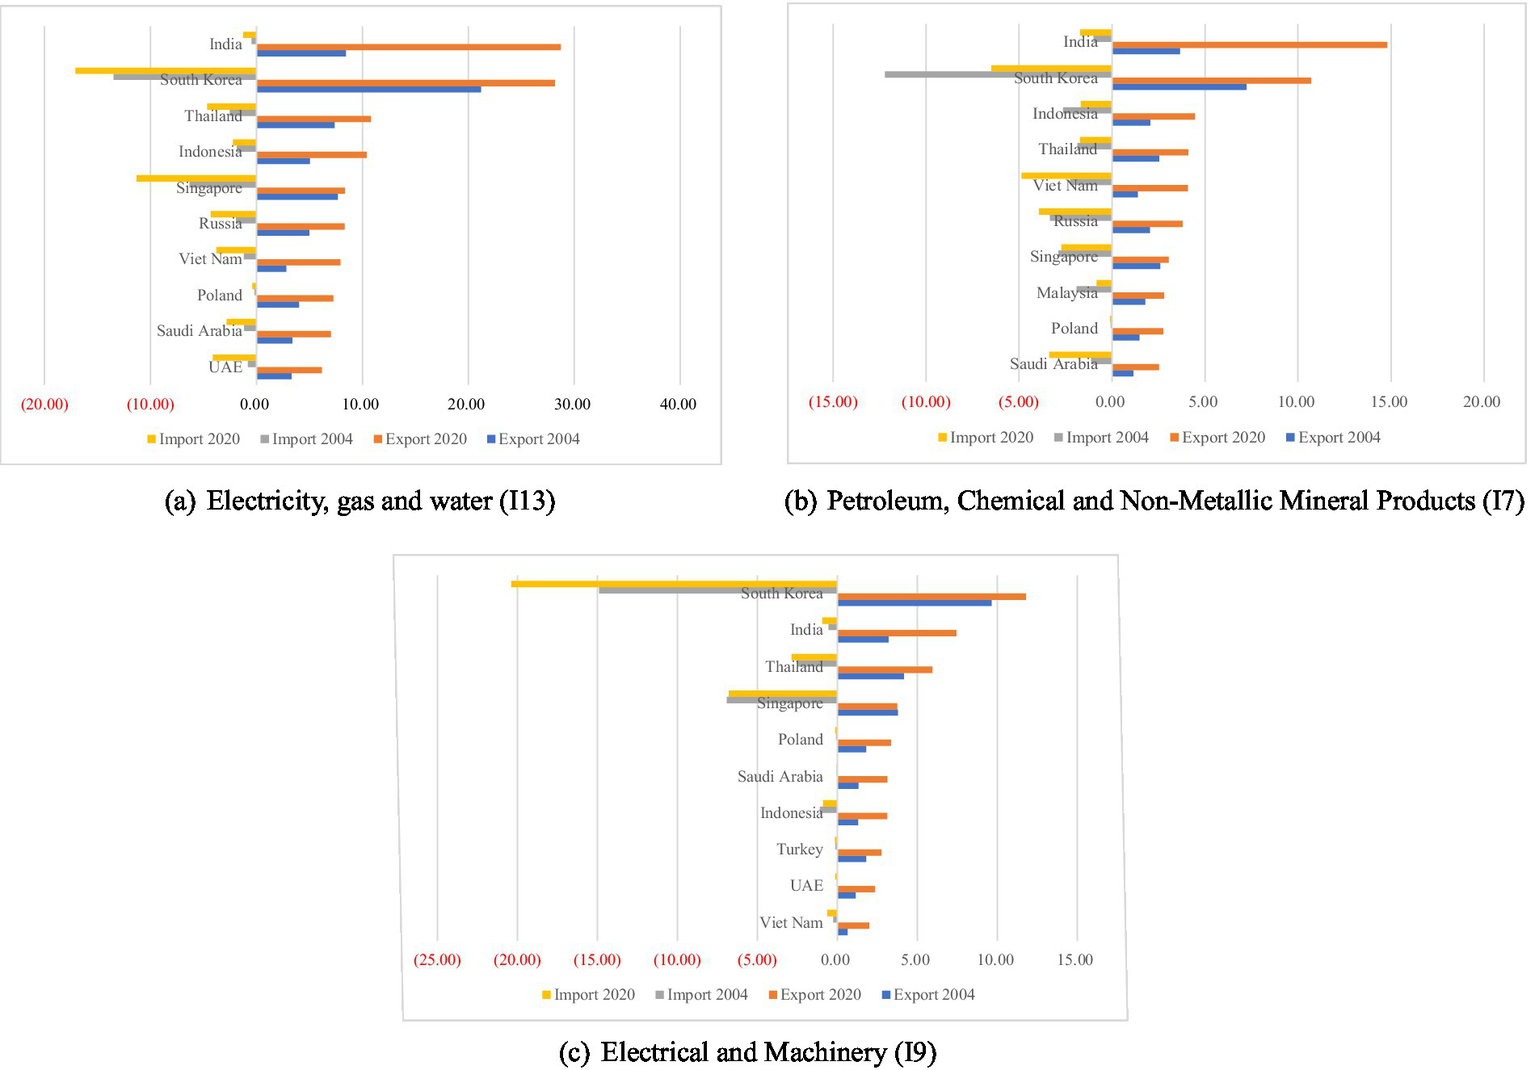
Carbon transfer between China and the B&R countries in I13, I7 and I9 between 2004 and 2020.
Followed by the Electricity, gas and water (I13), the Petroleum, Chemical and Non-Metallic Mineral Products (I7) is the second largest carbon emissions importer and exporter, with a net carbon emission of 38.65 Mt. from China to other B&R countries. China’s embodied carbon exports to South Korea increased moderately from 7.22 Mt. to 10.71 Mt., while South Korea’s emissions exports to China decreased substantially from 12.2 Mt. to 6.49 Mt., indicating a reversal of the carbon flow direction between these nations. Conversely, China’s embodied carbon exports to India surged dramatically from 3.66 Mt. to 14.8 Mt., while India’s emissions exports to China showed only modest growth from 0.99 Mt. to 1.71 Mt. The asymmetric growth pattern suggests China’s increasing role as a net carbon exporter in South–South trade relations, particularly in energy-intensive industries.
After I13 and I7 sector, the Electrical and Machinery (I9) ranked the third. In 2020, China exported 69.1 Mt. carbon emissions to and imported 41.47 Mt. carbon emissions from other B&R countries. While China’s embodied carbon exports to South Korea increased by 22.3% (from 9.64 Mt. to 11.79 Mt), South Korea’s emissions exports to China surged more substantially by 36.9% (from 14.89 Mt. to 20.39 Mt), consolidating China’s position as a net importer of carbon-intensive machinery products within this bilateral relationship. Singapore is similar to South Korea in this sector, with 3.04 Mt. of net carbon emissions to China. This contrasts with the sector’s China-India dynamic, where China’s emissions exports to India more than doubled (from 3.2 Mt. to 7.44 Mt), while India’s emissions exports to China grew modestly from 0.55 to 0.94 mt (70.9% increase).
Overall, I13, I7 and I9 are the top three industries with the largest embodied carbon flows from China’s trade with other B&R countries. China is a net carbon emissions exporter for the energy-intensive goods, bearing a large portion of the responsibility for the carbon emissions of consuming countries. Continued growth in China’s net carbon emissions could exacerbate the carbon leakage.
4.2.2 Overall network characteristics and evolution of embodied carbon transfer in interindustry trade of the B&R
From the perspective of industry, this paper measured the embodied carbon transfer of trade among 26 industrial sectors in the countries along the B&R from 2004 to 2020, and built a net embodied carbon transfer network between industries. In order to clearly observe the main embodied carbon relationships in the whole network, the original network is filtered based on the cumulative distribution of edge weights. According to Figure 7, the edges with the largest edge weights that contribute 95% of the sum of all weights in the network are retained. The B&R interindustry trade embodied carbon transfer network is constructed, as shown in Figure 8.
Figure 7
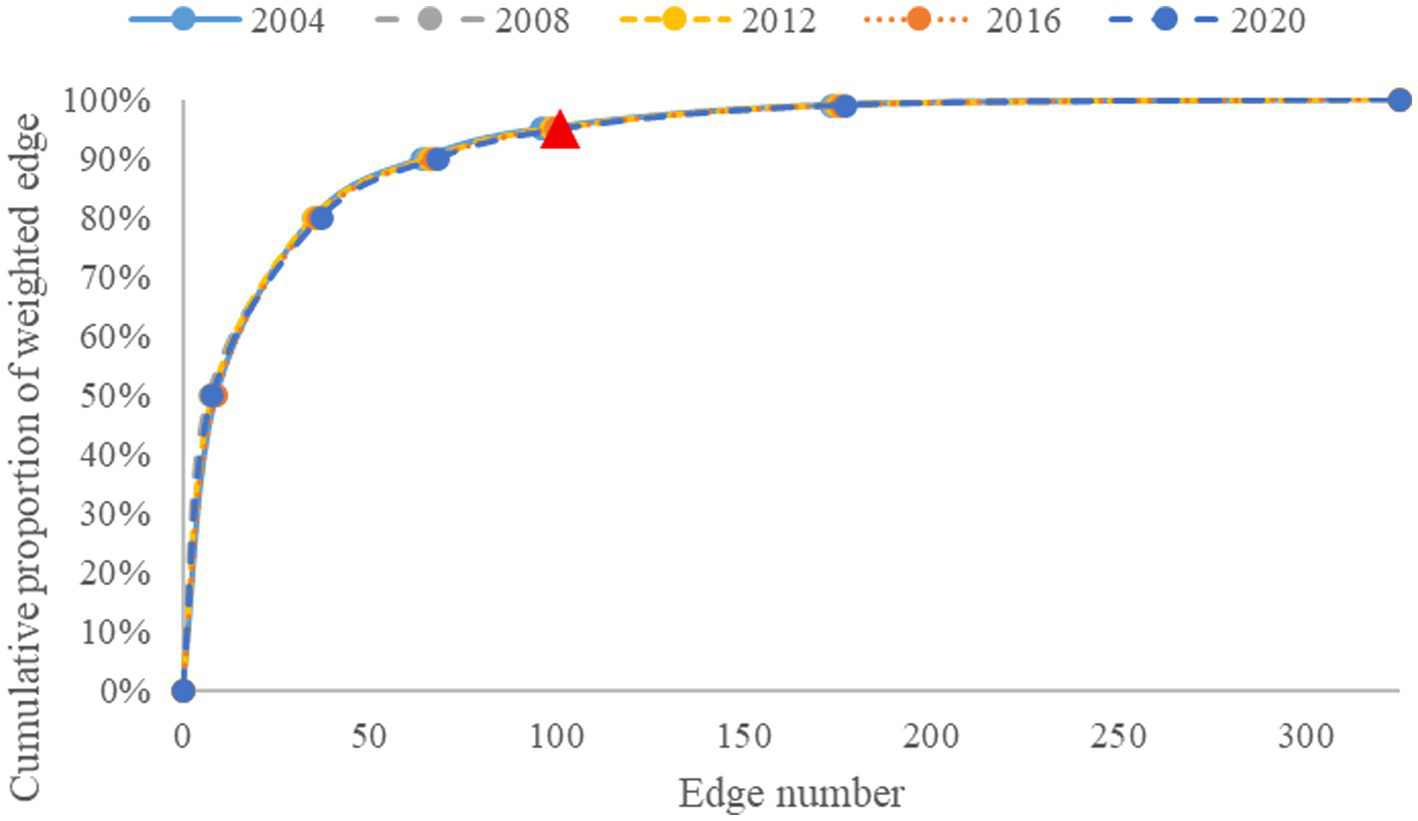
Cumulative distribution of embodied carbon transfers among industries.
Figure 8
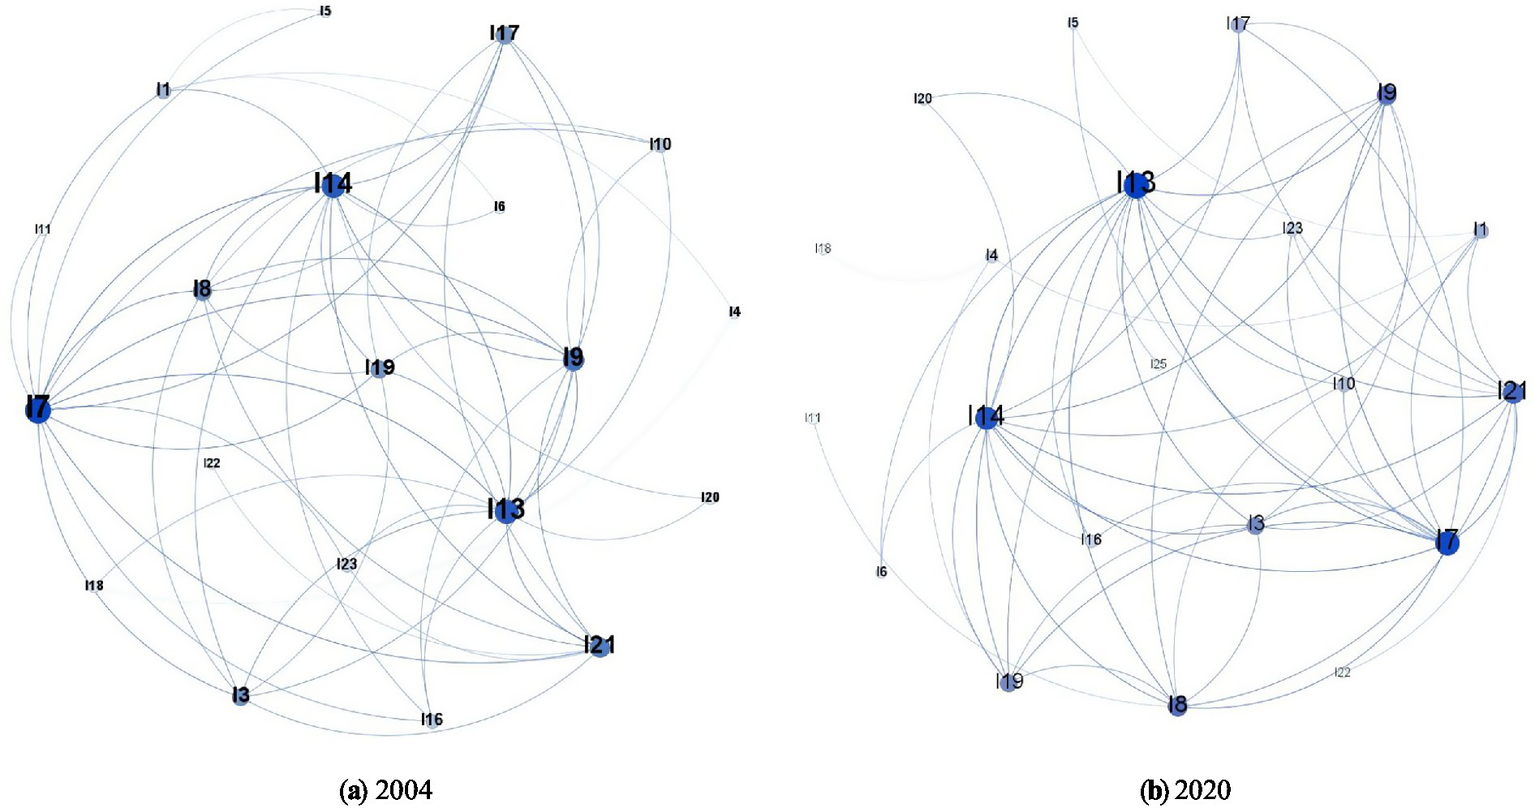
The B&R interindustry trade embodied carbon transfer network in 2004 and 2020.
Figure 8 shows that the B&R trade has formed a strong network among industries. From 2004 to 2020, network density and connectivity continued to increase, and the intensity of net embodied carbon transfer correspondingly increased. Specifically, in 2004, sectors such as electricity, natural gas and water (I13), financial intermediation and business activities (I21), and petroleum, chemical, and nonmetallic mineral products (I7) had larger node shapes, indicating that these three industries have deeper connections with other industries and have significant embodied carbon flow transfers, generating most of the embodied carbon. Fishing (I2), recycling (I12), maintenance and repair (I15), private households (I24), and re-export and re-import (I26) had fewer connections with other sectors, and their impact on the trade embodied carbon network can be ignored. In 2020, the number of nodes remained basically unchanged, and the network relationships became closer. Electricity, natural gas and water (I13), petroleum, chemical, and nonmetallic mineral products (I7), as well as financial intermediaries and business activities (I21), continued to dominate and are closely related to other industrial sectors. The node shape of the construction (I14) had significantly increased compared to 2004, indicating an enhanced core role of the sector in the embodied carbon network, absorbing more embodied carbon. Fishing (I2), recycling (I12), maintenance and repair (I15), private households (I24), and re-export and re-import (I26) remained isolated in the network. The entire network has formed carbon transfer flows centered around electricity, natural gas and water (I13), petroleum, chemical, and nonmetallic mineral products (I7), and construction (I14). In addition, these industries are generally considered as key targets for promoting energy-saving and emission reduction technologies, which is conducive to improving the overall emission reduction efficiency of the production division system.
Figure 9 shows the basic characteristics of the embodied carbon network between industries in 2004, 2008, 2012, 2016, and 2020. The network density of interindustry embodied carbon transfer increased from 0.1477 in 2004 to 0.1538 in 2020, indicating that the interindustry trade links of the B&R have increased. The clustering coefficient increased from 0.329 in 2004 to 0.339 in 2020, indicating an increased clustering effect. The average path length decreased from 2.119 in 2004 to 1.762 in 2020, indicating that a large number of nodes in the network, although not directly connected, can be reached through a few steps.
Figure 9
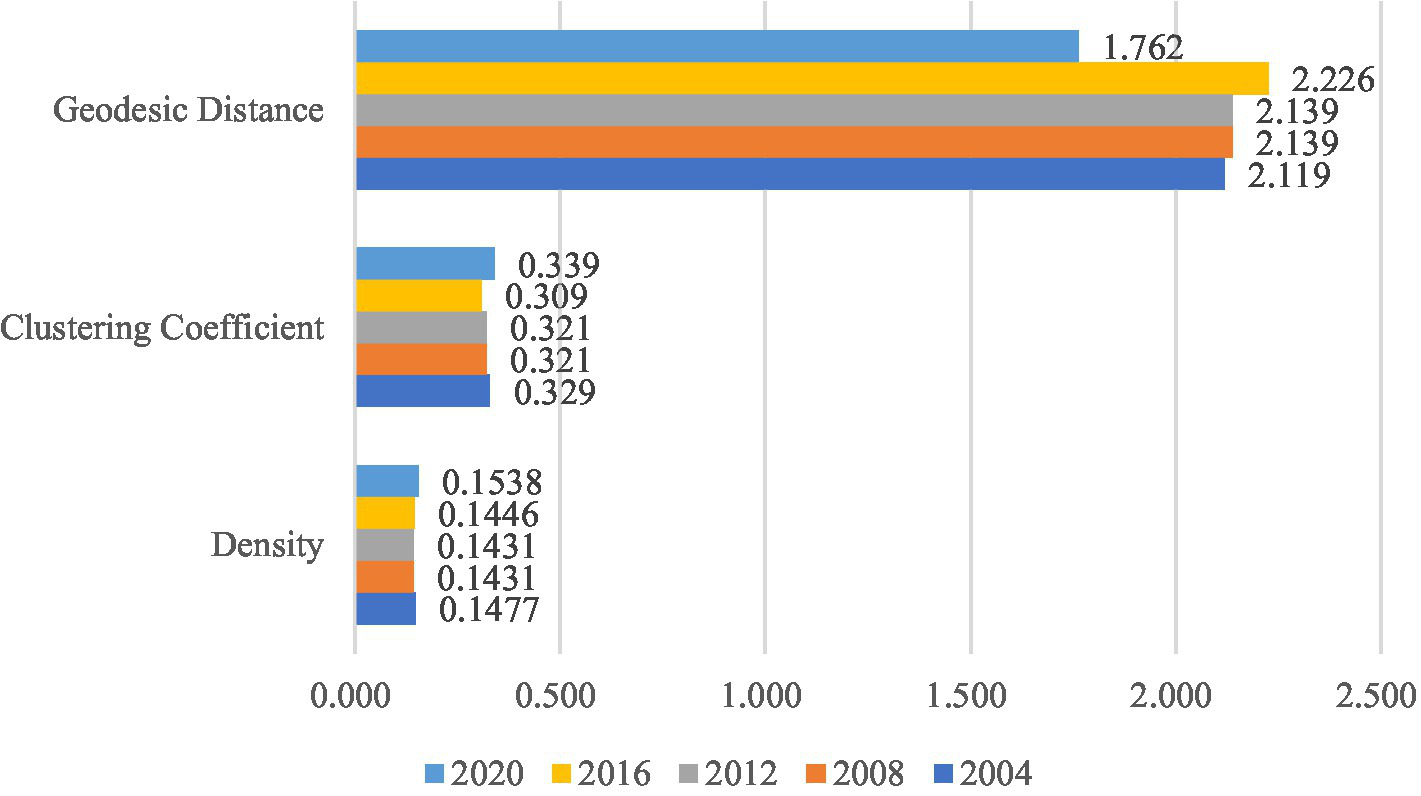
Overall network characteristic indicators of embodied carbon transfer in interindustry trade.
4.2.3 Centrality analysis of the embodied carbon transfer network in the interindustry trade of the B&R
In order to identify the position of 26 industries in the B&R embodied carbon transfer network, this paper measured the centrality of the network (Table 3). Degree centrality is a representation of the degree of closeness between industrial sectors. In 2004, the top 10 industries with degree centrality were electricity, gas and water (I13), financial intermediaries and business activities (I21), petroleum, chemical and non-metallic mineral products (I7), transport (I19), electrical and machinery (I9), construction (I14), metal products (I8), retail trade (I17), agriculture (I1), and food and beverages (I4), which dominated the network. Degree centrality can be subdivided into out-degree and in-degree. The top three industrial sectors in terms of out-degree are electricity, gas and water (I13), transport (I19), and petroleum, chemical and non-metallic mineral products (I7). These sectors are primarily positioned in the upstream segment of the industrial chain. They often directly use fossil energy in the production process and provide products and services to other industrial sectors, providing basic support and guarantees for other industrial sectors. The top three industrial sectors in terms of in-degree are financial intermediaries and commercial activities (I21), construction (I14), and electrical and machinery (I9). These sectors consume less fossil energy directly in the production process and instead use more products or services from other sectors, which are positioned downstream in the industrial chain, requiring support for their production. The betweenness centrality is a representation of the importance of an industrial sector as a bridge connecting other industrial sectors. The top three industrial sectors in the rankings are electrical and machinery (I9), petroleum, chemical and non-metallic mineral products (I7), and mining and quarrying (I3). These industrial sectors play an important regulatory role in the embodied carbon flow network and have strong control over other industrial sectors. Reducing the carbon emissions and intensity of these industrial sectors will help promote overall carbon reduction in the industrial sector. Closeness centrality represents the shortest distance between an industrial sector and other industrial sectors, with higher value industrial sectors located at the periphery of the embodied carbon network, such as re-export and re-import (I26), recycling (I12), and private households (I24), which have a relatively small impact on the overall network. In 2020, the tightness of the embodied carbon transfer network between industries has increased, but the importance of 26 industries in the network has remained basically unchanged. The betweenness centrality of food and beverages (I4) and electricity, gas and water (I13) has significantly increased. Upgrades in processing technology drive increased trade in semi-processed goods, establishing the food and beverages sector as a carbon transfer hub connecting agriculture with consumption. The export of clean energy technologies and implementation of energy transition policies have enabled the electricity, gas, and water sector to become a pivotal transit node for energy-related carbon flows.
Table 3
| (a) 2004 | ||||||||||
|---|---|---|---|---|---|---|---|---|---|---|
| Rank | Out-degree | In-degree | Degree | Betweenness | Closeness | |||||
| 1 | I13 | 17 | I21 | 15 | I13 | 17 | I9 | 55 | I26 | 650 |
| 2 | I19 | 14 | I14 | 11 | I21 | 16 | I7 | 52 | I12 | 650 |
| 3 | I17 | 10 | I9 | 8 | I7 | 15 | I3 | 44 | I24 | 650 |
| 4 | I7 | 9 | I8 | 7 | I19 | 14 | I1 | 27 | I20 | 650 |
| 5 | I16 | 7 | I4 | 7 | I9 | 12 | I18 | 20 | I19 | 650 |
| 6 | I6 | 6 | I5 | 7 | I17 | 12 | I4 | 19 | I15 | 650 |
| 7 | I8 | 5 | I7 | 6 | I8 | 12 | I8 | 17 | I2 | 650 |
| 8 | I1 | 5 | I23 | 6 | I14 | 12 | I6 | 4 | I21 | 625 |
| 9 | I9 | 4 | I10 | 5 | I4 | 10 | I5 | 4 | I22 | 601 |
| 10 | I3 | 4 | I1 | 4 | I1 | 9 | I21 | 2 | I25 | 601 |
| (b) 2020 | ||||||||||
|---|---|---|---|---|---|---|---|---|---|---|
| Rank | Out-degree | In-degree | Degree | Betweenness | Closeness | |||||
| 1 | I13 | 19 | I21 | 15 | I13 | 20 | I4 | 35 | I26 | 650 |
| 2 | I19 | 14 | I14 | 11 | I7 | 16 | I13 | 31 | I12 | 650 |
| 3 | I7 | 10 | I4 | 9 | I21 | 15 | I9 | 25 | I24 | 650 |
| 4 | I17 | 9 | I9 | 7 | I19 | 14 | I7 | 18 | I20 | 650 |
| 5 | I16 | 9 | I8 | 7 | I9 | 12 | I8 | 17 | I19 | 650 |
| 6 | I6 | 6 | I23 | 7 | I14 | 12 | I1 | 15 | I21 | 650 |
| 7 | I9 | 5 | I7 | 6 | I8 | 12 | I3 | 9 | I2 | 650 |
| 8 | I1 | 5 | I1 | 6 | I17 | 11 | I6 | 7 | I15 | 650 |
| 9 | I8 | 5 | I5 | 6 | I1 | 11 | I5 | 2 | I25 | 625 |
| 10 | I20 | 4 | I10 | 5 | I4 | 11 | I18 | 1 | I22 | 600 |
Centrality measure results of embodied carbon transfer networks between industries.
5 Conclusion and implications
This paper applies the social network analysis method, based on the embodied carbon emissions calculated by the input–output model, to build the embodied carbon transfer network of industrial trade among countries along the B&R in 2004, 2008, 2012, 2016 and 2020, comprehensively analyzes the network structure and dynamic evolution of the network, and draws some valuable conclusions.
From 2004 to 2020, carbon emissions among countries along the B&R increased significantly. As the largest carbon emitter, China’s carbon emissions in 2020 doubled compared to 2004. By analyzing the import and export of embodied carbon emissions between China and other countries along the B&R from 2004 to 2020, it can be concluded that the major countries importing carbon dioxide from China are South Korea, India, Thailand, Indonesia, Russia, Singapore, Vietnam and Saudi Arabia. The countries that export more carbon dioxide to China mainly include Russia, India, South Korea, Vietnam, Kazakhstan, Malaysia, Indonesia, Thailand, Iran, etc. China’s exports to other B&R countries are generally larger than its imports.
The countries and regions along the B&R have formed stable network relations. From 2004 to 2020, the network density and clustering coefficient increased significantly, indicating that countries and regions along the B&R have closer trade links and deeper integration of embodied carbon networks. The average path length gradually decreases, indicating that the connectivity of the embodied carbon network is gradually enhanced and the carbon transfer rate is significantly improved. From the measurement results of network centrality, the embodied carbon intensity of trade between countries and regions along the route has increased, and the core position has correspondingly changed. In addition to India, China, and Russia maintaining their core position, the network core position of resource intensive countries such as Ukraine has weakened, while the network core position of emerging economies such as Kazakhstan has significantly increased. China, Russia, UAE, Greece and other countries play the role of bridges and network hubs between countries along the B&R. The recipient countries of carbon leakage are gradually shifting from China to India and Vietnam.
From the perspective of industry, the network density and clustering coefficient increased during the study period, indicating that the interindustry trade links of the B&R are closer and the agglomeration effect is strengthened. The average path length is shortened, and carbon connections between industries can quickly reach, which is in line with the nature of the small world. Changes in carbon emissions in key sectors will bring a chain reaction to upstream and downstream industries, thereby affecting the overall embodied carbon changes in the network. From the measurement results of network centrality, industries such as electricity, gas and water (I13), financial intermediaries and commercial activities (I21), petroleum, chemical and non-metallic mineral products (I7), transport (I19), electrical and machinery (I9), and construction (I14) dominate the network. Specifically, electricity, gas and water (I13), transport (I19), and petroleum, chemical, and non-metallic mineral products (I7) are the main producers of carbon, while financial intermediaries and commercial activities (I21), construction (I14), and electrical and machinery (I9) are the main beneficiaries of carbon. Throughout the entire network, electrical and mechanical (I9), petroleum, chemical and non-metallic mineral products (I7), and mining and quarrying (I3) play important regulatory roles in the embodied carbon flow network and have strong control over other industrial sectors.
Based on the above findings, the policy implications obtained in this paper are as follows.
Firstly, a fair and reasonable carbon emission responsibility accounting system should be established. Trade activities among countries along the B&R will inevitably lead to carbon transfer and leakage. As an initiator of the B&R initiative and a major manufacturing country, most of the commodities exported by China are used to meet final demand around the globe, which leads to the continuous deterioration of domestic environmental quality. The carbon accounting method based on the producer principle makes China bear huge pressure on the international community to reduce carbon emissions. Therefore, it is necessary to grasp the carbon transfer relationship between the country and industry, reasonably define the responsibilities of producers and consumers, establish the principle of “common but differentiated responsibilities” sharing, and build a fair and reasonable carbon emission responsibility accounting system. Developed countries such as South Korea and Singapore should assume absolute emission reduction targets and provide funding and technology support to other countries. Emerging economies like China and Turkey should focus on reducing carbon intensity and promoting green industrial upgrading, setting carbon peaking timetables. Least developed countries such as Laos should prioritize safeguarding their development rights, receive priority access to funding and technical support, and advance clean energy development and low-carbon agricultural practices.
Secondly, from the perspective of regional trade, while actively developing economic partnerships with countries along the B&R, China also needs to work with them to formulate policies related to carbon emission reduction and work together to achieve carbon emission reduction goals. In the net embodied carbon transfer network of inter country trade, countries such as China, India, and Russia, which are at the center of the network, should play a demonstrative role in controlling and reducing trade embodied carbon emissions, and actively improving the proportion and efficiency of clean energy use. Among the B&R countries, South Korea, Singapore and Saudi Arabia are net importers of carbon emissions. These countries should be encouraged to actively participate in inter regional trade, assume more production and carbon reduction responsibilities in trade, and provide technical assistance and environmental protection support to exporting countries. China, India, Russia, Kazakhstan and other countries have exported a large amount of carbon emissions through the B&R trade, and these countries have undertaken most of the low-end manufacturing industries. In the future, they should increase innovation investment while developing the economy, and focus on technology upgrading and carbon transformation to improve the overall emission reduction efficiency.
Finally, from the industry perspective, the best ways to reduce carbon emissions in various industries should be actively explored. First, carbon emission management in key industrial sectors should be strengthened. In the embodied carbon transfer network between industries, industrial sectors such as electricity, gas and water, petroleum, chemical and non-metallic mineral products, transport, electrical and machinery, and construction play a core role and serve as “bridges” in the network, and there is embodied carbon exchange with most industrial sectors. Therefore, carbon emission management should be carried out to reduce the inflow and outflow of embodied carbon through optimizing production capacity scale and layout, increasing the elimination of outdated production capacity, upgrading the technological level, and strengthening the efficient utilization of by-products. Second, implement classified management of carbon emissions. Based on the obvious clustering characteristics of the embodied carbon flow network in the industrial system, formulate and implement carbon reduction strategies by industry. For similar industrial sectors, it is necessary to fully leverage the correlation effect of industrial sectors, promote the overall optimization and upgrading of industrial structure, share products and services, reduce the intensity of material circulation and energy flow, and improve carbon productivity. For the energy supply sector, it is necessary to promote the use of green, low-carbon, and clean production technologies, eliminate outdated processes and equipment, in order to improve the production efficiency of energy products. At the same time, we need to coordinate energy security and green transformation, vigorously develop clean and renewable energy such as photovoltaics, wind power, and hydropower, in order to provide low-carbon and zero carbon energy products. For sectors using high carbon products, it is necessary to establish a low-carbon production concept and use low embodied carbon products as production materials. For example, in the construction sector, energy-saving, low-carbon, and environmentally friendly building materials can be used to reduce dependence on high carbon building materials from the demand side, reduce the inflow of embodied carbon, and thereby force the raw material supply sector to improve the green production level. Third, implement collaborative carbon reduction across the entire industry chain. Comprehensively consider the embodied carbon flow pattern among industrial sectors, select carbon emission reduction paths and strategies from the perspective of the whole industrial system, and take into account the synergistic emission reduction of key sectors with high energy consumption and the whole industrial chain. For upstream industrial sectors in the industrial chain, it is necessary to establish a green production concept, adjust and optimize energy structure, and improve energy efficiency levels to reduce carbon emissions. For downstream industrial sectors in the industrial chain, in addition to strengthening energy conservation and carbon reduction within their own sector, it is necessary to improve the low-carbon access threshold for raw materials through product design, in order to force upstream industrial sectors to engage in energy-saving and carbon reduction behaviors. While ensuring the production activities of various industrial sectors, promote coordinated emission reduction across the entire industry chain.
In summary, this paper analyzes the flow patterns and evolutionary processes of the embodied carbon emission network in trade among B&R countries from both regional and sectoral perspectives. It provides new insights for clarifying carbon emission responsibility allocation, identifying potential carbon leakage risks, and exploring effective pathways for regional collaborative emission reduction. However, some limitations remain in this study with respect to models and data availability. First, we acknowledge the limitations in the raw data of the Eora database, such as the neglect of informal transactions, may cause deviations in carbon footprint calculations. Second, the MRIO model assumes constant production technology and employs an average emission coefficient to calculate embodied carbon emissions, which may result in overestimation of emissions in countries with low carbon intensity and underestimation in those with high carbon intensity. These methodological constraints warrant further refinement in future work.
Statements
Data availability statement
The raw data supporting the conclusions of this article will be made available by the authors, without undue reservation.
Author contributions
YW: Project administration, Conceptualization, Funding acquisition, Writing – review & editing. RZ: Formal analysis, Writing – review & editing, Methodology, Writing – original draft, Validation, Conceptualization. SW: Writing – review & editing, Supervision, Investigation. LW: Writing – review & editing, Validation, Data curation. XD: Data curation, Writing – review & editing, Validation. ZZ: Software, Writing – review & editing, Visualization.
Funding
The author(s) declare that no financial support was received for the research and/or publication of this article.
Conflict of interest
The authors declare that the research was conducted in the absence of any commercial or financial relationships that could be construed as a potential conflict of interest.
Generative AI statement
The authors declare that no Gen AI was used in the creation of this manuscript.
Publisher’s note
All claims expressed in this article are solely those of the authors and do not necessarily represent those of their affiliated organizations, or those of the publisher, the editors and the reviewers. Any product that may be evaluated in this article, or claim that may be made by its manufacturer, is not guaranteed or endorsed by the publisher.
Supplementary material
The Supplementary material for this article can be found online at: https://www.frontiersin.org/articles/10.3389/frsc.2025.1617630/full#supplementary-material
References
1
Branco D. Moura M. Szklo A. Schaeffer R. (2013). Emissions reduction potential from Co2 capture: a life-cycle assessment of a Brazilian coal-fired power plant. Energ Policy61, 1221–1235. doi: 10.1016/j.enpol.2013.06.043
2
Chen W. M. Kang J. N. Han M. S. (2021). Global environmental inequality: evidence from embodied land and virtual water trade. Sci. Total Environ.783:146992. doi: 10.1016/j.scitotenv.2021.146992
3
Chen B. Li J. S. Wu X. F. Han M. Y. Zeng L. Li Z. et al . (2018). Global energy flows embodied in international trade: a combination of environmentally extended input-output analysis and complex network analysis. Appl Energ210, 98–107. doi: 10.1016/j.apenergy.2017.10.113
4
Di Y. A. Cao J. J. Guo Z. C. Khan M. K. (2022). Network evolution and influencing factors of global trade embodied carbon emission. Front. Environ. Sci.10:943939. doi: 10.3389/fenvs.2022.943939
5
Dong D. An H. Z. Huang S. P. (2017). The transfer of embodied carbon in copper international trade: An industry chain perspective. Resour Policy52, 173–180. doi: 10.1016/j.resourpol.2017.02.009
6
Fair K. R. Bauch C. T. Anand M. (2017). Dynamics of the global wheat trade network and resilience to shocks. Sci Rep7:7202. doi: 10.1038/s41598-017-07202-y
7
Fan B. Zhang Y. Li X. Z. Miao X. (2019). Trade openness and carbon leakage: empirical evidence from China's industrial sector. Energies12:1101. doi: 10.3390/en12061101
8
Fan J. L. Zhang X. Wang J. D. Wang Q. (2021). Measuring the impacts of international trade on carbon emissions intensity: a global value chain perspective. Emerg Mark Financ Tr57, 972–988. doi: 10.1080/1540496X.2019.1662783
9
Gutiérrez-Moya E. Lozano S. Adenso-Díaz B. (2020). Analysing the structure of the global wheat trade network: An Ergm approach. Agronomy10:967. doi: 10.3390/agronomy10121967
10
Han M. Y. Lao J. M. Yao Q. H. Zhang B. Meng J. (2020). Carbon inequality and economic development across the belt and road regions. J. Environ. Manag.262:110250. doi: 10.1016/j.jenvman.2020.110250
11
Han M. Y. Yao Q. H. Liu W. D. Dunford M. (2018). Tracking embodied carbon flows in the belt and road regions. J. Geogr. Sci.28, 1263–1274. doi: 10.1007/s11442-018-1524-7
12
Hashimoto S. (2008). Different accounting approaches to harvested wood products in national greenhouse gas inventories: their incentives to achievement of major policy goals. Environ. Sci. Pol.11, 756–771. doi: 10.1016/j.envsci.2008.08.002
13
Hou H. M. Wang J. W. Yuan M. N. Liang S. Liu T. Wang H. Z. et al . (2021). Estimating the mitigation potential of the Chinese service sector using embodied carbon emissions accounting. Environ Impact Asses86:106510. doi: 10.1016/j.eiar.2020.106510
14
Hu Y. Y. Wu W. (2022). Spatiotemporal variation and driving factors of embodied carbon in China-G7 trade. Sustainability14:7478. doi: 10.3390/su14127478
15
Hubacek K. Chen X. Feng K. Wiedmann T. Shan Y. (2021). Evidence of decoupling consumption-based Co2 emissions from economic growth. Adv. Appl. Energy4:100074. doi: 10.1016/j.adapen.2021.100074
16
Kim T. J. Tromp N. (2021). Carbon emissions embodied in China-Brazil trade: trends and driving factors. J. Clean. Prod.293:126206. doi: 10.1016/j.jclepro.2021.126206
17
King L. C. van den Bergh J. (2021). Potential carbon leakage under the Paris agreement. Clim. Chang.165:82. doi: 10.1007/s10584-021-03082-4
18
Kuik O. Hofkes M. (2010). Border adjustment for European emissions trading: competitiveness and carbon leakage. Energ Policy38, 1741–1748. doi: 10.1016/j.enpol.2009.11.048
19
Li W. Liu X. Yuan X. E. Lu C. (2024). Impact of Cbam on carbon emission reduction in global steel foreign trade: projections based on the embodied carbon emission intensity of major countries. Energy Sources Part B19:443. doi: 10.1080/15567249.2024.2360443
20
Li Z. Y. Wang X. Q. (2023). Analysis of the influencing factors of China's coal life-cycle carbon emissions based on Lmdi-Lca. Environ Dev Sustain26, 17383–17405. doi: 10.1007/s10668-023-03343-5
21
Lu Q. L. Fang K. Heijungs R. Feng K. S. Li J. S. Wen Q. et al . (2020). Imbalance and drivers of carbon emissions embodied in trade along the belt and road initiative. Appl. Energy280:115934. doi: 10.1016/j.apenergy.2020.115934
22
Lu H. P. Xu Y. Z. Wang W. Zhao J. B. Li G. D. Tian M. K. (2023). Can China reach the Co2 peak by 2030? A forecast perspective. Environ. Sci. Pollut. R.30, 123497–123506. doi: 10.1007/s11356-023-30812-1
23
Lv K. J. Feng X. Kelly S. Zhu L. Deng M. Z. (2019). A study on embodied carbon transfer at the provincial level of China from a social network perspective. J. Clean. Prod.225, 1089–1104. doi: 10.1016/j.jclepro.2019.03.233
24
Peng P. Lu F. Cheng S. F. Yang Y. (2021). Mapping the global liquefied natural gas trade network: a perspective of maritime transportation. J. Clean. Prod.283:124640. doi: 10.1016/j.jclepro.2020.124640
25
Peng H. R. Qi S. Z. Zhang Y. J. (2021). Does trade promote energy efficiency convergence in the belt and road initiative countries?J. Clean. Prod.322:129063. doi: 10.1016/j.jclepro.2021.129063
26
Peng S. J. Zhang W. C. Sun C. W. (2016). Environmental load displacement' from the north to the south: a consumption-based perspective with a focus on China. Ecol. Econ.128, 147–158. doi: 10.1016/j.ecolecon.2016.04.020
27
Reilly J. Stone P. H. Forest C. E. Webster M. D. Jacoby H. D. Prinn R. G. (2001). Climate change. Uncertainty and climate change assessments. Science293, 430–433. doi: 10.1126/science.1062001
28
Shi J. L. Li H. J. Guan J. H. Sun X. Q. Guan Q. Liu X. J. (2017). Evolutionary features of global embodied energy flow between sectors: a complex network approach. Energy140, 395–405. doi: 10.1016/j.energy.2017.08.124
29
Su B. Ang B. W. Liu Y. (2021). Multi-region input-output analysis of embodied emissions and intensities: spatial aggregation by linking regional and global datasets. J. Clean. Prod.313:127894. doi: 10.1016/j.jclepro.2021.127894
30
Tanaka T. Nagashima F. (2025). Estimating the embodied carbon emissions and economic impacts of the Eu carbon border adjustment mechanism and China's retaliatory measures. J. Environ. Manag.390:126209. doi: 10.1016/j.jenvman.2025.126209
31
Tian P. P. Feng K. S. Sun L. X. Hubacek K. Malerba D. Zhong H. L. et al . (2024a). Higher total energy costs strain the elderly, especially low- income, across 31 developed countries. Proc. Natl. Acad. Sci. USA121:1121. doi: 10.1073/pnas.2306771121
32
Tian P. P. Lu H. W. Reinout H. Li D. Zhang K. L. Yang Y. Y. (2022). Water-energy-carbon nexus in China’s intra and inter-regional trade. Sci. Total Environ.806:150666. doi: 10.1016/j.scitotenv.2021.150666
33
Tian P. P. Ma H. Y. Zhang Z. Y. Yu Y. Li D. (2025). China’s current carbon inequality is predominantly determined by capital disparity. Ecol. Econ.230:108515. doi: 10.1016/j.ecolecon.2024.108515
34
Tian P. P. Zhong H. L. Chen X. J. Feng K. S. Sun L. X. Zhang N. et al . (2024b). Keeping the global consumption within the planetary boundaries. Nature635, 625–630. doi: 10.1038/s41586-024-08154-w
35
Wang G. F. Guo Q. Y. Zhou X. S. Zhang F. (2023). Spatial correlation network characteristics of embodied carbon transfer in global agricultural trade. Environ. Sci. Pollut. R.30, 2315–2328. doi: 10.1007/s11356-022-22337-w
36
Wang C. Huang X. Lim M. K. Tseng M. L. Ghadimi P. (2020). Mapping the structural evolution in the global scrap copper trade network. J. Clean. Prod.275:122934. doi: 10.1016/j.jclepro.2020.122934
37
Wang Y. F. Yao J. M. (2022). Complex network analysis of carbon emission transfers under global value chains (vol 39, pg 47673, 2022). Environ. Sci. Pollut. R.29:65886. doi: 10.1007/s11356-022-22085-x
38
Wei Y. M. Chen K. Y. Kang J. N. Chen W. M. Zhang X. Y. Wang X. Y. (2022). Policy and Management of Carbon Peaking and Carbon Neutrality: a literature review. Engineering14, 52–63. doi: 10.1016/j.eng.2021.12.018
39
Wiedmann T. (2009). A review of recent multi-region input-output models used for consumption-based emission and resource accounting. Ecol. Econ.69, 211–222. doi: 10.1016/j.ecolecon.2009.08.026
40
Yang L. Wang Y. T. Wang R. R. Klemes J. J. de Almeida C. Jin M. Z. et al . (2020). Environmental-social-economic footprints of consumption and trade in the Asia-Pacific region. Nat. Commun.11:4490. doi: 10.1038/s41467-020-18338-3
41
Yu B. Y. Zhao Q. Y. Wei Y. M. (2021). Review of carbon leakage under regionally differentiated climate policies. Sci. Total Environ.782:146765. doi: 10.1016/j.scitotenv.2021.146765
42
Zhang Y. J. Zhang K. B. (2018). The linkage of Co2 emissions for China, Eu, and Usa: evidence from the regional and sectoral analyses. Environ. Sci. Pollut. R.25, 20179–20192. doi: 10.1007/s11356-018-1965-7
43
Zhao Y. B. Liu X. F. Wang S. J. Ge Y. J. (2019). Energy relations between China and the countries along the belt and road: An analysis of the distribution of energy resources and interdependence relationships. Renew. Sust. Energ. Rev.107, 133–144. doi: 10.1016/j.rser.2019.03.007
44
Zhou B. Zhang C. Wang Q. W. Zhou D. Q. (2020). Does emission trading lead to carbon leakage in China? Direction and channel identifications. Renew Sust Energ Rev132:110090. doi: 10.1016/j.rser.2020.110090
Summary
Keywords
the belt and road initiative, embodied carbon emissions, multi regional input–output model, social network analysis, carbon emission control
Citation
Wang Y, Zhang R, Wang S, Wang L, Dai X and Zu Z (2025) Carbon flow tracking and network reconfiguration: a network evolution analysis of embodied carbon emissions from belt and road trade under regional and industry perspectives. Front. Sustain. Cities 7:1617630. doi: 10.3389/frsc.2025.1617630
Received
28 April 2025
Accepted
31 July 2025
Published
21 August 2025
Volume
7 - 2025
Edited by
Mengmeng Xu, Nanjing University of Science and Technology, China
Reviewed by
Peipei Tian, Shandong University, China
Natasha Murtaza, University of Agriculture, Faisalabad, Pakistan
Updates
Copyright
© 2025 Wang, Zhang, Wang, Wang, Dai and Zu.
This is an open-access article distributed under the terms of the Creative Commons Attribution License (CC BY). The use, distribution or reproduction in other forums is permitted, provided the original author(s) and the copyright owner(s) are credited and that the original publication in this journal is cited, in accordance with accepted academic practice. No use, distribution or reproduction is permitted which does not comply with these terms.
*Correspondence: Ruohan Zhang, rachelzhang203@163.com
Disclaimer
All claims expressed in this article are solely those of the authors and do not necessarily represent those of their affiliated organizations, or those of the publisher, the editors and the reviewers. Any product that may be evaluated in this article or claim that may be made by its manufacturer is not guaranteed or endorsed by the publisher.