Abstract
Developing the green economy is a fundamental requirement for China’s new development stage, aimed at applying new concepts, building new patterns, and achieving high-quality growth. Guangxi, as a vital engine of China’s green economy, strongly supports this process. This study establishes a green economy evaluation system for Guangxi using the DPSR model, applies the entropy weight-TOPSIS and obstacle degree models to assess its development from 2012 to 2022, and identifies key obstacles. It further analyzes the spatial–temporal heterogeneity of nine major factors through OLS and GTWR models. Findings reveal that Guangxi’s green economy is progressing with a “dual-core” pattern centered on Nanning and Liuzhou, faces significant pressures mainly from the pressure and state dimensions, and experiences varying impacts from key factors across regions and over time. These insights offer theoretical foundations and policy recommendations to improve Guangxi’s green economic development.
1 Introduction
In July 2024, the Central Committee of the Communist Party of China and the State Council issued the “Opinions on Accelerating the Comprehensive Green Transformation of Economic and Social Development,” underscoring that green transformation is essential for achieving high-quality development and a core strategy to address ecological and environmental challenges. The report of the 20th National Congress further stressed that fostering green economic growth and harmony between the economy and ecosystems are vital for the long-term stability and sustainability of China’s development.
In Guangxi, General Secretary Xi Jinping has emphasized the importance of green economic development during three inspection tours since the 18th National Congress, urging Guangxi to pioneer a new path toward green growth. Nevertheless, Guangxi faces significant challenges, including entrenched high-pollution, high-energy-consumption industrial structures, inefficient resource use, severe environmental issues, and uneven green economic development across regions and time periods. There is thus an urgent need to construct a robust evaluation index system to measure Guangxi’s green economy development and to deeply analyze spatial–temporal variations and influencing factors, providing theoretical and practical foundations for policy formulation and strategic planning.
Globally, green economy research has gained prominence in response to escalating environmental concerns. The term “green economy,” first introduced by Pearce et al. (2013) in Blueprint for a Green Economy, addressed the underestimation of environmental and social costs. The United Nations Environment Programmer (UNEP, 2011) defines a green economy as one that improves human well-being and social equity while reducing environmental risks, integrating economic, social, and environmental dimensions.
Recent studies have advanced frameworks for evaluating green economic development. Schmalensee (2012) proposed a model combining traditional economic metrics and environmental indicators. Chen et al. (2019) built a green growth evaluation system using the DPSR model and entropy weight-TOPSIS methods. Other scholars, such as Zhang (2021) and Shang and Xu (2022), designed comprehensive evaluation systems focusing on economic, social, and environmental aspects. Internationally, Hickel and Kallis (2020) suggested a degrowth framework that prioritizes ecological sustainability beyond GDP. Stjepanovic et al. (2022) constructed a Green GDP database for 160 countries over a 50-year period, which corrects the deficiencies of traditional GDP by subtracting the costs of environmental degradation and natural resource depletion to provide a more realistic measure of the green economy.
Methodologically, Gómez-Calvet et al. (2014) were early to combine the directional distance function with the slack-based measure (SBM) model to evaluate energy efficiency in the EU, offering a methodological reference for green economic efficiency research. Hou et al. (2021) reconstructed a green productivity index, while Hu et al. (2024) evaluated green tourism development using super-efficiency SBM models. Research into spatial patterns has also evolved: Lin et al. (2017) explored spatial spillovers using the spatial Durbin model, while Gu and Ge (2018) examined provincial green economy evolution with spatial panel models. International analyses by Robaina-Alves et al. (2025) and Barbier and Burgess (2020) highlighted regional disparities and policy impacts using spatial econometrics.
However, existing studies often focus on national or regional levels, with limited research at the provincial scale, particularly regarding unified evaluation systems and spatial–temporal influencing factors. This gap warrants attention, as research on multi-level governance indicates that sub-national levels play a critical role in translating sustainable development policies into concrete actions (Sandmann et al., 2024). Furthermore, most studies address green economic efficiency rather than development levels, creating gaps in the literature.
This study focuses on Guangxi, constructing a green economic development evaluation system based on the DPSR model across the four dimensions of driving forces, pressures, states, and responses. Crucially, unlike prior work, we apply the Geographically and Temporally Weighted Regression (GTWR) model to comprehensively account for spatial and temporal dynamics in analyzing influencing factors.
The remainder of this paper is structured as follows: Section 2 presents the research methodology and data sources, including the construction of the evaluation system and analytical techniques. Section 3 discusses the results, including the assessment of Guangxi’s green economy development level, identification of obstacle factors, and analysis of influencing factors. Section 4 concludes with policy recommendations.
2 Research methodology and data sources
2.1 Construction of the evaluation index system
Green economic development is an evolving process that requires an evaluation system attentive not only to current drivers and states but also to future development trends (Chen et al., 2019). The DPSR model—an enhancement of the PSR framework initially proposed by the OECD (Adriaanse, 1993) and UNEP (Tong, 2000)—provides a causal-relationship-based structure for systematically assessing interactions between human activities and natural ecosystems across four dimensions: Driving forces, Pressures, States, and Responses (Troian et al., 2021).
Economic development, inherently dynamic, involves the continuous use of ecosystems to meet social needs. High-intensity socio-economic activities often exert negative pressures on ecosystems; however, technological advancements and rising environmental awareness can mitigate these effects, shifting development toward greener pathways without clear-cut boundaries between positive and negative impacts (Halkos, 2023).
In this study, indicators such as registered year-end population and urbanization rate are assigned to the Driving layer, representing socio-economic drivers. Indicators reflecting environmental pressures, including wastewater discharge and industrial sulfur dioxide emissions, are categorized under the Pressure layer. Measures of environmental conditions, such as air quality compliance rate and groundwater resource volume, represent the State layer. Lastly, management responses, including the harmless treatment rate of domestic waste and green coverage rate in built-up areas, are placed in the Response layer.
This integration of socio-economic and environmental factors is consistent with the best international practices. Hickel (2020) emphasizes that effective green economy evaluation must incorporate both economic growth and ecological constraints, while Stern and Stiglitz (2021) advocate frameworks that jointly consider human well-being and environmental sustainability. Our DPSR-based approach aligns with these perspectives, offering a holistic view that accounts for both socio-economic drivers and environmental impacts.
Following the principles of scientific rigor, hierarchical structure, dynamism, and practical operability, and drawing on the work of Tang and Zhang (2020) and Chen et al. (2019), we construct a comprehensive evaluation system for Guangxi’s green economic development, selecting 17 indicators across the four DPSR dimensions (see Table 1).
Table 1
| Target layer | Criterion layer | Indicator layer | Indicator unit | Indicator direction | Indicator weight | Indicator code |
|---|---|---|---|---|---|---|
| Green Economic Growth Indicator System of 14 Cities in Guangxi | Driving Force (D) 0.1797 | GDP | 100 million yuan | + | 0.0780 | D1 |
| Year-end registered population | 10,000 persons | − | 0.0433 | D2 | ||
| Urbanization rate | % | + | 0.0282 | D3 | ||
| Share of secondary industry | % | − | 0.0302 | D4 | ||
| Pressure (P) 0.5025 | Total water consumption | 100 million | − | 0.0492 | P1 | |
| Annual wastewater discharge | 10,000 tons | − | 0.1380 | P2 | ||
| Industrial SO₂ emissions | tons | − | 0.1948 | P3 | ||
| Liquefied petroleum gas supply | tons | − | 0.1204 | P4 | ||
| State (S) 0.2756 | Green coverage area | hectares | + | 0.1674 | S1 | |
| Groundwater resource volume | 100 million | + | 0.0469 | S2 | ||
| Wastewater treatment rate | % | + | 0.0071 | S3 | ||
| Good air quality rate | % | + | 0.0152 | S4 | ||
| Air quality composite index | Index | + | 0.0390 | S5 | ||
| Response (R) 0.0422 | Harmless treatment Rate of household waste | % | + | 0.0058 | R1 | |
| Centralized treatment rate of sewage plants | % | + | 0.0220 | R2 | ||
| Green coverage rate in built-up areas | % | + | 0.0101 | R3 | ||
| Water supply coverage rate | % | + | 0.0043 | R4 |
Guangxi green economy development level evaluation system.
2.2 Research methods
2.2.1 Entropy weight-TOPSIS model
Following the approaches of Zhao C. et al. (2024), Zhao W. et al. (2024), and Zournatzidou et al. (2024) for panel data analysis, this study applies the entropy weight-TOPSIS method to calculate the weights and comprehensive scores for Guangxi’s green economic development evaluation system. Widely adopted in global green economy assessments (Almulhim, 2024), the entropy weight method objectively determines indicator weights based on information variability, while the TOPSIS method evaluates alternatives by calculating their distance from ideal and anti-ideal solutions. As these methodologies are standard, detailed formulas are omitted here for brevity.
2.2.2 Obstacle degree model
To further diagnose obstacles to green economic transition, the obstacle degree model is employed to calculate the obstacle degrees of various indicators and subsystems, helping to identify key barriers and guide adjustments in economic strategies and policies (Zhi and Liu, 2022). This model, similar to applications in sustainable supply chain management research (Mardani et al., 2017), calculates obstacle degrees using the following steps (Yao et al., 2015):
Where , , , and represent indicator deviation, factor contribution, and obstacle degree, respectively. measures the gap between actual and target values, indicates the weight of each indicator, and and quantify the subsystem and individual indicator obstacles, respectively. Here, is the standardized value, with ranges from [1,11], spanning 2012–2022 (11 years), i representing 14 cities in Guangxi, and j covering 17 evaluation indicators.
2.2.3 Geographically and temporally weighted regression model
To capture spatial–temporal heterogeneity in influencing factors, this study employs the Geographically and Temporally Weighted Regression (GTWR) model, an extension of the GWR model that integrates both spatial and temporal dimensions. GTWR enables more accurate mapping of regional variations in green economy drivers, utilizing tools like ArcGIS for spatial visualization. This approach aligns with global practices, such as Ren et al. (2023), who applied spatial regression methods to examine environmental regulation and green innovation in Chinese cities.
Before GTWR estimation, Ordinary Least Squares (OLS) regression is conducted to ensure model robustness, following Zhao et al. (2023). All control variables are introduced, and backward elimination is performed to exclude non-significant factors (Li et al., 2021). The GTWR model is expressed as:
Where: represents the dependent variable of the -th sample; is the observed value of the -th independent variable at the -th sample point; is the number of sample points; is the spatial–temporal coordinate position of the -th sample point; is the regression coefficient of the -th independent variable at the -th sample point; is the spatial–temporal intercept of the i-th sample point; and is the residual.
The GTWR model offers key advantages over traditional methods: it captures spatial and temporal heterogeneity (Fotheringham et al., 2015), provides localized parameter estimates revealing regional differences (Li et al., 2021), and identifies spatial clusters of influencing factors critical for targeted green economy policymaking (Matthews and Yang, 2012).
2.3 Data sources
All indicator data used in this study are sourced from the Guangxi Statistical Yearbook (2013–2023), prefecture-level National Economic and Social Development Statistical Bulletins and Environmental Status Bulletins, and supplemental data provided by the Guangxi Zhuang Autonomous Region Department of Ecology and Environment.
3 Analysis and results
3.1 Evaluation and analysis of Guangxi’s green economic development level
3.1.1 Evaluation and analysis of Guangxi’s green economic development level based on the DPSR model
Based on the entropy weight calculation, the system and indicator weights are summarized in Table 1. The weights for the driving force, pressure, state, and response systems are 0.1797, 0.5025, 0.2756, and 0.0422, respectively. The pressure system holds the highest weight, underscoring its dominant role in evaluating Guangxi’s green economic development level. This indicates that the environmental and resource pressures induced by economic activities are the central concern in assessing green development performance in Guangxi. Conversely, the response system has the lowest weight, suggesting minimal variation across the 14 cities in Guangxi regarding policy and management responses, and implying a regional deficiency in effective green development strategies and policy adaptation.
The relatively high weights of the driving force and state systems highlight the significant influence of socio-economic dynamics and current environmental conditions on green economic development outcomes. This finding aligns with the broader literature: Geels (2011) emphasized that green transitions require not only technological innovation but also shifts in policies, practices, and market structures, while Barbier (2012) noted that rapidly developing regions often struggle to match ecological pressures with adequate policy responses.
At the indicator level, industrial sulfur dioxide emissions carry the highest weight at 0.1948, emphasizing the critical role of air pollution control in Guangxi’s green economic development. This reflects the province’s industrial legacy, characterized by a dominance of heavy industry, high pollution, and energy-intensive sectors (Yang et al., 2023). The second highest weight is green coverage area at 0.1674, highlighting the importance of ecological infrastructure in providing environmental services such as water conservation, air purification, climate regulation, and biodiversity support—factors that foster new green industries like ecological agriculture and eco-tourism (Mo et al., 2024).
In contrast, indicators such as the harmless treatment rate of domestic waste (0.0058) and water supply coverage rate (0.0043) have low weights, suggesting limited variability among cities and less information contribution to distinguishing green development levels.
Similar patterns have been observed in other emerging economies. Sanye-Mengual et al. (2018) found air quality metrics to be among the highest-weighted indicators in assessments of urban green economy potential in Mediterranean cities, while Lu et al. (2016) emphasized the importance of industrial pollution control in the green development of China’s eastern provinces.
3.1.2 Evolution analysis of Guangxi’s green economic development level
Using the TOPSIS method, this study calculates the relative closeness degree (Ci) for Guangxi’s green economic development and its four subsystems from 2012 to 2022 (Figure 1). Following Sun and Jing’s (2012) classification standards, development stages are determined and summarized in Table 2.
Figure 1
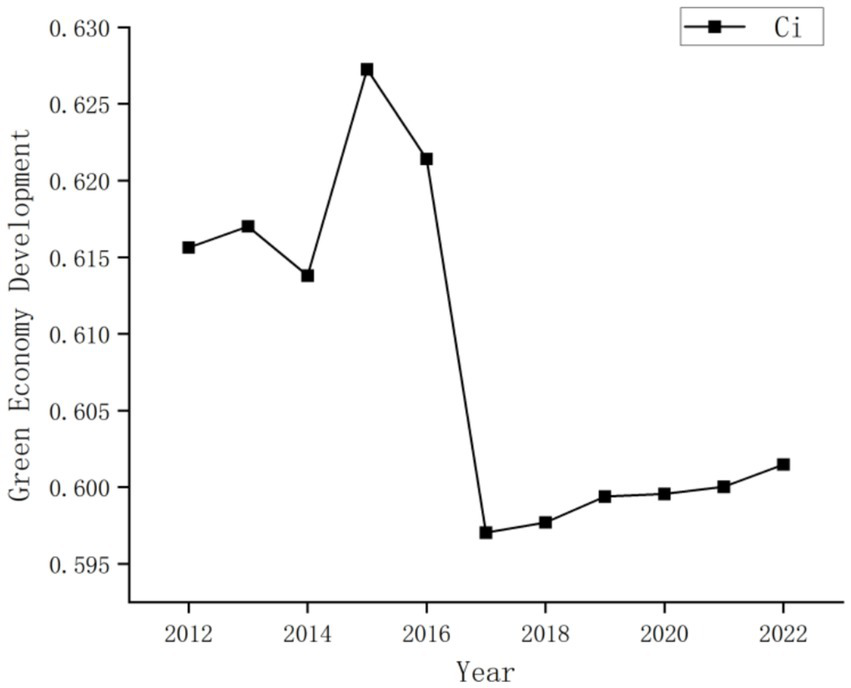
Comprehensive evaluation results of Guangxi’s green economy development level, 2012–2022.
Table 2
| Green economy development level value | [0.0—0.5] | [0.5—0.7] | [0.7—1.0] |
|---|---|---|---|
| Classification | Starting Stage | Development Stage | Mature Stage |
| Cities | Chongzuo | Guilin, Qinzhou, Fangchenggang, Beihai, Hechi, Baise, Yulin, Guigang, Laibin, Wuzhou, Hezhou | Nanning, Liuzhou |
Classification of the level of green economy development in Guangxi.
3.1.2.1 Temporal evolution
Guangxi’s overall green economic development remained within the development stage over the decade, exhibiting modest fluctuations. The Ci rose from 0.6156 in 2012 to 0.6273 in 2015, declined to 0.5970 by 2017, and recovered to 0.6015 by 2022.
Subsystem analysis reveals divergent trends. The driving force subsystem (Figure 2a) showed a steady rise, underpinned by sustained economic growth (7.9% average annual GDP) and increased investment in green technologies, aligning with international observations of economic growth phases fostering green innovation (Borel-Saladin and Turok, 2013; Thi and Do, 2024).
Figure 2
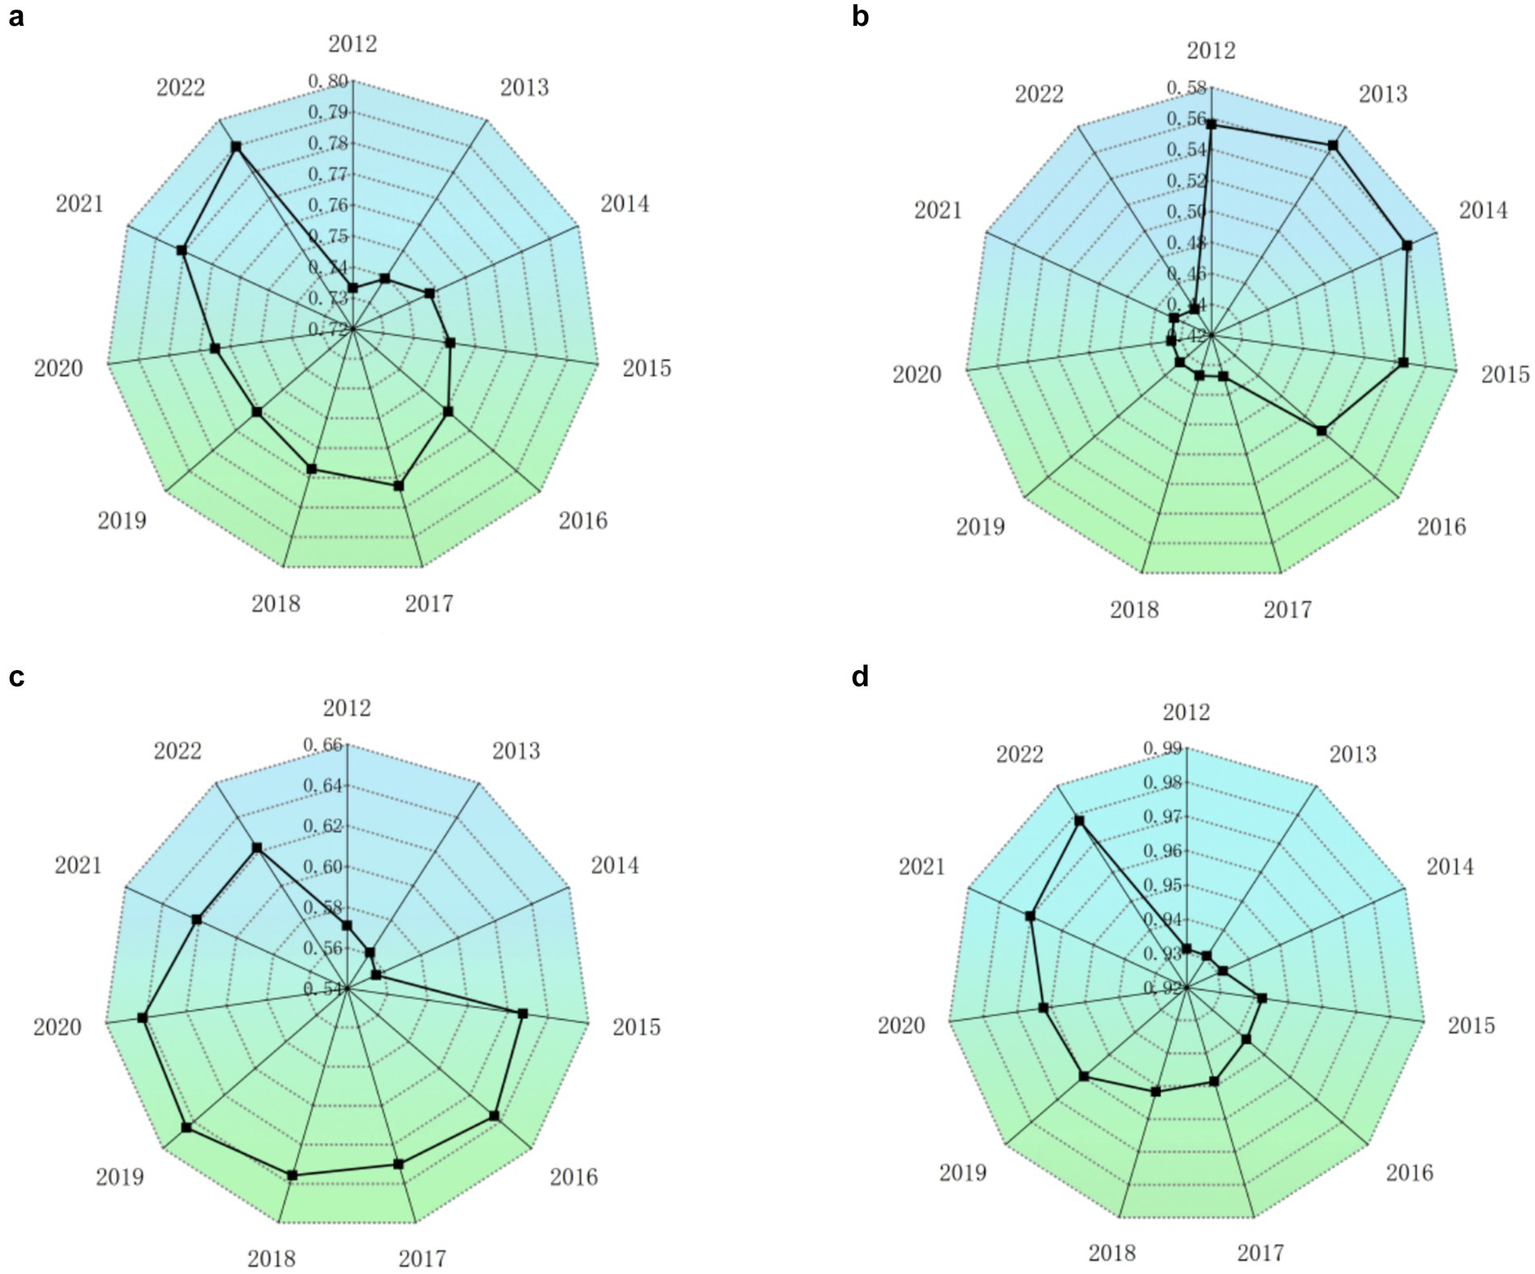
Evaluation results of the level of green economy development of guangxi subsystems, 2012–2022. Panel (a) at the top-left represents the Driving Force dimension; panel (b) at the top-right represents the Pressure dimension; panel (c) at the bottom-left represents the State dimension; and panel (d) at the bottom-right represents the Response dimension.
Conversely, the pressure subsystem (Figure 2b) declined from 0.5559 to 0.4399, reflecting Guangxi’s persistent industrial dependence a pattern consistent with Mathews (2012) and Cosbey (2011), who note that structural transitions away from high-pollution industries are inherently slow.
The state subsystem (Figure 2c) showed initial improvement followed by slight decline, with fluctuations linked to the gradual effectiveness of green policies and recent global economic volatility.
The response subsystem (Figure 2d) exhibited a stable and significant rise, maintaining a mature stage level throughout, demonstrating Guangxi’s commitment to ecological protection and green governance.
3.1.2.2 Spatial evolution
Spatial disparities are evident across Guangxi’s 14 cities (Table 2). A “dual-core” structure emerged, with Nanning and Liuzhou reaching maturity (levels > 0.70), while 79% of the cities remained at the development stage. Chongzuo lagged behind in the starting stage (0.4996).
These patterns mirror broader trends, where green economy development clusters around urban centers with stronger institutional capacity and innovation ecosystems (Demirel et al., 2019; Hansen and Coenen, 2015).
3.2 Diagnosis of obstacle factors for Guangxi’s green economic development level
Building upon the methodology proposed by Shu et al. (2024) and other scholars—who advocate for diagnosing systemic obstacle factors prior to investigating influencing factors—this study employed Equations 1, 2 to calculate and rank the obstacle degrees of 17 evaluation indicators pertaining to Guangxi’s green economic development between 2012 and 2022. Due to space constraints, the top seven indicators were selected for detailed statistical analysis, as presented in Table 3.
Table 3
| Year | Obstacle Factor 1 | Obstacle Factor 2 | Obstacle Factor 3 | Obstacle Factor 4 | Obstacle Factor 5 | Obstacle Factor 6 | Obstacle Factor 7 |
|---|---|---|---|---|---|---|---|
| 2012 | S1/0.2016 | P3/0.1840 | P2/0.1613 | P4/0.1318 | D1/0.0922 | S5/0.0476 | S2/0.0423 |
| 2013 | S1/0.1996 | P3/0.1851 | P2/0.1594 | P4/0.1321 | D1/0.0894 | S2/0.0464 | S5/0.0456 |
| 2014 | S1/0.1955 | P3/0.1902 | P2/0.1581 | P4/0.1366 | D1/0.0856 | S2/0.0489 | S5/0.0455 |
| 2015 | P3/0.2095 | S1/0.1988 | P2/0.1613 | P4/0.1422 | D1/0.0864 | S2/0.0470 | P1/0.0379 |
| 2016 | P3/0.2222 | S1/0.1968 | P2/0.1589 | P4/0.1418 | D1/0.0833 | S2/0.0450 | P1/0.0386 |
| 2017 | P3/0.2542 | S1/0.1878 | P2/0.1527 | P4/0.1352 | D1/0.0765 | S2/0.0471 | P1/0.0382 |
| 2018 | P3/0.2586 | S1/0.1872 | P2/0.1542 | P4/0.1284 | D1/0.0771 | S2/0.0473 | P1/0.0378 |
| 2019 | P3/0.2640 | S1/0.1794 | P2/0.1548 | P4/0.1287 | D1/0.0754 | S2/0.0478 | P1/0.0384 |
| 2020 | P3/0.2659 | S1/0.1790 | P2/0.1496 | P4/0.1285 | D1/0.0737 | S2/0.0483 | P1/0.0417 |
| 2021 | P3/0.2581 | S1/0.2001 | P2/0.1455 | P4/0.1283 | D1/0.0695 | S2/0.0510 | P1/0.0403 |
| 2022 | P3/0.2613 | S1/0.1981 | P2/0.1439 | P4/0.1301 | D1/0.0672 | S2/0.0515 | P1/0.0412 |
Barrier analysis table of evaluation indicators, 2012–2022.
Table 3 illustrates that, throughout 2012–2022, the obstacles impeding Guangxi’s green economic development remained relatively concentrated and stable. These obstacles were primarily located within the “pressure” and “state” layers, with key factors including green coverage area, industrial sulfur dioxide emissions, annual wastewater discharge, and liquefied petroleum gas supply—all exhibiting obstacle degrees exceeding 0.1. During this period, Guangxi experienced rapid industrialization and urbanization; however, the expansion of corresponding environmental infrastructure lagged behind, industrial pollution control technologies remained outdated, and regulatory oversight was insufficient.
As depicted in Figure 3, the trends in obstacle degrees across the eight selected indicators displayed complex fluctuations. Notably, the obstacle degree for industrial sulfur dioxide emissions (P3) remained persistently high and exhibited an upward trajectory, suggesting that sulfur dioxide pollution constituted a major and persistent barrier to Guangxi’s green economic advancement. Conversely, the obstacle degree for the air quality excellence rate (S5) demonstrated a steady decline and, post-2015, fell outside the top seven indicators, indicating progress in air pollution control measures, such as tighter regulation of non-industrial emission sources including vehicular exhaust and dust. Meanwhile, the obstacle degree for green coverage area (S1) showed a fluctuating yet overall rising trend, reflecting early gains in afforestation efforts followed by a subsequent slowdown. The groundwater resource volume (S2) obstacle degree also increased, highlighting the mounting complexity of water resource management challenges. In contrast, the obstacle degrees for GDP (D1), annual wastewater discharge (P2), and liquefied petroleum gas supply (P4) declined, suggesting that improvements in these areas contributed positively to Guangxi’s green economic recovery, underpinned by enhanced wastewater management, optimized energy supply systems, and sustained economic growth.
Figure 3
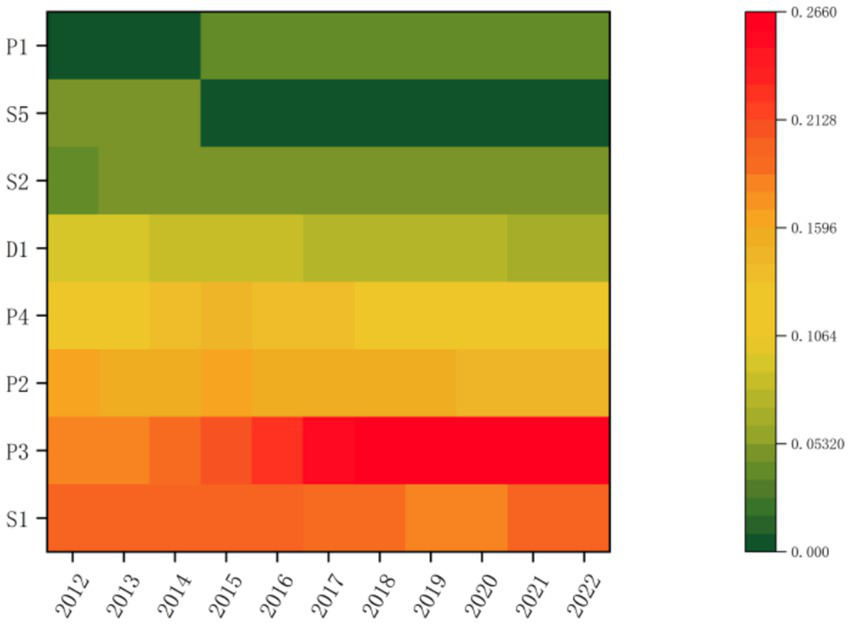
Hot spot map of indicators of barriers to green economy development level in Guangxi, 2012–2022. The x-axis denotes the year, the y-axis represents the evaluation indicators, and the color gradient reflects the degree of obstacle.
These findings align with patterns identified in global sustainability transition research. For instance, Markard et al. (2012) emphasized industrial infrastructure lock-in as a persistent barrier to sustainability transitions worldwide, while Loorbach and Rotmans (2006) noted that in developing economies, environmental governance often lags behind rapid industrialization, leading to temporary spikes in pollution before governance structures adapt.
3.3 Analysis of influencing factors of Guangxi’s green economic development level
Building upon the preceding analysis, and to further investigate the spatiotemporal evolution of influencing factors on Guangxi’s green economic development—as well as to uncover the spatial–temporal heterogeneity of these drivers—this study employed OLS and GTWR models, following the methodological frameworks proposed by Zhao Junwei, Li Jiaxin, and others.
3.3.1 Selection of significant factors based on the OLS model
Initially, a backward stepwise regression was conducted using the OLS model in Stata 17, wherein the significance levels of both the explanatory variables and the dependent variable were evaluated. Through this process, nine key indicators were identified as significant determinants of Guangxi’s green economic development: registered year-end population, urbanization rate, proportion of secondary industry, industrial sulfur dioxide emissions, green coverage area, groundwater resource volume, air quality excellence rate, harmless treatment rate of domestic waste, and centralized treatment rate of sewage treatment plants. The model exhibited a high goodness-of-fit, with an R2 value of 0.9763, and all nine variables demonstrated p-values below 0.1.
To guard against pseudo-regression, a collinearity diagnostic was performed based on the principle of variable independence. Utilizing Stata 17, the variance inflation factor (VIF) analysis revealed an average VIF of 1.53 and a maximum VIF of 1.99, all well below the critical threshold of 5, thus confirming the absence of multicollinearity and the robustness of the selected variables.
This approach to variable selection adheres to established international best practices in econometric modeling of green economy drivers. For example, York et al. (2003) applied comparable stepwise regression methodologies to identify transition factors in developing economies, while Larsen (2018) emphasized the importance of VIF analysis to ensure the integrity of sustainability indicator models within regional development research.
3.3.2 Regression results of the GTWR model
Using ArcGIS 10.8 and the GTWR calculation plugin developed by Huang et al. (2010), further regression analysis was conducted on the previously screened factors, based on the GTWR model shown in Equation 3, with the results presented in Table 4. The findings reveal that the adjusted R2 of the GTWR model is 0.998202, notably higher than that of the OLS model (0.9749), and the AICc value is −990.513, collectively indicating that the GTWR model provides a superior goodness of fit.
Table 4
| Model parameters | Value |
|---|---|
| Bandwidth | 0.140444 |
| ResidualSquares | 0.001382 |
| Sigma | 0.002996 |
| AICc | −990.513 |
| R 2 | 0.998308 |
| R 2 Adjusted | 0.998202 |
GTWR model parameters.
As shown in Table 5, the GTWR regression results display both positive and negative coefficients, with considerable variation in magnitude across regions. This variation further corroborates that the parameter estimates derived from the OLS model merely capture the average characteristics across Guangxi, thereby obscuring the localized dynamics within each of Guangxi’s 14 prefecture-level cities. These results underscore that the relationship between Guangxi’s green economic development level and its influencing factors is not uniformly linear, but rather characterized by pronounced spatial heterogeneity (Zhao et al., 2023).
Table 5
| City | Year | Year-end registered population | Urbanization rate | Share of secondary industry | Industrial sulfur dioxide emissions | Green coverage area | Groundwater resource volume | Good Air quality rate | Harmless treatment rate of household waste | Centralized treatment rate of sewage plants |
|---|---|---|---|---|---|---|---|---|---|---|
| Nanning | 2012 | 0.047 | −0.013 | 0.040 | 0.224 | 0.207 | 0.021 | 0.009 | 0.066 | 0.014 |
| Qinzhou | 2012 | 0.024 | −0.002 | 0.000 | 0.306 | 0.188 | 0.058 | 0.009 | 0.061 | 0.021 |
| Beihai | 2012 | 0.026 | −0.004 | 0.016 | 0.302 | 0.193 | 0.070 | 0.009 | 0.056 | 0.025 |
| Fangchenggang | 2012 | 0.017 | −0.003 | −0.005 | 0.315 | 0.191 | 0.069 | 0.011 | 0.061 | 0.024 |
| Guigang | 2012 | 0.035 | 0.033 | 0.024 | 0.221 | 0.193 | 0.024 | 0.001 | 0.036 | 0.020 |
| Liuzhou | 2012 | 0.072 | 0.035 | 0.060 | 0.218 | 0.165 | 0.019 | −0.009 | 0.023 | 0.038 |
| Guilin | 2012 | 0.052 | 0.035 | −0.007 | 0.272 | 0.220 | 0.048 | 0.012 | −0.001 | −0.011 |
| Wuzhou | 2012 | 0.046 | 0.018 | 0.024 | 0.315 | 0.304 | 0.048 | 0.019 | 0.006 | 0.016 |
| Hezhou | 2012 | 0.043 | −0.010 | 0.019 | 0.299 | 0.400 | 0.042 | 0.018 | −0.004 | 0.006 |
| Baise | 2012 | 0.429 | −0.011 | 0.099 | 0.158 | −0.010 | 0.090 | 0.005 | −0.026 | 0.043 |
| Hechi | 2012 | 0.109 | 0.062 | 0.044 | 0.197 | 0.092 | −0.016 | 0.006 | 0.052 | 0.048 |
| Chongzuo | 2012 | 0.095 | 0.030 | 0.054 | 0.261 | 0.148 | 0.011 | 0.017 | 0.045 | 0.021 |
| Laibin | 2012 | 0.043 | 0.031 | 0.059 | 0.214 | 0.172 | 0.006 | −0.018 | 0.031 | 0.038 |
| Yulin | 2012 | 0.037 | 0.000 | 0.018 | 0.241 | 0.208 | 0.036 | 0.015 | 0.047 | 0.017 |
| … | ||||||||||
| Nanning | 2022 | 0.078 | 0.016 | 0.045 | 0.349 | 0.137 | 0.015 | 0.064 | 0.186 | 0.075 |
| Qinzhou | 2022 | 0.101 | 0.001 | 0.082 | 0.488 | 0.151 | 0.000 | 0.058 | 0.189 | 0.057 |
| Beihai | 2022 | 0.078 | −0.005 | 0.081 | 0.213 | 0.203 | 0.004 | 0.034 | 0.209 | 0.040 |
| Fangchenggang | 2022 | 0.125 | −0.003 | 0.108 | 1.030 | 0.150 | −0.040 | 0.069 | 0.180 | 0.049 |
| Guigang | 2022 | 0.062 | 0.035 | 0.065 | 0.187 | 0.166 | 0.064 | 0.031 | 0.200 | 0.043 |
| Liuzhou | 2022 | 0.070 | 0.086 | 0.039 | 0.211 | 0.124 | 0.070 | 0.016 | 0.204 | 0.019 |
| Guilin | 2022 | 0.096 | 0.009 | 0.044 | 0.221 | 0.322 | 0.037 | 0.018 | 0.217 | 0.018 |
| Wuzhou | 2022 | 0.063 | 0.060 | 0.045 | 0.277 | 0.264 | 0.069 | 0.021 | 0.200 | 0.031 |
| Hezhou | 2022 | 0.057 | 0.051 | 0.045 | 0.345 | 0.308 | 0.065 | 0.022 | 0.202 | 0.029 |
| Baise | 2022 | 0.068 | 0.083 | 0.060 | 0.688 | 0.124 | 0.030 | 0.032 | 0.186 | 0.041 |
| Hechi | 2022 | 0.081 | 0.075 | 0.053 | 0.479 | 0.117 | 0.070 | 0.017 | 0.193 | 0.035 |
| Chongzuo | 2022 | 0.076 | 0.029 | 0.036 | 0.867 | 0.147 | −0.065 | 0.057 | 0.192 | 0.065 |
| Laibin | 2022 | 0.071 | 0.069 | 0.062 | 0.335 | 0.133 | 0.071 | 0.022 | 0.194 | 0.037 |
| Yulin | 2022 | 0.052 | 0.009 | 0.052 | 0.486 | 0.198 | 0.054 | 0.026 | 0.216 | 0.032 |
GTWR model regression results.
The existence of spatial heterogeneity in green economy drivers has similarly been recognized in broader regional studies. For instance, Balland et al. (2019) demonstrated that the effectiveness of green innovation policies varies markedly across regions with different industrial structures and institutional capacities. Likewise, McCauley and Heffron (2018) showed that identical policy instruments can yield divergent green economy outcomes depending on variations in governance structures and resource endowments.
3.3.3 Spatial heterogeneity analysis of influencing factors on Guangxi’s green economic development level
To further explore the variation characteristics and impact intensity of influencing factors in space, based on the regression coefficient results of 9 influencing factors at the beginning (2012) and end (2022) of the period obtained using the GTWR model, the natural breaks method was adopted, and ArcGIS 10.8 was used to visualize the results for more intuitive spatial variation analysis of each influencing factor, as shown in Figures 4, 5. Due to space limitations, this paper selected 5 influencing factors with significant changes from the four criterion layers for the following analysis.
Figure 4
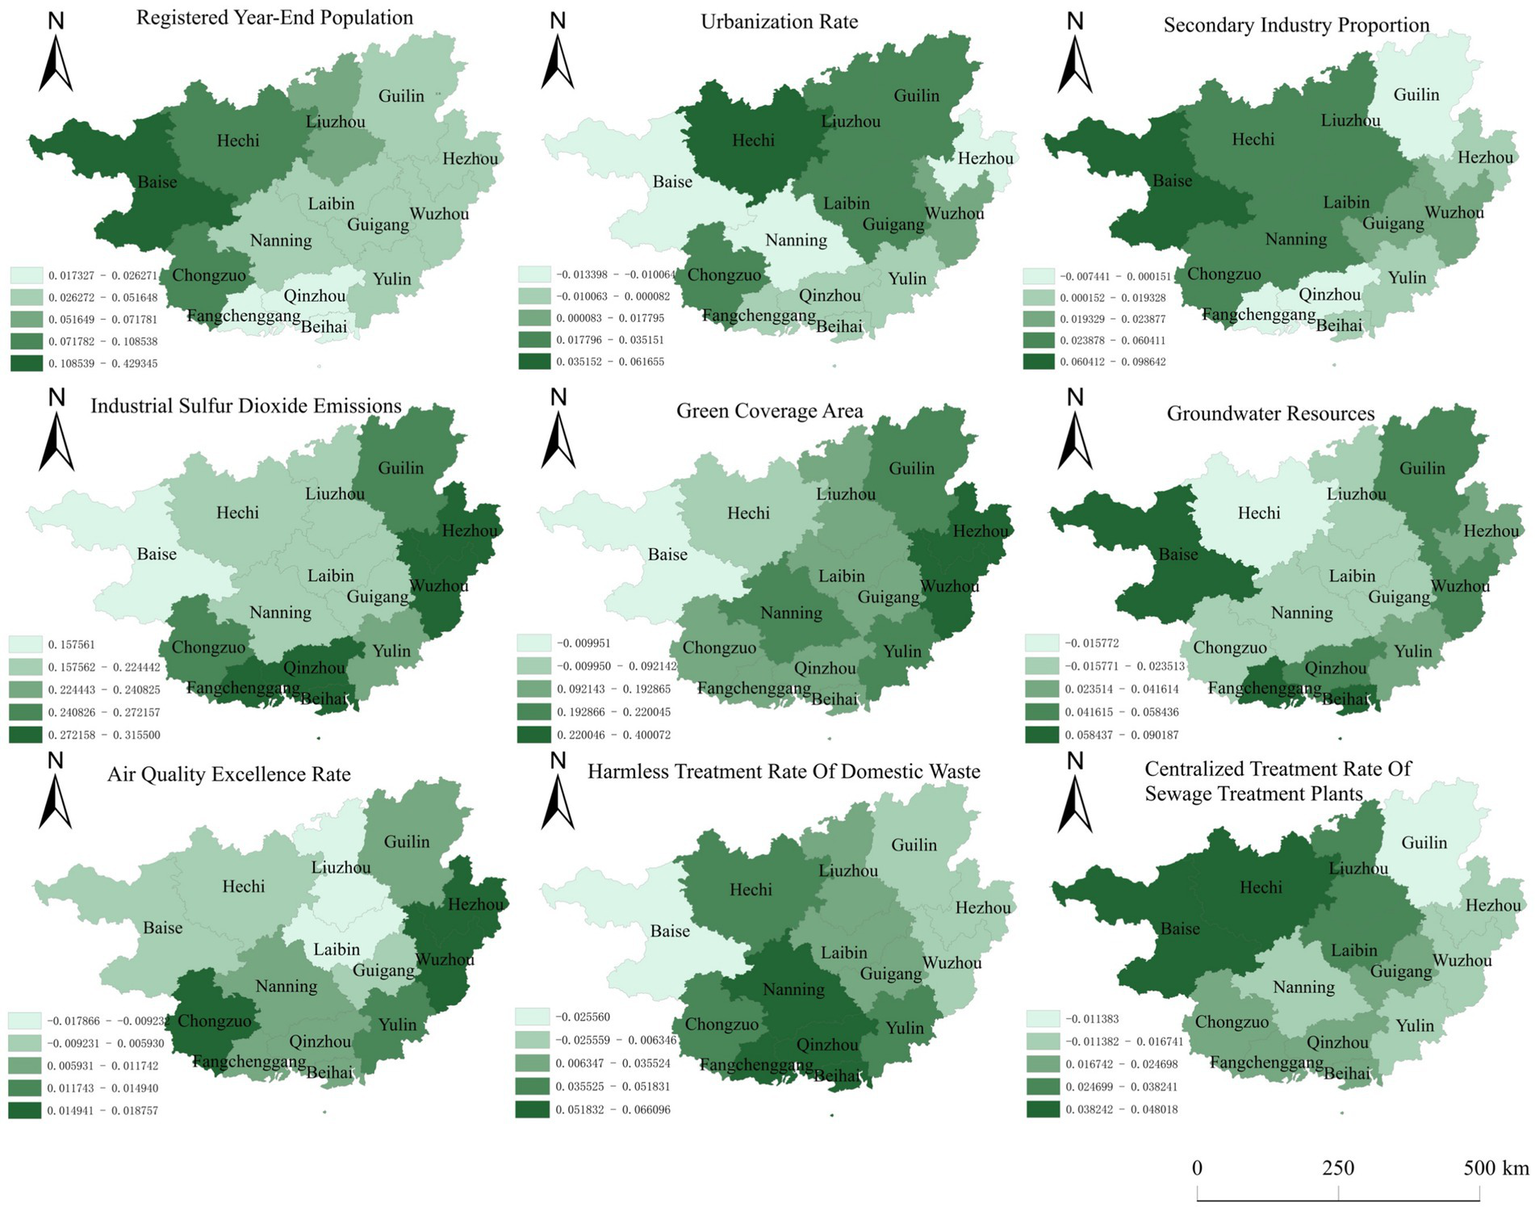
Spatial distribution of regression coefficients for factors affecting green economic development in Guangxi, 2012.
Figure 5
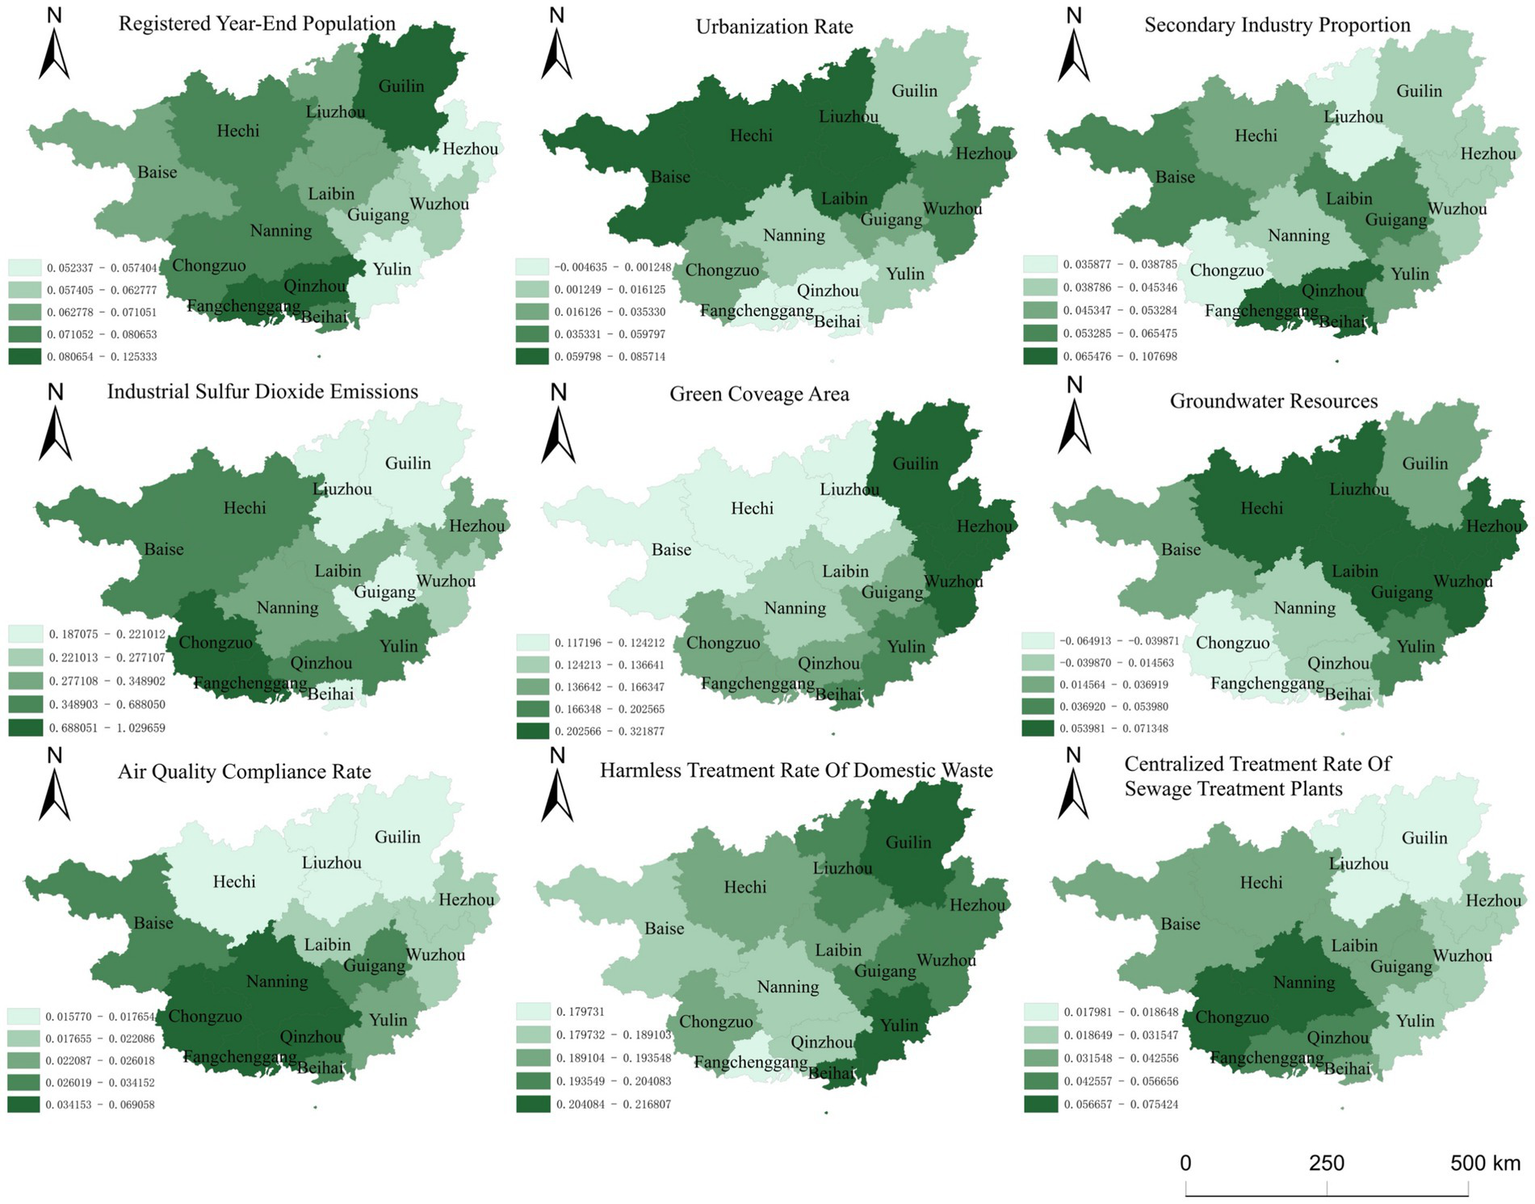
Spatial distribution of regression coefficients for factors affecting green economic development in Guangxi, 2022.
Registered year-end population exhibited notable spatial and temporal dynamics throughout the study period. At the outset in 2012, elevated coefficients predominantly characterized cities such as Hechi, Baise, and Chongzuo, with a discernible gradient showing higher values in western Guangxi relative to eastern regions. By 2022, a general decline in these coefficients was observed, accompanied by an eastward shift of high-value areas; conversely, cities such as Yulin and Hezhou in the east transitioned to lower-value regions. In the “Qinzhou-Beihai-Fangchenggang” corridor, the positive influence of registered population on Guangxi’s green economy intensified, attributable to increased urbanization and demographic influx from western regions. These cities, serving as key gateways to ASEAN, attracted substantial labor and talent, fostering rapid economic growth while promoting green development. The apparent decline in Yulin and Hezhou may reflect their comparatively weaker economic bases, rendering them more susceptible to demographic and developmental shifts. Such spatial population redistribution aligns with international research patterns—Fan et al. (2019) documented similar migration-driven effects on green economies in developing coastal zones, while Chen and Partridge (2013) highlighted initial environmental diseconomies followed by efficiency gains in urbanizing regions due to scale effects.
Regarding industrial sulfur dioxide emissions, the spatial regression coefficients demonstrated an east–west increasing trend in 2012, which reversed by 2022, manifesting a decreasing east–west pattern despite an overall increase in emission levels. This shift likely reflects intra-regional industrial transfers; Guangxi’s ongoing industrial restructuring, characterized by the persistence of traditional, pollutant-intensive industries and transitional technological upgrades, contributed to short-term emission increases. This pattern resonates with Rodrik’s (2014) analysis of industrial pollution during early stages of regional economic restructuring, where pollution often intensifies as industries relocate before subsequent decline, and with Coenen et al. (2015), who identified “pollution haven” effects during industrial transition phases.
The spatial distribution of green coverage area coefficients remained largely consistent over the decade, characterized by low values in the west and high in the east in 2012, with Baise and Hechi exceptions. By 2022, negative coefficients vanished, and these western regions transitioned to positive values. This shift may be attributed to topographical constraints mountainous terrain and limited water resources alongside relatively underdeveloped economies that hinder green infrastructure investments. Literature by Zhang et al. (2021) underscores the influence of terrain on green space efficacy, while Gao and Bryan (2017) note that challenging geography diminishes returns on green infrastructure investments.
Air quality excellence rates displayed a “north low, south high” pattern in 2012, with Baise, Hechi, Liuzhou, and Laibin exhibiting negative coefficients. By 2022, these regions experienced a transition to positive coefficients, reflecting substantial improvements. This change likely results from strengthened environmental regulations and a shift towards ecological industries such as ecological tourism and agriculture. This transformation aligns with Zhang and Crooks (2012), who describe an environmental Kuznets curve in industrial regions, and Barbier (2016), who emphasizes air quality as an indicator of broader green economy advancements.
Centralized Treatment Rate of Sewage Treatment Plants. The centralized sewage treatment rate coefficients were negative in eastern Guangxi cities and Nanning in 2012, indicating limited impact at that stage. By 2022, the negative coefficients disappeared, with Nanning notably increasing its treatment capacity, suggesting enhanced infrastructure investments. Such spatial patterns in wastewater infrastructure effects are consistent with Spirandelli (2015), who observed higher returns in major urban centers with stronger governance, and with the World Bank (2019), which emphasizes the importance of institutional capacity in realizing environmental and economic benefits from wastewater treatment investments.
In sum, these spatial and temporal shifts in population, industrial emissions, green coverage, air quality, and wastewater infrastructure underscore complex interactions between regional development, environmental policies, and geographic factors, reflecting broader patterns identified in international green economy research.
3.3.4 Temporal evolution analysis of Guangxi’s green economic development level influencing factors
Analysis of the GTWR-derived regression coefficients for nine factors from 2012 to 2022 reveals distinct temporal dynamics across multiple layers (Figure 6).
Figure 6
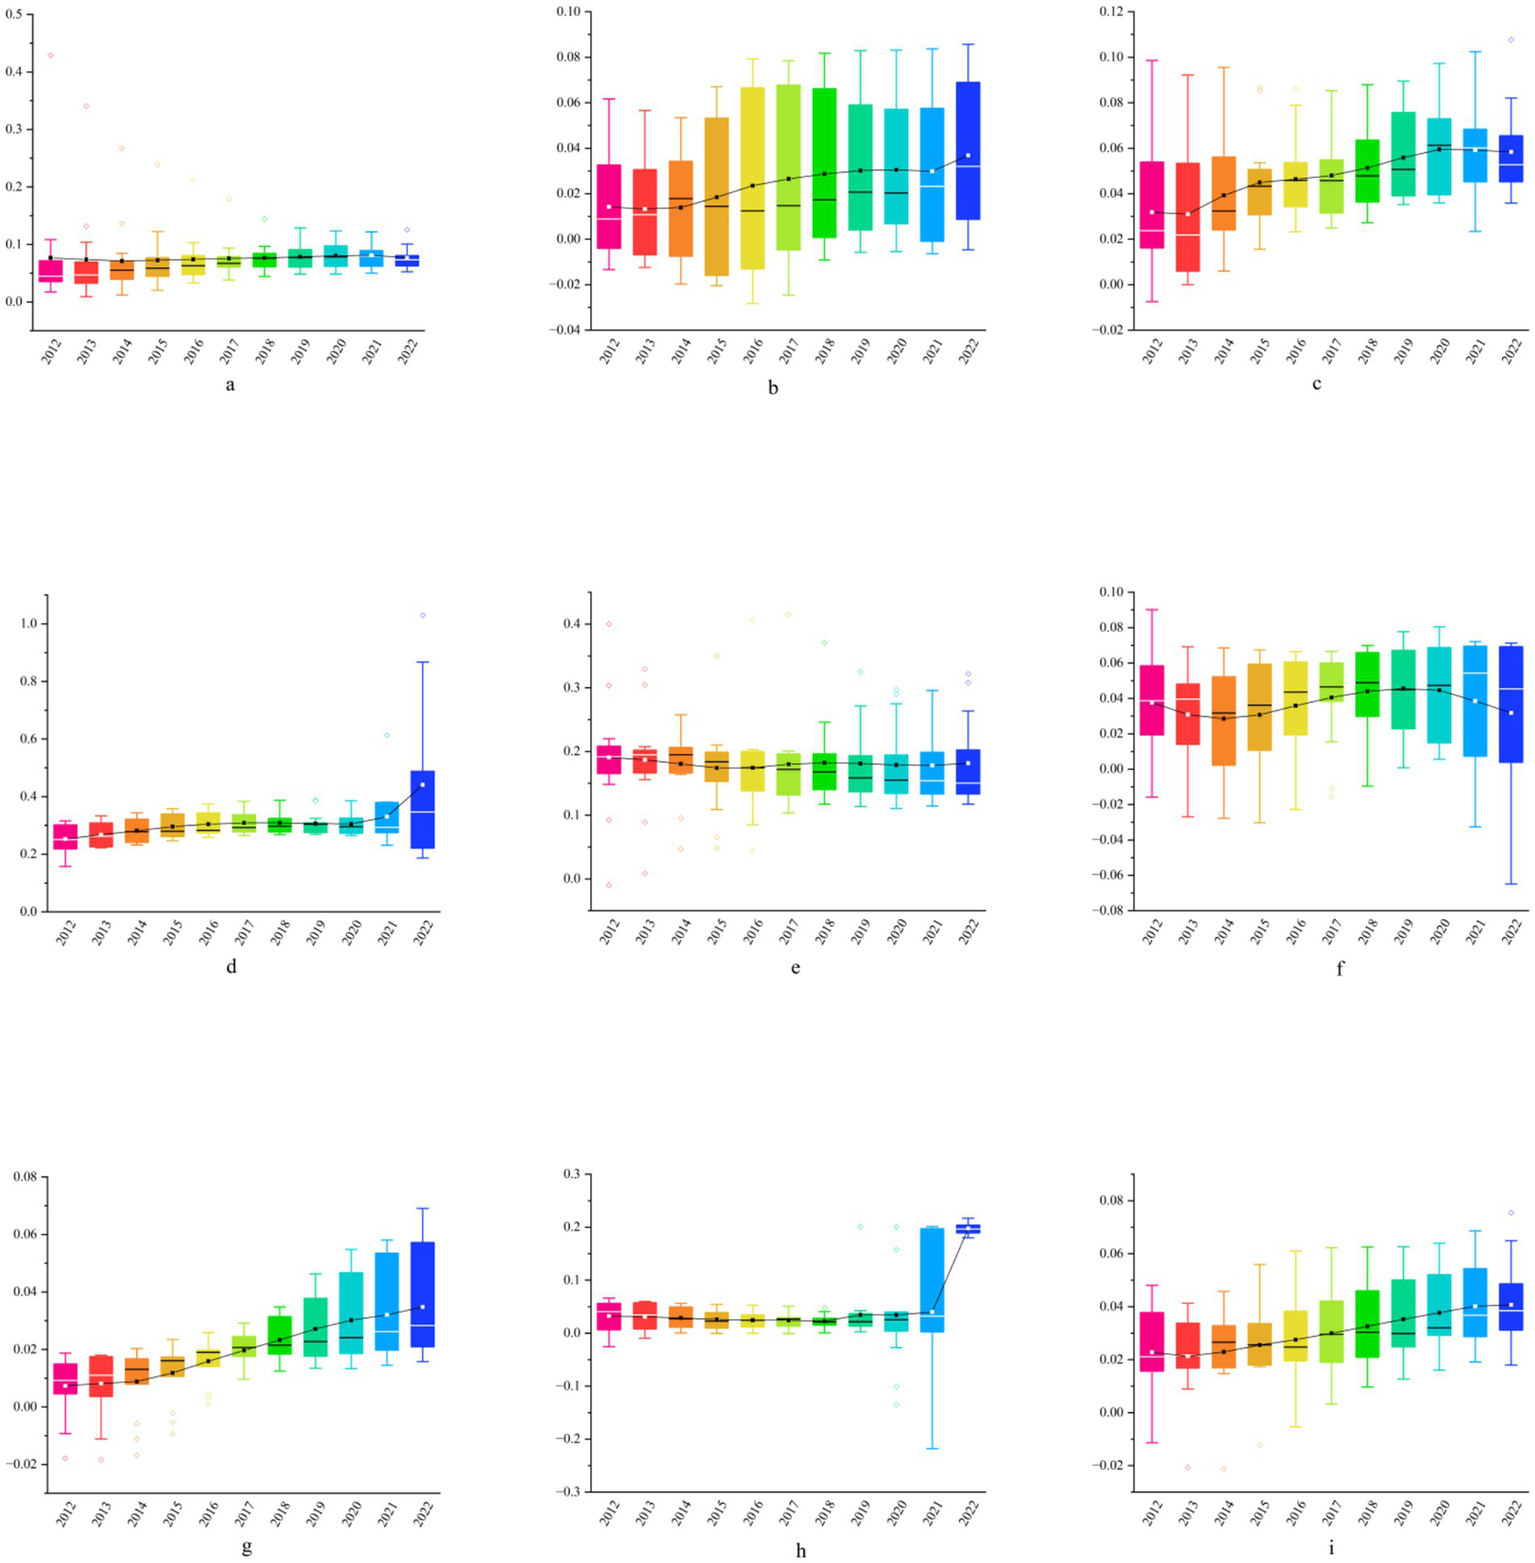
Phase line diagram of regression coefficients of GTWR model for impact factors, 2012–2022. In all nine diagrams, the x-axis represents the year and the y-axis denotes the fitted coefficients. Panel (a) corresponds to year-end registered population, (b) to urbanization rate, (c) to share of secondary industry, (d) to industrial carbon dioxide emissions, (e) to green coverage area, (f) to groundwater resource volume, (g) to good air quality rate, (h) to harmless treatment rate of household waste, and (i) to centralized treatment rate of sewage plants.
In the driving force layer, the registered year-end population’s positive influence on green economic development declined modestly over time, with coefficients predominantly between 0.0 and 0.15, indicating a consistent yet diminishing impact. Urbanization rate exhibited an overall increasing trend in its positive effect, signifying its role as a driver. Conversely, the secondary industry’s impact fluctuated downward; although initially promoting green development, its influence waned post-2021, suggesting that reductions in secondary industry proportion facilitated progress—aligning with international findings where urbanization and industrial restructuring underpin green transitions (Loorbach et al., 2017; Shahbaz et al., 2016).
Within the pressure layer, industrial sulfur dioxide emissions displayed a persistent upward trend in their positive coefficients, implying escalating environmental pressure despite green advancements. This pattern parallels transition models where high-emission industries coexist with emerging green structures (Geels, 2014; Kivimaa and Kern, 2016).
In the state layer, green coverage area maintained a stable, positive influence, supporting its role in promoting green economy growth. Groundwater resource volume exhibited a fluctuating yet positive effect, with nonlinear relationships such as “U” and inverted “U” curves observed between 2012–2016 and 2017–2022, respectively—consistent with the complex thresholds identified by Varis and Kummu (2019). The air quality excellence rate showed a steady upward trend, corroborating research by Derkzen et al. (2017) on the ecosystem service value of urban green infrastructure.
In the response layer, the harmless domestic waste treatment rate remained stable until a marked increase in 2021–2022, intensifying its positive impact. The centralized sewage treatment rate demonstrated a consistent upward trajectory, emphasizing the importance of waste management infrastructure in green economic development. This aligns with global observations that circular economy practices and advanced waste treatment systems serve as catalysts for sustainable growth (Ghisellini et al., 2016; Velenturf and Jopson, 2019).
Overall, these temporal coefficient patterns underscore the evolving influence of socio-economic, environmental, and infrastructural factors on Guangxi’s green economy, reflecting both local dynamics and international transition pathways.
4 Conclusions and recommendations
This study reveals pronounced spatial disparities in Guangxi’s green economic development, characterized by a “dual-core” structure led by Nanning and Liuzhou. Most cities remain at the development stage, while Chongzuo persists in the starting stage, underscoring the need for strategic interventions. Future policy should leverage the leadership of Nanning and Liuzhou by implementing targeted preferential support and encouraging knowledge transfer to surrounding areas through coordinated industrial relocation and infrastructure development, fostering regional green spillovers.
The analysis identifies industrial sulfur dioxide emissions, limited green coverage, and wastewater discharge as primary obstacles, reflecting Guangxi’s continued reliance on heavy industry and the slow advancement of environmental infrastructure. In line with Schot and Geels’ (2008) framework of strategic niche management, efforts should focus on gradually phasing out high-pollution sectors while simultaneously nurturing emerging green industries through regulatory support and innovation incentives.
Employing the GTWR model allowed a nuanced understanding of spatial–temporal heterogeneity among nine influencing factors, highlighting that the impact of drivers varies significantly across both geography and time. This supports the geography of sustainability transitions approach (Coenen et al., 2012), emphasizing the need for regionally tailored strategies rather than uniform policy prescriptions. Specifically, policies should prioritize optimizing population flows, promoting green urbanization, accelerating clean industrial upgrades, and enhancing environmental governance infrastructure, particularly in western Guangxi.
These findings collectively reinforce that achieving comprehensive green economic development in Guangxi requires multi-scalar, context-sensitive policy interventions that address both systemic barriers and localized development needs.
4.1 Theoretical implications
This study offers three key theoretical contributions. First, it proposes an integrated DPSR–GTWR analytical framework. By combining a causally oriented DPSR evaluation system with the Geographically and Temporally Weighted Regression (GTWR) model, the study develops a unified approach that quantifies the roles of drivers, pressures, states, and responses in urban green-economy development while capturing the spatiotemporal heterogeneity of the driving factors. This approach overcomes the limitations of space-invariant or single–time–slice models and provides an explicit geo-temporal perspective for theories of sustainable urban economic transition.
Second, it organically links obstacle diagnosis with mechanism analysis. Before implementing the GTWR regression, the research incorporates the entropy-weight TOPSIS and obstacle-degree models to identify heterogeneous constraints imposed by different influencing factors on urban green economic development. This connection strengthens the theoretical link between transition bottlenecks and policy levers, thereby enriching the conceptual foundation of ecological modernization and studies on urban green economy transformation.
Third, it expands the meso-regional research perspective within the context of emerging economies. Based on prefecture-level empirical evidence from Guangxi, the findings reveal how institutional capacity, industrial structure, and environmental infrastructure co-evolve to shape urban green economic outcomes. This underscores that green transition theory, when applied to developing regions, should systematically account for intra-provincial heterogeneity and the sequencing of policy responses. The proposed framework thus provides a transferable analytical template for green-transition studies in other late-developing regions, particularly where historical development constraints and localized characteristics prevail.
Statements
Data availability statement
The raw data supporting the conclusions of this article will be made available by the authors, without undue reservation.
Author contributions
HY: Visualization, Formal analysis, Data curation, Writing – original draft. ZZ: Writing – review & editing, Validation, Methodology. LP: Supervision, Writing – review & editing. FZ: Funding acquisition, Writing – review & editing. LZ: Writing – review & editing, Supervision.
Funding
The author(s) declare that financial support was received for the research and/or publication of this article. This work was supported by Humanities and Social Sciences Youth Foundation of Ministry of Education of China (grant number: 23XJCGJW001). The National Science Foundation Project of China (grant number: 71662026).
Conflict of interest
The authors declare that the research was conducted in the absence of any commercial or financial relationships that could be construed as a potential conflict of interest.
Generative AI statement
The authors declare that no Gen AI was used in the creation of this manuscript.
Any alternative text (alt text) provided alongside figures in this article has been generated by Frontiers with the support of artificial intelligence and reasonable efforts have been made to ensure accuracy, including review by the authors wherever possible. If you identify any issues, please contact us.
Publisher’s note
All claims expressed in this article are solely those of the authors and do not necessarily represent those of their affiliated organizations, or those of the publisher, the editors and the reviewers. Any product that may be evaluated in this article, or claim that may be made by its manufacturer, is not guaranteed or endorsed by the publisher.
References
1
Adriaanse A. (1993). Environmental policy performance indicators. The Netherlands: Sustainable Development Programme.
2
Almulhim T. (2024). Assessment of Green Development Level Performance in G20 Countries: A Dynamic Evaluation Framework. Heliyon10:e37622. doi: 10.1016/j.heliyon.2024.e37622
3
Balland P. A. Boschma R. Frenken K. (2019). “Proximity, innovation and networks: a concise review” in A research agenda for new economic geography. eds. TorreA.GallaudD.. Cheltenham, UK: Edward Elgar Publishing), 143–165.
4
Barbier E. B. (2012). The green economy post Rio+20. Science338, 887–888. doi: 10.1126/science.1227360
5
Barbier E. B. (2016). Is green growth relevant for poor economies?Resour. Energy Econ.45, 178–191. doi: 10.1016/j.reseneeco.2016.05.001
6
Barbier E. B. Burgess J. C. (2020). Sustainability and development after COVID-19. World Dev.135:105082. doi: 10.1016/j.worlddev.2020.105082
7
Borel-Saladin J. M. Turok I. N. (2013). The green economy: incremental change or transformation?Environ. Pol. Gov.23, 209–220. doi: 10.1002/eet.1614
8
Chen A. Partridge M. D. (2013). When are cities engines of growth in China? Spread and backwash effects across the urban hierarchy. Reg. Stud.47, 1313–1331. doi: 10.1080/00343404.2011.589831
9
Chen Y. Rong J. Li X. (2019). Evaluation and research on the driving factors of the green growth level in the three northeastern provinces. Ecol. Econ.35, 50–56. Available online at: https://kns.cnki.net/kcms2/article/abstract?v=ZHE1803t14vCX58uO4_kCUhmL_GodMn0atJGpmE1RyVBtsVUBzeKus0TJTuB9-6gAnZSZCGcoEBT18PMBSsakQpFfGtblQ-KRSLQxL0CObCTFW3anjTY8rCBa_zYJGipMbDYIgiu6qfJhmNAujFH2JIy_QVht8UZaZNjTMk7bcb29hxeYFs6Ig==&uniplatform=NZKPT&language=CHS
10
Coenen L. Benneworth P. Truffer B. (2012). Toward a spatial perspective on sustainability transitions. Res. Policy41, 968–979. doi: 10.1016/j.respol.2012.02.014
11
Coenen L. Hansen T. Rekers J. V. (2015). Innovation policy for grand challenges. An economic geography perspective. Geogr. Compass9, 483–496. doi: 10.1111/gec3.12231
12
Cosbey A. (2011). “Trade, sustainable development and a green economy: benefits, challenges and risks” in The transition to a green economy: benefits, challenges and risks from a sustainable development perspective. New York, NY: United Nations Department of Economic and Social Affairs. 40–61. Available online at: https://scholar.google.com/scholar?q=Trade,+sustainable+development+and+a+green+economy:+benefits,+challenges&hl=zh-CN&as_sdt=0&as_vis=1&oi=scholart
13
Demirel P. Li Q. C. Rentocchini F. Tamvada J. P. (2019). Born to be green: new insights into the economics and management of green entrepreneurship. Small Bus. Econ.52, 759–771. doi: 10.1007/s11187-017-9933-z
14
Derkzen M. L. van Teeffelen A. J. Verburg P. H. (2017). Green infrastructure for urban climate adaptation: how do residents' views on climate impacts and green infrastructure shape adaptation preferences?Landsc. Urban Plan.157, 106–130. doi: 10.1016/j.landurbplan.2016.05.027
15
Fan P. Chen J. John R. (2019). Urbanization and environmental change during the economic transition on the Mongolian plateau: Hohhot and Ulaanbaatar. Environ. Res.144, 96–112. doi: 10.1016/j.envres.2015.09.020
16
Fotheringham A. S. Crespo R. Yao J. (2015). Geographically and temporally weighted regression (GTWR). Geograph Analysis, 47, 215–229. doi: 10.1111/gean.12071
17
Gao L. Bryan B. A. (2017). Finding pathways to national-scale land-sector sustainability. Nature544, 217–222. doi: 10.1038/nature21694
18
Geels F. W. (2011). The multi-level perspective on sustainability transitions: responses to seven criticisms. Environ. Innov. Soc. Transit.1, 24–40. doi: 10.1016/j.eist.2011.02.002
19
Geels F. W. (2014). Reconceptualising the co-evolution of firms-in-industries and their environments: developing an inter-disciplinary triple embeddedness framework. Res. Policy43, 261–277. doi: 10.1016/j.respol.2013.10.006
20
Ghisellini P. Cialani C. Ulgiati S. (2016). A review on circular economy: the expected transition to a balanced interplay of environmental and economic systems. J. Clean. Prod.114, 11–32. doi: 10.1016/j.jclepro.2015.09.007
21
Gómez-Calvet R. Conesa D. Gómez-Calvet A. R. Tortosa-Ausina E. (2014). Energy efficiency in the European Union: what can be learned from the joint application of directional distance functions and slacks-based measures?Appl. Energy132, 137–154. doi: 10.1016/j.apenergy.2014.06.053
22
Gu W. Ge Y. (2018). Research on the temporal and spatial evolution and influencing factors of China's provincial greening pattern. Ecol. Econ.34, 80–85. Available online at: https://kns.cnki.net/kcms2/article/abstract?v=ZHE1803t14tc9dWKupkh2cS9VQm-BwZ3CG2-SetADhZ5yoH4BRZ0AJb67pX0cyZzaU8eUa2IqvoJROUWNsO7Ovx0DD0Yfezx_kUOqzWdlC9kZmud57zhm6wjItpqR-V-voivrbh8oyJD-5zkNBTYbce52KXrXsnkz7uR_Csq3m9nibUlwaTayQ==&uniplatform=NZKPT&language=CHS
23
Halkos G. (2023). Economic analysis and policies for the environment, natural resources, and energy. Energies16:6578. doi: 10.3390/en16186578
24
Hansen T. Coenen L. (2015). The geography of sustainability transitions: review, synthesis and reflections on an emergent research field. Environ. Innov. Soc. Transit.17, 92–109. doi: 10.1016/j.eist.2014.11.001
25
Hickel J. (2020). The sustainable development index: measuring the ecological efficiency of human development in the Anthropocene. Ecol. Econ.167:106331. doi: 10.1016/j.ecolecon.2019.05.011
26
Hickel J. Kallis G. (2020). Is green growth possible?New Polit. Econ.25, 469–486. doi: 10.1080/13563467.2019.1598964
27
Hou C. Chen H. Long R. Zhang L. Zhu Y. (2021). Construction and empirical research on evaluation system of green productivity indicators: analysis based on the correlation-fuzzy rough set method. J. Clean. Prod.279:123638. doi: 10.1016/j.jclepro.2020.123638
28
Hu L. Liu J. Zhang J. (2024). Evaluation and spatio-temporal evolution of green tourism economic development efficiency in Tibet—an empirical study based on super-efficiency SBM model. Bus. Econ. Res.12, 189–192. doi: 10.3969/j.issn.1002-5863.2024.12.044
29
Huang B. Wu B. Barry M. (2010). Geographically and temporally weighted regression for modeling spatio-temporal variation in house prices. Int. J. Geogr. Inf. Sci.24, 383–401. doi: 10.1080/13658810802672469
30
Kivimaa P. Kern F. (2016). Creative destruction or mere niche support? Innovation policy mixes for sustainability transitions. Res. Policy45, 205–217. doi: 10.1016/j.respol.2015.09.008
31
Larsen G. (2018). “An inquiry into the theoretical basis of sustainability” in Routledge handbook of the history of sustainability. ed. CaradonnaJ. L.. (Abingdon, Oxon: Routledge), 15–31.
32
Li J. Zhao M. Han R. (2021). Research on the spatial differentiation characteristics of urban comprehensive carrying capacity in Shandong Province and its influencing factors. Ecol. Econ.37, 85–92. Available online at: https://link.cnki.net/urlid/53.1193.F.20210528.1102.002
33
Lin X. Xu W. Yang F. (2017). Temporal and spatial evolution and influence mechanism of green economic efficiency in old industrial bases in Northeast China—taking Liaoning Province as an example. Econ. Geogr.37, 125–132. doi: 10.15957/j.cnki.jjdl.2017.05.017
34
Loorbach D. Frantzeskaki N. Avelino F. (2017). Sustainability transitions research: transforming science and practice for societal change. Annu. Rev. Environ. Resour.42, 599–626. doi: 10.1146/annurev-environ-102014-021340
35
Loorbach D. Rotmans J. (2006). “Managing transitions for sustainable development” in Understanding industrial transformation. OlshoornX.WieczorekA. J.. (Dordrecht: Springer), 187–206.
36
Lu J. Sun N. Liu S. (2016). Study of the implementation strategy for promoting pollution prevention and control in industrial sectors. Environ. Protec.38, 112–124. doi: 10.16803/j.cnki.issn.1004-6216.2016.04.013
37
Mardani A. Streimikiene D. Zavadskas E. K. Cavallaro F. Nilashi M. Jusoh A. et al . (2017). Application of structural equation modeling (SEM) to solve environmental sustainability problems: a comprehensive review and meta-analysis. Sustainability9:1814. doi: 10.3390/su9101814
38
Markard J. Raven R. Truffer B. (2012). Sustainability transitions: an emerging field of research and its prospects. Res. Policy41, 955–967. doi: 10.1016/j.respol.2012.02.013
39
Mathews J. A. (2012). Green growth strategies—Korean initiatives. Futures44, 761–769. doi: 10.1016/j.futures.2012.06.002
40
Matthews S. A. Yang T. C. (2012). Mapping the results of local statistics: using geographically weighted regression. Demogr. Res.26, 151–166. doi: 10.4054/DemRes.2012.26.6
41
McCauley D. Heffron R. (2018). Just transition: integrating climate, energy and environmental justice. Energy Policy119, 1–7. doi: 10.1016/j.enpol.2018.04.014
42
Mo J. Sun P. Gong Q. Liu Q. Shen D. (2024). Spatio-temporal differentiation of urban green spaces and influencing factors: A case study of the Yangtze River Economic Belt. J. Mountain Sci.42, 196–209. doi: 10.16089/j.cnki.1008-2786.000816
43
Pearce D. Markandya A. Barbier E. (2013). Blueprint for a green economy. London: Routledge.
44
Ren C. Wang T. Wang Y. Zhang Y. Wang L . (2023). The Heterogeneous Effects of Formal and Informal Environmental Regulation on Green Technology Innovation—An Empirical Study of 284 Cities in China. Intern. J. Environ. Res. Public Health, 20:1621. doi: 10.3390/ijerph20021621
45
Robaina-Alves M. Moutinho V. Macedo P. (2025). A new frontier approach to model the eco-efficiency in European countries. J. Clean. Prod.103, 562–573. doi: 10.1016/j.jclepro.2015.01.038
46
Rodrik D. (2014). Green industrial policy. Oxf. Rev. Econ. Policy30, 469–491. doi: 10.1093/oxrep/gru025
47
Sandmann L. Bülbül E. Castano-Rosa R. Hanke F. Großmann K. Guyet R. et al . (2024). The European green Deal and its translation into action: multilevel governance perspectives on just transition. Energy Res. Soc. Sci.115:103659. doi: 10.1016/j.erss.2024.103659
48
Sanye-Mengual E. Orsini F. Gianquinto G. P. (2018). Revisiting the sustainability concept of urban food production from a stakeholders' perspective. Sustainability10:2175. doi: 10.3390/su10072175
49
Schmalensee R. (2012). From "green growth" to sound policies: an overview. Energy Econ.34, S2–S6. doi: 10.1016/j.eneco.2012.08.041
50
Schot J. Geels F. W. (2008). Strategic niche management and sustainable innovation journeys: theory, findings, research agenda, and policy. Res. Policy.37, 583–603. doi: 10.1016/j.respol.2008.01.010
51
Shahbaz M. Loganathan N. Muzaffar A. T. Ahmed K. Jabran M. A. (2016). How urbanization affects CO2 emissions in Malaysia? The application of STIRPAT model. Renew. Sust. Energ. Rev.57, 83–93. doi: 10.1016/j.rser.2015.12.096
52
Shang S. Xu D. (2022). Measurement of green economy at China's provincial level and analysis of influencing factors. Bus. Econ. Res., 160–165. doi: 10.3969/j.issn.1002-5863.2022.08.041
53
Shu X. Min Z. Guo X. He Y. Zhang Q. (2024). Provincial digital economy and tourism industry high-quality development coupling coordination and driving factors. Econ. Geogr.44, 197–208. doi: 10.15957/j.cnki.jjdl.2024.01.020
54
Spirandelli D. (2015). Patterns of wastewater infrastructure along a gradient of coastal urbanization: A study of the Puget Sound region. Land, 4, 1090–1109. doi: 10.3390/land4041090
55
Stern N. Stiglitz J. E. (2021). The social cost of carbon, risk, distribution, market failures: an alternative approach. Cambridge, MA (National Bureau of Economic Research): NBER Working Paper.
56
Stjepanovic S. Tomic D. Skare M. (2022). A new database on green GDP; 1970-2019: a framework for assessing the green economy. Oecon. Copernic.13, 949–975. doi: 10.24136/oc.2022.027
57
Sun Y. Jing P. (2012). A study on green transition mode and transition path of resource-based regions. China Soft Sci.12, 152–161. doi: 10.3969/j.issn.1002-9753.2012.12.015
58
Tang X. Zhang Y. (2020). Evaluation of China's provincial environmental quality and analysis of influencing factors based on DPSIR model. J. Guangxi Normal Univ.56, 60–83. doi: 10.16088/j.issn.1001-6597.2020.04.007
59
Thi D. Do T . (2024). The interrelationships between economic growth and innovation: International evidence. J. Appli. Eco. 27:2332975. doi: 10.1080/15140326.2024.2332975
60
Tong C. (2000). Review on environmental indicator research. Res. Environ. Sci.13, 53–55. Available online at: https://www.hjkxyj.org.cn/en/article/id/20000415
61
Troian A. Gomes M. C. Tiecher T. Berbel J. Gutiérrez-Martín C. (2021). The drivers-pressures-state-impact-response model to structure cause− effect relationships between agriculture and aquatic ecosystems. Sustainability13:9365. doi: 10.3390/su13169365
62
UNEP (2011). Towards a green economy: Pathways to sustainable development and poverty eradication. Nairobi: UNEP.
63
Varis O. Kummu M. (2019). The demanding quest for harmony: China’s polarizing freshwater resilience map. Environ. Res. Letters, 14:054015. doi: 10.1088/1748-9326/ab1040
64
Velenturf A. P. Jopson J. S. (2019). Making the business case for resource recovery. Sci. Total Environ.648, 1031–1041. doi: 10.1016/j.scitotenv.2018.08.224
65
World Bank (2019). Disclosing and valuing the benefits of resilience investments: a guide for utilities. Washington, DC: World Bank.
66
Yang W. Hu Y. Ding Q. Gao H. Li L. (2023). Comprehensive evaluation and comparative analysis of the green development level of provinces in eastern and western China. Sustaina.15:3965. doi: 10.3390/su1505396
67
Yao C. Teng Y. Huang L. (2015). Construction and empirical analysis of China's food security evaluation index system. Trans. Chin. Soc. Agric. Eng.31, 1–10. doi: 10.3969/j.issn.1002-6819.2015.04.001
68
York R. Rosa E. A. Dietz T. (2003). Footprints on the earth: the environmental consequences of modernity. Am. Sociol. Rev.68, 279–300. doi: 10.2307/1519769
69
Zhang W. (2021). Construction and empirical study of China's green economy evaluation index system. Stat. Decis.37, 126–129. doi: 10.13546/j.cnki.tjyjc.2021.16.028
70
Zhang Q. Crooks R. (2012). Toward an environmentally sustainable future: Country environmental analysis of the People's Republic of China. Mandaluyong, Philippines: Asian Development Bank.
71
Zhang B. Xie Z. X. Gao J. X. Yu X. L. (2021). Assessment on the cooling effect of urban green spaces in Shanghai. Res. Sci.43, 1004–1015. doi: 10.31497/ZZZYXB.20210518
72
Zhao C. Han N. Zhou Q. Li S. Shi B. (2024). Evaluation of water resource carrying capacity in Shanxi Province based on combined weighting-TOPSIS model. J. Tianjin Agric. Univ.31, 74–80. doi: 10.19640/j.cnki.jtau.2024.04.013
73
Zhao W. Li X. Wang Z. (2024). Measurement and spatial-temporal evolution analysis of China's green low-carbon circular economy system development level. Statist. Decis.40, 109–114. doi: 10.13546/j.cnki.tjyjc.2024.11.019
74
Zhao J. Zhang H. Zeng C. et al . (2023). Research on the spatial and temporal heterogeneity of influencing factors of green efficiency of water resources in Tuojiang River basin. China Rural Water Hydropower45, 110–118. doi: 10.12396/znsd.221185
75
Zhi X. Liu C. (2022). Research on high-quality development of industrial economy in Xinjiang from the perspective of resource and environment carrying capacity. Xinjiang State Farms Econ.11, 30–38. doi: 10.3969/j.issn.1000-7652.2022.11.005
76
Zournatzidou G. Sklavos G. Ragazou K. Sariannidis N. (2024). Anti-competition and anti-corruption controversies in the European financial sector: examining the anti-ESG factors with entropy weight and TOPSIS methods. J. Risk Financial Manag.17:492. doi: 10.3390/jrfm17110492
Summary
Keywords
regional green economy, DPSR evaluation system, influence effects, GTWR model, heterogeneity analysis
Citation
Yin H, Zhu Z, Pan L, Zhu F and Zhu L (2025) City-level assessment of green economy development and its driving factors: empirical evidence from 14 prefecture-level cities in Guangxi, China based on DPSR-GTWR integrated model. Front. Sustain. Cities 7:1622975. doi: 10.3389/frsc.2025.1622975
Received
05 May 2025
Accepted
29 October 2025
Published
14 November 2025
Volume
7 - 2025
Edited by
Bingnan Guo, Jiangsu University of Science and Technology, China
Reviewed by
Jiahua Wei, Guilin University of Technology, China
Haoxiang Zhao, Chinese Academy of Sciences, China
Updates
Copyright
© 2025 Yin, Zhu, Pan, Zhu and Zhu.
This is an open-access article distributed under the terms of the Creative Commons Attribution License (CC BY). The use, distribution or reproduction in other forums is permitted, provided the original author(s) and the copyright owner(s) are credited and that the original publication in this journal is cited, in accordance with accepted academic practice. No use, distribution or reproduction is permitted which does not comply with these terms.
*Correspondence: Zhidong Zhu, zhidong.zhu@manchester.ac.uk
Disclaimer
All claims expressed in this article are solely those of the authors and do not necessarily represent those of their affiliated organizations, or those of the publisher, the editors and the reviewers. Any product that may be evaluated in this article or claim that may be made by its manufacturer is not guaranteed or endorsed by the publisher.