Abstract
Introduction:
This study presents the first comprehensive evaluation of the CO2 mitigation potential of the Haramain High-Speed Railway (HHR) system in Saudi Arabia. Focusing on the 450 km Makkah–Madinah corridor, it addresses the pressing need to assess operational and energy-related factors influencing high-speed rail (HSR) decarbonization in fossil-dependent economies.
Methods:
A dynamic scenario-based mathematical modeling approach was applied, examining four operational parameters: train energy efficiency (0.03–0.07 kWh/pkm), grid emission factor (0.65–0.10 kgCO2/kWh), renewable energy (RE) adoption (0–100%), and occupancy rates (25–100%). Real-world operational losses were incorporated through a 15% system efficiency adjustment. Multiple scenarios were simulated to capture nonlinear interactions between energy sourcing and passenger dynamics.
Results:
Three key findings emerged. First, in worst-case conditions (low occupancy and a fossil-heavy grid), the HHR system could result in a net increase of 187 kT of CO2 annually compared to buses. Conversely, in best-case conditions (high occupancy and 100% renewable energy), it could achieve savings of 285 kT of CO2 per year, which equates to a saving of 11.93 kg per passenger for the entire journey of 450 km. Second, occupancy rates exert an outsized influence on carbon performance. In multiple scenarios, ridership optimization yields greater emissions reductions than RE integration alone, particularly when grid decarbonization is partial. Third, the study identifies scenario-specific climate-positive thresholds: net CO2 savings are achieved when occupancy exceeds 70–75% under the current grid mix, or 45–50% when RE adoption reaches 50%
Discussion:
These thresholds highlight the nonlinear interplay between energy sourcing and ridership dynamics, offering critical insights for Vision 2030 transport planning. By integrating operational variability and passenger behavior, the methodology provides a practical toolkit for aligning clean energy investments with ridership incentives and forecasting emissions under real-world conditions. Contributing to UN-SDGs 9, 11, and 13, the study establishes a foundational reference for future research on decarbonization thresholds in HSR systems, particularly in Middle Eastern and arid-region contexts.
1 Introduction
Transportation plays a vital role in modern society by fueling economic progress, fostering social connections, and facilitating global trade. However, it is also a major source of carbon emission, contributing to approximately 24% of global CO2 output as of 2020 (Hannah Ritchie, 2020a). This sector, encompassing road vehicles, ships, trains, and aircraft, remains heavily reliant on fossil fuels, ranking as the second-largest emitter of greenhouse gases after the energy industry (Statista Research Department, 2025). Addressing this challenge is essential to achieving the United Nations Sustainable Development Goal (UN-SDG) 13: Climate Action, which outlines specific targets (13.1, 13.2, 13.3, 13.A, and 13.B) for urgent emission reductions (International Energy Agency, 2023). Rising urbanization and economic growth continue to intensify transportation demand, exacerbating emissions (Hannah Ritchie, 2020b). High-speed rail (HSR) systems emerge as a sustainable solution within this context, capable of reducing emissions through improved energy efficiency compared with less efficient transport modes (Gao et al., 2023). Notably, the ability of HSR to transport thousands of passengers simultaneously enhances energy efficiency and reduces per capita environmental impact (Watson et al., 2022).
Decarbonizing transportation is thus imperative for meeting global climate goals based on the significant share of greenhouse gas emissions by the transportation sector. HSR and hyperloop systems offer transformative solutions that align sustainability with growing mobility needs. The HSR systems capable of exceeding speeds of 250 km/h (155 mph) provide a low-carbon alternative to conventional air travel, particularly for medium- to long-distance journeys (Kalinowski, 2025). Moreover, the HSR systems emit approximately 90 and 70% less CO2 per passenger per kilometer than airplanes and private cars, respectively (Baron et al., 2011). Technological innovations such as magnetic levitation (maglev) and hyperloop technology further enhance their potential by increasing energy efficiency by up to 40% compared with conventional electric rail and minimizing environmental impact (Nøland, 2024). Research increasingly highlights that integrating advanced rail systems into transport infrastructure is pivotal for reducing carbon emissions and accelerating the transition toward sustainable mobility (Chester and Horvath, 2008). Global institutions, such as the International Energy Agency (IEA), World Bank, and OECD, underscore the key role of HSR within integrated sustainability frameworks (International Energy Agency, 2019; World Bank Group, 2022; OECD, 2019). As such, HSR has become a cornerstone of decarbonized transport across diverse regions, each employing context-specific strategies shaped by policies, grid conditions, and demographic factors.
In China, HSR expansion has led to urban CO2 reductions of 12%–18% driven by integrated corridor design, modal shifts, and a renewable-based grid supported by centralized planning (Wang et al., 2024; Shen et al., 2023). In Japan, the Shinkansen illustrates high-frequency, low-emission travel in densely populated contexts enabled by a grid increasingly powered by nuclear and RE (Shen et al., 2023; Harris and Dupont, 2023). The European Union showcases mature systems like France's TGV and Germany's ICE, which achieve emission cuts of 22%–30% through high occupancy rates and regenerative braking integration (Harris and Dupont, 2023). Similarly, emerging networks in Spain and Italy are optimizing operational efficiency through digital scheduling and advanced track utilization (Alshoufi et al., 2024). In the United States, though HSR coverage remains limited, rail is positioned as a viable alternative to short-haul aviation on corridors under 500 km with projected carbon savings ranging from 65 to 80% per passenger per kilometer compared with air travel (Intergovernmental Panel on Climate Change, 2022). Moreover, according to the report (Intergovernmental Panel on Climate Change, 2022, Ch. 10), rail transport accounts for only 1% of global direct transport emissions with electrified systems offering substantial mitigation potential when powered by low-carbon grids (Intergovernmental Panel on Climate Change, 2022). Moreover, this report emphasizes that operational emissions vary significantly by region, technology, and occupancy, reinforcing the need for dynamic modeling in HSR assessments (Intergovernmental Panel on Climate Change, 2022, Ch. 10). The Mumbai–Ahmedabad HSR corridor of India is projected to reduce CO2 emissions by up to 80% per passenger-kilometer compared with air travel, aligning with national decarbonization strategies (Baron et al., 2011). We encourage readers to grasp a comprehensive global overview of greenhouse gas emissions in HSR systems by consulting the study by (da Fonseca-Soares et al. 2024). The Middle East is gradually integrating HSR into broader decarbonization strategies with Saudi Arabia's Haramain High-Speed Railway (HHR) serving as a flagship Vision 2030 project designed to replace diesel buses and promote low-carbon mobility between pilgrimage destinations (Haramain High-Speed Railway, 2025). Notably, regional studies emphasize that arid climates present unique energy challenges with elevated ambient temperatures increasing train electricity consumption by 15%–20% relative to temperate systems (UIC, 2023).
Across these varied contexts, the success of HSR depends not only on infrastructure and technological advancement but also on effectively linking occupancy optimization, renewable grid integration, and adaptive policy mechanisms. Despite its environmental advantages, HSR faces several global challenges, such as high infrastructure costs, land acquisition barriers (Aljehani, 2023), competition with air and automobile travel, and public skepticism around cost-effectiveness and equity impacts (Harvey et al., 2014). Nevertheless, its long-term benefits, such as improved air quality, emission reductions, and enhanced energy security, make it integral to sustainable transport planning (UIC, 2020). Financial instruments like carbon pricing (UNECE, 2024) and public–private partnerships (PPP) (Liu et al., 2024) are increasingly leveraged to overcome economic hurdles and facilitate broader adoption.
In parallel, Saudi Arabia, under the Vision 2030 framework, is advancing a transformative sustainability agenda anchored in the transport and energy sectors (Vision 2030, 2022). Although the country contributes less than 2% of global CO2 emissions annually (World Population Review, 2025), its dependence on a fossil-heavy power grid (61%), high ambient temperatures, and pilgrimage-driven travel demand present distinct decarbonization challenges (KAPSARC, 2024). The HHR connecting Makkah and Madinah serves as a flagship investment in the climate roadmap of Saudi Arabia, complementing initiatives such as the Saudi Green Initiative (SGI) and the National Renewable Energy Program (NREP) (Saudi Green Initiative, 2024; World Resources Institute, 2023). Recent literature highlights that conventional HSR models often fail to account for occupancy variability, especially in regions with extreme climates. In the Gulf Cooperation Council (GCC) context, fluctuating passenger demand and elevated cooling requirements pose unique operational and energy challenges compared with temperate rail systems (World Bank Group, 2022; Bätzner, 2015). Research from the International Union of Railways (UIC) and regional transport planners highlights the need for dynamic modeling approaches that account for demographic fluidity, load sensitivity, and RE grid transitions (UIC, 2023).
To address these gaps, this study introduces a multiscenario dynamic emission mathematical model comparing HHR to diesel buses over a 450 km corridor. Four core parameters are systematically varied: (i) train energy efficiency (TEE), (ii) grid emission factor (GEF), (iii) RE adoption, and (iv) occupancy rate. This framework supports comparative analysis under both static and real-world operational regimes. Accordingly, the study makes the following contributions:
-
Quantifies emission differences between HHR and diesel buses under diverse RE and occupancy conditions.
-
Identifies occupancy and RE adoption thresholds for net carbon savings.
-
Assesses the relative impact of occupancy vs. clean energy integration on decarbonization outcomes.
-
Provides strategic insights to align rail infrastructure investments with Saudi Arabia's net-zero goals.
Ultimately, this research aims to advance the discourse on sustainable mobility by demonstrating that HSR systems, when guided by intelligent operational strategies, can serve as powerful enablers of climate action, supporting multiple UN Sustainable Development Goals (SDGs 9, 11, and 13). The paper is organized as follows: Section 2 reviews the SGI and NREP frameworks; Section 3 introduces and contextualizes the HHR; Section 4 outlines the methodology; Section 5 presents results and discussion; and Section 6 concludes with key insights.
2 Role of Saudi Arabia in achieving net-zero carbon emissions
Saudi Arabia is making significant strides toward achieving net-zero carbon emissions by 2060, driven by transformative initiatives such as the SGI1 and NREP (Saudipedia, 2024). Together, these initiatives underscore the commitment of Saudi Arabia to combating climate change, fostering sustainable development, and contributing to global climate goals discussed in the following subsections.
2.1 Saudi Green Initiative (SGI)
Inaugurated in 2021 as a cornerstone of Saudi Vision 2030, the SGI is a comprehensive sustainability program targeting carbon emission reductions, large-scale afforestation, and the protection of terrestrial and marine ecosystems (Saudi Green Initiative, 2023a,b). Central to its strategy is the Circular Carbon Economy (CCE) framework, complemented by ambitious RE projects, with the collective goal of eliminating 278 million tons of CO2 annually by 2030 (Saudipedia, 2024). A detailed breakdown of all initiatives aligned with SGI's strategic dimensions is provided in Table 1.
Table 1
| Initiative | Key targets with deadline of 2030 | Alignment with Vision 2030 | Progress and impact |
|---|---|---|---|
| Renewable energy expansion | 130 GW capacity with 5 GW solar plant with battery storage ensuring 50% renewable energy in electricity mix | • Diversify energy sources • Reduce dependence on oil • Promote sustainable economic growth |
• 300% increase in installed renewable capacity since SGI's launch • Reduction of carbon emissions by displacing liquid fuel usage |
| Afforestation and land rehabilitation | 10 billion trees plantation and 40 million hectares degraded land rehabilitation | • Enhance quality of life combat desertification • Preserve natural resources |
• 43.9 million trees planted since SGI's launch • Restoration of ecosystems and improved air quality |
| Protected areas expansion | 30% of protected land and marine areas | • Safeguard environmental resources • Promote ecotourism Support sustainable development |
• 18.1% of land and 6.49% of marine environments are currently under protection • Preservation of biodiversity and natural habitats |
| Carbon emissions reduction | 278 million tons/year carbon emissions reduction | • Address environmental challenges • Global leader in sustainability • Fulfill international climate commitments |
• Significant progress toward emission reduction targets • Contribution to global climate change mitigation efforts |
| Green hydrogen production | Global largest green hydrogen plant in NEOM | • Innovation in sustainable technologies • Diversify the economy Pioneer in green energy |
• Production of clean fuel to power transportation and industry • Reduction of global carbon footprint |
| Biodiversity conservation | Rewild endangered species and protect natural habitats | • Preserving wildlife heritage • Promote environmental stewardship • Support sustainable tourism |
• Reintroduction of species like the Arabian leopard and cheetah • Enhancement of ecological balance |
Saudi Green Initiatives (SGI) details and progress (Saudi Green Initiative, 2023a,b).
2.2 National Renewable Energy Program (NREP): powering Saudi Arabia's sustainable future
Launched in 2016 under Saudi Vision 2030, the NREP is a transformative initiative to diversify the Kingdom's energy mix by scaling renewable sources to 50% of electricity generation by 2030, with natural gas supplying the remainder.
The NREP drives progress across three pillars (Saudipedia, 2024):
-
Economic diversification: reducing oil dependence and catalyzing new industries.
-
Environmental sustainability: cutting CO2 emissions by 20 million tons annually through solar/wind projects, reaching upto 278 million tons annually by 2030.
-
Energy security: ensuring a reliable, sustainable power supply.
Tangible progress (2024 update)
-
300% growth in renewable capacity since 2022, now totaling 2,800 MW (powering more than half a million homes).
-
22 active projects, including 13 new additions delivering 11.4 GW to the grid.
-
SAR 34 billion (USD 9 billion) investment, with a few projects given in Table 2.
Table 2
| Project name | Status | Type | Capacity (MW) | Location | Completion year |
|---|---|---|---|---|---|
| Sakaka SOLAR PV Plant | Operational | Solar | 300 | Al-Jouf Province | 2021 |
| Dawmat al-Jandal Wind Farm | Operational | Wind | 400 | Al-Jouf Province | 2022 |
| Sudair Solar PV Project | Operational | Solar | 1,500 | Sudair Industrial City | 2023 |
| Rabigh Solar PV Park | Operational | Solar | 400 | Makkah Region | 2024 |
| Al-Kharj Solar PV Park | Operational | Solar | 15 | Riyadh | 2024 |
| Al-Masa'a IPP Solar Power Plant | Under Development | Solar | 1,000 | Hail | 2025 (expected) |
| Ar-Rass Solar PV Park (1 & 2) | Under Development | Solar | 2700 | Al-Qassim | 2025 (expected) |
| Al-Shuaibah Solar Projects (1 & 2) | Under Development | Solar | 2,631 | Jeddah | 2025 (expected) |
Key renewable energy projects from 2018 till today (Invest Saudi, 2024; Ministry of Energy, Saudi Arabia, 2024).
3 Haramain High-Speed Railway: a visionary pillar of sustainable mobility
The HHR seamlessly bridges the sacred cities of Makkah and Madinah, delivering unparalleled speed and efficiency. Moreover, beyond its role as a modern transit solution, the HHR stands as a testament to the dedication of Saudi Arabia to sustainable progress, directly supporting the environmental and infrastructural ambitions of Vision 2030, significantly curbing carbon emissions, and championing green mobility in the region. Comprehensive details are presented in Table 3.
Table 3
| Vison | To bring every member of the community closer to their desires whether they are intending to travel for worship, work or tourism through an easy and fast transportation method, which helps in keeping up with the constant life changes, improving their productivity, and achieving their goals |
|---|---|
| Mission | To serve the visitors of the Two Holy Mosques and upgrade the means of transportation around the Kingdom and meet the needs of all individuals who are traveling as visitors, residents, or tourists and bring them closer to their destinations and increase their productivity to keep up with the 2030 Vision we aspire to achieve |
| Operator/operational | Saudi Arabia Railways (SAR)/since September 2018 |
| Type | High speed rail |
| Operational speed | 300 km/h maximum |
| Total occupancy | 417 Seats: 113 business class and 304 economy class with dining facility in Coach number 5 |
| Destinations covered | Makkah, King Abdulaziz International Airport Jeddah, Al-Sulimaniyah Jeddah, King Abdullah Economic City and Madinah |
| Total track length/area covered | 450 km/320,000 m2 |
| Features | Faster, comfortable and safer traveling |
| Total fleet/punctuality rate | 35 trains with 13 carriages each/more than 95% |
| Sustainability features | • Electrified railway: no direct reliance on fossil fuels • Sustainability designed stations: all stations are designed prioritizing sustainability to reduce felt temperatures naturally, using Mashrabiyas, large fans, and misting devices, maintaining a comfortable 28 °C inside without extensive mechanical cooling |
| Total cost | 16 billion US dollars incepted in 2009 and completed in 2019 |
| Construction companies | • Early construction phase: China Railway Construction Corporation • Throughout: Spanish-led Al-Shoula consortium |
| Concerned authority | Saudi Ministry of Transport and Logistics |
| Benchmarked (regional and global) | A reference high-speed rail project for arid regions |
Comprehensive details of HHR (Haramain High-Speed Railway, 2025).
3.1 Global recognition and awards
The HHR, being so young, has earned several prestigious awards in recognition of remarkable achievements, ensuring operational excellence and serving more than 60 million passengers since 2018. Moreover, it qualifies as a landmark transformational project of Saudi Arabia (First HSR for desert climate/arid regions), seamlessly blending modern technology with cultural heritage. Table 4 presents all unique details of key awards in a range of categories, such as engineering innovation, sustainability, cultural integration, and societal impact.
Table 4
| Year | Award name/awarding body | Uniqueness | Achievements |
|---|---|---|---|
| 2019 | Saudi green building forum | Sustainability in infrastructure | • Solar powered stations • Water recycling systems • Reduced carbon footprint • Strong alignment with sustainability goals under Vision 2030 |
| Global engineering excellence/IJR | Innovation in rail technology | • Desert climate friendly • Saudi specific adaptations • Air filtration and cooling system for sandstorm conditions |
|
| MEED Projects Award/MEED | Engineering innovation | • Rapid completion and delivery • Fastest desert rail system • Complex urban integration (building tracks near holy sites) |
|
| 2021 | FIDIC Global infrastructure/FIDIC | Sustainability, innovation and social impact | • Sand resistant tracks • Energy efficient stations • Pilgrimage centric design |
| 2022 | Aga Khan Award for Architecture/Aga Khan Development Network (specifically, Jeddah Central Station) | Design and cultural integration | • Dunes inspired stations roof design • Integration of cultural elements in modern designed stations |
Awards details of HHR Saudi Arabia.
3.2 Comparison of HHR with global leading HSR systems
The HHR operates at speeds of up to 300 km/h, placing it among the fastest rail systems globally, comparable with leading global rail systems, with details given in Table 5.
Table 5
| Feature | Haramain (Saudi Arabia) (Haramain High-Speed Railway, 2025) | Shinkansen (Japan) (Japan Rail Pass, 2025) | TGV (France) (Eurail, 2025) | HHR (China) (China Railway, 2025) |
|---|---|---|---|---|
| Operational maximum speed | 300 km/h | 320 km/h | 320 km/h | 350 km/h |
| Route length | 450 km | 2,764 km | Over 2,800 km | Over 40,000 km |
| Propulsion | Electric (overhead) | Electric (overhead) | Electric (overhead) | Electric (overhead) |
| Climate adaptation | Desert climate friendly | Earthquake resistant | Standard | Diverse (cold regions, high-altitude, tropical) |
| Primary users/yearly passengers | Pilgrims and passengers/over 7 million | Passengers/over 150 million | Passengers/over 110 million | Passengers (domestic and international)/over 2.3 billion |
| Technology source | Spanish Talgo 350 | Indigenous (Japan) | Indigenous (France) | Indigenous (CRH series: China) |
| Ticket price range | $25-$100 | $50–$150 | $40–$120 | $20–$100 |
Comparison of HHR with global leading HSR systems.
4 Methodology
This section outlines the modeling framework, data sources, and scenario design employed to evaluate the carbon performance of HHR vs. conventional diesel bus transport under dynamic energy and occupancy conditions.
4.1 Emission modeling framework
This study evaluates the CO2 reduction potential of the HHR using a dynamic multiscenario emission model built around four critical variables:
-
1. Train energy efficiency (TEE): defined as energy consumed per passenger-kilometer (kWh/pkm), reflecting operational load variations influenced by speed, terrain, and train occupancy. The assumed train energy efficiency (TEE) range of 0.03–0.07 kWh/pkm reflects operational variability across global HSR systems and is supported by peer-reviewed modeling studies and international benchmarks. (Cwil et al. 2021) report average TEE values around 0.05 kWh/pkm for European HSR under standard occupancy and speed conditions, while (Chen 2021) and International Union of Railways (2022) document lower values in China's CRH network due to high occupancy and favorable terrain. Conversely, increased energy demand in arid regions aligns with Tier-1 efficiency targets outlined in the IPCC's Sixth Assessment Report (Intergovernmental Panel on Climate Change, 2022, Ch. 10).
-
2. Grid emission factor (GEF): measures the CO2 intensity of electricity supplied to HHR trains (kgCO2/kWh) with a baseline value of 0.65 kgCO2/kWh. The baseline GEF is consistent with fossil-dominated electricity systems such as Saudi Arabia's, as shown in global datasets from Our World in Data (Ember; Energy Institute, 2025). This value reflects average emissions from natural gas and oil-based generation, which dominate the Saudi grid, as discussed in KAPSARC (2024). Moreover, GEF is adjusted using:
-
GEF = Baseline GEF × (1 – RE%)
-
where RE% represents renewable penetration from real-time grid dashboards and policy targets, which aligns with IPCC guidelines for operational emissions accounting in transport (Intergovernmental Panel on Climate Change, 2022, Ch. 10).
-
3. Renewable energy adoption: RE adoption is quantified as the proportion of electricity sourced from renewables, including solar and wind. This metric is derived from real-time operational data via the Ministry of Energy's dashboards (KAPSARC, 2024), national policy targets under SGI and NREP aiming for 50% RE by 2030 (Saudipedia, 2024; Saudi Green Initiative, 2023c), and modeled penetration scenarios (0%–100%) using IEA carbon intensity conversion tools (IEA, 2022). This multisource approach ensures both empirical accuracy and policy alignment.
-
4. Occupancy rate: occupancy rate is defined as the ratio of actual passengers to the maximum train capacity of 417 passengers per Talgo 350 train, as specified by the manufacturer (Haramain High-Speed Railway, 2025; Talgo, 2025). In 2023 alone, HHR served over 7 million passengers, reflecting significant variability in train load factors (HHR, 2023). This variability directly influences per-passenger emission intensity: higher occupancy improves energy efficiency by distributing total TEE across more passengers. This dynamic adjustment aligns with global transport decarbonization frameworks that emphasize modal efficiency gains.
4.2 Fixed vs. dynamic train energy efficiency modeling scenarios
To reflect both benchmark comparisons and operational realism, two modeling regimes are constructed with details given in Table 6:
-
Fixed modeling: assumes constant TEE and GEF, aligning with international standards for cross-modal comparisons such as Ecoinvent and IEA (IEA, 2022).
-
Dynamic modeling: incorporates occupancy-dependent TEE and grid RE integration to capture actual emission variability within the HSR landscape in Saudi Arabia. The IPCC's Sixth Assessment Report (Intergovernmental Panel on Climate Change, 2022) emphasizes the importance of systemic modeling approaches that reflect local energy transitions and modal efficiency improvements. Additionally, the grid carbon intensity of Saudi Arabia, tracked by platforms like Our World in Data (Ember; Energy Institute, 2025), shows a declining trend due to increasing renewable energy integration, making dynamic modeling essential for accurate emissions profiling.
Table 6
| Approach | Advantages | Limitations |
|---|---|---|
| Fixed TEE (0.05 kWh/pkm) | Enables cross-modal comparisons via standardized values | Masks real-world effects of occupancy, regional grid carbon intensity |
| Variable TEE and GEF | Captures Saudi-specific dynamics such as low ridership, fossil-heavy grid and seasonal demand | Requires granular input data, sensitive to load and scheduling assumptions |
Train energy efficiency modeling scenarios.
4.3 Benchmarking framework and modal selection justification
Benchmarking is performed against diesel buses, which is the most prevalent and standardized intercity transport mode operating in the Makkah–Madinah route. Although air travel and private cars are commonly used in other corridors, their inclusion was assessed and ruled out due to limited operational data, inconsistent emissions profiles, and route-specific irrelevance:
-
Air travel exclusion: no direct flights operate on the Makkah–Madinah corridor.
-
Private car exclusion: high variability in vehicle type, occupancy, and route conditions precludes standardized emission comparisons.
Buses thus represent the most appropriate comparator due to uniformity, route overlapping, and consistent energy/emission metrics. Now, to assess the superior performance of the HHR, the conventional diesel bus is considered as a benchmarking transportation mode, with benchmarking equations given by:
where Bus fuel intensity = 2.68 kgCO2/L and bus emission factor = 0.102 kgCO2/pkm. Emission factors and energy intensities were derived from authoritative sources, including the IPCC Sixth Assessment Report (Intergovernmental Panel on Climate Change, 2022), IEA emissions factors database (IEA, 2022), and empirical studies such as Urban Mobility India (Rawat et al., 2024) and CARB EMFAC documentation (California Air Resources Board, 2019). Bus fuel intensity and per-passenger emission rates were validated using the EPA GHG Hub (United States Environmental Protection Agency, 2025) and the UK Department for Environment, Food and Rural Affairs based estimates (Department for Energy Security Net Zero, 2024 ).
4.4 Scenario design and modeling assumptions
Four distinct scenarios are developed and detailed in Table 7 for comprehensive emissions and savings analysis to quantify the environmental benefits of the HHR compared with diesel bus transport over a 450-km intercity route.
Table 7
| Scenario | Train efficiency | Bus efficiency | Occupancy variability |
|---|---|---|---|
| S1: F-F | Fixed | Fixed | None |
| S2: V-F | Variable | Fixed | Train only |
| S3: F-V | Fixed | Variable | Bus only |
| S4: V-V | Variable | Variable | Both modes |
Scenario design details.
Moreover, CO2 emission savings per passenger are calculated by integrating both fixed and variable energy efficiencies for train and bus systems. These calculations are evaluated across dynamic occupancy levels [25, 50, 75, 100] and varying rates of RE adoption [0, 25, 50, 75, 100]. The analysis is conducted under the assumption that parameters are held independent to isolate the marginal impact of each variable, such as occupancy rate, RE penetration, and energy intensity.
The emissions savings are the difference between bus and train emissions, given by:
with positive values indicating net environmental benefit in favor of the train. While the indirect benefits of RE integration, such as enhanced grid performance and its impact on train operations, are acknowledged, they fall outside the scope of the current linear modeling framework. These dynamics will be addressed in future work using multiagent simulation and co-optimization approaches.
5 Results and discussion
This section presents a comprehensive emissions and savings analysis considering four scenarios defined in Section 4.4.
5.1 Comparative emissions and savings analysis of Scenario 1
Scenario 1 serves as a baseline, assuming fixed energy efficiencies for both modes of transportation. The train operates at 15 kWh/km with a fully regenerative braking system, while the bus maintains a constant emission factor of 0.102 kg CO2/passenger-km. Train CO2 emissions remain consistent across all occupancy levels for each RE penetration rate indicating optimal emission distribution. At 0% RE, the train emits 14.63 kg CO2/passenger, decreasing linearly with RE adoption and reaching zero emissions under a fully renewable grid (Figure 1a). Bus emissions remain fixed at 45.9 kg CO2/passenger, unaffected by either occupancy or RE penetration (Figure 1b). Comparatively, the train emits up to 68% less CO2 than the diesel bus under non-renewable conditions (Figures 1a, b). With both transportation modes efficiencies held constant, CO2 savings are identical across all occupancy levels for a given RE penetration. Maximum savings of 45.9 kg CO2/passenger occur at 100% RE adoption. Each 25% increase in RE penetration results in a consistent savings increment of approximately 3.66 kg CO2/passenger, further amplifying the train's advantage over diesel buses (Figure 1c).
Figure 1
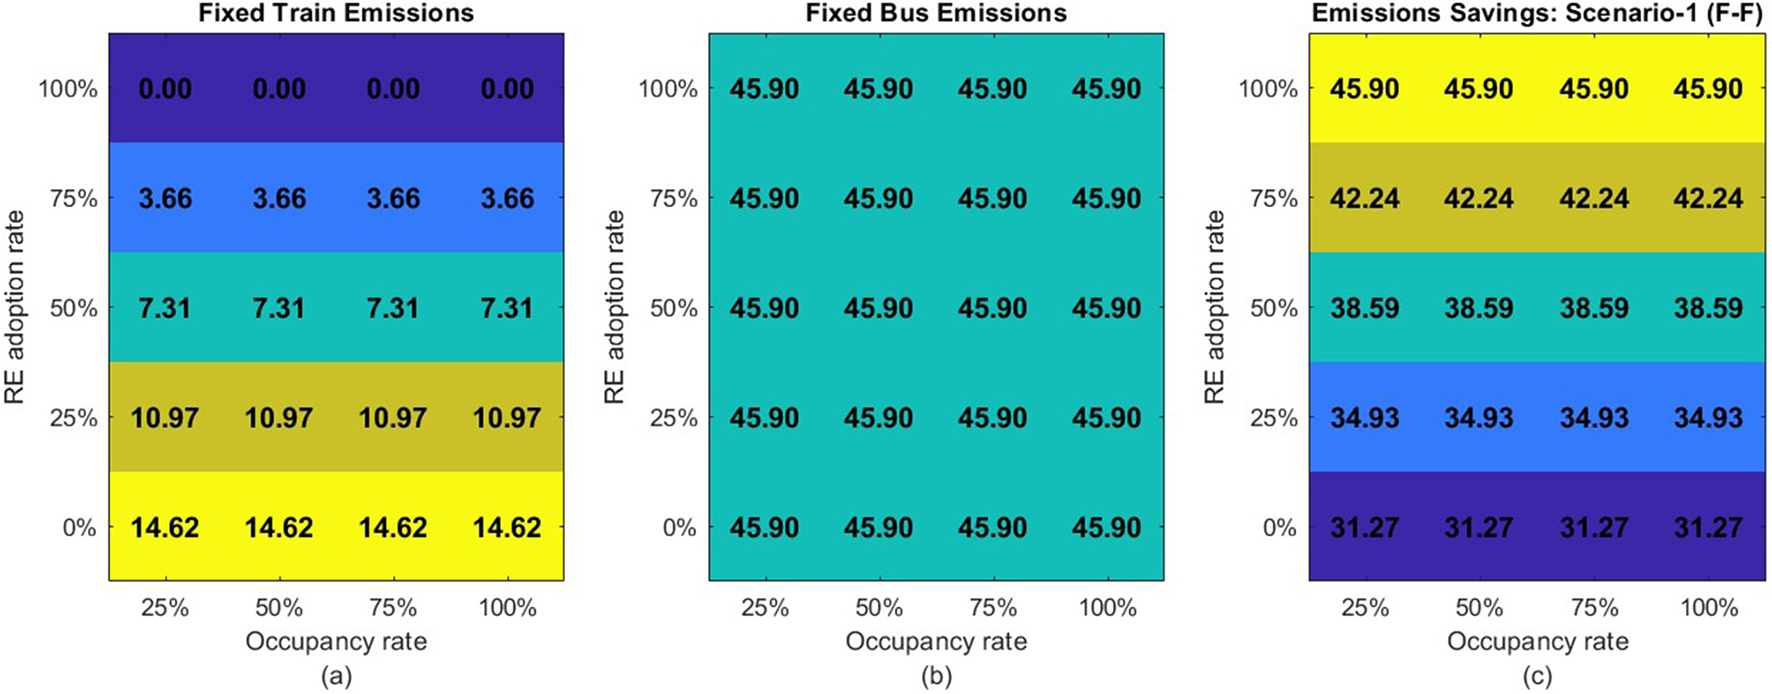
(a–c) Scenario 1: Comparative train and bus emissions with associated emission savings, measured in kg CO2 per passenger for the entire 450 km journey.
The train consistently outperforms the bus in emissions performance, independent of occupancy level. As RE penetration increases, the gap widens significantly, culminating in CO2 savings ranging from 31.28 kg/passenger (worst case at 0% RE) to 45.9 kg/passenger (best case at 100% RE).
5.2 Comparative emissions and savings analysis of Scenario 2
Scenario 2 introduces variable energy efficiency for trains based on occupancy levels, while bus emissions remain constant across all conditions. This dynamic model highlights the enhanced emissions performance gained through increased train utilization and RE adoption. Train emissions vary inversely with occupancy and RE penetration. At low occupancy (25%) and no RE adoption (0%), emissions peak at 42.09 kg CO2/passenger, approaching bus levels. However, train emissions drop sharply as occupancy and RE adoption rise. For instance, at 100% occupancy and 50% RE adoption, emissions fall to 5.26 kg CO2/passenger, representing an 88% reduction compared with the diesel bus case (Figure 2a). Bus emissions are fixed at 45.9 kg CO2/passenger across all occupancy and RE adoption rate, offering no improvements from increased load or renewable integration. CO2 savings grow significantly with train occupancy and RE adoption. Savings reach 14.34 kg CO2/passenger at 25% occupancy and 25% RE adoption, while full occupancy and RE penetration yield the maximum 45.9 kg CO2/passenger saved (Figure 2b). Even moderate occupancy levels (50%–75%) paired with RE adoption over 50% allow the train to outperform the diesel bus substantially.
Figure 2
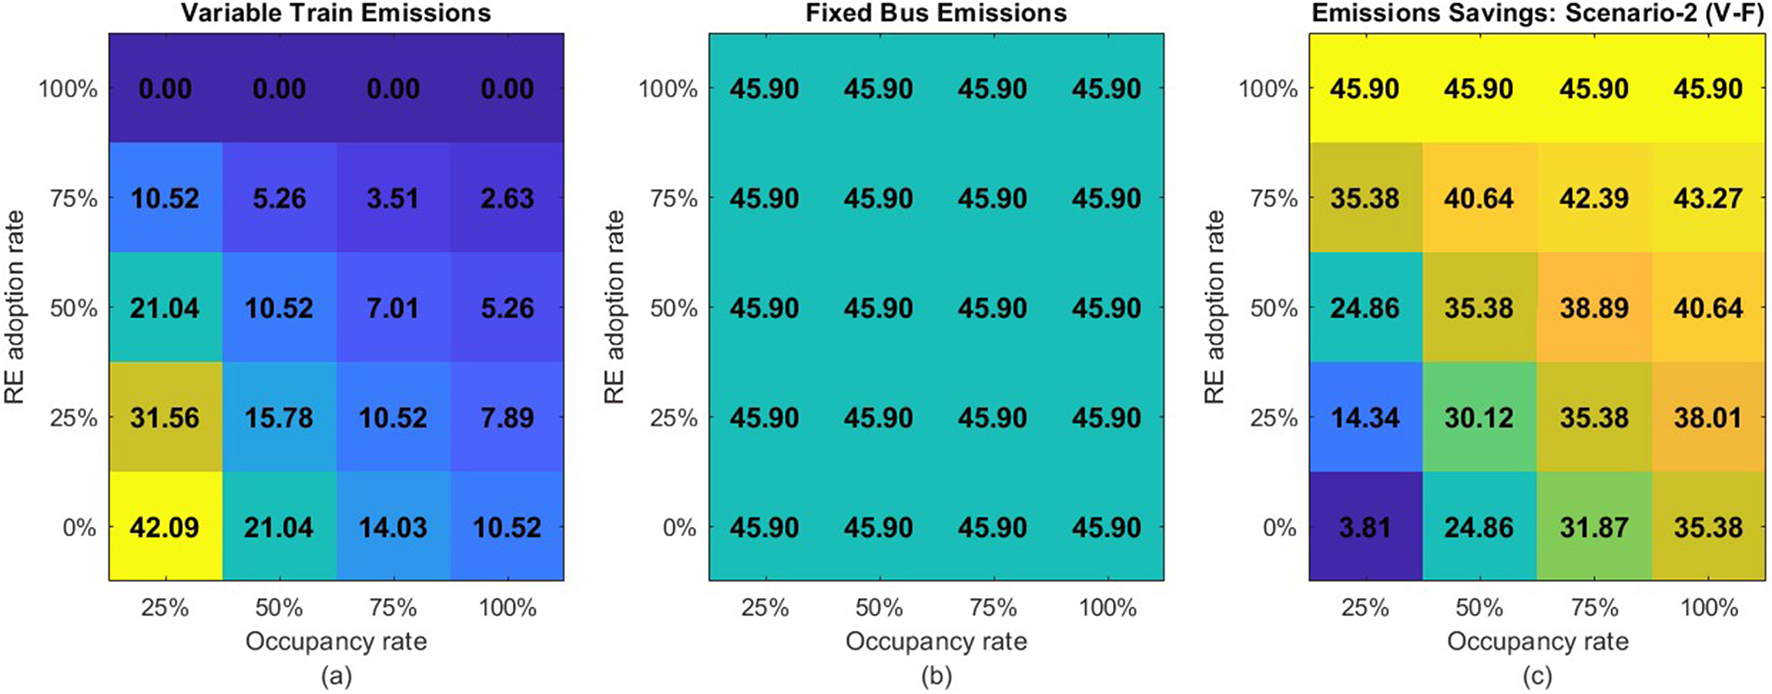
(a–c) Scenario 2: Comparative train and bus emissions with associated emission savings, measured in kg CO2 per passenger for the entire 450 km journey.
Scenario 2 demonstrates strong synergy between high train occupancy and RE adoption in reducing emissions. The system is especially sensitive at low RE levels, where occupancy is the dominant driver of performance. CO2 savings span from 3.81 kg/passenger (worst case) to 45.9 kg/passenger (best case), confirming that meaningful mitigation requires exceeding 50% thresholds in both RE adoption and occupancy (Figure 2c).
5.3 Comparative emissions and savings analysis of Scenario 3
Scenario 3 models fixed train energy efficiency (15 kWh/km) while accounting for variable bus emissions influenced by occupancy levels. Diesel bus emissions decrease with higher occupancy due to load-sharing benefits, while train emissions stay constant across occupancy levels but drop progressively with greater RE adoption.
At low RE penetration (0%–25%) and low occupancy (25%), diesel buses outperform trains. For example, with 0% RE adoption and 25% occupancy, the train emits 2.69 kg CO2/passenger more than the bus (Figures 3a, b). Net CO2 savings from rail become positive around 50%−75% RE adoption, depending on occupancy level. At 50% occupancy and 75% RE, the train saves 2.31 kg CO2/passenger compared to the bus. At 100% RE, electric trains outperform diesel buses across all occupancy levels, with savings ranging from 2.98 to 11.93 kg CO2/passenger (Figure 3c). Electric trains are disadvantaged when both occupancy and RE levels are low. However, as RE adoption increases, even at static train efficiency, trains begin to outperform buses, especially when both occupancy and RE exceed 50%.
Figure 3
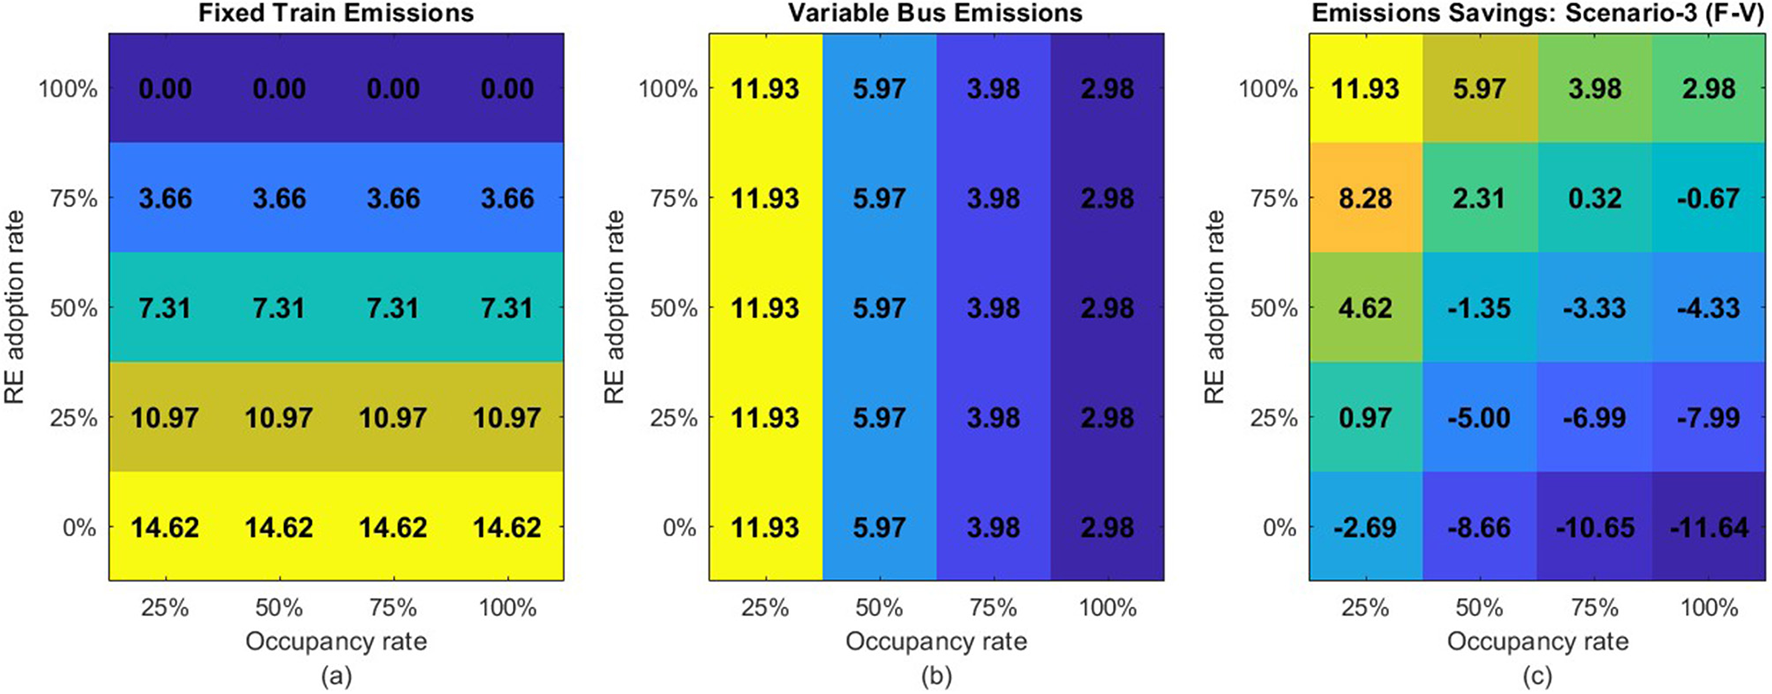
(a–c) Scenario 3: Comparative train and bus emissions with associated emission savings, measured in kg CO2 per passenger for the entire 450 km journey.
Scenario 3 underscores the pivotal role of clean electricity in reducing train emissions. Although low occupancy paired with fossil-based grids hampers rail performance, full RE integration reverses this trend completely. Figure 3c highlights a savings range from −11.64 kg CO2/passenger (worst case) to 11.93 kg CO2/passenger (best case), demonstrating that grid decarbonization can unlock HHR full environmental potential.
5.4 Comparative emissions and savings analysis of Scenario 4
This scenario reflects the most realistic modeling, capturing how both train and bus emissions vary with occupancy and RE adoption. Unlike earlier scenarios, train emissions here adjust dynamically with occupancy, and bus emissions continue to drop at higher occupancy due to load-sharing. At 0% RE and 25% train occupancy, the train emits 30.15 kg CO2/passenger more than a diesel bus, which is the worst-case emissions gap (Figures 4a, b). The emissions gap begins to close as RE integration exceeds 50%, and at 75% RE adoption, with just 25% occupancy, trains start outperforming buses with a savings of 1.41 kg CO2/passenger. At 100% RE, train emissions hit zero, delivering CO2 savings across all occupancy levels ranging from 2.98 to 11.93 kg CO2/passenger (Figure 4c).
Figure 4
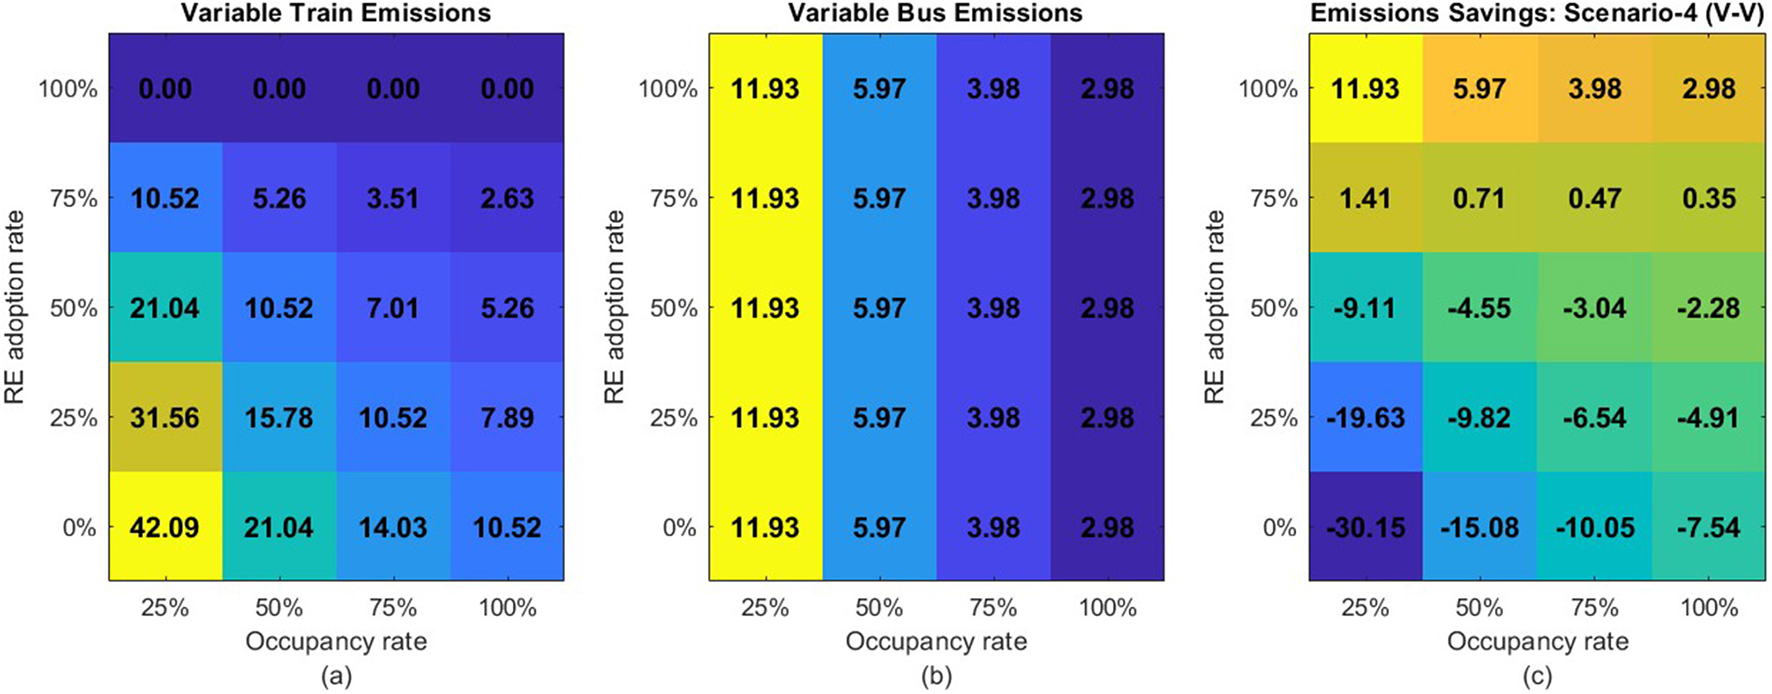
(a–c) Scenario 4: Comparative train and bus emissions with associated emission savings, measured in kg CO2 per passenger for the entire 450 km journey.
This dynamic scenario highlights the interplay of occupancy and grid cleanliness in determining transport sustainability. Trains underperform when fossil energy dominates, and occupancy is low. However, trains consistently outperform even under minimal occupancy for RE adoption ≥75% and achieve complete decarbonization at 100% RE adoption, reinforcing the power of clean grids and public transport optimization. Diesel buses maintain steady emissions regardless of RE adoption but benefit from increasing occupancy.
In conclusion, across all scenarios, RE adoption emerges as the dominant driver for reducing transport emissions. Train performance is highly sensitive to both occupancy rate and RE adoption levels, but emissions reach zero under full RE adoption. Diesel buses benefit from higher occupancy but remain carbon-intensive and are outperformed when RE penetration exceeds 75%. The shift consistently favors electric trains when grid decarbonization and passenger density align. CO2 savings span from −30.15 to +45.9 kg/passenger across cases. Advancing RE adoption and public transport use is therefore critical to climate-optimized mobility. This aligns directly with UN SDG 7.3 and 11.2, promoting energy efficiency and sustainable transport systems to ensure affordable, clean energy and inclusive urban mobility.
5.5 Comprehensive annual CO2 savings analysis across scenarios
This section evaluates annual carbon savings across four scenarios (see Figure 5), assuming 24 daily round-trip trains with a daily passenger capacity of 20,016 and accounting for a 15% operational efficiency loss.
-
S1 (F-F): annual emission savings rise linearly with RE adoption, peaking at 285 kT CO2 under full RE adoption. Occupancy has no impact as both transport modes operate with fixed energy parameters. This scenario offers stable and predictable gains with a minimum of 194 kT CO2 even under fossil-based grids.
-
S2 (V-F): synergistic gains emerge with rising RE adoption and occupancy, and savings surpass 219 kT CO2 when both exceed 50%, reaching the optimal 285 kT CO2 at 100% RE adoption and occupancy, matching Scenario 1 despite additional complexity. Notably, this scenario already becomes viable at 0% RE adoption, given strong occupancy influence.
-
S3 (F-V): maximum annual CO2 savings of 74 kT occur only under 100% occupancy and RE adoption. However, net annual CO2 savings turn negative (up to −72 kT) when both occupancy and RE adoption are low, indicating underperformance relative to diesel buses. Results shift positive once RE adoption exceeds 30%, revealing moderate sensitivity to grid composition.
-
S4 (V-V): this scenario reflects the most realistic conditions. At low occupancy and RE adoption, trains are penalized with annual CO2 savings dropping to −187 kT. Carbon gains emerge only when RE adoption exceeds 50%, improving significantly beyond 75%. Maximum annual CO2 savings reach 74 kT, identical to Scenario 3, confirming that both high occupancy and RE adoption are essential for environmental benefit.
Figure 5
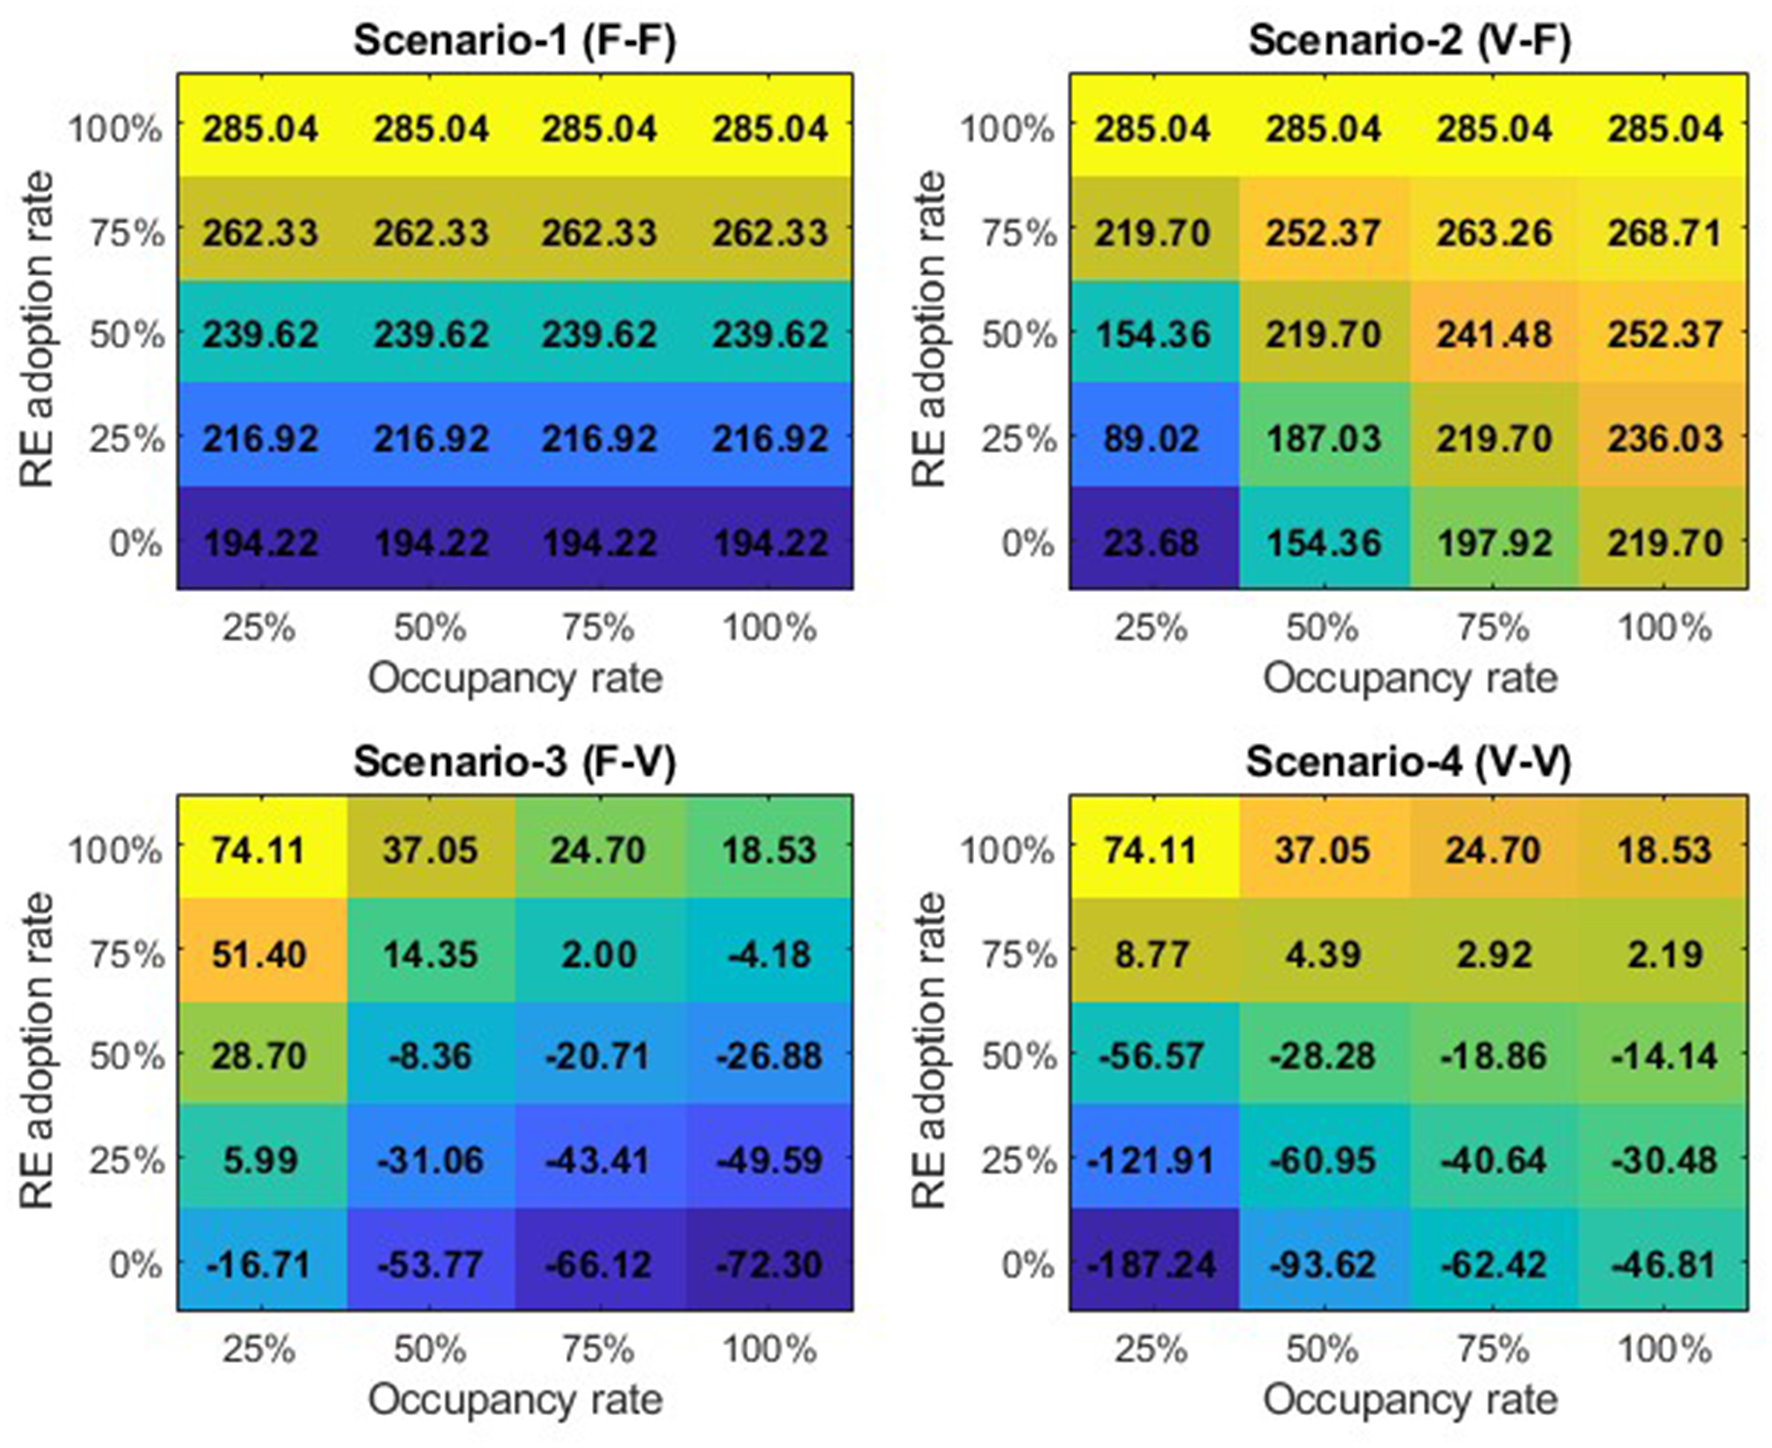
Total annual CO2 emission (measured in kilotonnes) reduction potential of the Haramain High-Speed Railway (HHR) system for each scenario.
5.6 Operational policy strategies for optimizing occupancy and decarbonization
Building on the annual savings analysis presented in Section 5.5, the data clearly demonstrate that occupancy is not merely a secondary operational factor, but the principal determinant of emission outcomes in electrified transport systems. Scenarios 3 and 4 reveal that even with 100% RE adoption, low ridership can result in net-negative annual CO2 savings as steep as −187 kT, while optimized occupancy delivers annual CO2 saving gains of up to +285 kT. The following targeted strategies translate these findings into policy-relevant interventions:
-
First, intermodal integration, such as synchronized feeder buses, station access improvements, and unified ticketing platforms, has proven effective in increasing station-level occupancy and reducing transfer times (Chen, 2025).
-
Second, fare restructuring, including dynamic pricing and off-peak discounts, has demonstrated ridership gains in systems like California's HSR and Japan's Shinkansen (High Speed Rail Alliance, 2023).
-
Third, service quality enhancements, such as onboard digital amenities and comfort upgrades to real-time occupancy dashboards, have been linked to improved mode preference and repeat ridership (High Speed Rail Alliance, 2023).
These recommendations are supported by recent global best practices. For example, (Zhou et al. 2024) developed a multi-objective optimization framework to enhance passing capacity in HSR hub stations, specifically for multi-directional train routes. (Feng et al. 2022) underscored the importance of robust scheduling, integrated timetabling and coupling optimization for managing fluctuating passenger demand in HSR networks. Additionally, (Zheng and Zhang 2024) applied a multi-objective optimization approach to improve station track utilization, focusing on operational robustness under stochastic intervals. Finally, (Chen et al. 2025) proposed a two-level spatiotemporal network model to enhance timetable resilience in HSR systems by strengthening their ability to absorb disturbances. Building on these global insights, this study moves beyond operational modeling to quantify emissions under dynamic occupancy and renewable energy conditions which is a critical gap often overlooked in HSR sustainability literature. Unlike recent works (Zhou et al., 2024; Feng et al., 2022; Zheng and Zhang, 2024; Chen et al., 2025) that treat infrastructure and scheduling as separate domains, this study results reveal the compounded environmental value of integrating occupancy strategies with clean energy adoption. Far from a logistical detail, occupancy optimization emerges as a strategic fulcrum for rail decarbonization. Hence, by embedding these mechanisms into the daily operations of HHR, Saudi Arabia can fully leverage its HSR investments to accelerate climate gains and advance the net-zero pillars of Vision 2030.
6 Conclusion
This study advances sustainable transport discourse by identifying the operational thresholds at which HHR transitions from a carbon liability into a climate asset. Through dynamic multi-scenario modeling of Grid Emission Factor (GEF), RE adoption, Occupancy Rate, and Train Energy Efficiency (TEE), three key conclusions emerge:
-
First, occupancy variation produces up to 45.9 kg CO2 per passenger differential, even with 100% RE adoption, which means that electrification alone is insufficient to guarantee decarbonization. Hence, efficient capacity utilization is a prerequisite for climate performance.
-
Second, substantial positive savings only emerge when both occupancy and RE adoption exceed 50% with nonlinear benefits materializing beyond this threshold. This finding affirms the importance of pairing clean energy investments with operational intelligence.
-
Third, underutilization comes at a steep cost: the HHR can emit annual emissions up to 187 kT more than buses under suboptimal RE adoption and occupancy conditions. Conversely, at 100% occupancy and RE adoption, the system yields annual CO2 savings of 285 kT, confirming that environmental returns on rail investment depend on robust ridership management.
In response, actionable policy guidance is required. Off-peak fare incentives, seamless multimodal integration, and real-time occupancy monitoring are essential for balancing infrastructure efficiency and passenger dynamics. Seasonal scheduling based on demand forecasting can further align supply with usage. These strategies must shift the planning paradigm from infrastructure greening to behavior-responsive operations, where modal performance is continuously tuned for sustainability outcomes. This study establishes a foundational reference for future research seeking to identify operational decarbonization thresholds in HSR systems based on an integrated analysis of RE and occupancy dynamics. By bridging infrastructure and rider behavior, this framework advances SDG-aligned transport decarbonization (SDGs 9, 11, 13) and offers a replicable blueprint for climate-smart rail development across arid and urbanized regions alike.
Statements
Data availability statement
The original contributions presented in the study are included in the article/supplementary material, further inquiries can be directed to the corresponding author.
Author contributions
HAW: Writing – review & editing, Software, Project administration, Funding acquisition, Supervision, Resources, Writing – original draft, Formal analysis, Methodology, Visualization, Data curation, Investigation, Validation, Conceptualization.
Funding
The author(s) declare that no financial support was received for the research and/or publication of this article.
Conflict of interest
The author declares that the research was conducted in the absence of any commercial or financial relationships that could be construed as a potential conflict of interest.
Generative AI statement
The author(s) declare that no Gen AI was used in the creation of this manuscript.
Any alternative text (alt text) provided alongside figures in this article has been generated by Frontiers with the support of artificial intelligence and reasonable efforts have been made to ensure accuracy, including review by the authors wherever possible. If you identify any issues, please contact us.
Publisher’s note
All claims expressed in this article are solely those of the authors and do not necessarily represent those of their affiliated organizations, or those of the publisher, the editors and the reviewers. Any product that may be evaluated in this article, or claim that may be made by its manufacturer, is not guaranteed or endorsed by the publisher.
Footnotes
References
1
Aljehani L. (2023). The impact of the Haramain high-speed train on land prices and urban growth in the neighborhoods of Tibah municipality, Jeddah, Saudi Arabia. Curr. Urban Stud.11, 415–446. 10.4236/cus.2023.113023
2
Alshoufi K. Al-Nagar K. Fischer S. (2024). Integrating renewable energy into railway systems: a path to sustainable transportation–a review. Chem. Eng. Trans.114, 817–822. 10.3303/CET24114137
3
Baron T. Tuchschmid M. Martinetti G. Pépion D. (2011). High Speed Rail and Sustainability: Background Report—Methodology and Results of Carbon Footprint Analysis. International Union of Railways (UIC). Available online at: https://railroads.dot.gov/sites/fra.dot.gov/files/fra_net/15009/Carbon%20Footprint%20of%20High-Speed%20Rail%20UIC%202011.pdf (Accessed June, 2025).
4
Bätzner A. (2015). “Greening urban transport in the Gulf Cooperation Council countries: localised approaches to modal integration as key success factors,” in The Green Economy in the Gulf (London: Routledge), 161–180.
5
California Air Resources Board (2019). On-Road EMFAC Emissions Model Documentation. Available online at: https://ww2.arb.ca.gov/our-work/programs/msei/on-road-emfac
6
Chen J. (2021). High-speed rail and energy consumption in China: the intermediary roles of industry and technology. Energy230:120816. 10.1016/j.energy.2021.120816
7
Chen Z. (2025). Policy Considerations for National High-Speed Rail Network Development: Cases from the People's Republic of China. 10.56506/QQWG6915
8
Chen Z. Chen J. Zheng H. Gao T. (2025). Enhancing high-speed railway timetable resilience: a two-level spatiotemporal network model focused on disturbance absorption. Urban Rail. Transit. 11, 67–89. 10.1007/s40864-024-00235-3
9
Chester M. Horvath A. (2008). Environmental Life-cycle Assessment of Passenger Transportation: A Detailed Methodology for Energy, Greenhouse Gas and Criteria Pollutant Inventories of Automobiles, Buses, Light Rail, Heavy Rail and Air v.2. UC Berkeley: Center for Future Urban Transport: A Volvo Center of Excellence. Available online at: https://escholarship.org/uc/item/5670921q (Accessed June, 2025).
10
China Railway (2025). China Railway System Overview. Available online at: http://www.china-railway.com.cn/english/ (Accessed June, 2025).
11
Cwil M. Bartnik W. Jarzebowski S. (2021). Railway vehicle energy efficiency as a key factor in creating sustainable transportation systems. Energies14:5211. 10.3390/en14165211
12
da Fonseca-Soares D. Eliziário S. A. Galvincio J. D. Ramos-Ridao A. F. (2024). Greenhouse gas emissions in railways: systematic review of research progress. Buildings14:539. 10.3390/buildings14020539
13
Department for Energy Security and Net Zero (2024). Greenhouse Gas Reporting: Conversion Factors 2024. GOV.UK. Available online at: https://www.gov.uk/government/publications/greenhouse-gas-reporting-conversion-factors-2024 (Accessed June, 2025).
14
Ember; Energy Institute (2025). “Carbon intensity of electricity generation – Ember,” in Energy, eds. H. Ritchie, P. Rosado, and M. Roser (Our World in Data). Available online at: https://ourworldindata.org/grapher/carbon-intensity-electricity (Accessed June, 2025).
15
Eurail (2025). TGV High-Speed Trains in Europe. Available online at: https://www.eurail.com/en/plan-your-trip/trip-ideas/trains-europe/high-speed-trains/tgv (Accessed June, 2025).
16
Feng Z. Cao C. Mostafizi A. Wang H. Chang X. (2022). Uncertain demand-based integrated optimisation for train timetabling and coupling on the high-speed rail network. Int. J. Prod. Res.61, 1532–1555. 10.1080/00207543.2022.2042415
17
Gao Y. Zhang Y. Wang K. Y. Yip T. L. (2023). Exploring the carbon-mitigation effect of high-speed railway and its underlying mechanism. Sustainability15:12725. 10.3390/su151712725
18
Hannah Ritchie (2020a). Cars, Planes, Trains: Where do CO2Emissions from Transport Come From? Available online at: https://ourworldindata.org/co2-emissions-from-transport (Accessed June, 2025).
19
Hannah Ritchie (2020b). Sector by Sector: Where do Global Greenhouse Gas Emissions Come From? Available online at: https://ourworldindata.org/ghg-emissions-by-sector (Accessed June, 2025).
20
Haramain High-Speed Railway (2025). About HHR. Available online at: https://sar.hhr.sa/about-hhr/about-us (Accessed June, 2025).
21
Harris M. Dupont L. (2023). Case Studies in Sustainable Mobility: Shinkansen and TGV. Cambridge: Cambridge University Press.
22
Harvey J. Thorpe N. Caygill M. Namdeo A. (2014). Public attitudes to and perceptions of high speed rail in the UK. Trans. Policy36, 70–78. 10.1016/j.tranpol.2014.07.008
23
HHR (2023). Annual Ridership and Utilization, Saudi Railways. Haramain Railway Serves 7M Passengers in 2023. Available online at: https://www.argaam.com/en/article/articledetail/id/1696798
24
High Speed Rail Alliance (2023). Needed Policy Changes. Available online at: https://www.hsrail.org/needed-policy-changes (Accessed June, 2025).
25
IEA (2022). Emissions Factors 2022. Available online at: https://www.iea.org/data-and-statistics/data-product/emissions-factors-2022 (Accessed August 13, 2025).
26
Intergovernmental Panel on Climate Change (2022). Climate Change 2022: Mitigation of Climate Change. Chapter 10: Transport. Available online at: https://www.ipcc.ch/report/ar6/wg3/chapter/chapter-10/ (Accessed June, 2025).
27
International Energy Agency (2019). The Future of Rail: Opportunities for Energy and the Environment. OECD Publishing. Available online at: https://www.iea.org/reports/the-future-of-rail (Accessed June, 2025).
28
International Energy Agency (2023). Transport - Energy System. Available online at: https://www.iea.org/energy-system/transport (Accessed June, 2025).
29
International Union of Railways (2022). Activity Report 2022. Available online at: https://uic.org/IMG/pdf/uic_activity_report_2022.pdf (Accessed June, 2025).
30
Invest Saudi (2024). Renewable Energy Investment Brochure. Available online at: https://misa.gov.sa/app/uploads/2024/03/investsaudi-renewable-energy-brochure.pdf (Accessed June, 2025).
31
Japan Rail Pass (2025). Shinkansen Bullet Trains. Available online at: https://www.jrailpass.com/shinkansen-bullet-trains (Accessed June, 2025).
32
Kalinowski M. (2025). “High-speed rail as a sustainable alternative to air travel with an example of travelling between Copenhagen and Stockholm,” in Socioeconomic Impacts of High-Speed Rail Systems. IW-HSR 2023. Springer Proceedings in Business and Economics, ed. F. Pagliara (Cham: Springer). 10.1007/978-3-031-82528-6_5
33
KAPSARC (2024). Inside the Grid of the Future. Available online at: https://futures.kapsarc.org/inside-the-grid-of-the-future/ (Accessed June, 2025).
34
Liu L. X. Clegg S. Pollack J. (2024). The effect of public–private partnerships on innovation in infrastructure delivery. Project Manag. J.55, 31–49. 10.1177/87569728231189989
35
Ministry of Energy Saudi Arabia. (2024). National Energy Strategy Dashboard. Available online at: https://www.moenergy.gov.sa (Accessed June, 2025).
36
Nøland J. K. (2024). A reality check on maglev technology for the hyperloop transportation system: status update after a decade of development. IEEE Access12, 162918–16292810.1109/ACCESS.2024.3491904
37
OECD (2019). The Future of Rail. Available online at: https://www.iea.org/reports/the-future-of-rail (Accessed June, 2025).
38
Rawat R. S. Boruah A. Chatterjee P. Pawar D. S. (2024). Assessing real-world emissions from BS-VI Diesel Buses in Indian Urban and Sub-urban Traffic. Urban Mobility India. Available online at: https://www.urbanmobilityindia.in/Upload/Conference/3_AISHREE_08022024.pdf (Accessed June, 2025).
39
Saudi Green Initiative (2023a). Reducing Carbon Emissions: Roadmap to Net-zero by 2060. Available online at: https://www.sgi.gov.sa/about-sgi/sgi-targets/reduce-carbon-emissions/ (Accessed June, 2025).
40
Saudi Green Initiative (2023b). Saudi Green Initiative Portal. Available online at: https://www.sgi.gov.sa
41
Saudi Green Initiative (2023c). Vision 2030. Saudi Green Initiative. Available online at: https://www.vision2030.gov.sa/en/explore/projects/saudi-green-initiative (Accessed August 13, 2025).
42
Saudi Green Initiative (2024). Proactive Green Initiatives for Positive Global Impact. Riyadh: Saudi and Middle East Green Initiatives.
43
Saudipedia (2024). National Renewable Energy Program. Available online at: https://saudipedia.com/en/article/908/government-and-politics/national-renewable-energy-program (Accessed June, 2025).
44
Shen Q. Pan Y. Feng Y. (2023). The impacts of high-speed railway on environmental sustainability: quasi-experimental evidence from China. Humanit. Soc. Sci. Commun. 10:719. 10.1057/s41599-023-02135-6
45
Statista Research Department (2025). Transportation Emissions Worldwide – Statistics and Facts. Available online at: https://www.statista.com/topics/7476/transportation-emissions-worldwide/ (Accessed June, 2025).
46
Talgo S.A. (2025). Talgo 350 – Technical Specifications. Available online at: https://www.talgo.com
47
UIC (2020). GEOHSR: Guidelines on Operational Efficiency for High-Speed Rail. Available online at: https://css0.uic.org/com/enews/article/uic-passenger-department-has-just-launched-geohsr-guidelines-on-operational (Accessed June, 2025).
48
UIC (2023). UIC Middle-East Railways Vision 2050. Available online at: https://uic.org/middle-east/IMG/pdf/uic_rame_vision_2050_web.pdf (Accessed June, 2025).
49
UNECE (2024). ITC Strategy on Reducing GHG Emissions from Inland Transport. Available online at: https://unece.org/sites/default/files/2024-10/ITC%20Strategy%20on%20Reducing%20GHG%20from%20Inland%20Transport%20EN.pdf (Accessed June, 2025).
50
United States Environmental Protection Agency (2025). GHG Emission Factors Hub. Available online at: https://www.epa.gov/climateleadership/ghg-emission-factors-hub (Accessed June, 2025).
51
Vision 2030 (2022). Sustainability Pillars in Saudi Arabia. Available online at: https://www.vision2030.gov.sa (Accessed June, 2025).
52
Wang Q. Chen L. Liu T. (2024). Has the opening of high-speed railway in China promoted urban low-carbon transformation along the route: re-estimation based on staggered DID robust estimators. Environ. Sci. Pollut. Res. 31, 19274–19293. 10.1007/s11356-024-32353-7
53
Watson I. Ali A. Bayyati A. (2022). Energy efficiency of high-speed railways. Adv. Environ. Eng. Res.3, 1–22. 10.21926/aeer.2204055
54
World Bank Group (2022). Lawrence, Martha, and Richard Bullock. 2022. The Role of Rail in Decarbonizing Transport in Developing Countries. Mobility and Transport Connectivity Series. Available online at: https://documents1.worldbank.org/curated/en/099063023170016545/pdf/P1748630c1d3630a80876405ecad08e27f8.pdf (Accessed June, 2025).
55
World Population Review (2025). CO2Emissions by Country. Available online at: https://worldpopulationreview.com/country-rankings/co2-emissions-by-country (Accessed August 13, 2025).
56
World Resources Institute (2023). Climate partnerships in the Middle East. Available online at: https://www.wri.org/publications/innovative-climate-partnerships (Accessed June, 2025).
57
Zheng Y. Zhang D. (2024). Optimization study of station track utilization in high-speed railroad based on constraints of control in random origin and process. Railway Sci.3, 332–343. 10.1108/RS-04-2024-0010
58
Zhou H. Zhou L. Xu B. Zou D. (2024). Evaluating passing capacity in high-speed rail hub stations: multi-objective optimization for multi-directional train routes. Sustainability16:10298. 10.3390/su162310298
Summary
Keywords
transportation engineering, scenario-based mathematical modeling, sustainable transportation, optimal thresholds, UN-SDGs, carbon emission reduction, green transformative infrastructure, Saudi Vision 2030
Citation
Wajid HA (2025) Saudi Arabia's green leap: unlocking the climate potential of the Haramain High-Speed Railway through occupancy optimization and renewable energy adoption. Front. Sustain. Cities 7:1643872. doi: 10.3389/frsc.2025.1643872
Received
09 June 2025
Accepted
17 August 2025
Published
17 September 2025
Volume
7 - 2025
Edited by
Salvador García-Ayllón Veintimilla, Polytechnic University of Cartagena, Spain
Reviewed by
Kossivi Fabrice Dossa, University of Nigeria, Nigeria
Yingzhi Wang, Beijing Jiaotong University, China
Updates
Copyright
© 2025 Wajid.
This is an open-access article distributed under the terms of the Creative Commons Attribution License (CC BY). The use, distribution or reproduction in other forums is permitted, provided the original author(s) and the copyright owner(s) are credited and that the original publication in this journal is cited, in accordance with accepted academic practice. No use, distribution or reproduction is permitted which does not comply with these terms.
*Correspondence: Hafiz Abdul Wajid hawajid@iu.edu.sa
Disclaimer
All claims expressed in this article are solely those of the authors and do not necessarily represent those of their affiliated organizations, or those of the publisher, the editors and the reviewers. Any product that may be evaluated in this article or claim that may be made by its manufacturer is not guaranteed or endorsed by the publisher.