Abstract
This study addresses the environmental impacts of a critical infrastructure, water distribution pipelines. In Sharjah’s expanding urban areas, selecting appropriate pipe materials is crucial for sustainable resource usage, as the impacts these resource-intensive pipelines have on the environment are significant during the entire pipe life cycle from manufacturing to disposal. This paper presents a comparative lifecycle assessment (LCA) of Glass Reinforced Plastic (GRP) and High-Density Polyethylene (HDPE) pipes by utilizing SimaPro software and Ecoinvent V3 database to evaluate the selected pipes’ environmental impacts across their entire lifecycle. The results show that the production phase of both pipes has the highest overall environmental impact, and reducing pipe diameters may significantly decrease these impacts. Results from HDPE pipes show higher impacts in climate change and fossil depletion categories, whereas GRP pipes show higher impacts in human toxicity and ozone depletion. However, overall, GRP pipes have a lower impact on human health, ecosystems, and resources. These insights can be used to aid decision-makers and governmental bodies, such as the Sharjah Electrical and Water Authority (SEWA), in making well-informed and strategic choices aligned with the 11th UN Sustainable Development Goal of fostering sustainable cities and communities, thus ultimately contributing towards reducing the harmful environmental impacts of water distribution systems. This LCA-based study contributes towards a more sustainable and environmentally friendly approach to water distribution system planning and management, with the ultimate aim of ensuring the longevity and health of urban infrastructures.
1 Introduction
The UN Sustainable Development Goals aim to foster sustainable cities and communities, ultimately contributing to the reduction of the harmful environmental impacts of water distribution systems (WDSs) (United Nations, 2022). WDSs are key to ensuring a good quality water supply to individual households. Ensuring the sustainability of WDSs is vital for managing water resources in a manner that safeguards ecosystems and human health, while promoting economic efficiency. Though WDSs are a vital necessity for all societies, the construction and operation of such systems create a considerable amount of greenhouse gas (GHG) emissions (Stokes et al., 2014). The Dubai Electricity and Water Authority (DEWA) in the United Arab Emirates (UAE), cognizant of the pivotal role of informed decision making in water infrastructure projects, has underscored the significance of research to pursue sustainable practice (Dubai Electricity and Water Authority, 2020). A comprehensive review of quantitative measures of sustainability in WDSs emphasizes the significance of sustainable development that includes environmental impact and triple bottom line (Lee and Kim, 2020). The importance of sustainable WDSs extends beyond environmental concerns, additionally encompassing social and economic aspects, as furthermore stated by the United Nations’ Sustainable Development Goals (SDGs), particularly Goal 6, which aims to ensure availability and sustainable management of water and sanitation for all (The Global Goals, 2022). The American Society of Civil Engineers likewise underscores the importance of sustainable water distribution systems for the overall wellbeing of communities (Lee and Kim, 2020), which is further reinforced by the World Bank’s initiatives on water resource management and infrastructure development’s stress on the importance for sustainable practices in water distribution (The World Bank, 2022). A lack of such practices may lead to certain regions seeing as much as a 6% GDP decline by 2050 as a result of water-related losses (The World Bank, 2019). A water supply and sanitation board discussion paper series published by The World Bank reveals the estimated amount of nonrevenue water from physical losses caused by either leaks, breaks, or others to be 9.8 billion cubic meters per year for developed countries, while 16.1 billion cubic meters per year for developing countries. This amounts to an estimated loss of 2.9 billion and 3.2 billion US dollars per year, respectively (Kingdom et al., 2006). The water-energy-food (WEF) nexus approach, recognized as a key strategy for addressing sustainable development challenges (Lalawmpuii and Kumar, 2023), underscores the interconnected nature and the critical role WDSs play in WEF, as illustrated in Figure 1. This collectively displays the pivotal role of sustainable WDSs, guaranteeing an efficient and responsible water supply to ensure resilience and stability across various sectors.
Figure 1
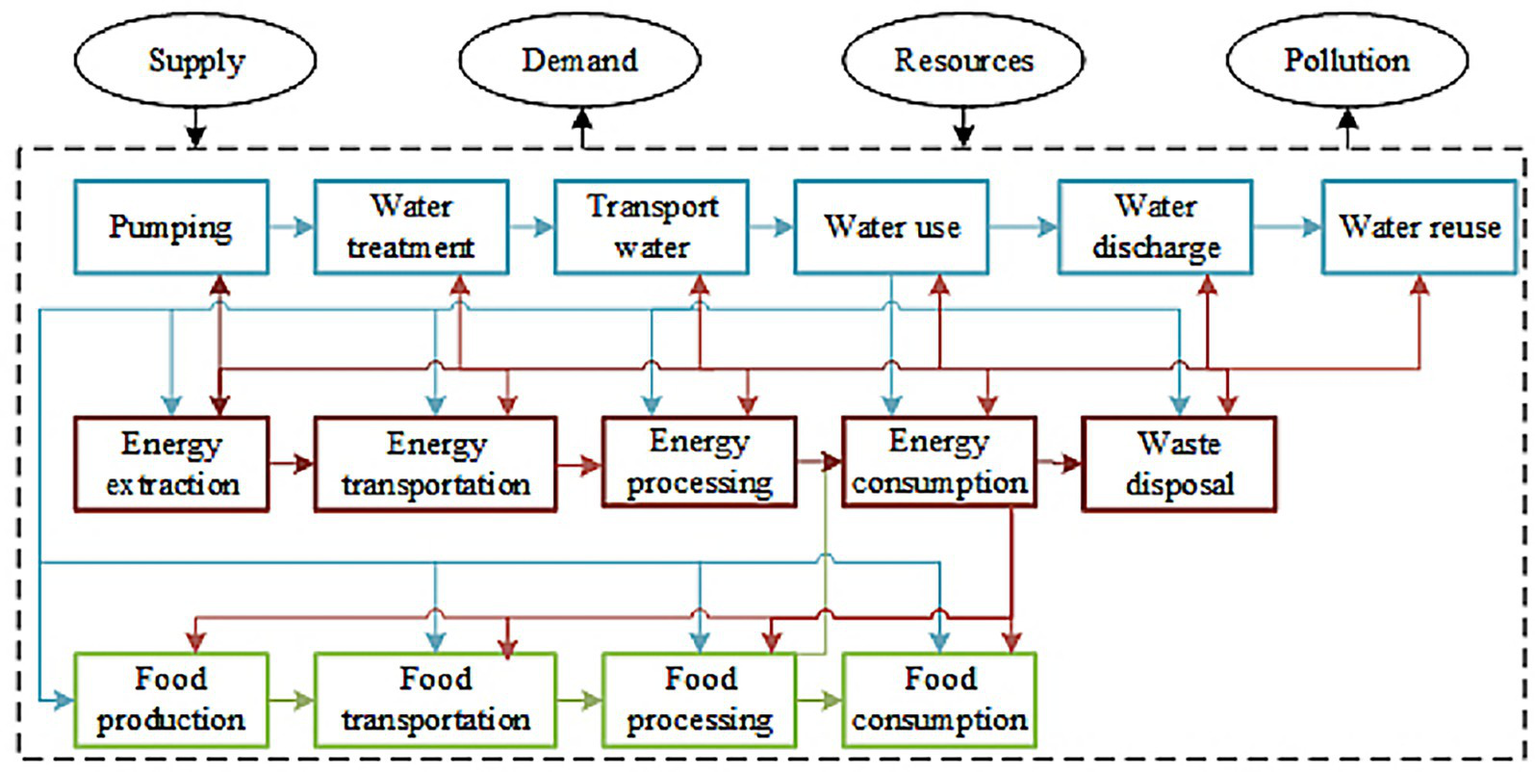
Relation among water, energy, and food (adapted from Li et al., 2021).
The Intergovernmental Panel on Climate Change (IPCC) underscores the urgency of employing holistic lifecycle-based approaches within urban infrastructure to fulfill sustainable development goals by highlighting the significance of such comprehensive approaches within infrastructure planning processes to mitigate potential long-term environmental impacts (Dodman et al., 2019). Water distribution pipelines play a pivotal role in ensuring the uninterrupted and clean supply of water. As the demand for water infrastructure rises in response to rapid urbanization (United Nations, 2018), understanding the complete lifecycle of these pipes becomes imperative for the development of reliable, resilient, and environmentally sustainable infrastructure. Thus, the selection of environmentally sustainable and long service-life pipe materials becomes a vital topic to ensure minimal to no interruptions, and environmental and health impact, resulting in a high quality of life and a strong urban economy. By enabling the evaluation of environmental impacts of such systems throughout their entire life cycle, valuable insights are attained on the most sustainable options for water distribution systems.
Life Cycle Assessment (LCA) is a comprehensive and systematic framework used to evaluate, characterize, quantify, and interpret environmental impacts, such as adverse effects on ecosystems, human health, and natural resources, of a product or service throughout its entire life cycle (Baumann and Tillman, 2004). It is a powerful iterative tool that allows for continuous improvement, which significantly contributes to the sustainable optimization of public water services (Sander-Titgemeyer et al., 2023). LCA greatly aids in reducing the environmental impact of water distribution pipes through its holistic perspective (Sanjuan-Delmás et al., 2014) and allows for a thorough environmental assessment throughout the pipe’s lifecycle (Hajibabaei et al., 2018). Additionally, the assessment allows for the comparison of different pipe materials to identify materials with lower environmental impacts from both an environmental lifecycle and carbon footprint perspective. These factors aid in determining and selecting the most sustainable and cost-effective pipe materials by considering durability, performance, and recyclability, among others (Omar, 2023). Studies conducted evaluating the environmental impacts of water supply pipelines in Italy (Simion et al., 2024), Turkey (Haidery and Baş, 2020), and Mexico City (García-Sánchez and Güereca, 2019) using LCA methodology and concluded the importance of LCA in maintaining sustainability in the long run. LCA thus allows for informed decision-making, leading to the implementation of more sustainable practices, cost-effective solutions, and better resource management, ultimately contributing to the sustainable enhancement of public water services. The significance of informed material selection is vital, as it not only impacts the longevity and efficiency of water infrastructures but moreover plays a pivotal role in mitigating environmental impacts and ensuring the availability of clean water for generations to come.
Non-metallic pipes have been shown to have a CO2 reduction of up to 60% and an energy footprint reduction of up to 50% when measured against metallic pipe material (Zubail et al., 2021). This paper embarks on an LCA that meticulously scrutinizes popular sustainable non-metallic pipe materials in Sharjah, UAE: Glass Reinforced Plastic (GRP) pipes and High-Density Polyethylene (HDPE) pipes. HDPE pipes have been in use for over half a century (HDPE, 2024) and there has been a considerable amount of scientific research focused on LCA for HDPE against various pipe materials such as ductile iron (Du et al., 2013; Hajibabaei et al., 2018), cast iron (Du et al., 2013), reinforced steel (Hajibabaei et al., 2018), and carbon steel (Chohan et al., 2023), concrete (Du et al., 2013; Chohan et al., 2023; Asadollahfardi et al., 2022), and polyvinyl chloride (PVC) pipes (Du et al., 2013; Hajibabaei et al., 2018; Asadollahfardi et al., 2022). GRP pipes, on the other hand, have been used for well over three decades, and samples retrieved from Riyadh—Saudi Arabia, installed in 1980, and from Norway, installed over 33 years ago, showed little to no deterioration upon inspection (Waldner, 2023). Despite its proven longevity and durability, the gap in LCA research for GRP pipes against other pipe materials is evident when observing recent published studies. One significant reason for this scarcity is the lack of education and information dissemination on the topic, resulting in the direct comparative analysis between HDPE and GRP remaining unexplored.
As existing scientific literature displays the paucity of LCA studies dedicated to HDPE versus GRP pipes, this underscores the imperativeness for such tailored assessments that consider regional variations, such as in the UAE, where the use of GRP pipes has increased in popularity against its widely used competitor, HDPE. GRP is relatively new in the context of piping systems compared to HDPE; regardless, it has gained traction in the city of Sharjah, where HDPE is a popular pipe material choice, thus the need to assess this newer material’s LCA performance comprehensively. This paper aims to conduct a comparative LCA between HDPE and GRP pipes for the City of Sharjah. Through bridging this gap, a sustainable lifecycle-based approach that resonates with the 11th UN Sustainable Development Goal, “Sustainable Cities and Communities,” will be accomplished (United Nations, 2022). This novelty will be achieved by conducting a lifecycle assessment comparing the two popular pipe materials in several parameter categories and evaluating the pros and cons of each material, and ultimately providing future recommendations for decision-makers.
2 Methods
2.1 Methodology phases
As prescribed by the leading international standards that govern LCA methods, ISO 14040 (ISO 14040:2006, 2006) and ISO 14044, the minimum requirements for performing a standard-compliant LCA include four phases, with their description and key elements displayed in Table 1.
Table 1
| Phase | Description |
|---|---|
| Goal and scope definition | Establishing the foundation of the LCA study. |
| Life cycle inventory analysis (LCI) | Data collection and quantification of system inputs and outputs for each stage of the lifecycle. |
| Life cycle impact assessment (LCIA) | Evaluating environmental impacts based on data collection. |
| Life cycle interpretation | Analyzing and discussing results, performing sensitivity and uncertainty analysis, and making recommendations. |
Overview of life cycle assessment (LCA) phases (ISO 14040:2006, 2006; Ramakrishna and Ramasubramanian, 2024).
2.2 Goal and scope
2.2.1 Objective
This study aims to conduct a comprehensive lifecycle assessment of the Glass Reinforced Plastic (GRP) pipes and High-Density Polyethylene (HDPE) pipes throughout their entire lifecycle, which are being broadly utilized within the city of Sharjah’s water distribution system in the UAE. The findings of this research will aid decision makers and governmental officials, such as Sharjah Electrical and Water Authority (SEWA), to identify the most environmentally friendly pipe material for their WDS and additionally evade potential long-term damages, including human health, as in the case of asbestos concrete pipes (Safewater, 2017). This study emerges as a significant contribution to the existing corpus of knowledge, addressing the spaces in understanding the environmental implications of water distribution pipe materials and tailored to the socio-environmental tapestry of the UAE. In advancing current scientific understanding, this research endeavors to chart new frontiers in the field of sustainable WDSs.
2.2.2 Scope
The LCA comparative study of GRP versus HDPE pipes covers the entire life cycle of the pipes, from raw material extraction to end-of-life disposal (cradle-to-grave). This study was conducted by leveraging the LCA software SimaPro, as it utilizes data analysis and comparison of different pipe materials due to its built-in database, the Ecoinvent V3 database, which allows for the facilitation of inventory identification (Bolivar, 2017; SimaPro Manual, 2025).
2.2.3 System boundary
The system boundary that has been studied and created for this LCA inventory involves four stages, including their inputs and outputs as displayed in Figure 2. The inputs involve the energy needed to carry out the stages, while outputs are the waste and emissions created. The first stage involves the Production Stage, where the pipe production processes are completed to create the finished product, followed by the Installation Stage and In-Use Stage. The final stage, also referred to as the Disposal Stage, involves the demolition and transportation of pipe waste for either disposal into a landfill or recycling, where the product is broken down and reused for pipe manufacturing.
Figure 2
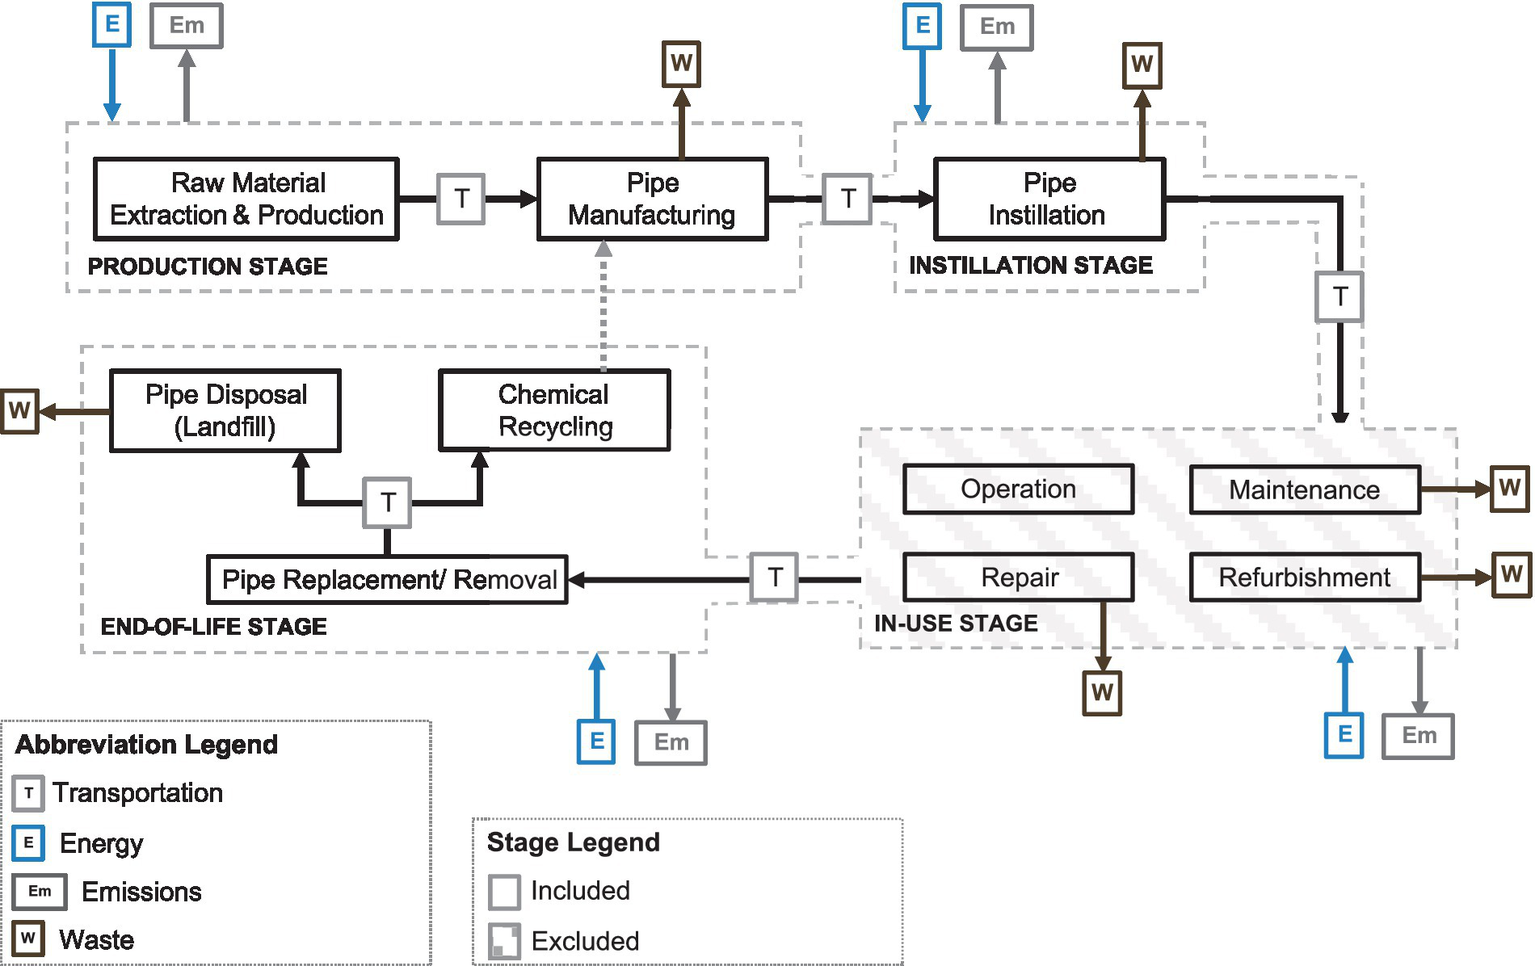
Life cycle system of pipes.
It is vital to add that the Use Stage, which includes the operation phase, was eliminated from the LCA. One major reason is limitations in sufficient data availability in factories and utilities. Additionally, it is difficult to quantify and anticipate the maintenance schedule and frequency, as mentioned by SEWA and pipe suppliers. The main form of maintenance throughout a pipe’s life cycle is typically corrective maintenance, with preventative maintenance being left unperformed. As the pipe studies in this research are relatively novel, their structural behavior and performance are left unpredictable and not fully comprehended. The operation of pipes is the longest stage in the lifecycle of pipes, with its life expectancy usually exceeding the predicted design life. Nonetheless, pipe leakage can occur, prompting an increase in preventative maintenance that may negatively influence the lifecycle assessment results. The design life of GRP and HDPE has been set to approximately 50 years according to suppliers, displaying the similarity in operational lives while leaving maintenance unknown. Thus, it can be assumed that the operation phase does not critically impact the comparison of these two specific pipe materials.
2.2.4 Functional unit
A Functional Unit (FU) is a quantified description of a product’s function that acts as the reference for impact assessment calculations (Rebitzer et al., 2004; ISO 14040:2006, 2006). In other words, FU serves as a standardized measure that ensures comparability of LCA results, thus allowing for a meaningful evaluation of the environmental impacts of GRP and HDPE pipes, considering their entire life cycle from production to end-of-life. For this study, the analysis of GRP and HDPE pipes will be executed based on an FU of one kilometer of pipe, as it would provide a better representation of the environmental impacts in the water distribution system of Sharjah, UAE.
2.2.5 LCA software
To execute the LCA, SimaPro utilizes inventory data from its databases and the pre-defined system boundary (SimaPro Manual, 2025). This allows for a comprehensive analysis of the environmental impacts associated with the system boundary stages. To assess the impact, the software calculates a certain indicator within each impact category and sums up the emissions of the indicator substance from all the processes and the waste scenarios (SimaPro Manual, 2025). For instance, to calculate the global warming impact, the software calculates the CO2 emission from each of the processes and aggregates them to conclude the total impact. The output of the impact assessment can be presented with clear bar charts. To facilitate the comparison of the different processes, the product with the major impact is scaled to 100, and all other products’ impacts are found as a percentage of the highest impact (SimaPro Manual, 2025). For instance, if product one has a CO2 emission of 50 g, product two has a CO2 emission of 25 g, then product 1 will have a height of 100 on the bar chart, hence a height of 50 for product two. SimaPro eight was used in this study.
2.3 Life cycle inventory analysis
This phase uses data collection and calculations to quantify the environmental inputs and outputs, and unit processes within the system boundary as created in Figure 2 (ISO 14040:2006, 2006). LCI is the most intensive and time-consuming part of the analysis due to the extensive data collection required. Data was collected from UAE-based suppliers Naffco Flow Control (HDPE Pipe and Fittings in UAE, 2025), Abu Dhabi Pipe Factory (Abudhabi Pipe Factory, 2022), Dubai Pipe Factory (Dubai Pipes Factory Company, 2025), and SEWA. SEWA was additionally consulted on several aspects of pipe life cycles. The data collected must be adjusted to relate to the defined functional unit from the initial goal and scope phase.
2.3.1 Pipe production process
The production process of GRP pipes involves a steel tape with a liner initially assembled by winding on a pipe steel formwork that is of the intended dimension, followed by chopped roving and hoop roving. Silica sand is added, and then resin during the winding cycles in the manufacturing process to act as a cohesive material that binds the components of the pipe, and finally cured to recover the full capacity (Ancaș et al., 2021). Their proportions vary based on the required diameter and SDR. The portions used in this study are 26.41, 38.28, and 35.31% for Resin, Fiberglass, and Silica Sand, respectively (Ancaș et al., 2021).
For HDPE, raw materials derived from petroleum are used to produce polyethylene particles (Zhao et al., 2005). These particles are initially heated, followed by an extrusion process and calibration where several additives and stabilizers are integrated to enhance the material’s properties (Sangani and Popat, 2019). The material is pressed into the intended pipe shape and dimensions, and finally cooled down in a designated water tank (Sangani and Popat, 2019).
2.3.2 Pipe inventory
According to Dubai Pipes Factory and Abu Dhabi Pipe Factory, 250 and 300 mm pipes are the most utilized GRP pipe diameters in the UAE water distribution network (Abudhabi Pipe Factory, 2022; Dubai Pipes Factory Company, 2025). The industrial standard for span length is 12 m with a stiffness of 10,000 N/m2. Pipes of these characteristics hold a weight of 10 and 13 kg/m, respectively. Naffco flow control Factory states that 250 and 315 mm pipes are the most utilized HDPE pipes in the UAE water distribution network (HDPE Pipe and Fittings in UAE, 2025). The industrial standard for span length is 12 m with an SDR of 11. Pipes with such properties weigh 16.57 and 26.31 kg/m, respectively. All the GRP and HDPE pipe materials assumed to have an operational service lifespan of 30 years.
The energy consumption for GRP and HDPE pipes throughout their lifecycles is displayed in Table 2. In the instillation phase, the compaction process is assumed to take about 2 min per meter for the different layers in the trench. The compactor power consumption rating was chosen based on a typical small hand-operated compactor used by contractors. Pipe placement on the site is a critical activity that is done through heavy machinery. A mobile crane was utilized to move the pipes from the lorry to the trench, and additionally during the disposal phase of waste pipes. For GRP pipes, a fusion butt welder was used for pipe assembling on-site, while a mechanical joint was used for HDPE pipes.
Table 2
| Phases | GRP pipes | HDPE pipes |
|---|---|---|
| Production phase | 4,300 kWh/km for 250 mm (Abudhabi Pipe Factory, 2022; Dubai Pipes Factory Company, 2025) 7326.5 kWh/km for 300 mm (Abudhabi Pipe Factory, 2022; Dubai Pipes Factory Company, 2025) |
14,620 kWh/km for 250 mm (HDPE Pipe and Fittings in UAE, 2025) 24,910 kWh/km for 315 mm (HDPE Pipe and Fittings in UAE, 2025) |
| Installation phase | Compactor: 6.2 kW (Dynamic Eq, 2024) Mobile Crane: 209 kW, 5 min per span (Liebherr, 2024) Fusion Butt Welder: 3.7 kWh, 15 min per span |
Compactor: 6.2 kW (Dynamic Eq, 2024) Mobile Crane: 209 kW, 5 min per span (Liebherr, 2024) Mechanical joint, no electricity required |
| Disposal phase | Mobile Crane: 209 kW, 5 min per span (Liebherr, 2024) | Mobile Crane: 209 kW, 5 min per span (Liebherr, 2024) |
Energy consumption for GRP and HDPE pipes.
In the transportation stage of both GRP and HDPE pipes, the lorry sizes were assumed based on the locations of different vendors within the UAE to carry greater than 32 tons. The average distance assumed for transporting both pipes to the site is 100 km. GRP raw materials, silica sand, and polyester resin are assumed to have an average transportation distance of 10 km, while glass fiber is assumed to be transported at an average distance of 150 km. HDPE raw material, polyethylene, has an average transported distance of 300 km according to Naffco (HDPE Pipe and Fittings in UAE, 2025). For sand and gravel transport, dump trucks are assumed to carry between 7.5 and 16 tons (Abudhabi Pipe Factory, 2022; Dubai Pipes Factory Company, 2025). The distance to the landfill is assumed to be 30 km.
For the trench, data was collected from Dubai Pipes Factory, Abu Dhabi Pipe Factory, and Naffco Flow Control Factory. The density of the gravel and sand was chosen to be 1,680 and 1,682 kg/m3, respectively. The bedding consists of gravel and should have a minimum thickness of 150 mm, as shown in Figure 3. The bedding acts as a foundation in the trench on which the pipe will be placed. As for the backfilling, the depth of the sand layer is 150 mm plus the pipe diameter. Hence, the compacted sand is utilized up to 450 mm from the bedding, as shown in the example trench illustration, where a 300 mm pipe was utilized. The sand is compacted in four layers. Above the compacted sand, the excavated soil will be placed for a thickness of 1,000 mm. As for the width of the trench, it was assumed to be 400 plus the pipe diameter. For a 300 mm pipe, the width of the trench is assumed to be 700 mm.
Figure 3
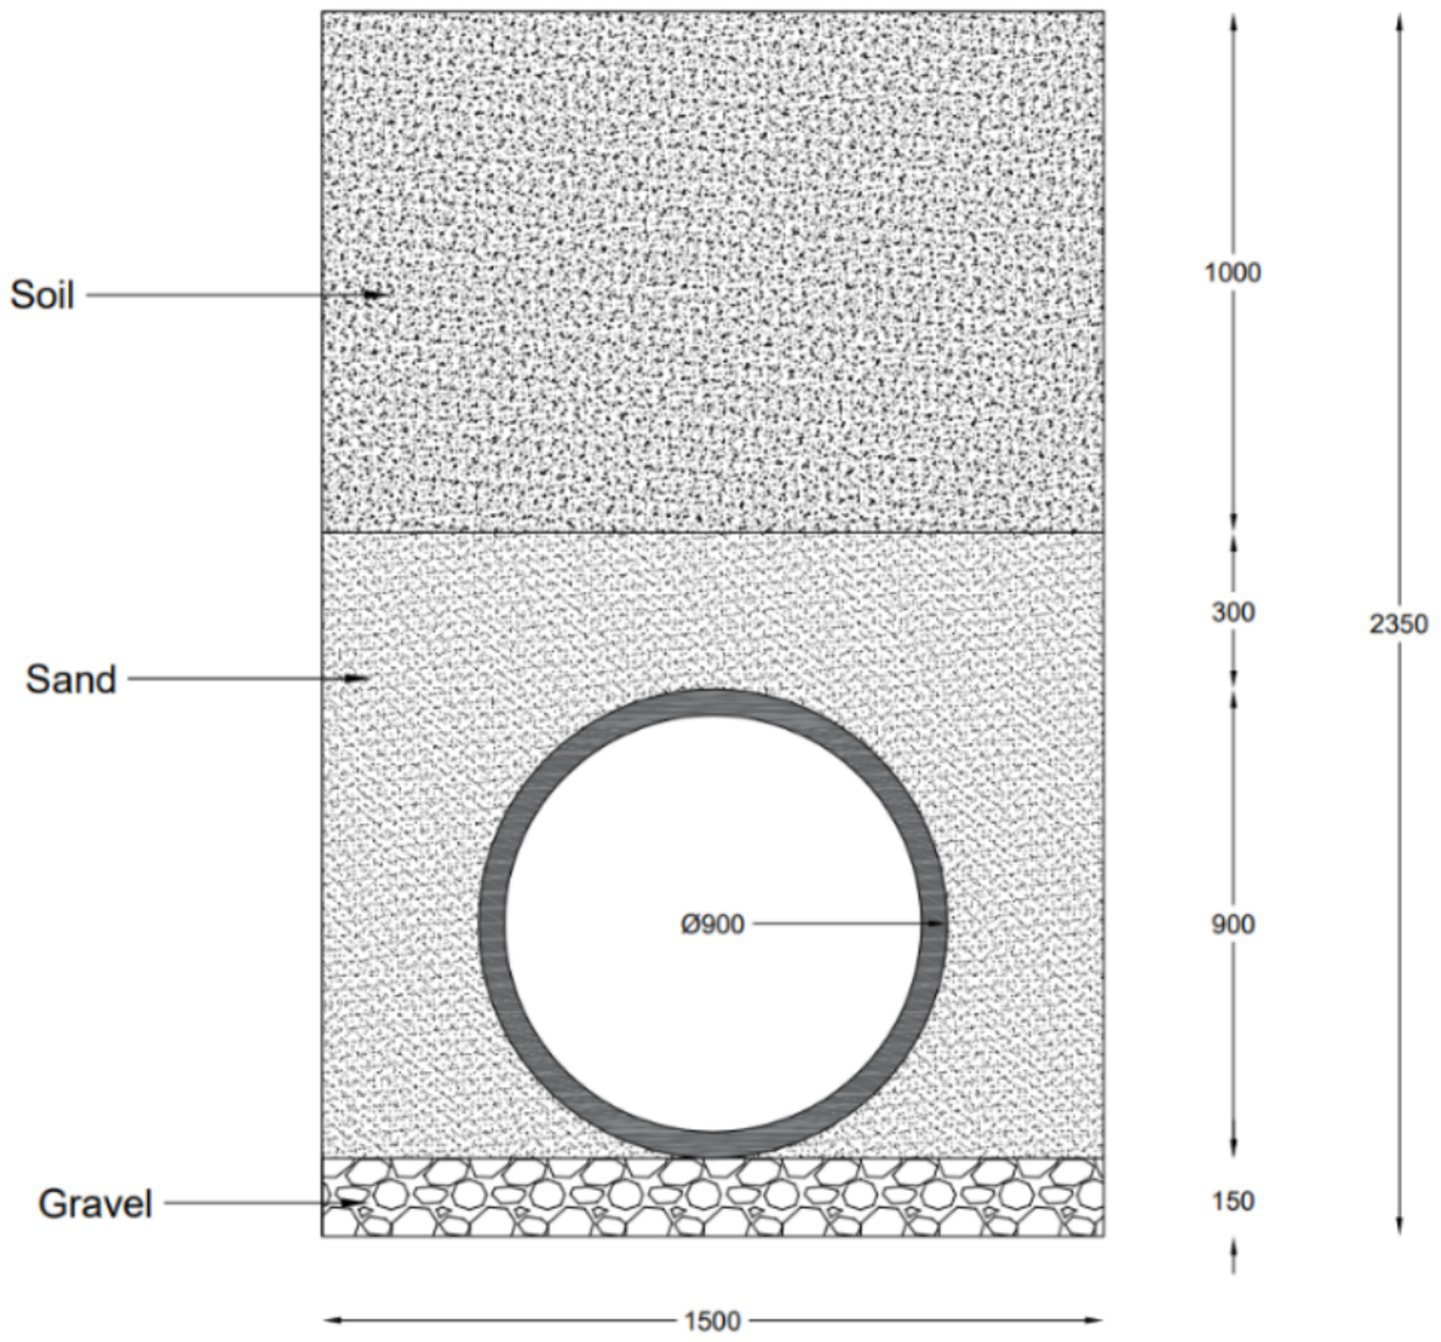
Trench illustration.
2.4 Life cycle impact assessment
LCIA evaluates the significance of environmental impact categories throughout their entire lifecycle by creating a link between a system and potential impacts (Curan, 2012). These impacts are quantified by multiplying the LCI results with the environmental impact factors (Curan, 2012; Ros et al., 2024). This phase is crucial as it helps to identify the most critical impacts and allows for the comparison of the two pipe materials, thus allowing for the results to be effectively communicated and leading to informed decision making. The LCIA steps that are mandatory include impact category selection, classification, and characterization, while optional elements are normalization, grouping, and weighing (Dong et al., 2021). For this research, both Midpoint and Endpoint models were used to calculate impacts to deduce the most appropriate conclusion for pipe selection. Midpoint modeling focuses on specific issues at a stage right before the final endpoint has been reached. Examples include climate change, acidification, eutrophication, human toxicity, and particulate matter formation (Wang et al., 2024). Endpoint modeling evaluates the final environmental impacts, thus the aggregate impact on human health, ecosystems, and resources (Wang et al., 2024). There are many assessment parameters to measure the impact of different life cycle processes on the environment using Midpoint modeling, with some significant parameters for this study discussed below.
Impact assessment parameters relevant to this research have been selected as they cover a broad range of significant environmental impacts that are directly relevant to the lifecycle of pipeline materials. These parameters that appear most frequently in pipe material publications provide a comprehensive assessment of the environmental and health impacts associated with the lifecycle of pipeline materials. They ensure that this LCA addresses key areas of concern for sustainability, public health, and environmental protection, making the study relevant and impactful. Among the impact categories, the vital ones for this research include ozone depletion, climate change, acidification, eutrophication, human toxicity, fossil fuels, marine and freshwater ecotoxicity, and photochemical oxidation.
2.5 Life cycle interpretation
The final stage of the LCA is the interpretation of the LCI and LCIA results. Sensitivity and uncertainty analysis are performed, leading to conclusions and recommendations being placed by the defined goal and scope (Wang et al., 2024). Results display which areas of the lifecycle contribute the greatest to its environmental impacts.
2.6 Limitations
The article contains certain limitations. The authors attempted to collect enough data for the two types of pipe materials from Sharjah Electricity and Water Authority. Unfortunately, they could not provide enough information to include the use phases. Both the pipe materials are new in application. For this reason, without enough date, this paper could not include them in the LCA.
The LCA was conducted on SimaPro eight. It was a relatively old version. The license did not include the feature of uncertainty analysis using Monte Carlo simulation. For this reason, they were excluded. Even though the effect of transportation distance was examined, for the two different plastic distribution pipe materials, recycling rates are not significant. For this reason, it has been avoided. The effect of the energy mix on the lifecycle impact is too broad for the scope of this paper. It was excluded as well.
The service lifetime of these pipe materials are reported in the manuscript. However, as both the pipe materials are new for water distribution system, the service life cannot be corroborated with enough real time use data.
3 Results and discussion
3.1 Comparative analysis of pipe sizes
Figure 4 compares the impact of the different pipes by plotting the impact of each pipe relative to the different impact categories. The pipe which has the highest impact in each category is represented as 100%, while the other pipes other given a relative percentage compared to that pipe. For instance, HDPE (315 mm) had the highest impact on climate change, hence it is represented as 100%. By analyzing Figure 4, it is evident that reducing the pipe diameter used can result in a significant reduction in the impact on the environment. Looking at the impact of HDPE pipes on climate change, Figure 4 illustrates that there is a reduction of around 35% in the climate change impact when reducing the pipe diameter from 315 to 250 mm. This also applies to other impact categories for both GRP and HDPE pipes. The reasons for such results may be due to the increase in raw material and energy required for production in larger diameters, in addition to the higher energy requirements for transportation and installation of larger and thus heavier diameter sizes that lead to greater greenhouse gas emissions. Therefore, to reduce the environmental impact, utilities should try to minimize the pipe diameters during the design process without compromising functionality.
Figure 4
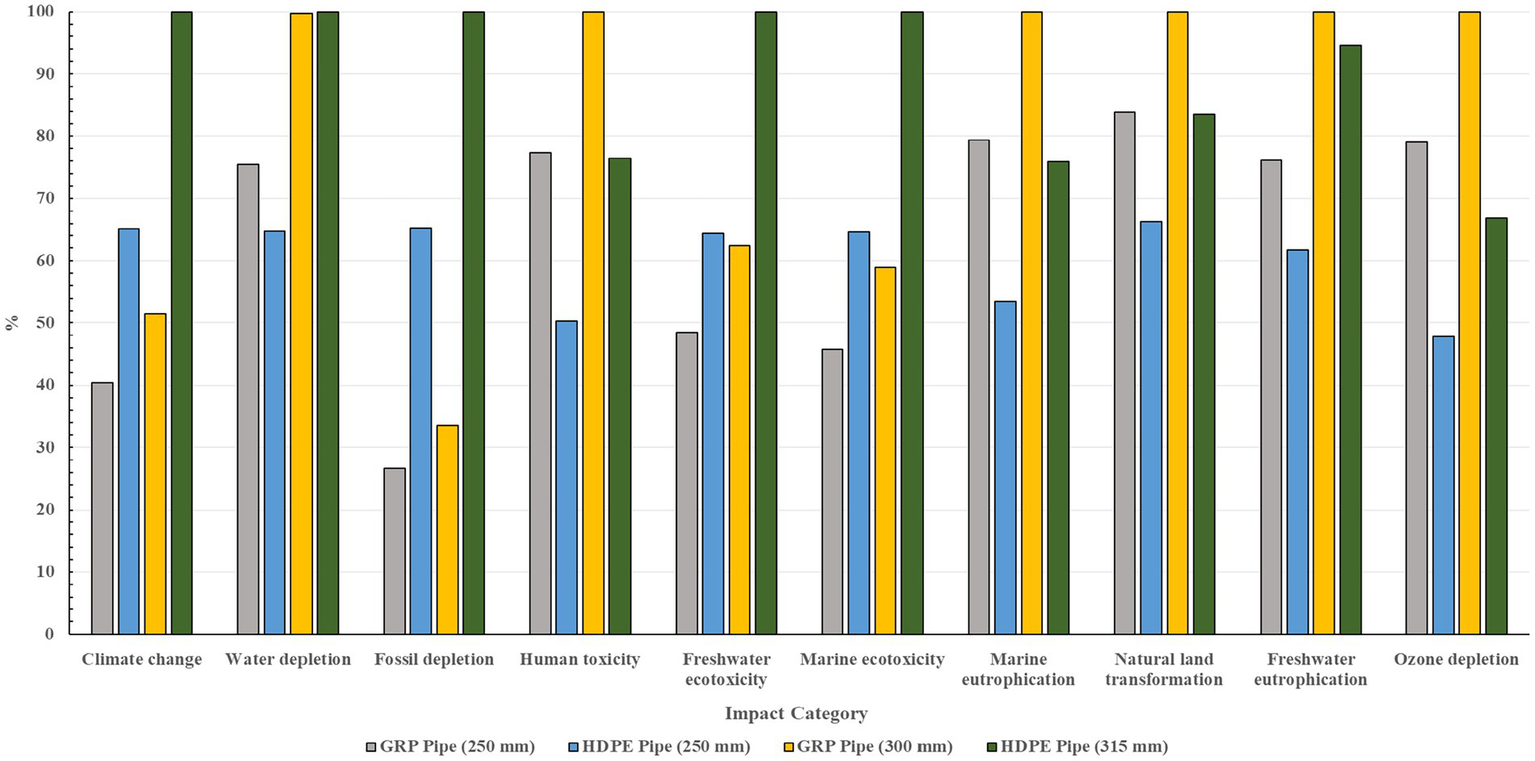
Water distribution pipes impact assessment %.
Figure 4 also demonstrates that both HDPE and GRP dominate certain impact categories. In the case of HDPE (315 mm), it dominates climate change, fossil depletion, freshwater ecotoxicity, and marine ecotoxicity. Climate change and fossil depletion can be attributed to HDPE’s petrochemical origin, which is achieved through fossil fuel extraction and processing, making them major contributors to greenhouse gas emissions and fossil resource depletion. Freshwater and marine ecotoxicity may be influenced by the additives and stabilizers used during the HDPE production phase, which may leach into the environment throughout the pipe’s lifecycle. The disposal phase additionally involves chemical treatment that may also contribute to ecotoxicity. As for GRP (300 mm), it dominates human toxicity, freshwater eutrophication, natural land transformation, and ozone depletion. However, they both dominate some common impact categories such as marine eutrophication and water depletion. GRP involves the use of resins and fiberglass, which include potentially hazardous chemicals. Such emissions during the production and curing processes may contribute to human toxicity and ozone depletion. Liquid and gaseous emissions through spills, leaks, or the disposal of excess chemicals may lead to runoff. Volatile organic compounds (VOCs) and other particulates may be released into the air during the production process and later deposit onto soils or water bodies. If chemical nutrients, primarily nitrogen or phosphorus, that are used to enhance certain GRP properties enter water bodies, they may result in eutrophication. Changes in land use associated with GRP material extraction may contribute to an impact on natural land transformation. By further analyzing Figure 4, the same conclusions can be drawn for the smaller pipe diameters. Table 3 demonstrates the deductions for the 300 and 315 mm sizes. Using this table, decision-makers can decide on which pipe type to choose by prioritizing the impact categories they believe are most detrimental for their case. For instance, if the priority is climate change, then GRP should be the type of pipe selected, as HDPE has high climate change levels.
Table 3
| GRP (300 mm diameter) | HDP (315 mm diameter) |
|---|---|
| Dominated impact category | |
| Human toxicity | Climate change |
| Freshwater eutrophication | Fossil depletion |
| Natural water transformation | Freshwater ecotoxicity |
| Ozone Depletion | Marine ecotoxicity |
| Common impact category | |
| Marine eutrophication | |
| Water depletion | |
Impact category domination.
3.2 Impact categories assessment
The environmental life cycle impacts of different sizes of GRP and HDPE pipes were analyzed across various impact categories as displayed in Table 4. The categories included climate change, fossil depletion, human toxicity, freshwater eutrophication, marine eutrophication, freshwater ecotoxicity, marine ecotoxicity, water depletion, ozone depletion, and natural land transformation. Additionally, HDPE pipes showed significant impacts in terms of fossil fuel depletion, largely due to their reliance on petroleum-based raw materials, which are energy-intensive to extract and process. In contrast, GRP pipes demonstrated higher impacts in human toxicity, as well as higher impacts on ozone depletion, which can lead to increased UV radiation entering the Earth’s atmosphere. High human toxicity levels mean that these pipes can directly or indirectly damage human health and lead to illnesses such as cancer and respiratory diseases. This is typically a result of high levels of arsenic, sodium dichromate, and hydrogen fluoride being released during the different life cycle stages of the pipes. Both GRP and HDPE pipes contributed significantly to marine eutrophication and water depletion. HDPE pipes dominated in the impact categories of climate change, fossil depletion, freshwater ecotoxicity, and marine ecotoxicity, largely because of the ecotoxic chemicals used during manufacturing and the energy-intensive production processes. GRP pipes showed higher impacts in human toxicity, freshwater eutrophication, natural land transformation, and ozone depletion. Both HDPE and GRP pipes had significant impacts on marine eutrophication and water depletion. When analyzing Table 4, it is important to note that some impact parameters, such as ozone depletion and freshwater eutrophication, may have small values; however, these small amounts can have drastic effects on the environment. For instance, the depletion of the ozone layer can lead to an increase in damaging UV light entering the Earth’s atmosphere, while freshwater eutrophication can damage the quality of water and reduce animal populations.
Table 4
| Impact category | Unit | GRP (250 mm) | HDPE (250 mm) | GRP (300 mm) | HDPE (315 mm) |
|---|---|---|---|---|---|
| Water depletion | m3 | 85643.175 | 73461.508 | 113280.510 | 113535.080 |
| Climate change | kg CO2 eq | 69490.224 | 111952.690 | 88568.777 | 171948.500 |
| Human toxicity | kg 1,4-DB eq | 18998.505 | 12350.380 | 24573.707 | 18780.214 |
| Fossil depletion | kg oil eq | 14589.433 | 35656.836 | 18320.861 | 54659.603 |
| Ionizing radiation | kBq U235 eq | 5168.639 | 4511.337 | 6727.351 | 6774.840 |
| Metal depletion | kg Fe eq | 2670.013 | 1579.750 | 3269.075 | 2025.754 |
| Agricultural land occupation | m2a | 2183.750 | 521.721 | 2813.621 | 739.832 |
| Urban land occupation | m2a | 1100.428 | 1120.218 | 1293.489 | 1441.439 |
| Freshwater ecotoxicity | kg 1,4-DB eq | 703.389 | 933.867 | 906.175 | 1450.570 |
| Marine ecotoxicity | kg 1,4-DB eq | 648.839 | 914.717 | 833.824 | 1416.914 |
| Photochemical oxidant formation | kg NMVOC | 316.238 | 336.834 | 390.913 | 483.050 |
| Terrestrial acidification | kg SO2 eq | 244.849 | 273.770 | 307.932 | 401.458 |
| Particulate matter formation | kg PM10 eq | 99.842 | 110.358 | 124.735 | 159.650 |
| Marine eutrophication | kg N eq | 15.737 | 10.610 | 19.838 | 15.056 |
| Natural land transformation | m2 | 14.358 | 11.338 | 17.116 | 14.303 |
| Terrestrial ecotoxicity | kg 1,4-DB eq | 10.389 | 2.559 | 13.325 | 3.538 |
| Freshwater eutrophication | Kg P eq | 10.059 | 8.154 | 13.220 | 12.513 |
| Ozone depletion | kg CFC-11 eq | 0.00321 | 0.00194 | 0.00406 | 0.00271 |
GRP and HDPE impact assessment results.
3.3 Life cycle stage analysis
The production phase was identified as the most significant contributor to environmental impacts for both GRP and HDPE pipes, followed by end of life, installation, and transportation, respectively. This phase involves the extraction and processing of raw materials, which are energy-intensive processes resulting in high emissions and resource consumption. The installation phase has the largest impact on natural land transformation, reflecting the physical changes and disturbances caused by installation activities such as installing the pipes, such as excavation and laying of pipes, which contribute to land use changes and habitat disruption. The in-use phase was not included in the LCA due to insufficient data on maintenance schedules and frequencies; however, it is acknowledged that this phase could impact the overall lifecycle, particularly in terms of leakages and maintenance activities. The end-of-life phase had a major impact on climate change due to the disposal processes and potential recycling of materials. Additionally, disposal activities contributed to ecotoxicity impacts in both freshwater and marine environments (Figures 5, 6).
Figure 5
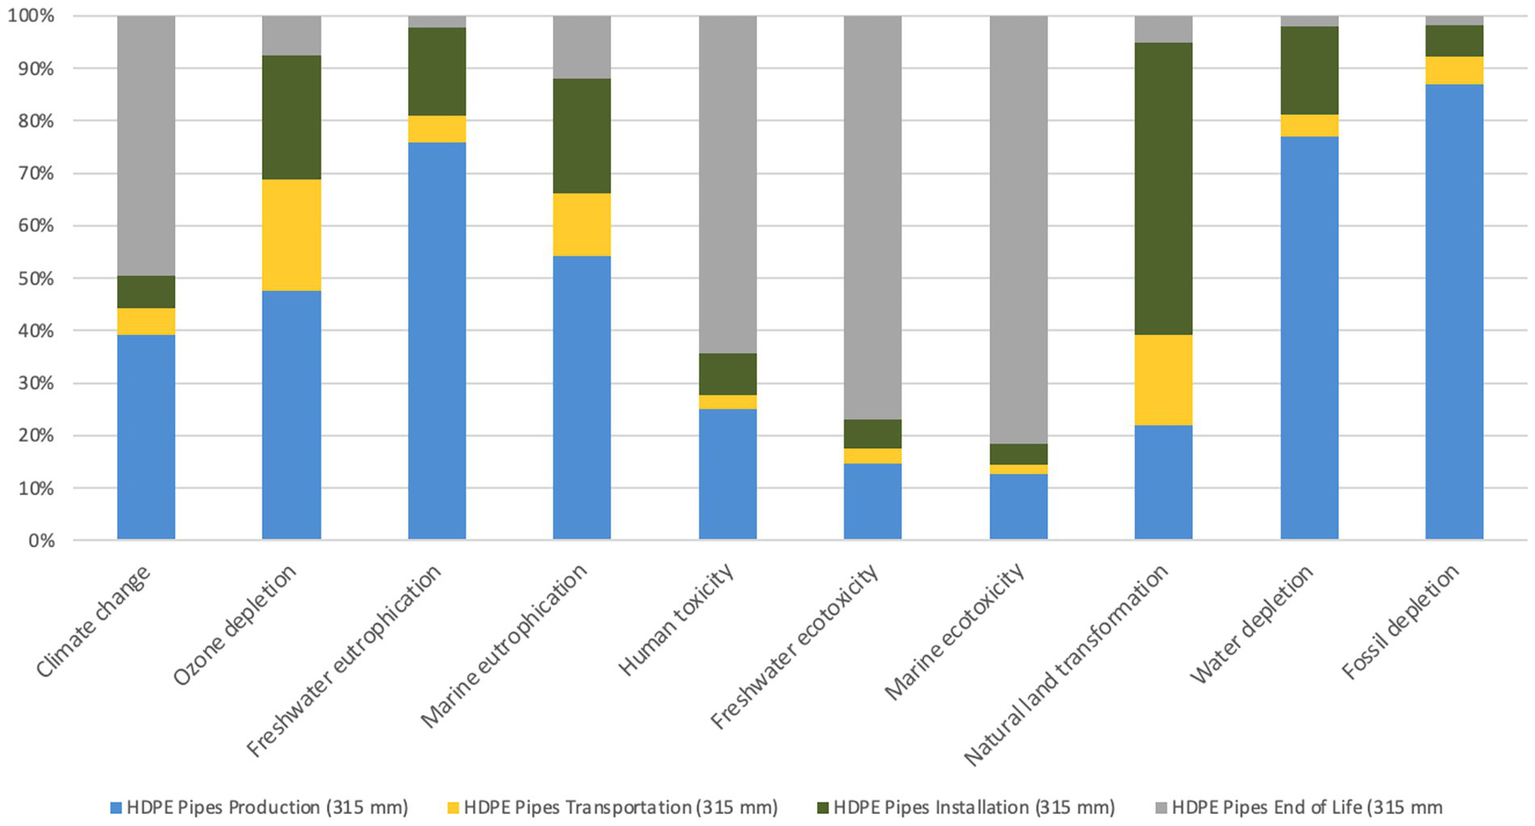
HDPE 315 mm LCA impact.
Figure 6
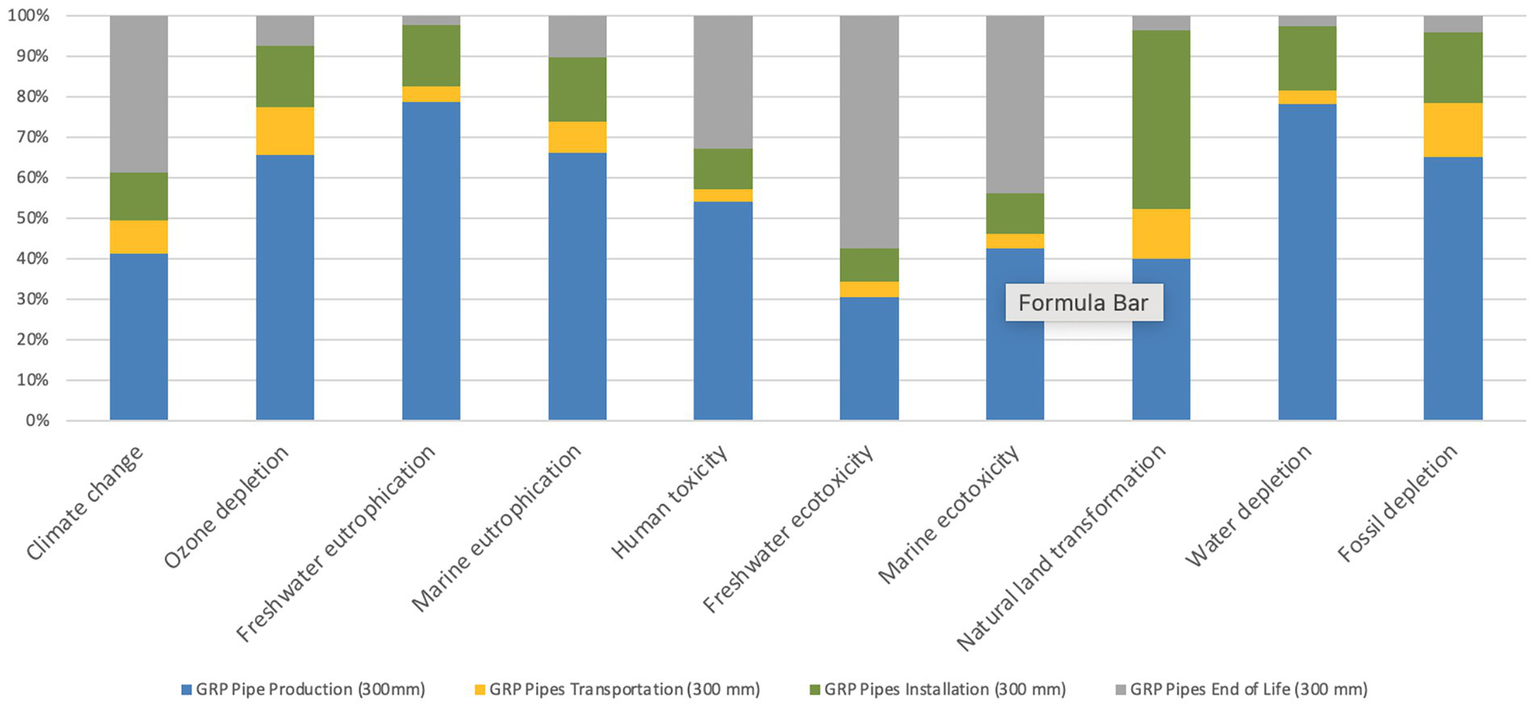
GRP 300 mm LCA impact.
3.4 Endpoint analysis
To make the ultimate decision of selecting the most environmentally friendly pipe, the endpoint analysis technique is utilized. This technique simply clusters all the impact parameters mentioned previously into three main categories: Human Health, Ecosystems, and Resources. The output of the endpoint analysis is demonstrated in Figure 7 above. Therefore, as demonstrated by Figure 7, it is evident that both sizes of GRP have less overall impact on human health, ecosystems, and resources. The endpoint analysis revealed that GRP pipes have a lower overall impact on human health compared to HDPE pipes. This includes reduced risks associated with human toxicity and related health issues such as respiratory diseases and cancer. GRP pipes were also found to have less detrimental effects on ecosystems, including lower impacts on biodiversity and habitat disruption. In terms of resource depletion, GRP pipes showed a lower impact, contributing to more sustainable resource use over their lifecycle.
Figure 7
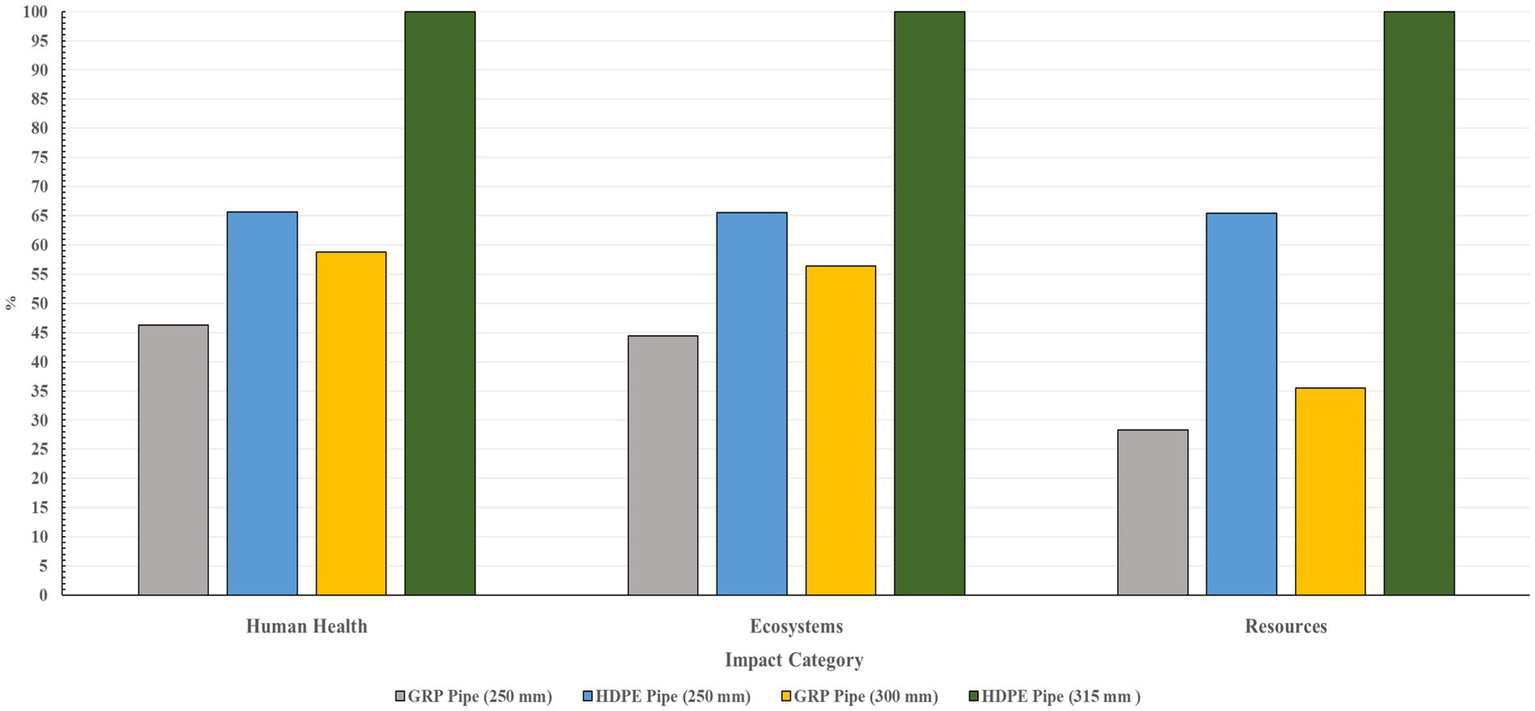
Water distribution pipes end of life impact assessment %.
3.5 Production vs. end of life impact analysis
Some major differentiations between GRP and HDPE pipe production and end-of-life phases are revealed in an analysis of some selected impact categories, namely climate change, human toxicity, freshwater eutrophication, fossil depletion, natural land transformation, water depletion, freshwater ecotoxicity, marine ecotoxicity, ozone depletion, and marine eutrophication (Table 5). The end-of-life phase significantly contributes to human toxicity, mainly in HDPE systems. To give an example, the disposal of the HDPE pipe of 315 mm diameter brings about the highest human toxicity level of 7.95 × 10⁵ kg 1,4-DB eq, much higher than the production value of 3.09 × 10⁵ kg 1,4-DB eq, supporting the notion of high emissions during disposal via either incineration or landfill degradation.
Table 5
| Impact category | Unit | GRP pipe (250 mm) production | GRP pipe (250 mm) -end life | GRP pipe (300 mm)-production | GRP pipe (300 mm)-end life | HDPE pipe (250 mm)-production | HDPE pipe (250 mm)-end life | HDPE pipe (315 mm)-production | HDPE pipe (315 mm)-end life |
|---|---|---|---|---|---|---|---|---|---|
| Climate change | kg CO2 eq | 2.54E4 | 2.5E4 | 3.43E4 | 3.23E4 | 3.98E4 | 5.15E4 | 6.45E4 | 8.12E4 |
| Ozone depletion | kg CFC-11 eq | 0.00199 | 0.00025 | 0.00266 | 0.00031 | 0.00077 | 0.00015 | 0.00129 | 0.00021 |
| Terrestrial acidification | kg SO2 eq | 154 | 20.4 | 208 | 24.2 | 182 | 21.7 | 296 | 29.3 |
| Freshwater eutrophication | kg P eq | 7.54 | 0.249 | 10.4 | 0.311 | 5.62 | 0.189 | 9.5 | 0.272 |
| Marine eutrophication | kg N eq | 9.89 | 1.66 | 13.1 | 2.05 | 4.98 | 1.28 | 8.16 | 1.78 |
| Human toxicity | kg 1,4-DB eq | 3.65E5 | 2.31E5 | 4.93E5 | 3E5 | 1.83E5 | 5.01E5 | 3.09E5 | 7.95E5 |
| Photochemical oxidant formation | kg NMVOC | 176 | 27.1 | 232 | 31.9 | 189 | 30.3 | 304 | 40.5 |
| Particulate matter formation | kg PM10 eq | 53.6 | 7.95 | 72.6 | 9.35 | 62.2 | 8.49 | 102 | 11.3 |
| Terrestrial ecotoxicity | kg 1,4-DB eq | 21.9 | 1.61 | 28.9 | 2.02 | 5.08 | 1.58 | 8.42 | 2.32 |
| Freshwater ecotoxicity | kg 1,4-DB eq | 205 | 404 | 277 | 524 | 127 | 705 | 212 | 1.12E3 |
| Marine ecotoxicity | kg 1,4-DB eq | 2.4E5 | 2.59E5 | 3.26E5 | 3.36E5 | 1.53E5 | 1.03E6 | 2.57E5 | 1.64E6 |
| Ionizing radiation | kBq U235 eq | 3.46E3 | 174 | 4.8E3 | 212 | 2.76E3 | 152 | 4.68E3 | 208 |
| Agricultural land occupation | m2a | 1.9E3 | 20.9 | 2.49E3 | 26.6 | 228 | 18.5 | 384 | 28.2 |
| Urban land occupation | m2a | 219 | 32.8 | 293 | 42.1 | 171 | 47.8 | 280 | 74.8 |
| Natural land transformation | m2 | 5.14 | 0.51 | 6.84 | 0.60 | 1.87 | 0.56 | 3.13 | 0.73 |
| Water depletion | m3 | 6.36E4 | 2.29E3 | 8.86E4 | 2.87E3 | 5.15E4 | 1.56E3 | 8.75E4 | 2.24E3 |
| Metal depletion | kg Fe eq | 1.4E3 | 143 | 1.87E3 | 171 | 282 | 160 | 465 | 219 |
| Fossil depletion | kg oil eq | 8.94E3 | 648 | 1.19E4 | 759 | 2.97E4 | 692 | 4.75E4 | 911 |
GRP and HDPE impact assessment results for production and end life.
Climate change impacts become significant at the end-of-life stage for HDPE pipes and are more-pronounced in that phase, along the lines of HDPE 315 mm pipes, which recorded 8.12 × 10⁴ kg CO₂ eq during end-of-life versus 6.45 × 10⁴ kg CO2 eq during production. GRP pipes, in contrast, show a more equal distribution of climate change impact between the two life-cycle stages. However, freshwater eutrophication is generally brought on by the production stage in all pipe types, probably because of nutrient emissions from the manufacture of resin and composites, particularly for GRP pipes.
The fossil fuels depletion is strongly weighted on production, mainly in the base of HDPE pipes, values going as high as 4.75 × 10⁴ kg oil equivalent for 315 mm diameter, explaining the fossil-based origin of polyethylene and the high energy consumption in processing. Another indication of such is natural land transformation and depletion of water, where the upstream production of HDPE and GRP pipes causes water consumption: more in the case of GRP (e.g., 8.86 × 10⁴ m3 for GRP 300 mm), which is pointing out that material extraction and manufacture are resource-intensive.
On the other hand, especially in HDPE pipes, freshwater and marine ecotoxicity are noticeably higher during the end-of-life phase. In contrast to 2.57 × 10⁵ kg at production, the HDPE 315 mm pipe registers a marine ecotoxicity impact of 1.64 × 10⁶ kg 1,4-DB eq at end-of-life, highlighting the release of persistent pollutants during disposal. Due to emissions from upstream chemical processes, ozone depletion is more strongly linked to the production stage across all pipes. Last but not least, production is primarily responsible for marine eutrophication, but end-of-life contributions—particularly in HDPE—are also significant and call for appropriate waste management to reduce nitrogen compound emissions.
3.6 Sensitivity analysis
The sensitivity analysis for pipe transportation assesses the overall environmental impact of different transport distances. To account for various delivery circumstances, the analysis takes into account a variety of transportation scenarios. These include 50 km for transportation within the city, 100 km for transportation to the far end of the city, 200 km for transportation to a nearby city, and 300 km for delivery to a distant city. As the study was conducted within the UAE, these selected transport distances—50, 100, 200, and 300 km—were identified as the most representative of typical logistics scenarios across the country (Tables 6–9). A more precise understanding of how transportation scale impacts environmental performance is made possible by the analysis’s isolation of the impact of transportation logistics on the product system while holding all other variables constant. This is achieved by looking at these four different distance ranges. The below tables are the impact assessment results from SimaPro.
Table 6
| Impact category | Unit | GRP pipe (250 mm) | HDPE pipe (250 mm) | GRP pipe (300 mm) | HDPE pipe (315 mm) |
|---|---|---|---|---|---|
| Climate change | kg CO2 eq | 0.003 | 0.001 | 0.004 | 0.002 |
| Ozone depletion | kg CFC-11 eq | 9.606 | 7.652 | 12.705 | 11.897 |
| Terrestrial acidification | kg SO2 eq | 14.423 | 9.159 | 18.343 | 13.294 |
| Freshwater eutrophication | kg P eq | 12.541 | 9.352 | 15.049 | 11.882 |
| Marine eutrophication | kg N eq | 30.844 | 14.061 | 39.033 | 19.432 |
| Human toxicity | kg 1,4-DB eq | 88.415 | 97.795 | 111.732 | 144.289 |
| Photochemical oxidant formation | kg NMVOC | 244.839 | 274.226 | 310.061 | 407.296 |
| Particulate matter formation | kg PM10 eq | 278.745 | 295.637 | 348.244 | 432.679 |
| Terrestrial ecotoxicity | kg 1,4-DB eq | 2086.866 | 413.332 | 2703.306 | 606.452 |
| Freshwater ecotoxicity | kg 1,4-DB eq | 744.249 | 715.047 | 887.605 | 939.646 |
| Marine ecotoxicity | kg 1,4-DB eq | 677.354 | 902.393 | 876.978 | 1412.048 |
| Ionizing radiation | kBq U235 eq | 2396.570 | 1272.182 | 2957.720 | 1646.670 |
| Agricultural land occupation | m2a | 4683.539 | 3976.922 | 6175.470 | 6121.332 |
| Urban land occupation | m2a | 12481.058 | 33353.159 | 15923.153 | 51851.764 |
| Natural land transformation | m2 | 82366.455 | 69815.263 | 109550.862 | 109058.412 |
| Water depletion | m3 | 59412.511 | 100387.375 | 76495.189 | 156170.200 |
| Metal depletion | kg Fe eq | 678894.718 | 768314.430 | 883772.991 | 1200180.511 |
| Fossil depletion | kg oil eq | 567575.422 | 1253354.455 | 738350.369 | 1973008.678 |
GRP and HDPE impact assessment results for 50 km transportation.
Table 7
| Impact category | Unit | RP pipe (250 mm) | HDPE pipe (250 mm) | GRP pipe (300 mm) | HDPE pipe (315 mm) |
|---|---|---|---|---|---|
| Climate change | kg CO2 eq | 59496.433 | 100526.441 | 76604.288 | 156391.015 |
| Ozone depletion | kg CFC-11 eq | 0.003 | 0.001 | 0.004 | 0.002 |
| Terrestrial acidification | kg SO2 eq | 245.151 | 274.743 | 310.467 | 408.116 |
| Freshwater eutrophication | kg P eq | 9.614 | 7.663 | 12.714 | 11.915 |
| Marine eutrophication | kg N eq | 14.437 | 9.182 | 18.361 | 13.330 |
| Human toxicity | kg 1,4-DB eq | 679283.523 | 768958.719 | 884278.438 | 1201203.535 |
| Photochemical oxidant formation | kg NMVOC | 279.153 | 296.314 | 348.775 | 433.755 |
| Particulate matter formation | kg PM10 eq | 88.548 | 98.017 | 111.906 | 144.641 |
| Terrestrial ecotoxicity | kg 1,4-DB eq | 30.945 | 14.228 | 39.164 | 19.697 |
| Freshwater ecotoxicity | kg 1,4-DB eq | 677.824 | 903.172 | 877.589 | 1413.286 |
| Marine ecotoxicity | kg 1,4-DB eq | 567943.153 | 1253963.822 | 738828.418 | 1973976.251 |
| Ionizing radiation | kBq U235 eq | 4690.727 | 3988.834 | 6184.814 | 6140.245 |
| Agricultural land occupation | m2a | 2088.275 | 415.665 | 2705.137 | 610.158 |
| Urban land occupation | m2a | 749.700 | 724.081 | 894.692 | 953.989 |
| Natural land transformation | m2 | 12.567 | 9.395 | 15.083 | 11.950 |
| Water depletion | m3 | 82416.029 | 69897.412 | 109615.308 | 109188.850 |
| Metal depletion | kg Fe eq | 2401.200 | 1279.854 | 2963.739 | 1658.852 |
| Fossil depletion | kg oil eq | 12511.366 | 33403.382 | 15962.553 | 51931.510 |
GRP and HDPE impact assessment results for 100 km transportation.
Table 8
| Impact category | Unit | GRP pipe (250 mm) | HDPE pipe (250 MM) | GRP pipe (300 MM) | HDPE pipe (315 mm) |
|---|---|---|---|---|---|
| Climate change | kg CO2 eq | 59664.276 | 100804.574 | 76822.484 | 156832.644 |
| Ozone depletion | kg CFC-11 eq | 0.003 | 0.002 | 0.004 | 0.002 |
| Terrestrial acidification | kg SO2 eq | 245.775 | 275.776 | 311.277 | 409.758 |
| Freshwater eutrophication | kg P eq | 9.628 | 7.687 | 12.733 | 11.953 |
| Marine eutrophication | kg N eq | 14.465 | 9.228 | 18.397 | 13.403 |
| Human toxicity | kg 1,4-DB eq | 680061.133 | 770247.297 | 885289.331 | 1203249.584 |
| Photochemical oxidant formation | kg NMVOC | 279.971 | 297.668 | 349.837 | 435.905 |
| Particulate matter formation | kg PM10 eq | 88.816 | 98.460 | 112.254 | 145.346 |
| Terrestrial ecotoxicity | kg 1,4-DB eq | 31.147 | 14.563 | 39.427 | 20.228 |
| Freshwater ecotoxicity | kg 1,4-DB eq | 678.764 | 904.731 | 878.812 | 1415.761 |
| Marine ecotoxicity | kg 1,4-DB eq | 568678.614 | 1255182.554 | 739784.518 | 1975911.396 |
| Ionizing radiation | kBq U235 eq | 4705.102 | 4012.656 | 6203.503 | 6178.071 |
| Agricultural land occupation | m2a | 2091.091 | 420.332 | 2708.799 | 617.568 |
| Urban land occupation | m2a | 760.603 | 742.147 | 908.865 | 982.676 |
| Natural land transformation | m2 | 12.619 | 9.482 | 15.151 | 12.088 |
| Water depletion | m3 | 82515.176 | 70061.709 | 109744.199 | 109449.727 |
| Metal depletion | kg Fe eq | 2410.459 | 1295.198 | 2975.776 | 1683.215 |
| Fossil depletion | kg oil eq | 12571.982 | 33503.828 | 16041.353 | 52091.002 |
GRP and HDPE impact assessment results for 200 km transportation.
Table 9
| Impact category | Unit | GRP pipe (250 mm) | HDPE pipe (250 mm) | GRP pipe (300 mm) | HDPE pipe (315 mm) |
|---|---|---|---|---|---|
| Climate change | kg CO2 eq | 59832.120 | 101082.707 | 77040.680 | 156832.644 |
| Ozone depletion | kg CFC-11 eq | 0.003 | 0.002 | 0.004 | 0.002 |
| Terrestrial acidification | kg SO2 eq | 246.398 | 276.810 | 312.088 | 409.758 |
| Freshwater eutrophication | kg P eq | 9.642 | 7.710 | 12.751 | 11.953 |
| Marine eutrophication | kg N eq | 14.492 | 9.273 | 18.433 | 13.403 |
| Human toxicity | kg 1,4-DB eq | 680838.744 | 771535.875 | 886300.225 | 1203249.584 |
| Photochemical oxidant formation | kg NMVOC | 280.787 | 299.022 | 350.900 | 435.905 |
| Particulate matter formation | kg PM10 eq | 89.084 | 98.904 | 112.602 | 145.346 |
| Terrestrial ecotoxicity | kg 1,4-DB eq | 31.349 | 14.897 | 39.689 | 20.228 |
| Freshwater ecotoxicity | kg 1,4-DB eq | 679.705 | 906.289 | 880.034 | 1415.760 |
| Marine ecotoxicity | kg 1,4-DB eq | 569414.075 | 1256401.287 | 740740.617 | 1975911.396 |
| Ionizing radiation | kBq U235 eq | 4719.478 | 4036.478 | 6222.192 | 6178.071 |
| Agricultural land occupation | m2a | 2093.908 | 425.000 | 2712.460 | 617.569 |
| Urban land occupation | m2a | 771.506 | 760.214 | 923.038 | 982.676 |
| Natural land transformation | m2 | 12.672 | 9.569 | 15.219 | 12.088 |
| Water depletion | m3 | 82614.324 | 70226.006 | 109873.091 | 109449.727 |
| Metal depletion | kg Fe eq | 2419.719 | 1310.542 | 2987.813 | 1683.215 |
| Fossil depletion | kg oil eq | 12632.598 | 33604.275 | 16120.154 | 52091.002 |
GRP and HDPE impact assessment results for 300 km transportation.
The transportation process contributes negligibly to the overall environmental impacts across all scenarios, according to a comparison of these results with the earlier analysis. Impact categories like climate change, fossil depletion, and particulate matter formation showed only slight changes as transport distances increased from 50 to 300 km. For example, the impact of climate change increased by less than 0.3% in the HDPE 315 mm pipe from 100 to 300 km. Other categories and pipe types show similar patterns, with values rising marginally with distance but staying low in comparison to the production and end-of-life stages’ dominant impacts. These findings demonstrate that, in the context of the United Arab Emirates, where transportation distances generally fall between 50 and 300 km, the impact of transportation on the overall environmental profile is minimal and has no discernible impact on the findings of the more comprehensive life cycle assessment.
4 Conclusion
GRP and HDPE pipes are being utilized on a large scale in the UAE, especially in Sharjah; however, little to no research exists on the environmental impact of these pipes. Therefore, the main objective of this study was to evaluate the environmental sustainability of both GRP and HDPE pipes in the context of the UAE using LCA. A standard framework was adopted in conducting the LCA. Data from local suppliers were used as much as possible in the methodology. SimaPro software was used in this study.
The results from the LCA analysis provide a comprehensive understanding of the environmental impacts associated with GRP and HDPE pipes. Key findings indicate that the production phase is the most significant contributor to environmental impacts for both pipe types. Reducing pipe diameters can significantly mitigate environmental impacts. HDPE pipes have higher impacts on climate change and fossil depletion, while GRP pipes have higher impacts on human toxicity and ozone depletion. Overall, GRP pipes are generally more sustainable, with lower impacts on human health, ecosystems, and resources; however, future research must be conducted to further assess the impact of GRP on human health. The study provides valuable insights into the environmental impacts of the pipes across their entire lifecycle. By highlighting the significant contributors to these impacts and identifying strategies for mitigation, such as reducing pipe diameters and focusing on sustainable production practices, the results of this research aid decision-makers in selecting the most environmentally friendly pipe materials. As other emirates are similar to Sharjah, the findings can also be useful for Dubai, AbuDhabi and other emirates.
Moving forward, several actionable recommendations can be drawn from this study to bolster the sustainability of pipe materials in water distribution systems. Due to their lower overall impact on human health, ecosystems, and resources, GRP pipes should be promoted for use in water distribution systems, especially in regions with similar environmental conditions to the UAE. To minimize environmental impacts, utilities should consider reducing pipe diameters during the design process without compromising functionality. Small pipe diameters have been shown to significantly reduce impact categories such as climate change. Efforts should be placed to improve the production phase of pipe materials, as it is the largest contributor to environmental impacts. Developing efficient recycling and disposal methods for pipe materials can mitigate the environmental impacts of pipes; thus, policies to support recycling should be addressed. Given the research gap in the field of LCA for GRP pipes, further studies should be conducted to develop best practices for their use and management. By adopting these recommendations, there is potential to significantly advance the sustainability of water distribution systems, aligning with broader environmental goals.
Statements
Data availability statement
The original contributions presented in the study are included in the article/supplementary material, further inquiries can be directed to the corresponding author.
Author contributions
IA: Methodology, Writing – original draft, Investigation, Visualization, Formal analysis, Data curation. AS: Writing – original draft, Formal analysis, Investigation. MS: Writing – original draft, Investigation, Formal analysis, Methodology, Data curation. AM: Visualization, Formal analysis, Methodology, Data curation, Writing – original draft. MM: Funding acquisition, Project administration, Conceptualization, Supervision, Methodology, Writing – review & editing. SA: Funding acquisition, Supervision, Writing – review & editing. LD: Data curation, Formal analysis, Visualization, Writing – review & editing.
Funding
The author(s) declare that financial support was received for the research and/or publication of this article. This project was funded by the American University of Sharjah (FRG24-C-E59). The authors also received a sustainability award from EPAA (including a cash prize).
Acknowledgments
The authors would like to express their gratitude to the EPAA organizers of the SEWA Sustainability Awards for their invaluable support and recognition of this research. Special thanks to the entire SEWA team for providing a platform to showcase these findings and for their continuous efforts in fostering a sustainable future.
Conflict of interest
The authors declare that the research was conducted in the absence of any commercial or financial relationships that could be construed as a potential conflict of interest.
The author(s) declared that they were an editorial board member of Frontiers, at the time of submission. This had no impact on the peer review process and the final decision.
Generative AI statement
The authors declare that no Gen AI was used in the creation of this manuscript.
Any alternative text (alt text) provided alongside figures in this article has been generated by Frontiers with the support of artificial intelligence and reasonable efforts have been made to ensure accuracy, including review by the authors wherever possible. If you identify any issues, please contact us.
Publisher’s note
All claims expressed in this article are solely those of the authors and do not necessarily represent those of their affiliated organizations, or those of the publisher, the editors and the reviewers. Any product that may be evaluated in this article, or claim that may be made by its manufacturer, is not guaranteed or endorsed by the publisher.
References
1
Abudhabi Pipe Factory Abudhabi pipe factory (2022). Available online at: http://www.adpf.ae/
2
Ancaș A. Munteanu C. Istrate B. Profire M. Turcanu F. (2021). The influence of the environment for glass-reinforced plastic composite material used for ground water transport pipes. Materials14. doi: 10.3390/ma14123160
3
Asadollahfardi G. Panahandeh A. Moghadam E. I. Masoumi S. Tayebi Jebeli M. (2022). Environmental life cycle assessment of different types of municipal wastewater pipeline networks. Environ. Qual. Manag. doi: 10.1002/tqem.21864
4
Baumann H. Tillman A.-M. (2004). The hitch hiker's guide to LCA: an orientation in life cycle assessment methodology and applications. Int. J. Life Cycle Assess.9, 319–326. doi: 10.1007/BF02978500
5
Bolivar A. J. R. . (2017). Life cycle sustainability analysis (LCA) of polymer-based piping for plumbing applications. JMU scholarly commons. Available online at: https://commons.lib.jmu.edu/honors201019/260/
6
Chohan I. M. Ahmad A. Sallih N. Bheel N. Ali M. Deifalla A. F. (2023). A review on life cycle assessment of different pipeline materials. Results Eng.19:101325. doi: 10.1016/j.rineng.2023.101325
7
Curan M. A. (2012). Life cycle assessment handbook: a guide for environmentally sustainable products. New Jersey: John Wiley & Sons.
8
Dodman D. Hayward B. Pelling M. (Eds.). (2019). Chapter 6: cities, settlements, and key infrastructure. In IPCC WGII sixth assessment report: first order draft. Intergovernmental panel on climate change. Available online at: https://www.ipcc.ch/report/ar6/wg2/downloads/report/IPCC_AR6_WGII_FOD_Chapter06.pdf
9
Dong Y. Hossain M. U. Li H. Liu P. (2021). Developing conversion factors of LCIA methods for comparison of LCA results in the construction sector. Sustainability13:9016. doi: 10.3390/su13169016
10
Du F. Woods G. J. Kang D. Lansey K. Arnold R. (2013). Life cycle analysis for water and wastewater pipe materials. J. Environ. Eng.139, 703–711. doi: 10.1061/(ASCE)EE.1943-7870.0000638
11
Dubai Electricity and Water Authority . Providing reliable and sustainable water supplies. (2020). Available online at: www.dewa.gov.ae; https://www.dewa.gov.ae/en/about-us/media-publications/latest-news/2020/03/providing-reliable-and-sustainable-water-supplies
12
Dubai Pipes Factory Company . (2025). Available online at: http://www.dubaipipes.com/general.html
13
Dynamic Eq (2024) Dynamic DUR-500 Electric Start-up Handle Hydraulic System Reversible Plate Compactor, China Dynamic DUR-500 Electric Start-up Handle Hydraulic System Reversible Plate Compactor Manufacturers, Suppliers, Factory-Shanghai Dynamic Construction Machinery Co., Ltd. Available online at: https://www.dynamic-eq.com/dur-600-product/
14
García-Sánchez M. Güereca L. P. (2019). Environmental and social life cycle assessment of urban water systems: the case of Mexico City. Sci. Total Environ.693:133464. doi: 10.1016/j.scitotenv.2019.07.270
15
Haidery J. A. Baş B. (2020). Life cycle assessment of construction of water supply pipelines: a case study from Van, Turkey. Int. J. Environ. Geoinformatics.7, 23–32. doi: 10.30897/ijegeo.687547
16
Hajibabaei M. Nazif S. Tavanaei Sereshgi F. (2018). Life cycle assessment of pipes and piping process in drinking water distribution networks to reduce environmental impact. Sustain. Cities Soc.43, 538–549. doi: 10.1016/j.scs.2018.09.014
17
HDPE Pipe and Fittings in UAE . (2025) Available online at: https://www.plasticpipe.org/BuildingConstruction/BuildingConstruction/HDPE.aspx
18
ISO 14040:2006 . (2006). Environmental management—life cycle assessment—principles and framework. 2006 International Organization for Standardization. Available online at: https://www.iso.org/obp/ui#iso:std:iso:14040:ed-2:v1:en
19
Kingdom B. Liemberger R. Marin P. (2006). The challenge of reducing non-revenue water (NRW) in developing countries: how the private sector can help: a look at performance-based service contracting. Available online at: https://documents1.worldbank.org/curated/en/385761468330326484/pdf/394050Reducing1e0water0WSS81PUBLIC1.pdf
20
Lalawmpuii Kumar P. (2023). Role of water-energy-food nexus in environmental management and climate action. Energy Nexus11:100230. doi: 10.1016/j.nexus.2023.100230
21
Lee S. Kim J. H. (2020). Quantitative measure of sustainability for water distribution systems: a comprehensive review. Sustainability12:10093. doi: 10.3390/su122310093
22
Li H. Wang H. Yang Y. Zhao R. (2021). Regional coordination and security of water–energy–food symbiosis in northeastern China. Sustainability13:1326. doi: 10.3390/su13031326
23
Liebherr . (2024). “Mobile crane LTM 1030–2.1.”. Available online at: https://www.liebherr.com/en/are/products/mobile-and-crawler-cranes/mobile-cranes/liebherr-mobile-cranes/ltm-1030-2.1.html
24
Omar O. A. S. (2023). Evaluation of pipe materials in water system networks using the theory of advanced multi-criteria analysis. Sustainability15:4491. doi: 10.3390/su15054491
25
Ramakrishna S. Ramasubramanian B. (2024). “Life cycle assessment and tools” in Handbook of materials circular economy (Singapore: Springer).
26
Rebitzer G. Ekvall T. Frischknecht R. Hunkeler D. Norris G. Rydberg T. et al . (2004). Life cycle assessment. Environ. Int.30, 701–720. doi: 10.1016/j.envint.2003.11.005
27
Ros B. Selech J. Kasprzak J. (2024). An environmental life cycle assessment of electric race car: a case study of eVarta. Clean Techn. Environ. Policy27, 117–139. doi: 10.1007/s10098-024-02836-9
28
Safewater . (2017). Asbestos in Water and Asbestos Cement Water Pipes. Available online at: https://www.safewater.org/fact-sheets-1/2017/1/18/asbestos-in-water-and-asbestos-cement-water-pipes
29
Sander-Titgemeyer A. Risse M. Weber-Blaschke G. (2023). Applying an iterative prospective LCA approach to emerging wood-based technologies: three German case studies. Int. J. Life Cycle Assess.28, 495–515. doi: 10.1007/s11367-023-02139-z
30
Sangani S. Popat M. (2019). Review paper on process parameters for extrusion machine during expanded polystyrene foam manufacturing. JETIR6, 965–970.
31
Sanjuan-Delmás D. Petit-Boix A. Gasol C. M. Rieradevall J. (2014). LCA of PVC and HDPE pipes for drinking water distribution networks in cities. ResearchGate. Available online at: https://www.researchgate.net/publication/267094653_LCA_of_PVC_and_HDPE_pipes_for_drinking_water_distribution_networks_in_cities
32
SimaPro Manual . (2025). Introduction to LCA. SimaPro help Center. Available online at: https://support.simapro.com/articles/Manual/Introduction-to-LCA
33
Simion I. M. Pennellini S. Awere E. Rosatti A. Bonoli A. (2024). Enhancing sustainability in Italian water supply pipes through life cycle analysis. Sustainability16:2685. doi: 10.3390/su16072685
34
Stokes C. S. Simpson A. R. Maier H. R. (2014). The cost–greenhouse gas emission nexus for water distribution systems, including the consideration of energy generating infrastructure: an integrated conceptual optimization framework and review of literature. Earth Perspect.1:9. doi: 10.1186/2194-6434-1-9
35
The Global Goals . (2022). Goal 6: clean water and sanitation. The Global Goals. Available online at: https://www.globalgoals.org/goals/6-clean-water-and-sanitation/
36
The World Bank . (2019). Overview. World Bank. Available online at: https://www.worldbank.org/en/topic/water/overview
37
The World Bank . (2022). Water resources management. World Bank. Available online at: https://www.worldbank.org/en/topic/waterresourcesmanagement
38
United Nations (2018) 68% of the world population projected to live in urban areas by 2050, says un United Nations department of economic and social affairs; United Nations. Available online at: https://www.un.org/development/desa/en/news/population/2018-revision-of-world-urbanization-prospects.html
39
United Nations . (2022). Sustainable cities and human settlements|department of economic and social affairs. Available online at: Sdgs.un.org. https://sdgs.un.org/topics/sustainable-cities-and-human-settlements
40
Waldner S. (2023). GRP pipes are designed for generations. Amiblu. Available online at: https://www.amiblu.com/grp-pipes-designed-for-generations/
41
Wang Y. Ni T. He B. Xu J. (2024). Life cycle environmental impact assessment of a natural gas distributed energy system. Sci. Rep.14:3292. doi: 10.1038/s41598-024-53495-1
42
Zhao J.-g. Wang Z.-h. Pei Y.-x. Wei S.-p. (2005). Material balance for slurry HDPE production process. J. Beijing Univ. Chem. Technol.32, 20–22.
43
Zubail A. Traidia A. Masulli M. Vatopoulos K. Villette T. Taie I. (2021). Carbon and energy footprint of nonmetallic composite pipes in onshore oil and gas flowlines. J. Clean. Prod.305:127150. doi: 10.1016/j.jclepro.2021.127150
Summary
Keywords
water distribution system, life cycle assessment, sustainability, pipeline, high-density polyethylene, glass reinforced epoxy
Citation
Abu Laila I, Seddiq A, Shaban M, Masri A, Mortula MM, Atabay S and Dhin L (2025) Comparative life cycle assessment of high-density polyethylene and glass reinforced epoxy pipes in Sharjah, United Arab Emirates. Front. Sustain. Cities 7:1648885. doi: 10.3389/frsc.2025.1648885
Received
17 June 2025
Accepted
25 August 2025
Published
10 September 2025
Volume
7 - 2025
Edited by
Roberto Alonso González-Lezcano, CEU San Pablo University, Spain
Reviewed by
Sameh Al-Shihabi, University of Sharjah, United Arab Emirates
Sofia Melero-Tur, CEU San Pablo University, Spain
Updates
Copyright
© 2025 Abu Laila, Seddiq, Shaban, Masri, Mortula, Atabay and Dhin.
This is an open-access article distributed under the terms of the Creative Commons Attribution License (CC BY). The use, distribution or reproduction in other forums is permitted, provided the original author(s) and the copyright owner(s) are credited and that the original publication in this journal is cited, in accordance with accepted academic practice. No use, distribution or reproduction is permitted which does not comply with these terms.
*Correspondence: Md. Maruf Mortula, mmortula@aus.edu
Disclaimer
All claims expressed in this article are solely those of the authors and do not necessarily represent those of their affiliated organizations, or those of the publisher, the editors and the reviewers. Any product that may be evaluated in this article or claim that may be made by its manufacturer is not guaranteed or endorsed by the publisher.