Abstract
To support the goals of low-carbon and sustainable development, new energy vehicles (NEVs) are being increasingly adopted. However, the frequency of traffic accidents involving NEVs also shows a rising trend. To address this challenge, this paper proposes an accident risk prediction method for new energy vehicles based on dynamic-static feature fusion. First, direct and indirect data strongly related to accident risk are extracted from the full-year accident data of a province in 2021, including environmental factors (weather and road type), dynamic operating data (speed), vehicle alarm status, and historical accident characteristics. Then, to quantify and capture the potential risk characteristics of the vehicle, LSTM layers are used to construct dynamic and static feature vectors representing vehicle accident risk. Moreover, the accident risk probability is calculated based on fully connected layers and the sigmoid activation function. Finally, the proposed accident risk prediction model is tested and validated with real accident data. The results show that the model achieves a prediction accuracy of 85% for new energy vehicle accidents, which is a 24% improvement over traditional models based on weather and road types. The model can timely warn drivers before accidents occur, helping them take necessary safety measures to reduce accident probability.
1 Introduction
As a central force in the low-carbon transition of the transportation sector, New Energy Vehicles (NEVs) significantly reduce dependence on fossil fuels and greenhouse gas emissions by optimizing energy structures and minimizing lifecycle carbon footprints. NEVs have thus become a key component in building sustainable transportation systems globally. According to statistics from the Traffic Management Bureau of the Ministry of Public Security, the number of newly registered NEVs has surged from 1.2 million in 2019 to 7.43 million in 2023, reflecting a rapid-growth trend (Ministry of Public Security, 2024). However, frequent safety incidents during the large-scale deployment of NEVs, such as battery thermal runaway and fire caused by collisions, not only pose serious threats to public safety but may also undermine their environmental benefits in several ways (Zhao et al., 2025). On one hand, accidents can lead to vehicle damage, battery pollution, and secondary environmental risks, directly reducing carbon reduction gains. On the other hand, the resulting traffic congestion, emergency resource usage, and decline in public trust may indirectly hinder NEV market adoption and infrastructure development, limiting the overall progress toward a sustainable road transport system. In response, researchers have carried out extensive studies and proposed various solutions to reduce both the frequency and severity of accidents. Among these efforts, accident risk prediction models have attracted considerable attention due to their potential to provide early warnings and significantly decrease the likelihood of traffic incidents.
Traffic accident risk prediction models seek to prevent accidents by gaining a deep understanding of the factors that contribute to their occurrence and by predicting the corresponding risk levels. These models typically rely on techniques such as data-driven analysis (Lin et al., 2015; Aung et al., 2018; Ardakani et al., 2023), machine learning (Zhao et al., 2019; Brühwiler et al., 2022; Li and Yu, 2025; Li and Chen, 2025; Zhang et al., 2022; Ghasedi et al., 2021; Berhanu et al., 2023; Santos et al., 2021; Prajapati et al., 2023; Ahmed et al., 2023), and neural networks (Lin et al., 2021; Shaik et al., 2021; Najafi Moghaddam Gilani et al., 2021; Yu et al., 2021; Chakraborty et al., 2019; Ghosh and Karmakar, 2025; Kaffash Charandabi et al., 2022; Wang et al., 2021), and deep learning (Ren et al., 2018; Basso et al., 2021; Sun et al., 2024) to capture complex patterns in traffic data and assess the likelihood of accidents under various conditions. Lin et al. (2015) proposed a novel variable selection method based on the Frequent Pattern Tree algorithm, which was integrated with the k-nearest neighbors' model and Bayesian network to enable real-time traffic accident risk prediction. Aung et al. (2018) introduced an accident prediction algorithm tailored for urban environments. By incorporating variables such as vehicle speed, weather conditions, and driver fatigue, the model employed a Hidden Markov Model (HMM) to establish correlations between observed data and potential accident risks. Park and Hong (2022) proposed a deep learning-based accident risk prediction model that integrates both static and dynamic road features, to accurately assess the risk of accident occurrence under varying road and environmental conditions. Zhao et al. (2022) presented an accident risk prediction approach that combines deep convolutional neural networks (CNN) with a random forest classifier. The CNN was used to extract key features from the data, while the random forest comprising multiple decision trees was used to output the associated risk of a traffic accident.
Considering accident-related factors is crucial for improving the accuracy of traffic accident risk prediction. However, the causes of traffic accidents are complex and diverse, increasing the difficulty of accident risk prediction. Existing research has extensively explored the impact of vehicle factors and external environmental factors on traffic risks (Yannis et al., 2017; Roland et al., 2021; Ghasedi et al., 2021). Vehicle factors primarily refer to the operating state of the vehicle during driver operation, including vehicle spacing, steering angle changes, lateral acceleration, and yaw rate (Enache et al., 2009; Ning et al., 2009). Studies have shown that the vehicle's operating state can indirectly reflect the driver's condition after excluding driver skill differences. Based on this fundamental characteristic, some researchers have analyzed driving behavior or driving risks using vehicle operation state data (Mantouka et al., 2019). For example, Wang et al. (2011) considered the factors, such as speed and acceleration, to establish a risk assessment model. Mandal et al. (2016) used time-series measurements of driving behavior and a particle swarm-optimized artificial neural network algorithm to classify driver states and assess driving risk. Research shows that the external environment, including weather and road conditions, significantly affects driving safety (Feng et al., 2010; Hassan and Abdel-Aty, 2011; Xiao et al., 2000; Koramati et al., 2022; Hao et al., 2015; Xu X. L., 2013; Casner et al., 2016). For example, Xu C. C. (2013) established an accident risk model for adverse weather using real-time data and logistic regression models, finding that the impact of rain on risk is greater than that of fog. Chen et al. (2009) quantitatively analyzed the impact of road type, specifications, alignment, sight distance, and pavement condition on accident rates based on Bayesian theory. The study found that under the same traffic flow, the accident rate decreases with the improvement of road specifications.
The studies mentioned above mainly analyze the independent impact of individual factors on traffic accidents, such as driving conditions, vehicle speed, acceleration, and external environmental factors like adverse weather and road conditions on driving safety. However, they seldom consider the dynamic association between vehicle factors and external environmental factors, as well as the coupling effects between different factors on traffic risk. Therefore, how to effectively integrate vehicle factors and external environmental factors to achieve multi-source data fusion and accurately predict risks is a significant challenge in the field of traffic safety.
To address the above problems, this paper proposes an accident risk prediction model for new energy vehicles based on dynamic-static feature fusion. Key feature parameters strongly correlated with accident risk are extracted by analyzing the impact of accident risk factors on the risk of NEV accidents. Based on this, the LSTM algorithm is employed to establish a mapping relationship from dynamic-static feature parameters to NEV accident risk, enabling accurate prediction of NEV accidents. The main innovations are as follows:
-
(1) Relying on vehicle status data and external environmental data from national regulatory platforms, a novel accident risk prediction model is proposed based on the dynamic-static feature fusion, accurately predicting the occurrence of accidents.
-
(2) A mapping is established between dynamic-static feature parameters and NEV accident risk based on the LSTM algorithm. This approach accurately captures dynamic and static risk patterns in time-series data, offers new insights into risk assessment for driving safety, and provides reliable data support for accident prevention.
2 Introduction to accident risk factors
The selection of key influencing factors for new energy vehicle accidents is fundamental to establishing an accurate accident risk prediction model. To improve the prediction accuracy of the accident risk model, this paper extracts direct and indirect information data related to NEV accidents from a full year of accident records in a specific province in 2021. The direct information data includes the time, location, involved vehicles, and causes of the accidents. The indirect information data primarily includes road features and weather conditions.
2.1 Weather conditions
Weather conditions play a critical role in driving safety. Adverse weather such as rain or snow can lead to slippery road surfaces, increasing braking distances and significantly elevating the likelihood of traffic accidents. Moreover, under low-visibility conditions such as fog or haze, the limited visual perception of the drivers further amplifies the risk of collisions. Although the overall accident rate under clear weather is relatively low, the probability of severe accidents tends to be higher due to higher driving speeds. Therefore taking weather conditions as an input variable in predictive models can help identify risks induced by environmental factors.
To achieve accurate prediction of accident severity, the weather conditions are cate-gorized into 19 distinct types, as shown in Table 1. However, considering that some weather types occur infrequently and to simplify the modeling process, these categories were consolidated into five broader groups: sunny, overcast, snowy, rainy, and foggy.
Table 1
| Index | Weather type | Index | Weather type | Index | Weather type |
|---|---|---|---|---|---|
| 1 | Sunny | 8 | Light snow | 15 | Blizzard |
| 2 | Overcast | 9 | Moderate snow | 16 | Sandstorm |
| 3 | Cloudy | 10 | Heavy snow | 17 | Torrential rain |
| 4 | Sleet | 11 | Fog | 18 | Haze |
| 5 | Light rain | 12 | Heavy rain | 19 | Dust |
| 6 | Moderate rain | 13 | Thunderstorm | ||
| 7 | Showers | 14 | Snow showers |
Weather conditions.
As shown in Figure 1, the majority of traffic accidents occur under sunny weather conditions, accounting for 85.53% of the total. This is followed by overcast (8.31%) and rainy (4.85%) conditions. Snowy weather accounts for the smallest proportion, with only 0.6% of total accidents. The high number of accidents under sunny weather conditions is primarily attributed to their high frequency throughout the year.
Figure 1
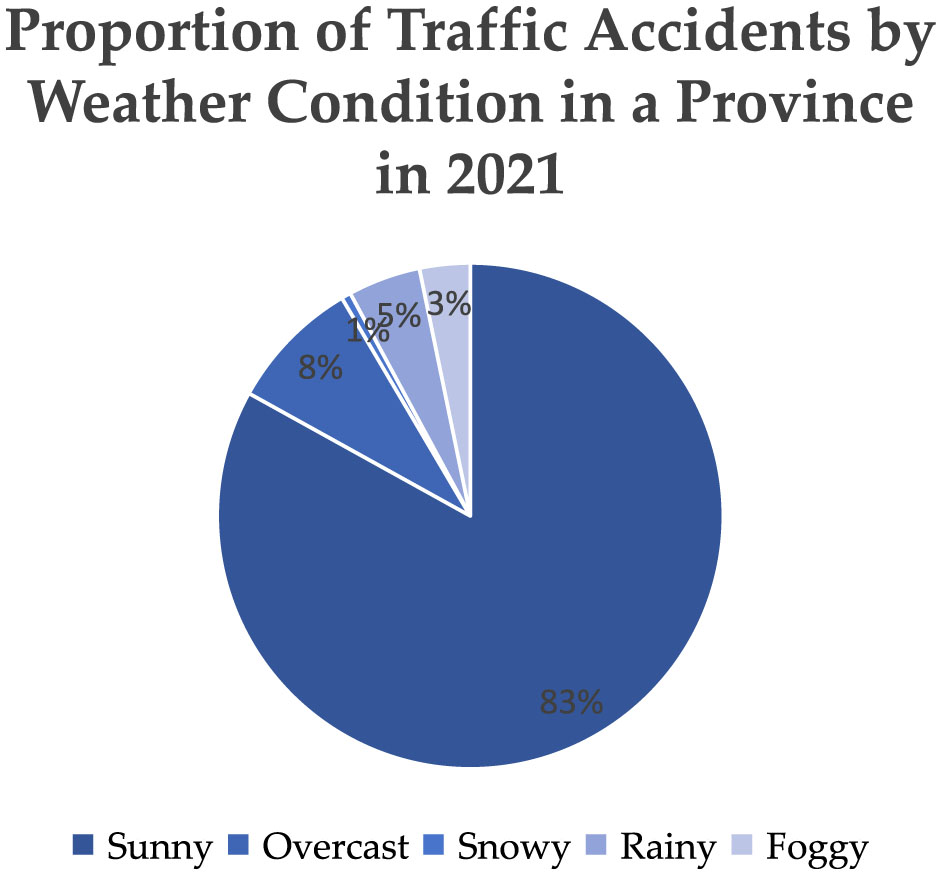
The distribution of traffic accidents under different weather conditions in a province in 2021.
2.2 Road types
Road type significantly influences the risk of accidents by interacting with vehicle speed and traffic complexity. This paper divides road types into ten categories, as shown in Table 2. It also presents the distribution of accidents across different road types in 2021, as shown in Figure 2. On highways, the higher driving speeds lead to an increased accident rate. Although vehicles on urban roads travel at lower speeds, they are more likely to be disrupted by factors, such as pedestrians, non-motorized vehicles, and traffic signals, significantly increasing the probability of low-speed collisions. On rural roads, the lack of comprehensive traffic infrastructure, sharp turns, and complex road conditions greatly increase the risk of accidents. Therefore, the road type significantly influences accident risk.
Table 2
| Road type code | Description | Road type code | Description | Road type code | Description |
|---|---|---|---|---|---|
| 1 | Expressway | 5 | Rural road | 9 | Urban branch road |
| 2 | National road | 6 | Urban expressway | 10 | Other roads |
| 3 | Provincial road | 7 | Urban arterial road | ||
| 4 | County road | 8 | Urban secondary road |
Road types.
Figure 2
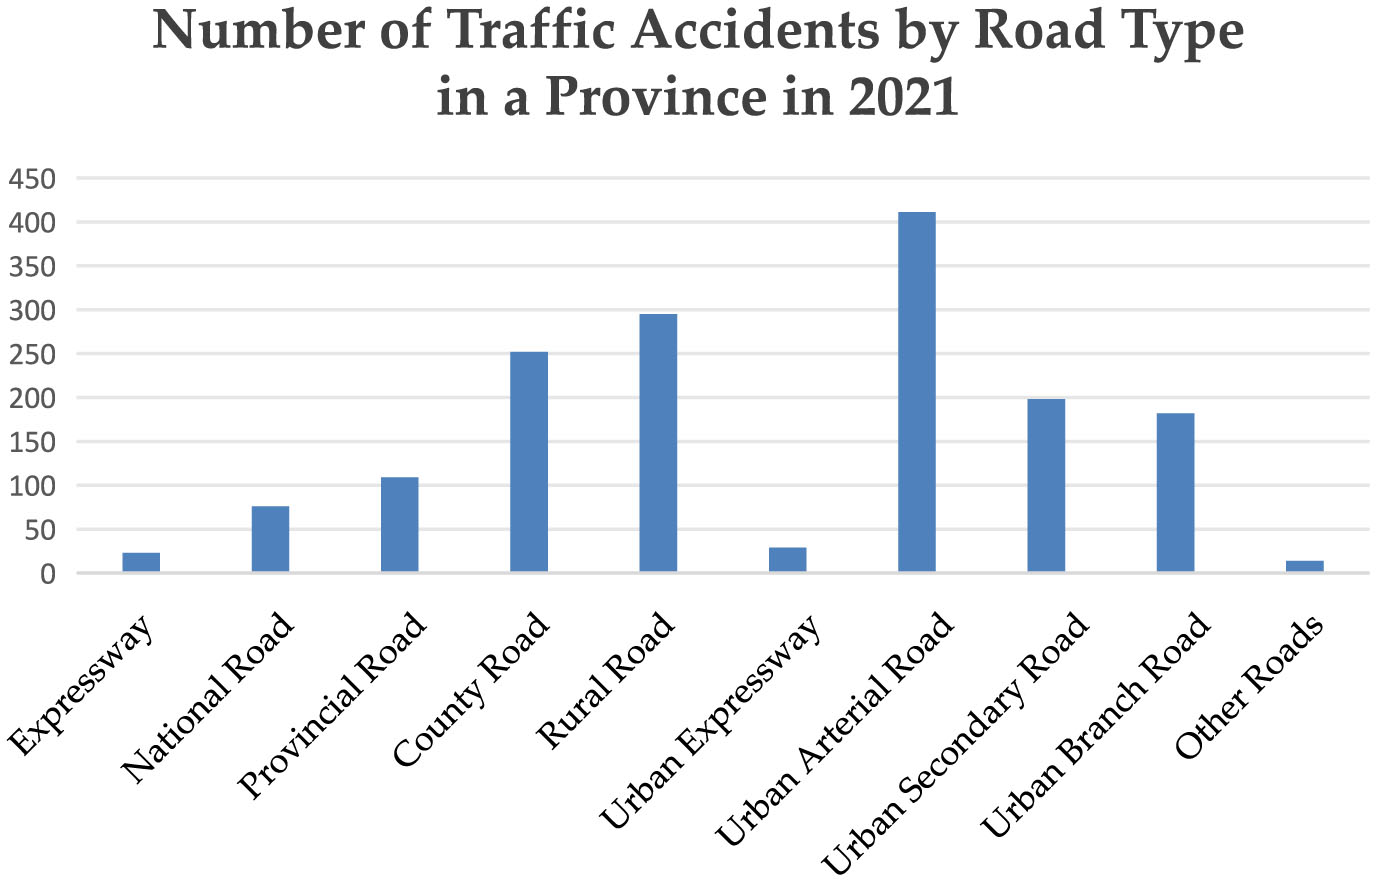
The number of traffic accidents across different road types in a province in 2021.
2.3 Vehicle speed
Vehicle speed is a direct factor influencing both the accident occurrence rate and severity. Higher speeds not only increase braking response time but also reduce the driver's ability to react to sudden situations, sharply increasing the probability of accidents. Additionally, continuous speed data can help analyze driving behavior and traffic flow. Real-time monitoring of vehicle speed allows for the timely identification of abnormal behaviors such as sudden acceleration and hard breaking, which are significant factors contributing to accidents. Therefore, incorporating vehicle speed as a time-series input feature in the model helps accurately predict the occurrence of accidents. Additionally, the distribution of traffic accidents by speed in 2021 is recorded (as shown in Figure 3) and used for feature contribution assessment.
Figure 3
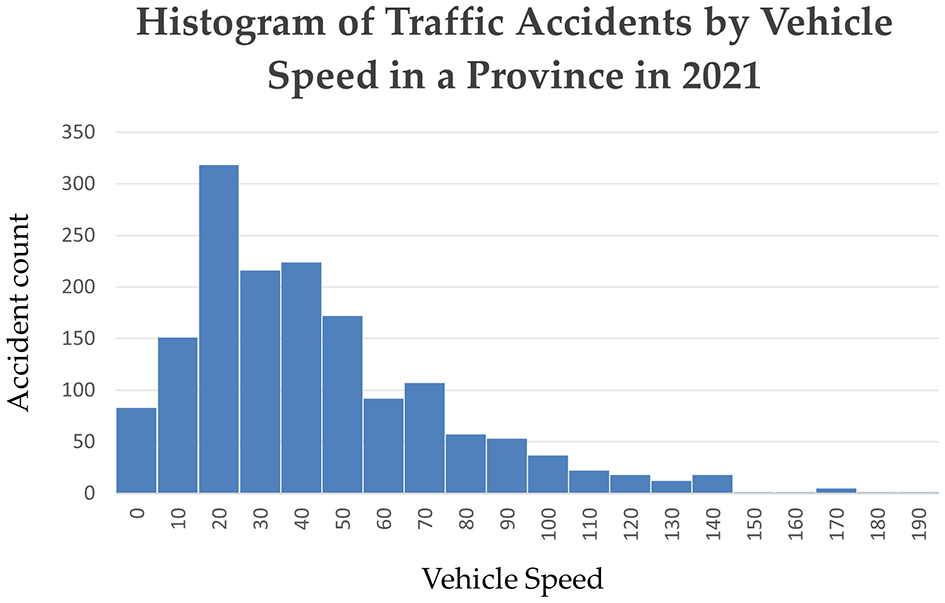
The histogram of traffic accidents by vehicle speed in a province in 2021.
2.4 Vehicle alarm information
The alarm information of new energy vehicles effectively reflects the vehicle's internal status and potential faults. Alarms for high battery temperature, undervoltage, or overvoltage may lead to vehicle loss of control, which is particularly dangerous at high speeds. Alarms related to driving motor anomalies and motor controller failures may cause stalling or loss of control, increasing the risk of accidents. Brake system alarms often accompany reduced braking performance, raising the likelihood of collisions. Therefore, incorporating alarm information as an important variable in the model helps capture potential fault risks in the vehicle. There are 19 types of alarm statuses for new energy vehicle accidents, as detailed in Table 3.
Table 3
| Alarm code | Status description | Alarm code | Status description | Alarm code | Status description |
|---|---|---|---|---|---|
| 0 | No fault | 7 | DC-DC temperature alarm | 14 | Single battery overvoltage alarm |
| 1 | Overcharge of energy storage device | 8 | Insulation alarm | 15 | Low SOC alarm |
| 2 | Drive motor temperature alarm | 9 | Power battery consistency difference alarm | 16 | Energy storage device under voltage alarm |
| 3 | High-voltage interlock alarm | 10 | Rechargeable energy storage system mismatch alarm | 17 | Energy storage device overvoltage alarm |
| 4 | Drive motor controller temperature alarm | 11 | SOC jump alarm | 18 | Battery high-temperature alarm |
| 5 | DC-DC status alarm | 12 | High SOC alarm | 19 | Temperature difference alarm |
| 6 | Brake system alarm | 13 | Single battery under voltage alarm |
New energy vehicle fault alarm codes.
2.5 Vehicle history accident information
Historical accident information is the key variable in constructing an accident prediction model and holds significant value for analyzing the risk of accidents under different conditions. This paper extracts historical accident information from two aspects: accident type and accident frequency, to enhance the model's ability to predict future accident types and occurrence probabilities.
Accident types typically include five categories: scratching, collision, running over, rollover, and battery fire/explosion. Each type of accident has its specific causes and characteristics. Analyzing different accident types can reveal their risk tendencies under specific driving conditions. For example, collisions are more common on highways, while rollovers are more likely to occur on sharp turns or slippery road sections. Taking historical accident types as input variables helps the model accurately identify accident patterns, to optimize the prediction results.
Moreover, accident frequency is a key indicator for assessing accident likelihood. By analyzing the historical occurrence of specific accident types, the potential high-risk areas and contributing factors can be identified. Integrating accident frequency into the model enhances the accuracy of hotspot detection and improves overall prediction performance.
Based on the above analysis about accident-related factors, this paper selects environmental factors (weather and road type), dynamic operating data (speed), vehicle alarm status, and historical accident features as the model inputs. Environmental factors reflect external driving conditions, while dynamic operating data describes the vehicle's real-time operating status. Vehicle alarm status reveals potential technical faults, and historical accident features can reflect the vehicle's accident tendencies. By integrating these features, the models can capture multi-dimensional information affecting accident occurrence, leading to more accurate risk prediction.
2.6 Feature contribution assessment
To quantitatively assess the contribution of different accident features to traffic accidents, the XGBoost model is employed to analyze feature importance. Specifically, the Weight method is applied to measure how frequently each feature fi appears as a split node, which serves as an indicator of its importance. The calculation formula is as follows:
where T is the total number of trees; count(fiin tree t) represents the number of times; feature fi is used to split a node in tree t.
As shown in Figure 4, real-time vehicle speed and vehicle alarm information are the most influential predictors, indicating that dynamic driving behavior and real-time vehicle diagnostics play a critical role in accident occurrence. Historical accident frequency ranks next, as it reflects the unresolved high-risk factors in specific temporal and spatial contexts. Road type and weather conditions have a moderate impact, suggesting that the infrastructure and environmental factors can influence accident risk. Due to lacking direct correlation with real-time risk factors , historical accident types have the weakest effect. Above all, these findings help clarify the relative importance of accident-related features and provide a basis for selecting input parameters in accident risk prediction.
Figure 4
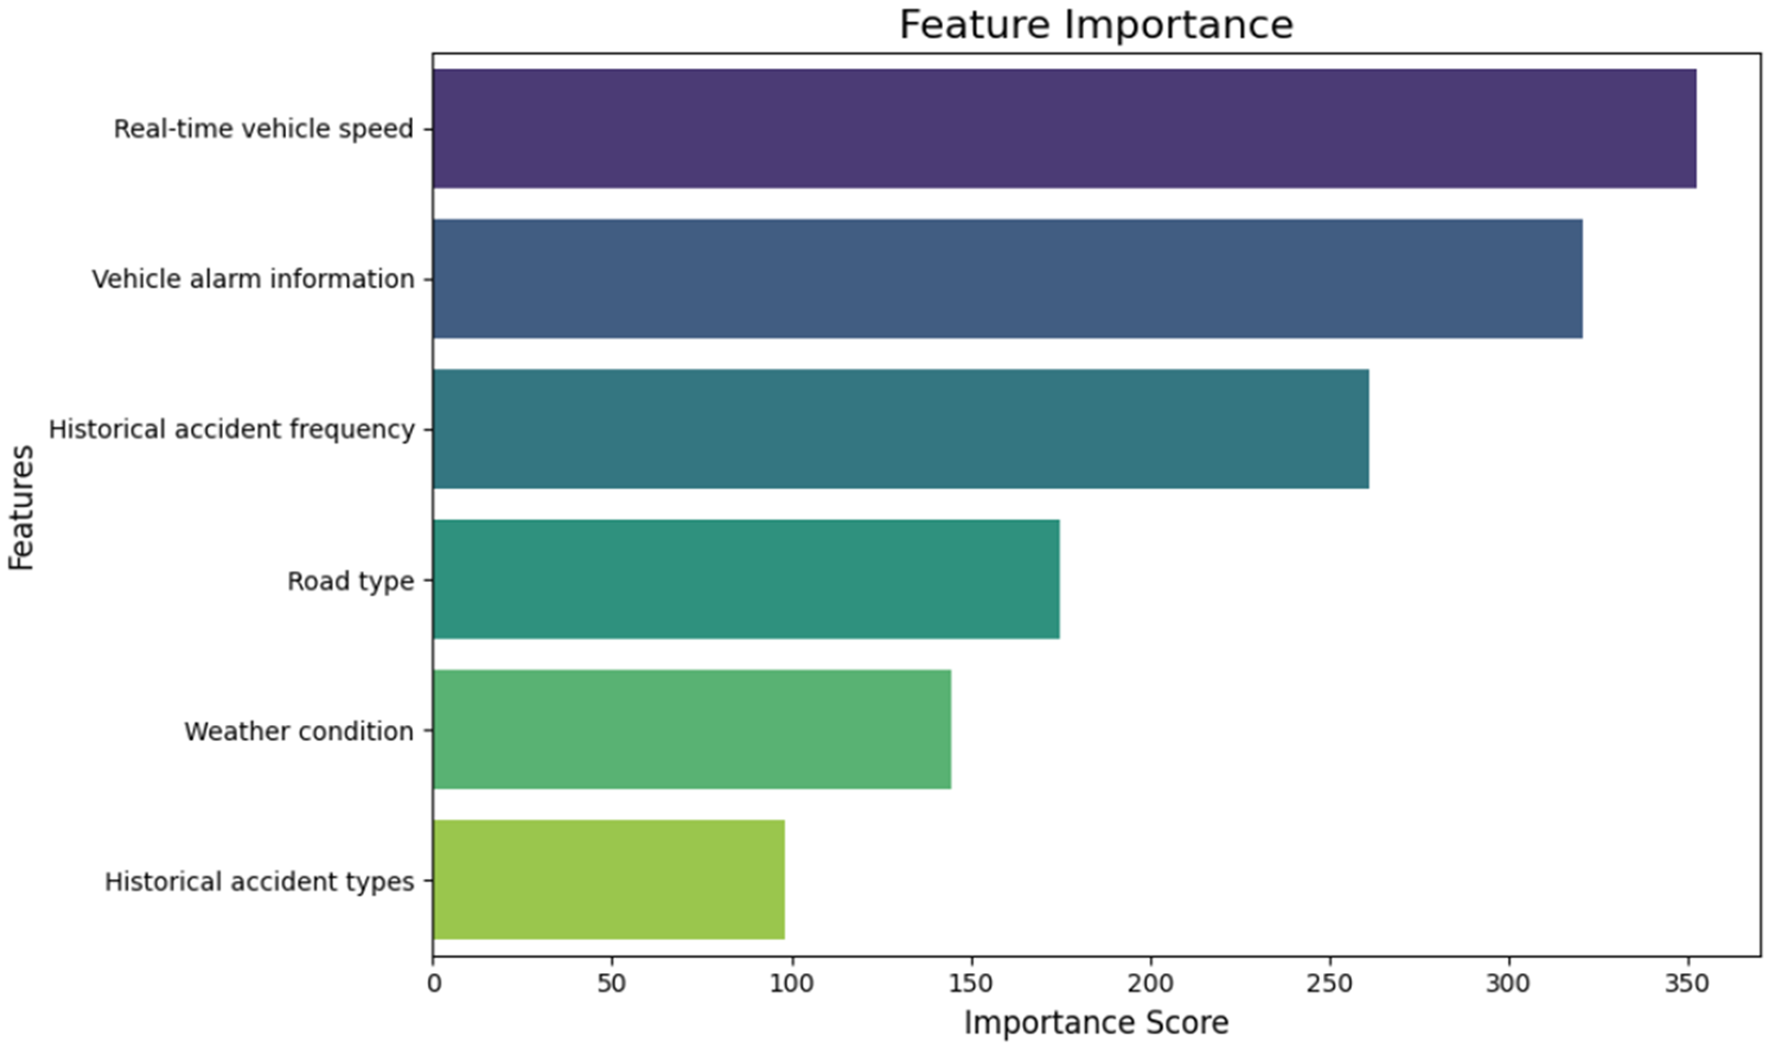
Feature importance ranking of accident predictors from XGBoost modeling.
3 Method
This study proposes a prediction model for new energy vehicle accident risk based on Long Short-Term Memory (LSTM) networks. The model inputs include time-series data (such as weather, road conditions, vehicle speed) and static accident history features (such as vehicle historical accident types). The model output is the accident risk probability, which reflects the likelihood of a vehicle experiencing an accident within a certain future period. The model utilizes LSTM layers to process time-series features and fully connected layers to handle static features, capturing complex temporal dependencies and long-term trends during vehicle operation.
3.1 Introduction to LSTM
Long Short-Term Memory (LSTM) networks are a type of recurrent neural network (RNN) architecture designed for time-series data. They are remembering both long-term and short-term information, addressing the problem of traditional RNNs being unable to capture long-term dependencies in sequences (Hochreiter and Schmidhuber, 1997). The structure of the LSTM network unit is shown in Figure 5.
Figure 5
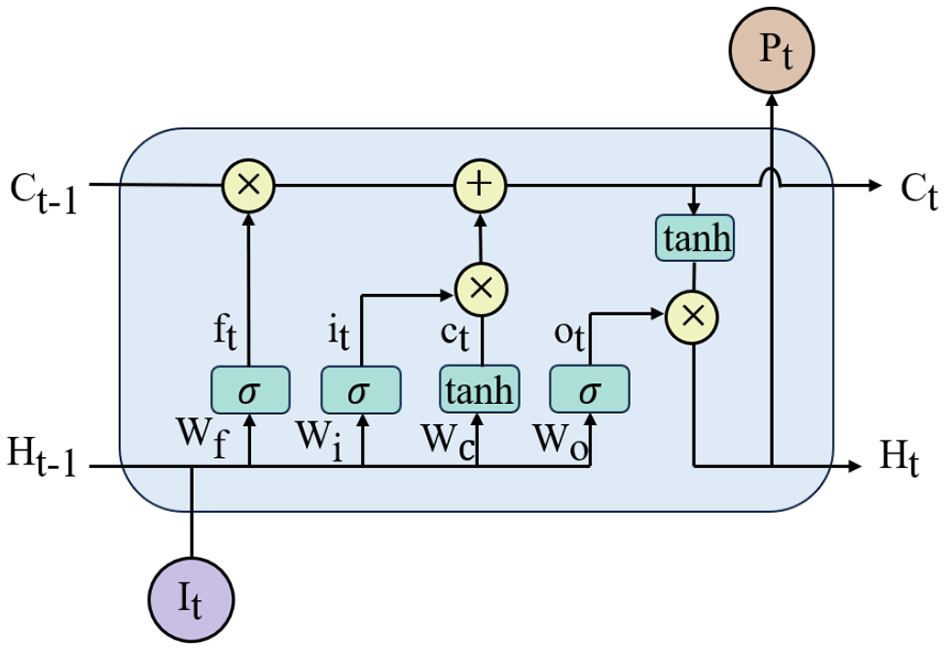
Schematic diagram of the LSTM network unit structure.
The LSTM network consists of multiple identical units, each containing four key components: the input gate, forget gate, output gate, and cell state. The input gate controls which information is added to the cell state, the forget gate determines which information is discarded, and the output gate regulates the contribution of the cell state to the output. The cell state serves as the memory component, storing long-term dependencies. Each gate is governed by the following equations:
Where σ the sigmoid function; x is the input; W is the weight matrix; and b represents the bias term.
The sigmoid function maps the raw values to a range between 0 and 1, enabling it to effectively control the flow of information. Each LSTM network unit has a corresponding memory cell at each time step, whose responsibility is to retain information from the past sequence. LSTM can adjust the amount of information passed at each time step through the gating mechanism, to effectively update the current memory cell state. This ensures that the model can maintain long-term dependencies while avoiding problems of vanishing or exploding gradients.
Given the input sequence be (x1, x2, ⋯ , xT) and the hidden state (h1, h2, ⋯ , hT). The flow steps for an LSTM network unit at time stepare as follows:
-
(1) Data Input: The forget gate computes the output ft by using the hidden state output from the previous time step ht−1 and the current input xt to manage the degree of information retention. The calculation formula for ft is as follows:
-
(2) Memory Selection: First, ht−1 and xt are passed through the input gate to determine the information that needs to be updated, denoted as it. Then, ht−1 and xt are processed through the tanh function to obtain the candidate memory state . Finally, the memory cell is updated ftCt−1 represents the information to be forgotten, while represents the new candidate memory state. The sum of these two gives Ct, which is the memory state at time step t. The calculation formulas are as follows:
-
(3) Data Output: Similar to the forget gate, the output gate computes the result by using ht−1 and xt to obtain Ot. However, Ot is multiplied by the tanh function applied to the current memory state Ct to produce the current hidden state ht.
Where Wf, Wi, Wc, Wo represent the weight matrices, and bf, bi, bc, b0 represent the bias terms. σ represents the sigmoid activation function.
3.2 Overall model structure
The structure of the new energy vehicle accident risk prediction model based on dynamic-static feature fusion is shown in Figure 5. The model mainly consists of the LSTM layer, a fully connected layer for static features, a fusion layer, and an output layer. First, the model processes the time-series inputs, such as vehicle speed, alarm information, and road type, through the LSTM layer to extract temporal dependency features. The LSTM layer processes the input data step by step by a multi-unit structure, to learn the dynamic patterns during the vehicle's operation. Meanwhile, static features, such as historical accident frequency and severity, are processed through an independent fully connected (Dense) layer, generating a fixed feature vector to quantify and capture the vehicle's potential accident risk characteristics. Subsequently, the dynamic features extracted from the LSTM layer and the static feature representation are fused at each time step, forming a joint vector containing both temporal and static features. This joint vector is then input into a multi-layer fully connected network, and the sigmoid activation function generates the risk probability of a future accident occurring for the vehicle. The formal definition of the network structure is as follows: The time-series input is processed through the LSTM layer to obtain a hidden state vector
Where H represents the output dimension of the LSTM layer, denoted as LSTMH. The static input is then mapped to a D-dimensional vector through a fully connected (Dense) layer
Where and are the weight matrix and bias vector of the fully connected layer. Then, the output of the LSTM layer and the static feature representation are concatenated together to form a joint vector
The joint feature vector passes through a fully connected layer with a sigmoid activation function to obtain the output value, which represents the risk probability
where σ represents the sigmoid function, and and bout ∈ ℝ are the weight matrix and bias vector of the output layer. The loss function uses binary cross-entropy to evaluate the deviation between the predicted risk probability and the true label (Shannon, 1948). Assuming the true label is y ∈ {0, 1} and the predicted risk probability is ŷ ∈ (0, 1), the binary cross-entropy loss is calculated as follows:
Where N represents the number of samples, yi is the true label of the i − th sample, and ŷ is the predicted probability for the i − th sample. The loss function penalizes incorrectly classified probabilities, guiding the model to update its weights and improve prediction accuracy.
3.3 Model prediction process
The overall prediction process of the proposed new energy vehicle accident risk prediction model based on dynamic-static feature fusion is shown in Figure 6. The model mainly consists of three components: the data preprocessing module, the model training module, and the detection module.
-
(1) Data Preprocessing Module: The raw data tables are linked using VIN and license plate numbers, with invalid data being removed. To enhance model training effectiveness and data consistency, all input features are normalized. weather, road type, alarm information, and historical accident types are encoded using one-hot encoding, while speed is normalized to the range [0,1]. In inconsistent data frequencies (1 Hz under fault conditions and every 30 s under normal conditions), a sliding window is used to ensure consistent time frame structures for time-series features across different data frequencies. In cases of low-frequency data, linear interpolation is applied within the window to ensure effective data input at each time step. A window from 20 to 10 s before the accident record time is selected as the input for predicting whether the accident will occur.
-
(2) Model Training Module: The preprocessed training data is fed into the network model for training, and the accident risk prediction model is generated by iteratively optimizing the model using the cross-entropy loss function. The structure of the prediction model is shown in Figure 7. The traffic accidents predicted in this study include both minor and severe incidents. All accident records were sourced from user-reported data, either through self-registration via a mobile application or through formal emergency reporting.
-
(3) Risk Prediction Module: The risk prediction module inputs the preprocessed test data into the trained accident risk prediction model. The model performance is assessed by comparing the prediction results with the actual outcomes.
Figure 6
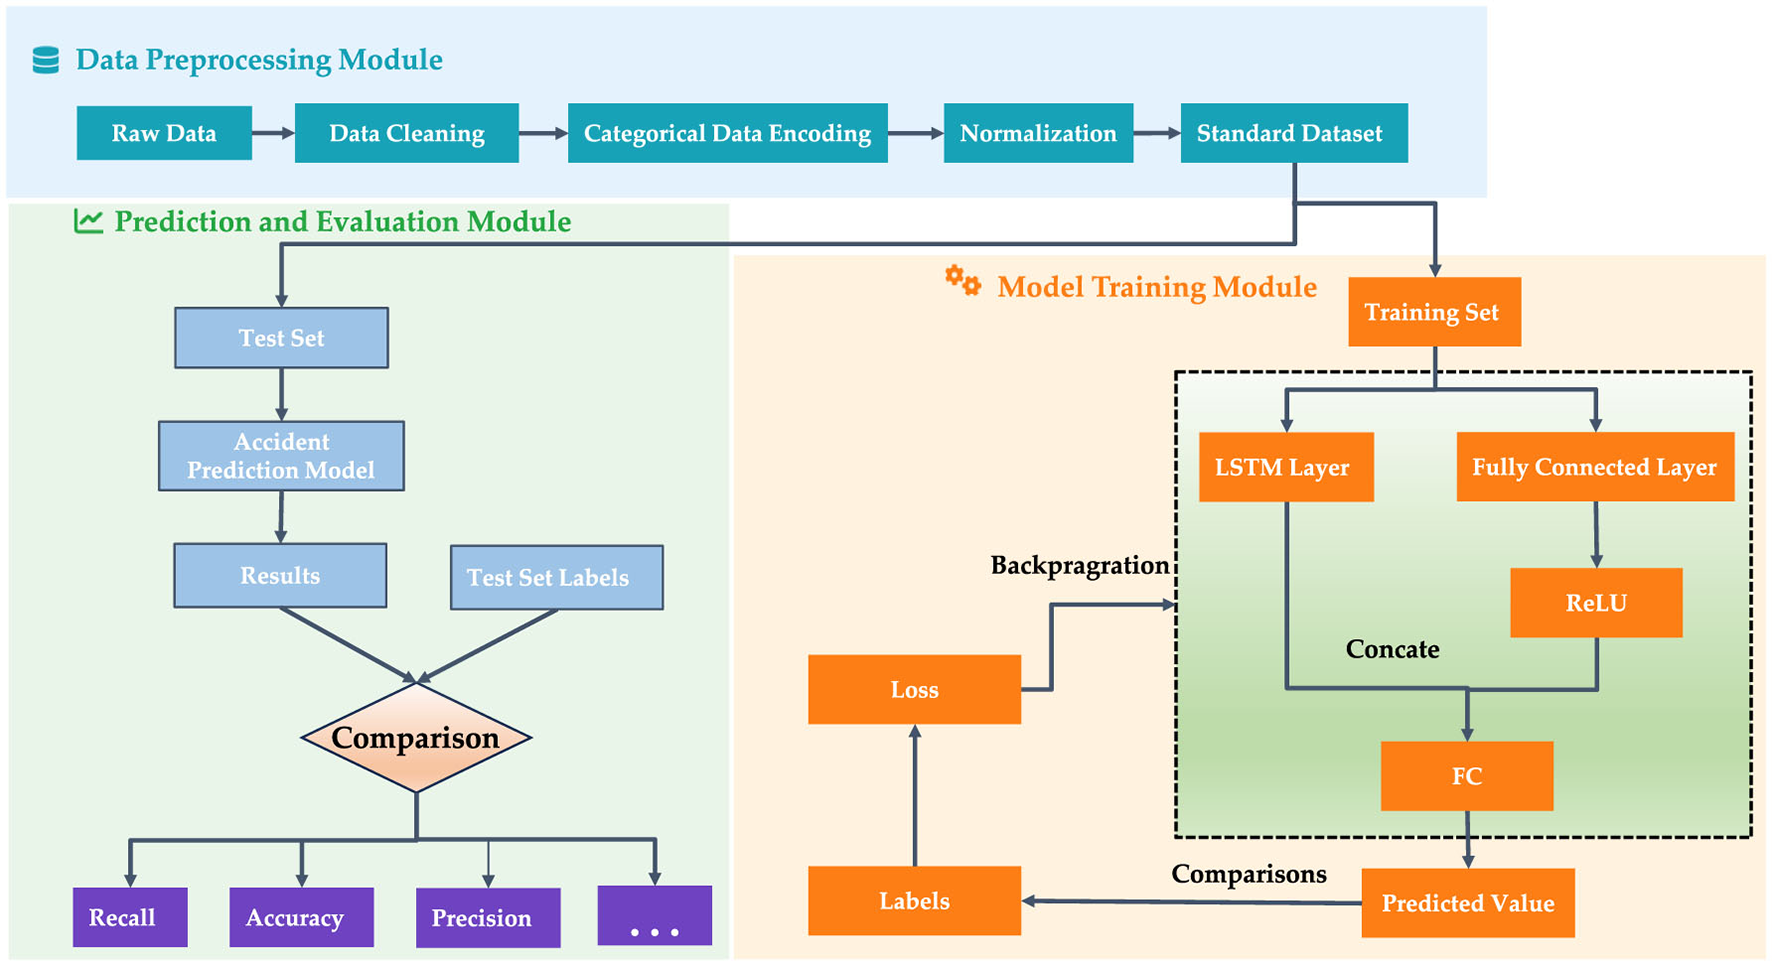
The prediction process of new energy vehicle accident risk prediction model.
Figure 7
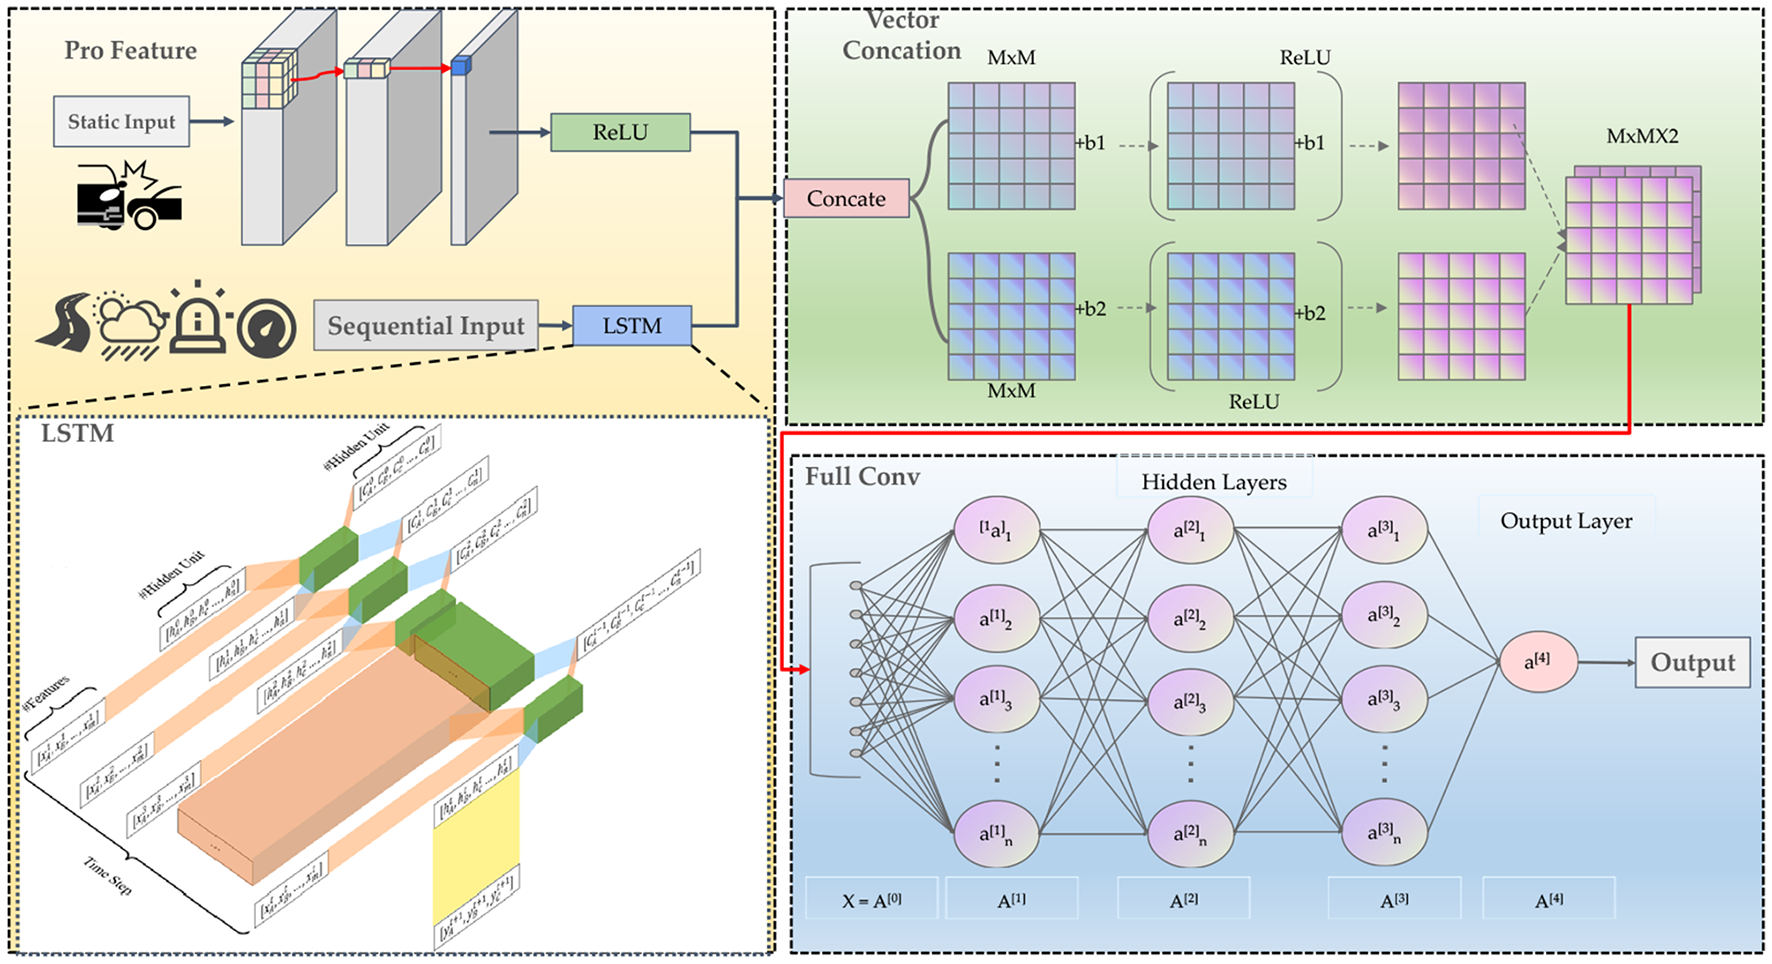
The structure of the new energy vehicle accident risk prediction mode.
4 Results and discussion
4.1 Evaluation metrics
After the model is constructed, its performance needs to be evaluated. Accident prediction is essentially a binary classification task. For binary classification problems, there are four possible outcomes:
-
True Positive (TP): The actual class is positive, and the prediction is also positive, meaning accident cases are accurately identified as accidents.
-
False Positive (FP): The actual class is negative, but the prediction is positive, referring to non-accident cases that are misclassified as accidents.
-
True Negative (TN): The actual class is negative, and the prediction is also negative, meaning non-accident instances are accurately predicted as non-accidents.
-
False Negative (FN): The actual class is positive, but the prediction is negative, referring to accident cases that are misidentified as non-accidents.
To evaluate the performance of the proposed model, Accuracy (Acc), Precision, Recall, and F1 Score are adopted as evaluation metrics.
-
(1) Accuracy represents the ratio of correctly classified samples to the total number of samples
-
(2) Recall means the proportion of actual positive samples that the classifier correctly predicts as positive
-
(3) Precision denotes the proportion of true positive samples among the positive samples identified by the classifier
-
(4) F1 Score: To balance precision and recall, researchers proposed another evaluation metric—the F-score (F1 Score). Its general form is Fβ, as shown in Equation 16.
Where p represents precision, and R denotes recall. The setting of β allows for different weights to be assigned to recall and precision. When β > 1, recall has a greater impact; when 0 < β < 1, precision has a greater impact. In practical tests, both precision and recall are equally important, so β is typically set to 1. Consequently, Equation 16 simplifies to Equation 17, representing the widely used F1 score. The F1 score generally ranges from 0 to 1, with higher values indicating better algorithm performance.
-
(5) False Negative Rate (FNR): The false negative rate indicates the proportion of actual incidents that the system fails to detect. A low FNR is critical for ensuring user trust and system safety. It can be calculated as:
-
(6) Area Under the Receiver Operating Characteristic Curve (AUC): The AUC represents the model's ability to distinguish between positive and negative classes across all possible thresholds. An AUC of 1.0 indicates a perfect classifier, while 0.5 suggests no discriminative ability. The ROC curve plots the True Positive Rate (TPR) against the False Positive Rate (FPR) at various threshold settings. Specifically:
The AUC is the area under the ROC curve, which can be computed as the integral of the ROC curve:
Moreover, The AUC can also be approximated by numerical integration methods using discrete points on the ROC curve:
where n is the number of points on the ROC curve. The AUC ranges from 0 to 1, with values closer to 1 indicating better classification performance.
4.2 Dataset and experimental setup
This experiment selects a portion of the 2021 accident data and non-accident data at a 1:5 ratio, constructing a dataset containing 7,386 records. The dataset is divided into a training set and a test set at a ratio of 8:2. The experiment is conducted using the Python 3.8 programming platform and the Pytorch 2.0.1 framework. The model was trained using the Adam optimizer with an initial learning rate of 0.001. A batch size of 32 was employed, and the training was conducted for a total of 100 epochs.
To obtain the optimal LSTM network parameters, grid search is used to evaluate prediction accuracy under different combinations of LSTM layer depth and hidden size. As shown in Figure 8, the highest validation accuracy of 85.4% is achieved with two LSTM layers, each containing 64 hidden units. However, continuously increasing the number of layers (beyond two) or hidden units (e.g., 256) does not lead to further improvement and may slightly reduce performance, likely due to overfitting. These results suggest that moderately deep and well-balanced architecture is most suitable for modeling dynamic accident risk in new energy vehicles.
Figure 8
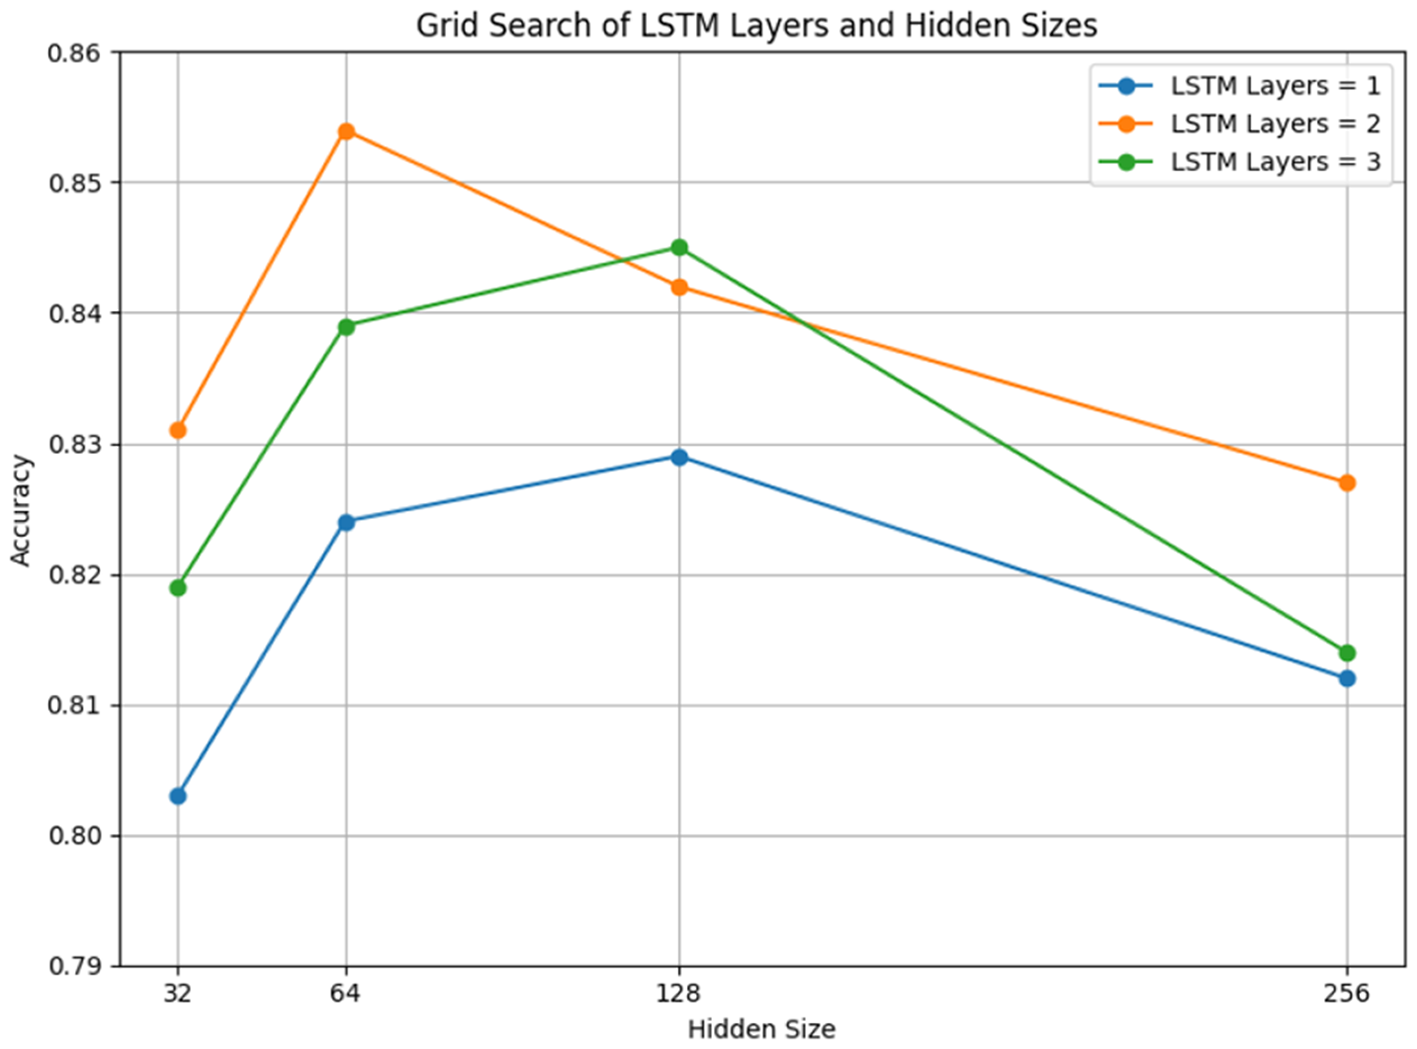
Validation accuracy of LSTM architectures with varying depth and hidden units.
4.3 Experimental results and analysis
As shown in Figure 9, the training loss decreases rapidly during the initial epochs, dropping from approximately 1.02 to below 0.3, indicating that the model quickly learns meaningful feature representations at an early stage. As training continues, the loss gradually declines and stabilizes around 0.13 after about 60 epochs, suggesting a stable training process without significant oscillations or signs of overfitting. It is worth noting that the loss curve exhibits some fluctuations between epochs 10 and 40, which may be caused by factors such as optimizer hyperparameters (e.g., learning rate) or gradient noise from mini-batch training. However, these variations are minor and diminish in later stages, demonstrating good overall convergence.
Figure 9
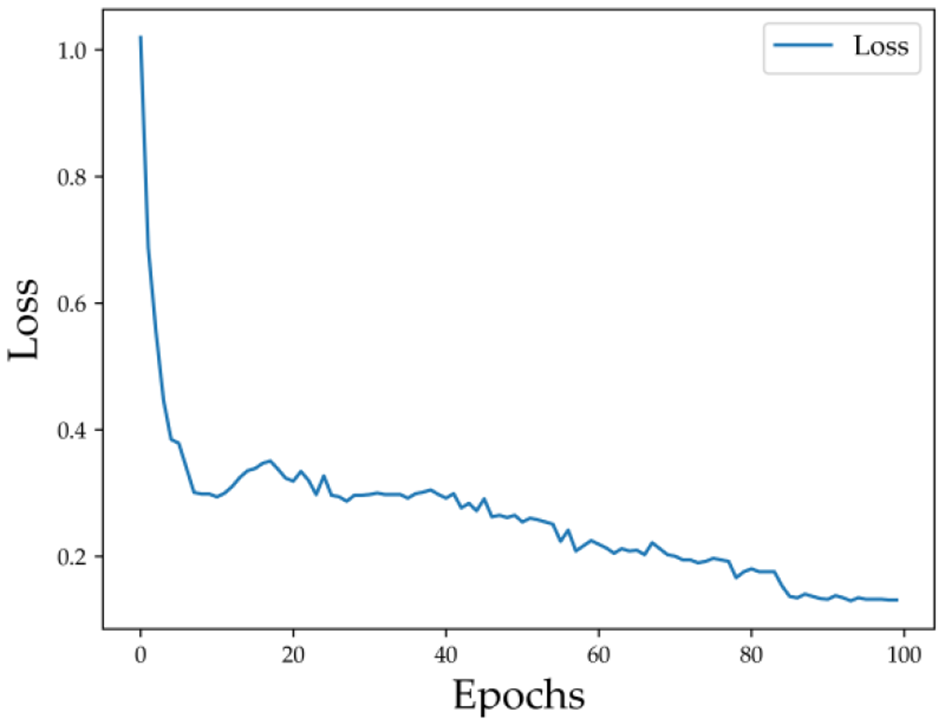
The training loss of the proposed model over epochs.
Figure 10 illustrates the trend of training accuracy over epochs. In the early stages, accuracy increases significantly from approximately 0.42 to around 0.70, indicating that the model quickly learns key discriminative patterns. As training progresses, accuracy continues to improve gradually and begins to plateau after about 60 epochs, eventually stabilizing at around 0.82.
Figure 10
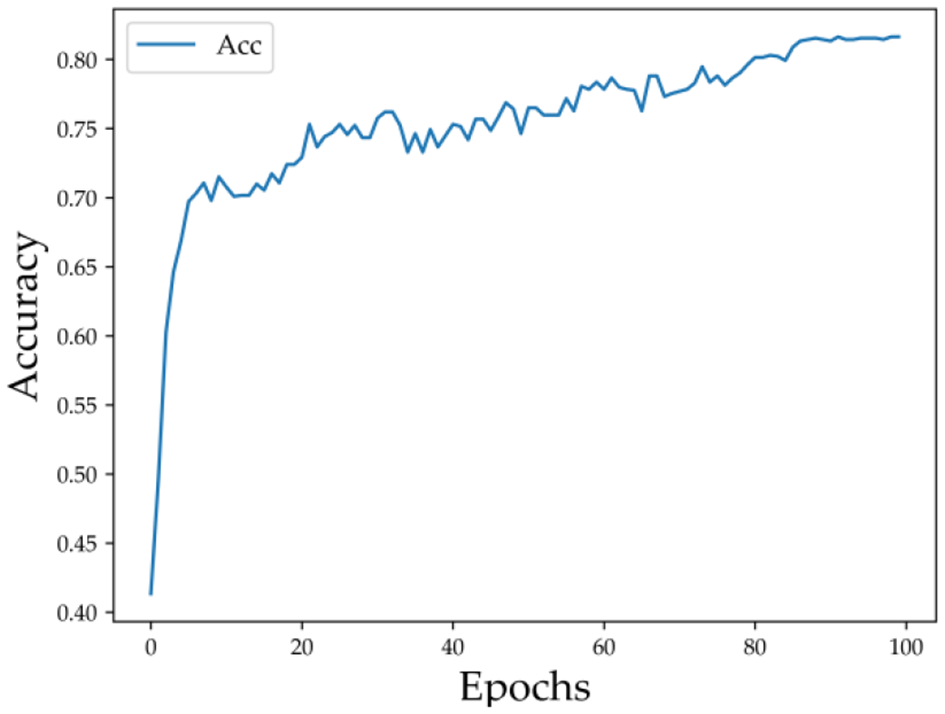
The training accuracy of the proposed model over epochs.
The consistent improvement and eventual convergence in accuracy closely align with the trend observed in the loss curve, further confirming the effectiveness and stability of the training process. Additionally, the absence of accuracy degradation indicates that the model does not exhibit signs of overfitting during training.
To evaluate the effectiveness of temporal modeling and feature integration, we compared our proposed LSTM-based approach with several classical machine learning models, including Random Forest, Support Vector Machine (SVM), and XGBoost. As summarized in Table 4, XGBoost achieves relatively high performance with an accuracy of 84.1%, F1-score of 82.99%, and an AUC of 0.875. This indicates that tree-based ensemble methods can efficiently exploit static and momentary dynamic features to make accurate predictions.
Table 4
| Model | Feature input | Accuracy | Recall | Precision | F1 score | FNR | AUC |
|---|---|---|---|---|---|---|---|
| RF | Dynamic-static | 81.3% | 82.2% | 80.4% | 81.3% | 17.8% | 0.849 |
| SVM | Dynamic-static | 56.3% | 53.5% | 60.2% | 56.7% | 46.5% | 0.607 |
| XGBoost | Dynamic-static | 84.1% | 82.2% | 83.7% | 82.9% | 17.8% | 0.875 |
| Proposed | Dynamic-static | 85.4% | 82.9% | 84.5% | 83.7% | 17.1% | 0.891 |
Performance comparison of different models for NEV accident risk prediction.
However, XGBoost lacks the ability to capture temporal dependencies, which limits its performance in scenarios involving evolving risk over time. In contrast, the LSTM-based model demonstrates superior capability in modeling sequential patterns. By learning from historical behavior trajectories, LSTM enhances the model's sensitivity to risk fluctuations and improves real-time accident prediction.
As shown in Table 4, the proposed dynamic-static feature fusion LSTM model demonstrates outstanding performance across all key metrics. First, the model achieves an accuracy of 85.4%, significantly outperforming both RF (81.3%) and SVM (56.3%), and slightly exceeding the high-performing XGBoost (84.1%), indicating its superior overall prediction accuracy. Additionally, the model attains a recall of 82.9%, comparable to RF (82.2%) and XGBoost (82.2%), and significantly higher than SVM (53.5%), highlighting its reliable ability to identify potential accident risks. At the same time, the precision of the model is 84.5%, surpassing all comparison models (RF: 80.4%, SVM: 60.2%, XGBoost: 83.7%), demonstrating the high reliability of its triggered risk alerts and minimizing the risk of false positives.
The model also achieves an F1 score of 83.7%, outperforming RF (81.3%), SVM (56.7%), and XGBoost (82.9%), effectively balancing the trade-off between accuracy and recall. The low False Negative Rate (FNR) of 17.1% is another notable advantage, slightly better than both RF (17.8%) and XGBoost (17.8%), and significantly improving upon SVM (46.5%), thus reducing the risk of missed accidents and enhancing the safety of the prediction system. Finally, the AUC value of the model is 0.891, surpassing all comparison models (RF: 0.849, SVM: 0.607, XGBoost: 0.875), indicating its superior ability to distinguish between accident and non-accident states across various classification thresholds.
In conclusion, the proposed LSTM model, integrating both dynamic and static features, not only excels in accuracy, precision, F1 score, and AUC, but also ensures efficient accident prediction through a lower FNR. The model's exceptional performance confirms the effectiveness of the LSTM architecture in capturing temporal features of vehicle dynamics and emphasizes the importance of the feature fusion mechanism in integrating static and dynamic information. These advantages make the model highly applicable to the safety prediction tasks for new energy vehicles.
4.4 Ablation study on feature and architecture contributions
To validate the contribution of different feature types and network components, we conducted an ablation study across five model configurations. The settings for each model are shown in Table 5. As shown in Table 6, using only static features (Model A) yields the weakest performance (F1 score = 64.6%, AUC = 0.652), suggesting their limited predictive value. Incorporating dynamic features with temporal modeling (Model B) significantly improves both AUC (0.791) and recall, reducing the false negative rate (FNR) from 27.5% to 25.7%. When all sequential features are used (Model C), performance further improves (F1 = 76.9%, AUC = 0.823), highlighting the benefit of comprehensive temporal input. A purely feed forward model (Model D) that fuses static and dynamic features, but without LSTM, performs better than the sequential-only model, achieving an F1 score of 80.9% and reducing FNR to 19.5%. Our proposed model (Model E) achieves the best overall performance across all metrics: F1 = 83.7%, FNR = 17.1%, and AUC = 0.891, confirming that both LSTM-based temporal modeling and feature fusion are critical to accurate accident risk prediction.
Table 5
| Model ID | Model name | Feature input | Feature type | Uses LSTM | Static feature fusion |
|---|---|---|---|---|---|
| A | Static-only baseline | Weather + road type | Static | No | No |
| B | Dynamic-only baseline | Speed + alarm | Dynamic | Yes | No |
| C | All sequential features only | Weather + road + speed + alarm | Dynamic | Yes | No |
| D | Static + sequential (no LSTM) | All features | Static + dynamic | No | Yes |
| E | Proposed (LSTM + fusion) | All features | Static + dynamic | Yes | Yes (fusion of static and dynamic) |
Model configurations for ablation study.
Table 6
| Model | Accuracy | Recall | Precision | F1 score | FNR | AUC |
|---|---|---|---|---|---|---|
| A | 61.5% | 72.5% | 58.2% | 64.6% | 27.5% | 0.652 |
| B | 75.0% | 74.3% | 73.7% | 73.4% | 25.7 | 0.791 |
| C | 78.2% | 76.6% | 77.2% | 76.9% | 23.4% | 0.823 |
| D | 82.3% | 80.5% | 81.4% | 80.9% | 19.5% | 0.861 |
| E | 85.4% | 82.9% | 84.5% | 83.7% | 17.1% | 0.891 |
Ablation study results of different feature and architecture configurations.
5 Conclusion
This paper presents an accident risk prediction model for new energy vehicles based on dynamic-static feature fusion. First, both direct and indirect features strongly associated with accident risk are extracted from a full year of provincial accident data from 2021. Then, LSTM layers are employed to construct dynamic and static feature vectors that capture potential risk characteristics. Moreover, the accident risk probability is estimated using fully connected layers with a sigmoid activation function. Finally, the model is validated using real-world accident data. The results demonstrate that the model achieves an F1-score of 83.7% for accident prediction, enabling real-time identification of potential risks and timely driver warnings. This approach provides valuable data support for safety management and accident prevention in new energy vehicles, promoting the low-carbon and sustainable development of the automotive industry.
In the future, this study will collect accident data from multiple regions to verify and enhance the robustness of the proposed algorithm across different areas. Additionally, embedded encoding will replace one-hot encoding to better handle large-scale data processing, aiming to provide traffic management authorities with more accurate and comprehensive accident warning information for new energy vehicles.
Statements
Data availability statement
The datasets presented in this article are not readily available because this research utilizes proprietary operational data obtained under strict confidentiality agreements with industry partners. Due to legal and privacy protections governing vehicular data in China (e.g., Personal Information Protection Law, PIPL), raw datasets containing personally identifiable information (PII) cannot be publicly shared. All analyzed features were anonymized and aggregated to comply with regulatory requirements. Requests to access the datasets should be directed to Xiang Zhang, zhangxiang@tmri.cn.
Author contributions
XZ: Writing – original draft, Funding acquisition, Data curation, Resources. XY: Writing – review & editing. SH: Resources, Conceptualization, Validation, Writing – review & editing. GZ: Methodology, Writing – original draft, Visualization. CW: Writing – review & editing.
Funding
The author(s) declare that financial support was received for the research and/or publication of this article. This research was funded by National Key R&D Program of China, grant number 2022YFE0207800.
Conflict of interest
The authors declare that the research was conducted in the absence of any commercial or financial relationships that could be construed as a potential conflict of interest.
Generative AI statement
The author(s) declare that no Gen AI was used in the creation of this manuscript.
Publisher’s note
All claims expressed in this article are solely those of the authors and do not necessarily represent those of their affiliated organizations, or those of the publisher, the editors and the reviewers. Any product that may be evaluated in this article, or claim that may be made by its manufacturer, is not guaranteed or endorsed by the publisher.
References
1
Ahmed S. Hossain M. A. Ray S. K. Bhuiyan M. M. I. Sabuj S. R. (2023). A study on road accident prediction and contributing factors using explainable machine learning models: analysis and performance. Transp. Res. Interdiscip. Perspect.19:100814. 10.1016/j.trip.2023.100814
2
Ardakani S. Liang X. Mengistu K. T. So R. S. Wei X. He B. Cheshmehzangi A. (2023). Road car accident prediction using a machine-learning-enabled data analysis. Sustainability, 15, 5939. 10.3390/su15075939
3
Aung N. Zhang W. Dhelim S. Ai Y. (2018). Accident prediction system based on hidden Markov model for vehicular ad-hoc network in urban environments. Information9:311. 10.3390/info9120311
4
Basso F. Pezoa R. Varas M. Villalobos M. (2021). A deep learning approach for real-time crash prediction using vehicle-by-vehicle data. Accid. Anal. Prev.162:106409. 10.1016/j.aap.2021.106409
5
Berhanu Y. Alemayehu E. Schröder D. (2023). Examining car accident prediction techniques and road traffic congestion: a comparative analysis of road safety and prevention of world challenges in low-income and high-income countries. J. Adv. Transp.2023:6643412. 10.1155/2023/6643412
6
Brühwiler L. Fu C. Huang H. Longhi L. Weibel R. (2022). Predicting individuals' car accident risk by trajectory, driving events, and geographical context. Comp. Environ. Urban Syst.93:101760. 10.1016/j.compenvurbsys.2022.101760
7
Casner S. M. Hutchins E. L. Norman D. (2016). The challenges of partially automated driving. Commun. ACM59, 70–77. 10.1145/2830565
8
Chakraborty A. Mukherjee D. Mitra S. (2019). Development of pedestrian crash prediction model for a developing country using artificial neural network. Int. J. Inj. Control Saf. Promot.26, 283–293. 10.1080/17457300.2019.1627463
9
Chen B. Yuan W. Rui Fu R. Guo Y.-S. (2009). Analysis of traffic accident characteristic on continuous long downgrade section. J. Traffic Transp. Eng.9, 75–78. 10.19818/j.cnki.1671-1637.2009.04.015
10
Enache N. M. Netto M. Mammar S. Lusetti B. (2009). Driver steering assistance for lane departure avoidance. Control Eng. Pract.17, 642–651. 10.1016/j.conengprac.2008.10.012
11
Feng Z. G. Huang B. Y. Liang W. G. (2010). Mechanism analysis of the impact of natural environmental factors on road traffic safety. Shanxi Archit.36, 301–302. 10.13719/j.cnki.cn14-1279/tu.2010.03.034
12
Ghasedi M. Sarfjoo M. Bargegol I. (2021). Prediction and analysis of the severity and number of suburban accidents using logit model, factor analysis and machine learning: a case study in a developing country. SN Appl. Sci.3:13. 10.1007/s42452-020-04081-3
13
Ghosh B. Karmakar S. (2025). A safety assessment and accident prediction over national level highway using artificial neural network. J. Inst. Eng. India. Ser. A.1–13. 10.1007/s40030-025-00889-7
14
Hao D. Zhao D. Q. Kuang L. (2015). Research and application of non-contact remote sensing pavement condition detection and early warning system. J. Transp. Sci. Eng.31, 85–91. 10.16544/j.cnki.cn43-1494/u.2015.01.015
15
Hassan H. M. Abdel-Aty M. A. (2011). Analysis of drivers' behavior under reduced visibility conditions using a structural equation modeling approach. Transp. Res. Part F. Traffic Psychol. Behav.14, 614–625. 10.1016/j.trf.2011.07.002
16
Hochreiter S. Schmidhuber J. (1997). Long short-term memory. Neural Comput.9, 1735–1780. 10.1162/neco.1997.9.8.1735
17
Kaffash Charandabi N. Gholami A. Abdollahzadeh Bina A. (2022). Road accident risk prediction using generalized regression neural network optimized with self-organizing map. Neural Comp. Appl.34, 8511–8524. 10.1007/s00521-021-06549-8
18
Koramati S. Majumdar B. B. Pani A. Sahu P. K. (2022). A registry-based investigation of road traffic fatality risk factors using police data: a case study of Hyderabad, India. Saf. Sci.153:105805. 10.1016/j.ssci.2022.105805
19
Li H. Chen L. (2025). Traffic accident risk prediction based on deep learning and spatiotemporal features of vehicle trajectories. PLoS One20:e0320656. 10.1371/journal.pone.0320656
20
Li H. Yu L. (2025). Prediction of traffic accident risk based on vehicle trajectory data. Traffic Injury Prev.26, 164–171. 10.1080/15389588.2024.2402936
21
Lin D. J. Chen M. Y. Chiang H. S. Sharma P. K. (2021). Intelligent traffic accident prediction model for Internet of Vehicles with deep learning approach. IEEE Trans. Intell. Transp. Syst.23, 2340–2349. 10.1109/TITS.2021.3074987
22
Lin L. Wang Q. Sadek A. W. (2015). A novel variable selection method based on frequent pattern tree for real-time traffic accident risk prediction. Transp. Res. Part C. Emerging Technol.55, 444–459. 10.1016/j.trc.2015.03.015
23
Mandal B. Li L. Wang G. S. Lin J. (2016). Towards detection of bus driver fatigue based on robust visual analysis of eye state. IEEE Trans. Intell. Transp. Syst.18, 545–557. 10.1109/TITS.2016.2582900
24
Mantouka E. G. Barmpounakis E. N. Vlahogianni E. I. (2019). Identification of driving safety profiles from smartphone data using machine learning techniques. Saf. Sci.119, 84–90. 10.1016/j.ssci.2019.01.025
25
Ministry of Public Security (2024). The Number of Motor Vehicles in China Reaches 435 Million, with 523 Million Drivers, and the Number of New Energy Vehicles Exceeds 20 Million. China: The Central People's Government of the People's Republic of China.
26
Najafi Moghaddam Gilani V. Hosseinian S. M. Ghasedi M. Nikookar M. (2021). Data-driven urban traffic accident analysis and prediction using logit and machine learning-based pattern recognition models. Math. Probl. Eng.2021:9974219. 10.1155/2021/9974219
27
Ning H. Xu W. Zhou Y. Gong Y. Huang T. S. (2009). A general framework to detect unsafe system states from multisensor data stream. IEEE Trans. Intell. Transp. Syst.11, 4–15. 10.1109/TITS.2009.2026446
28
Park R. C. Hong E. J. (2022). Urban traffic accident risk prediction for knowledge-based mobile multimedia service. Pers. Ubiquitous Comp.26, 417–427. 10.1007/s00779-020-01442-y
29
Prajapati G. Kumar L. Patil S. R. S. (2023). Road accident prediction using machine learning. J. Sci. Res. Technol.48–59. 1, 48–59. 10.5281/zenodo.7961680
30
Ren H. Song Y. Wang J. Hu Y. Lei J. (2018). “A deep learning approach to the citywide traffic accident risk prediction,” in 2018 21st International Conference on Intelligent Transportation Systems (ITSC) (Maui, HI: IEEE), 3346–3351. 10.1109/ITSC.2018.8569437
31
Roland J. Way P. D. Firat C. Doan T. N. Sartipi M. (2021). Modeling and predicting vehicle accident occurrence in Chattanooga, Tennessee. Accid. Anal. Prev.149:105860. 10.1016/j.aap.2020.105860
32
Santos D. Saias J. Quaresma P. Nogueira V. B. (2021). Machine learning approaches to traffic accident analysis and hotspot prediction. Computers10:157. 10.3390/computers10120157
33
Shaik M. E. Islam M. M. Hossain Q. S. (2021). A review on neural network techniques for the prediction of road traffic accident severity. Asian Transp. Stud.7:100040. 10.1016/j.eastsj.2021.100040
34
Shannon C. E. (1948). A mathematical theory of communication. Bell Syst. Tech. J.27, 379–423. 10.1002/j.1538-7305.1948.tb01338.x
35
Sun W. Abdullah L. N. Suhaiza Sulaiman P. Khalid F. (2024). Meta-feature-based traffic accident risk prediction: a novel approach to forecasting severity and incidence. Vehicles6, 728–746. 10.3390/vehicles6020034
36
Wang S. Zhang J. Li J. Miao H. Cao J. (2021). Traffic accident risk prediction via multi-view multi-task spatio-temporal networks. IEEE Trans. Knowl. Data Eng.35, 12323–12336. 10.1109/TKDE.2021.3135621
37
Wang X. F. Fu X. S. Ge T. (2011). Driving risk evaluation model of freeway interchange entrance area. J. Traffic Transp. Eng.11, 88–92. 10.19818/j.cnki.1671-1637.2011.05.014
38
Xiao J. Kulakowski B. T. EI-Gindy M. (2000). Prediction of risk of wet-pavement accidents: fuzzy logic model. Transp. Res. Rec.1717, 28–36. 10.3141/1717-05
39
Xu C. C. (2013). Real time crash risk prediction model on freeways under nasty weather conditions. J. Jilin University1, 73–78. 10.13229/j.cnki.jdxbgxb2013.01.036
40
Xu X. L. (2013). Study on the impact of asphalt pavement skid resistance on traffic safety (Dissertation). Beijing: Beijing University of Civil Engineering and Architecture.
41
Yannis G. Dragomanovits A. Laiou A. La Torre F. Domenichini L. Richter T. et al . (2017). “Road traffic accident prediction modelling: a literature review,” in Proceedings of the Institution of Civil Engineers-Transport, Vol. 170, No. 5 (Thomas Telford Ltd), 245–254. 10.1680/jtran.16.00067
42
Yu L. Du B. Hu X. Sun L. Han L. Lv W. et al . (2021). Deep spatio-temporal graph convolutional network for traffic accident prediction. Neurocomputing423, 135–147. 10.1016/j.neucom.2020.09.043
43
Zhang S. Khattak A. Matara C. M. Hussain A. Farooq A. (2022). Hybrid feature selection-based machine learning classification system for the prediction of injury severity in single and multiple-vehicle accidents. PLoS One17:e0262941. 10.1371/journal.pone.0262941
44
Zhao H. Li X. Cheng H. Zhang J. Wang Q. Zhu H. et al . (2022). Deep learning-based prediction of traffic accidents risk for internet of vehicles. China Commun.19, 214–224. 10.23919/JCC.2022.02.017
45
Zhao H. Yu H. Li D. Mao T. Zhu H. (2019). Vehicle accident risk prediction based on AdaBoost-SO in VANETs. IEEE Access7, 14549–14557. 10.1109/ACCESS.2019.2894176
46
Zhao S. Cheng P. Schwebel D. C. Zhao M. Yang L. Xiao W. et al . (2025). Characteristics of media-reported road traffic crashes related to new energy vehicles in China. J. Saf. Res.92, 48–54. 10.1016/j.jsr.2024.11.012
Summary
Keywords
new energy vehicle, accident risk prediction, dynamic-static feature fusion, long short-term memory, traffic safety
Citation
Zhang X, Yin X, Huang S, Zhang G and Wang C (2025) Risk prediction of new energy vehicle based on dynamic-static feature fusion. Front. Sustain. Cities 7:1649853. doi: 10.3389/frsc.2025.1649853
Received
19 June 2025
Accepted
31 July 2025
Published
25 August 2025
Volume
7 - 2025
Edited by
Salvador García-Ayllón Veintimilla, Polytechnic University of Cartagena, Spain
Reviewed by
Pendela Kanchanamala, GMR Institute of Technology, India
Bittu Ghosh, National Institute of Technology, Durgapur, India
Updates
Copyright
© 2025 Zhang, Yin, Huang, Zhang and Wang.
This is an open-access article distributed under the terms of the Creative Commons Attribution License (CC BY). The use, distribution or reproduction in other forums is permitted, provided the original author(s) and the copyright owner(s) are credited and that the original publication in this journal is cited, in accordance with accepted academic practice. No use, distribution or reproduction is permitted which does not comply with these terms.
*Correspondence: Xiang Zhang zhangxiang@tmri.cnXiaoxuan Yin xiaoxuan_yin@bit.edu.cn
Disclaimer
All claims expressed in this article are solely those of the authors and do not necessarily represent those of their affiliated organizations, or those of the publisher, the editors and the reviewers. Any product that may be evaluated in this article or claim that may be made by its manufacturer is not guaranteed or endorsed by the publisher.