Abstract
Introduction:
Growing remote sensing and machine learning capabilities offer opportunities to understand the spatiotemporal performance of reflective cool roofs, a widely implemented urban heat mitigation tool, in relation to health. We evaluated cool roof solar reflectivity trends across NYC and in heat-vulnerable communities.
Methods:
In this retrospective, longitudinal study, we used satellite-derived cool roof data aggregated to census blocks over 2014–2020. Roofs with a solar reflectivity value ≥ 65 in 2014 were defined as cool roofs with sufficient albedo. Cool roofs with subsequent reflectivity < 65 were considered degraded. We descriptively calculated the cumulative proportion of census blocks that experienced degradation across NYC and in low vs. high heat-vulnerable areas defined by the NYC heat vulnerability index.
Results:
Of 18,565 census blocks with at least one building with a cool roof installed and an average cool roof reflectivity ≥ 65 in 2014, 24.56% experienced degradation by 2020. A greater proportion of census blocks experienced degradation by 2020 in low (27.03%) vs. high (21.20%) heat-vulnerable areas. The largest proportion of total, census block-level cool roof degradation occurred between 2014 and 2016 (57.39%).
Discussion:
We found strong evidence of cool roof degradation across NYC, which has important implications for future health-based evaluations. Interestingly, a larger proportion of census blocks experienced cool roof degradation in low compared to high-heat vulnerable areas, potentially highlighting the effectiveness of community-led environmental justice initiatives. Municipal maintenance initiatives are needed to ensure the urban heat mitigation potential of cool roofs is sustained.
Introduction
Increasingly frequent and intense extreme heat events are a growing threat to health and health equity. In the United States (U. S.), heat-related age-adjusted mortality rates have risen by 17% since 2016 (Howard et al., 2024). Non-Hispanic American Indian/Alaska Native and Non-Hispanic Black populations have disproportionately experienced the highest rates of heat-related deaths compared to other racial and ethnic communities in the U. S. (Vaidyanathan, 2020).
Urban communities are particularly vulnerable to extreme heat exposure, with higher rates of extreme heat-driven mortality observed in urban compared to rural areas (Madrigano et al., 2015). Higher heat vulnerability in urban communities is driven, in part, by the urban heat island (UHI) effect, where cities are warmer than surrounding suburban and rural communities due to having less green infrastructure and a higher density of surfaces with low solar reflectivity (termed low albedo). Low-albedo surfaces (e.g., roads, dark-colored buildings) absorb and re-emit solar energy as heat. Conversely, high-albedo surfaces (e.g., light-colored surfaces) reflect solar energy back into the atmosphere, resulting in reflective cooling.
Within a given city, disproportionate exposure to the UHI effect has been observed in communities with a higher proportion of racial and ethnic minoritized populations and low-income households (Hsu et al., 2021). The higher intraurban concentration of low albedo surfaces and vegetation in these neighborhoods, often termed environmental justice communities, is, in part, a result of historical and ongoing disinvestment (e.g., exclusionary zoning, redlining), and strongly correlates with disparities in health and life expectancy (Benz and Burney, 2021; Locke et al., 2021). Therefore, the growing effect of UHIs in a warming climate risks further exacerbating wide and long-standing health inequities.
In response, a growing number of urban municipalities are implementing infrastructural interventions to mitigate the UHI effect, especially in environmental justice communities. In dense cities, like New York City (NYC), roofs comprise a large percentage of land surface area, and, therefore, are a target for UHI mitigation initiatives. Roofing interventions that have been shown to mitigate the UHI effect include photovoltaic solar panel roofs, green roofs, and cool roofs. Cool roofs, which promote reflective cooling through high roof surface albedo, have been demonstrated to be more effective in mitigating the UHI effect than alternative options, and are highly utilized in various municipal UHI reduction programs due to their relative affordability and scalability (Tan et al., 2023; Li et al., 2014; Treglia et al., 2022). Prior studies have demonstrated co-benefits of cool roof installation, including prolonged roof surface and HVAC unit lifespans, reduced building energy consumption, and reduced individual reliance on energy-dependent cooling resources (e.g., air conditioning). However, cool roofs have been demonstrated to degrade with time due to environmental conditions, such as dust and pollutant accumulations and material surface wear-and-tear, which reduces their surface albedo (Chen and Lu, 2020; Aggarwal and Molleti, 2024).
Numerous studies have examined the impact of high-albedo building materials on measures of human thermal comfort. Some have shown that high-albedo surfaces installed on building walls or other structures adjacent to urban streets can increase mean radiant temperature and glare, thereby reducing pedestrian comfort (Lopez-Cabeza et al., 2022; Yi et al., 2025; Salata et al., 2015). In contrast, studies focused specifically on cool roofs—which pose less risk of radiating heat toward pedestrian areas—have generally found a net positive effect on human thermal comfort (Wang et al., 2023; Baniassadi et al., 2018).
To our knowledge, only four studies have evaluated the relationship between cool roof installation and heat-related health outcomes (Bunker et al., 2024; Macintyre and Heaviside, 2019; He et al., 2020; Simpson et al., 2024). In these studies, cool roof exposure is often simulated at the city level and defined in binary terms, rarely accounting for potential spatiotemporal variability of cool roof temperature effects due to factors such as surface albedo degradation or structural disinvestment. In Macintyre and Heaviside’s 2019 study, cool roof effects on mortality were simulated by assigning a roof surface albedo of 0.70 to building roofs across the West Midlands, UK (Macintyre and Heaviside, 2019). This value was chosen to represent the fact that higher albedo cool roofs are achievable but degrade with time. In He et al.’s study, cool roof mortality impacts were simulated based on an uniform application of 0.88 albedo on all roofs in urban areas in New England, while Simpson et al.’s study simulated cool roof mortality impacts using a uniform application of 0.85 surface albedo on all roof surfaces in London (He et al., 2020; Simpson et al., 2024). The majority of these studies estimate the impact of cool roof installation on heat-specific mortality (e.g., heatstroke) by using published exposure-response coefficients to estimate mortality risks as a function of cool roof temperature changes. In doing so, these studies have demonstrated cool roof-derived offsets in heat-specific mortality ranging from 17 to 249 deaths during summer months.
With the growing application of advanced remote sensing methods with machine and deep learning techniques, observational, building-level cool roof datasets are being created, paralleling the proliferation of high-resolution, geospatial environmental datasets (Cool Roofs in a Warm City, 2023; Yi et al., 2025; Park et al., 2024; Song and Chen, 2025). Such built-environment datasets can be joined to administrative health data (e.g., claims and electronic health record databases) at scale and across time, allowing for epidemiological health outcome evaluations of built-environment exposures and interventions (Titus et al., 2025). This is important, as environmental epidemiological studies have demonstrated the vast underestimation of extreme heat-related health impacts when solely relying on measures of heat-specific mortality, without considering other etiologies of extreme heat mortality (e.g., exacerbation of chronic conditions) and morbidity (Longden, 2025; Bobb et al., 2014). The ability to leverage large administrative health datasets, therefore, offers an opportunity to comprehensively examine the potential health benefits of cool roofs on a wide array of health outcomes beyond heat-specific mortality (e.g., heatstroke). When evaluating the health impacts of built-environmental factors, understanding and accounting for potential spatiotemporal variability in exposure characteristics is important for accurate treatment effect estimation and causal inference (South et al., 2021; South et al., 2018). Given that cool roofs primarily mitigate the UHI effect through reflective cooling, geographically patterned and time-dependent changes in the solar reflectivity (albedo) of installed cool roofs are an important consideration for experimental evaluations of their heat-health impacts.
We aimed to evaluate cool roof surface albedo trends across NYC and in intra-urban environmental justice communities. In doing so, we hoped to elucidate potential time-and space-varying aspects of NYC cool roofs, which could inform future epidemiological evaluations of the effects of cool roofs on health outcomes and intermediary drivers of health (e.g., energy consumption). We hypothesized that cool roof albedo would degrade across NYC over time.
Prior studies have demonstrated associations between structural disinvestment, such as redlining, and markers of poor housing maintenance, such as relevant housing code violations (Swope et al., 2025; Lynch et al., 2021; Milletich et al., 2025). Therefore, we hypothesized that cool roofs may degrade more quickly in heat-vulnerable, environmental justice communities compared to neighboring NYC communities.
Methods
Exposure
We obtained cool roofs data aggregated to NYC census blocks every 2 years between 2014 and 2020 from the NYC Cool Roofs Dashboard NEW (2025) and Cool Roofs in a Warm City (2023). The Dashboard’s cool roof dataset was created by combining earth observation products from cloud-free Landsat 8 images and New York State orthoimagery (Landsat Science Products | U.S. Geological Survey, 2023; Orthoimagery. gis, 2025). Landsat shortwave albedo was calculated to determine roof solar reflectivity with four bands from the New York State orthoimages (Red, Green, Blue, and Infra-Red) using Ban-Wiess’s remote sensing method and validated with Liang’s method (Ban-Weiss et al., 2015; Liang, 2001). This resulted in census block-level measures of average roof reflectivity on a 0–100 scale, with 100 being a maximally bright roof and 0 being a minimally bright (e.g., dark) roof. Our measure of roof reflectivity aligns with the aforementioned data sources inherent to the Dashboard, and is highly correlated with the standard Solar Reflectivity Index (SRI). Figure 1 provides an example of our calculated reflectivity for a representative range of NYC roof surfaces. In our dataset, we determined that roofs covered with asphalt or dark materials had reflectivity values less than 40, while roofs covered with cool roof materials tended to have reflectivity values of 60 and above. Flohr et al. provide additional details of the data processing that was performed to create the study dataset (Flohr et al., 2023).
Figure 1
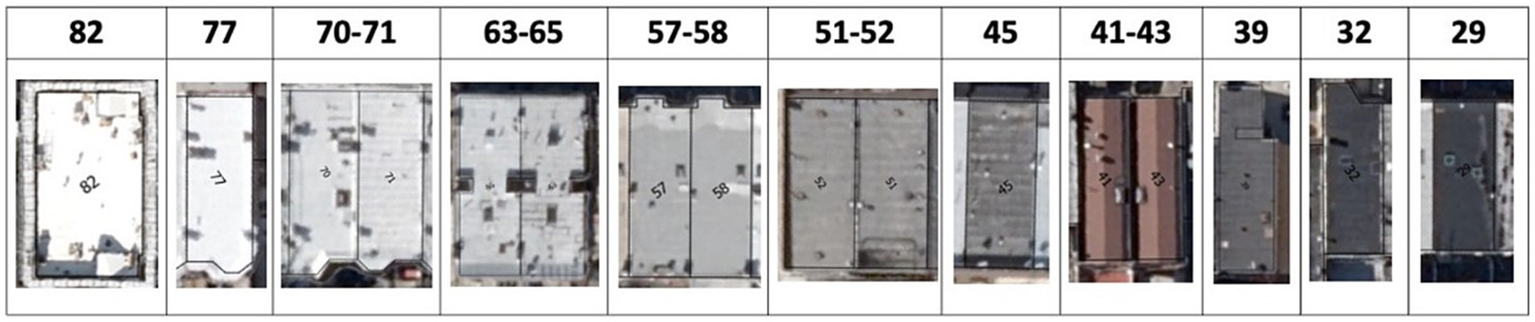
A representative sample of calculated reflectivity values for roof surfaces across New York City. Data source: New York City Cool Roofs Dashboard (NYC Cool Roofs Dashboard NEW, 2023; Cool Roofs in a Warm City, 2023).
Outcome
Our study outcome of interest was the degradation of installed cool roofs in NYC during the study period. In building standards such as LEED V4, SRI greater than 64 is the minimum solar reflectance standard threshold for cool roofs (LEED Certification. Cool Roof Rating Council, n.d.). Therefore, roof surfaces with a reflectivity value of 65 or greater were defined as sufficiently bright cool roofs. Cool roofs with a reflectivity value below 65 were insufficiently bright roofs, representing degradation.
Statistical analysis
Our study sample included NYC census blocks with at least one cool roof installed and an average cool roof reflectivity ≥ 65 in 2014. We used descriptive statistics to evaluate cumulative census block-level average cool roof reflectivity degradation in all included census blocks, and comparatively between census blocks with low heat vulnerability and high heat vulnerability. The NYC heat vulnerability index (HVI) was used to determine the vulnerability of census blocks. The NYC HVI scores neighborhoods based on quintiles from 1 (lowest risk) to 5 (highest risk) derived from the statistical modeling of factors determined to be highly associated with mortality during and immediately following extreme heat events: average surface temperature, percent vegetation cover, percent of households reporting air conditioning access, the percent of residents reported as non-Hispanic/Latino and Black, and median household income (Interactive Heat Vulnerability Index, n.d.). Census blocks with a NYC HVI score of 1–3 were defined as low heat vulnerable, and census blocks with a NYC HVI score of 4–5 were defined as high heat vulnerable, representing environmental justice communities (Madrigano et al., 2015). Success was defined as a census block experiencing no to minimal cool roof degradation through the study period (average roof reflectivity ≥ 65), and failure was defined as a census block experiencing cool roof degradation (average roof reflectivity < 65). Descriptive study analyses were performed using StataNow/SE 19.5 and ArcGIS Pro 3.3.1 (copyright (c) 2024 Esri Inc.) licensed software.
Results
In 2014, 18,565 census blocks had an average cool roof reflectivity value ≥ 65 and were included in our sample. Of these census blocks, 10,719 were in low heat-vulnerable areas (57.74%) and 7,846 (42.26%) were in high heat-vulnerable areas.
Our descriptive cumulative degradation analysis is demonstrated in Figure 2. In total, 4,560 (24.56%) census blocks experienced degradation of average cool roof reflectivity by 2020. Low heat vulnerable areas (2,897, 27.03%) had a higher proportion of census blocks that experienced cool roof degradation than high heat vulnerable areas (1,663, 21.20%). Of the 4,560 census blocks that experienced degradation, 2,617 (57.39%) degraded between 2014 and 2016, 1,297 (28.44%) between 2016 and 2018, and 646 (14.17%) between 2018 and 2020. In low heat vulnerable areas, 1,722 (59.44%) census blocks experienced cool roof degradation between 2014 and 2016, 809 (27.93%) between 2016 and 2018, and 366 (12.63%) between 2018 and 2020. In high heat vulnerable areas, 895 (53.82%) census blocks experienced cool roof degradation between 2014 and 2016, 488 (29.34%) between 2016 and 2018, and 280 (16.84%) between 2018 and 2020. Figure 3 demonstrates the geographic distribution of cool roof degradation trends in census blocks included in our analysis across NYC. The geographic distribution of HVI scores for all included census blocks can be found in Supplementary Figure S1.
Figure 2
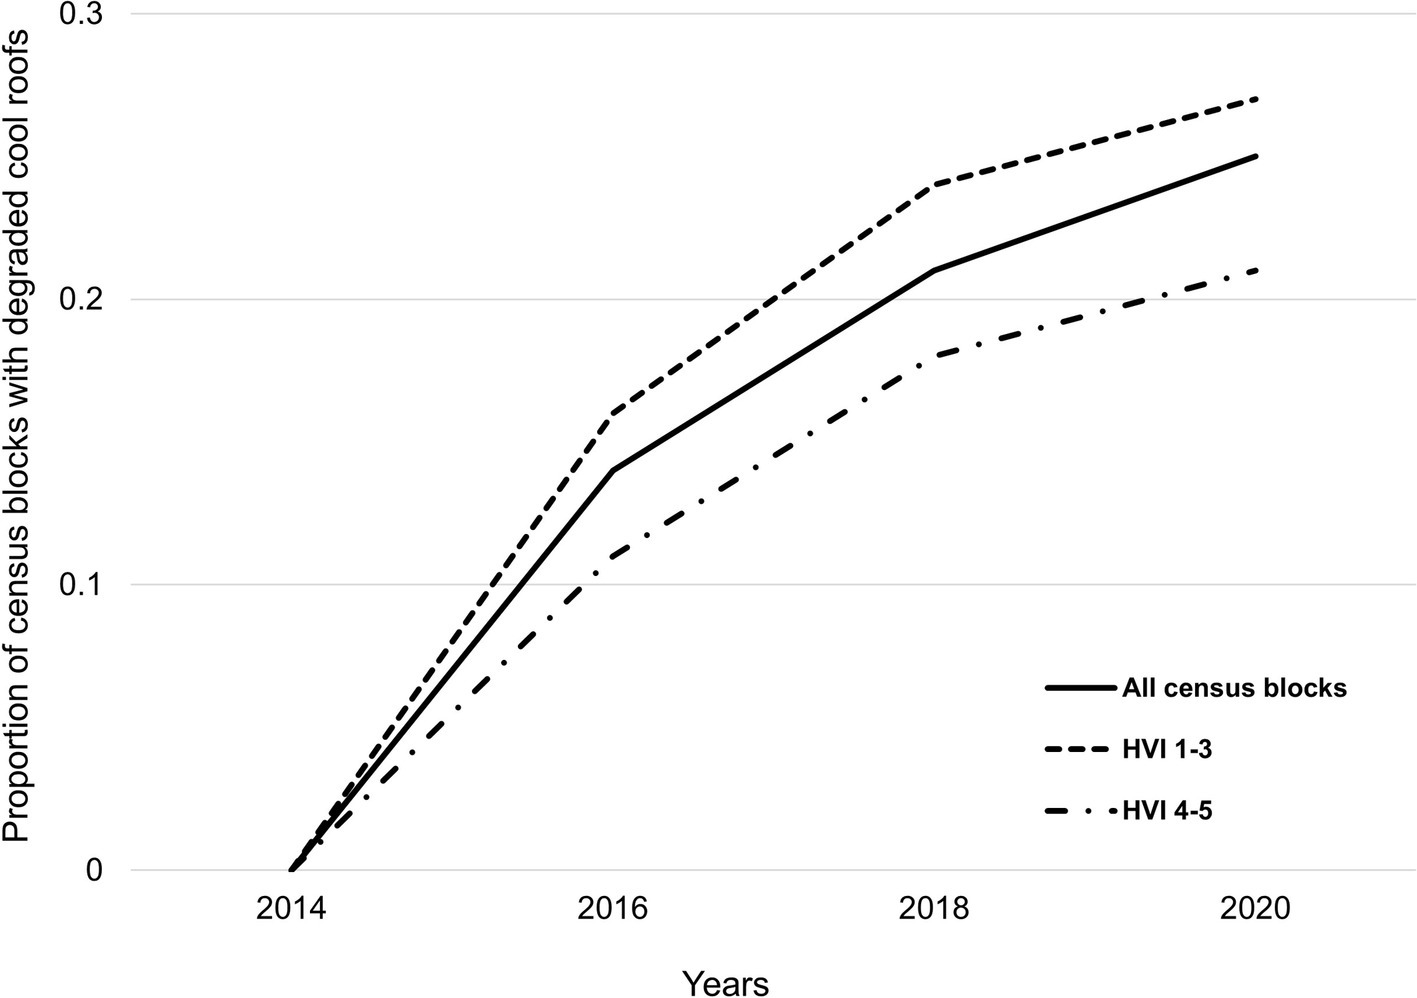
Temporal trends in the cumulative proportion of census blocks with degraded cool roofs across New York City and in low vs. high heat vulnerable areas. Areas with a New York City heat vulnerability index score of 1–3 were defined as low heat vulnerable, areas with a New York City heat vulnerability index score of 4–5 were defined as high heat vulnerable. Data sources: New York City Cool Roofs Dashboard, New York City Heat Vulnerability Index (NYC Cool Roofs Dashboard NEW, 2023; Cool Roofs in a Warm City, 2023; Interactive Heat Vulnerability Index, n.d.).
Figure 3
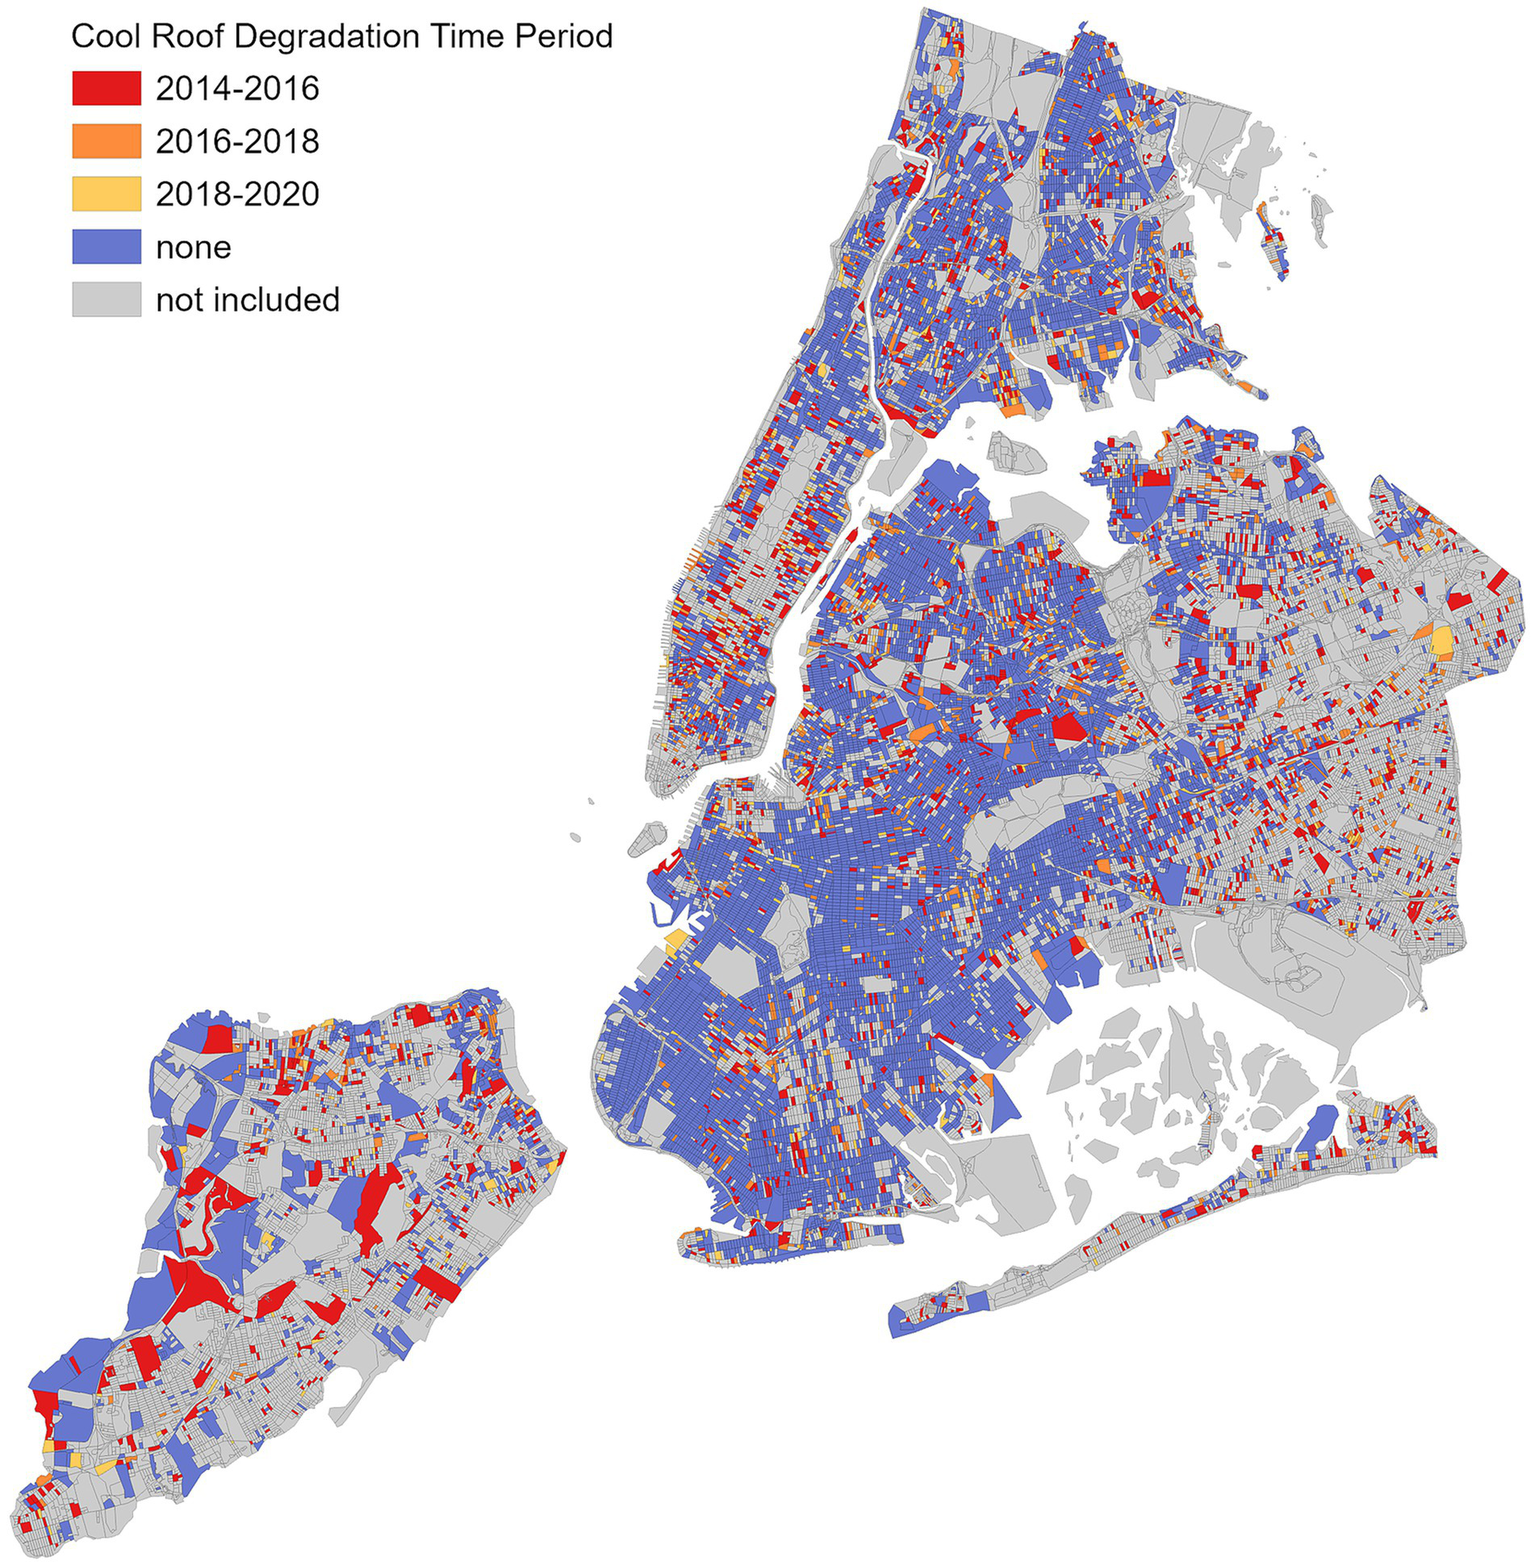
The geographic distribution of temporal cool roof degradation trends in included census blocks across New York City. Data sources: New York City Cool Roofs Dashboard (NYC Cool Roofs Dashboard NEW, 2023; Cool Roofs in a Warm City, 2023).
Discussion
Our study provides an intra-urban evaluation of time-dependent changes in the reflectivity of cool roofs, one of the most widely implemented UHI mitigation interventions in NYC. Overall, we found that approximately 25% of census blocks with sufficiently reflective cool roofs present in 2014 experienced degradation by 2020, with the majority of degradation occurring between 2014 and 2016. A larger proportion of census blocks experienced cool roof degradation in low compared to high-heat vulnerable areas. Our descriptive findings emphasize the need for future inferential examinations of potential multi-level drivers of cool roof degradation in NYC and other global cities. Moreover, our findings emphasize the importance of considering the dynamic nature of cool roof surface albedo in future experimental health outcome evaluations, and the importance of cool roof maintenance policies to optimize their reflective cooling potential.
Cool roofs have been shown to reduce near-surface ambient temperature by 1.5 °C and indoor temperature by 1.2 to 3.3 °C, especially for living quarters directly under the roof surface (Tan et al., 2023; US EPA O, 2014; Rawat and Singh, 2022). Cool roof surface reflectivity degradation, as defined in our analysis, and cooling effectiveness do not have an absolute, one-to-one relationship. However, if we assume the 25% decrease in cool roof reflectivity hypothetically represents a comparable decrease in cooling effectiveness (~2 °C to reflect a rough estimate of cool roof reductions in ambient and indoor temperature), then the roof surface degradation we observed could result in an overall loss of 0.5 °C cooling potential. Prior studies have demonstrated that population-level cardiovascular mortality rates can increase by as much as 6% for each 1 °C increase in ambient temperature above normal conditions (Kenny et al., 2024). Therefore, as a rough estimate, an overall 0.5 °C loss in cool roof reflective cooling effect could hypothetically result in a 3% increase in cardiovascular risk for NYC residents for each 1 °C increase in ambient temperature during an extreme heat event.
The spatiotemporal variability of cool roof albedo degradation observed in our study is an important consideration for geospatial evaluations of municipal cool roof implementation programs and policies. Our finding that the majority of degradation occurred within the first 2 years of our study period, 2014–2016, aligns with prior evidence that has demonstrated that a high degree of cool roof degradation can occur within the first few years after installation (Dominguez-Delgado et al., 2020). To our knowledge, there are no specific environmental or policy-related factors that may have residually confounded this observation. In this way, cool roofs are time-varying treatments, which may have dynamic impacts on heat-sensitive health conditions as a function of their surface albedo strength. Moreover, the spatial variability in degradation we observed emphasizes the need for future evaluations using inferential methods to comprehensively examine geographically patterned covariates as potential predictive drivers of disparate cool roof degradation (e.g., building age, proximity to vehicular traffic pollutants).
In NYC, professional ethylene-propylene-diene monomer (EPDM) and thermoplastic polyolefin (TPO) cool roof membrane materials have been shown to maintain high albedos for longer durations than cool roofs with retrofitted paint membranes (Gaffin et al., 2012). Due to a lack of available data, we were unable to consider the impact of the composition of different cool roof surface materials at the block-level in our analysis. This is an important limitation to highlight, as without cool roof material data, we are unable to discern if our observed degradation patterns are due to a lack of maintenance, environmental factors, or the block-level prevalence of less durable roofing materials.
Additionally, our measure of cool roof reflectivity is averaged at the census-block level and does not inherently represent building-level trends. Cool roof reflectivity values aggregated to census geographic boundaries allows for data joins required for epidemiological evaluations using administrative health datasets (e.g., rates of heat-related illness). However, doing so also introduces the risk of bias from ecological fallacy—inferring individual risk from area means. For example, the average cool roof degradation trends we observed within a census block may represent the outsized degradation of only a few roof surfaces. In this way, the degradation trends we observed cannot account for building-level reflectivity changes that are relevant to individual residents’ heat exposure and health risks.
The higher proportion of cool roof degradation observed in low compared to high-heat vulnerable neighborhoods across NYC is notable. One explanation may be that factors contributing to degradation, such as particulate buildup or limited maintenance, are less prevalent in environmental justice communities. For example, the Hope Program’s NYC Cool Roof initiative prioritizes high heat-vulnerable neighborhoods across NYC for cool roof installation, with such areas receiving 73% of the Program’s cool roof square footage installed in 2018 (NYC CoolRoofs - The HOPE Program, 2022; US EPA O, 2020). Such efforts may contribute to greater roof reflectivity resilience in these neighborhoods, although, to our knowledge, the Program does not publicly detail its roofing materials or a formal maintenance plan. Additionally, in NYC, ambient air pollutant concentrations are disproportionately higher in affluent, low-heat vulnerable communities in central and lower Manhattan due to higher concentrations of vehicular traffic and commercial cooking (NYC Community Air Survey Annual Report, 2023; Uong et al., 2023). The disproportionate exposure to surface-darkening particulates in such communities may be another explanation for our findings (Aggarwal and Molleti, 2024).
The NYC HVI was originally developed at the neighborhood tabulation area (NTA)-level. Because reliable data inputs (e.g., air conditioning access) were not available at the census-block level, we assigned block-level HVI scores by spatially linking census blocks to NTAs. This approach introduces the risk of spatial misclassification and bias due to the modifiable area unit problem. Such bias could erroneously link cool roof degradation trends to low NTA-level HVI scores, when in fact these trends may be occurring in census blocks with social and structural factors that represent higher levels of heat vulnerability. Future research is needed to comprehensively examine multi-level drivers of cool roof degradation by aligning the spatial granularity of related datasets, reducing the risk of such biases.
In NYC, several local laws have been passed to incentivize cool roof installation. In 2011, Local Law 21 required that all roofs being entirely replaced met cool roof surface albedo standards at the time of installation (Local Laws - Buildings, 2019). Local Laws 92 and 94, passed as part of the 2019 NYC Climate Mobilization Act, required that roofs being constructed or replaced be partially covered with a green roof or solar photovoltaic system, with the remaining roof surface area required to meet cool roof solar reflectivity requirements (Solar-Green-Roofs, 2019). These Laws, therefore, have advanced mandates for roof surface albedo to meet cool roof standards at roof installation and renovation stages. To our knowledge, however, these laws do not explicitly mandate the ongoing maintenance of cool roof albedo, raising questions about their long-term UHI mitigation and energy efficiency benefits. The evidence provided in this study could help municipal and community partners to advocate for albedo maintenance initiatives (e.g., building code upgrades, financial incentives for property owners, integrated urban sustainability initiatives) to ensure cool roofs sustain their beneficial effects, especially in regard to heat health and health equity. For example, the Los Angeles Department of Water and Power offers a rebate to property owners only for installed cool roofing materials known to be highly reflective 3-years after installation according to the LA Green Building Code (Consumer Rebate Program | Los Angeles Department of Water and Power, 2025). Though such a program indirectly incentivizes maintenance with the use of resilient cool roofing materials, it further highlights the dearth of municipal programs that directly sustain long-term cool roof reflectivity. Such maintenance initiatives, however, should consider the safety, scalability, and performance of new developments in resilient cool roofing materials, such as novel hydrophobic, silicone-based binders (Barber et al., 2025).
In addition to the aforementioned limitations of our study, the single-city nature of our analysis limits the generalizability of our findings to other urban environments with distinct urban climates and built environment characteristics.
Overall, our study demonstrates that cool roof degradation is prevalent in NYC with dynamic spatiotemporal trends. Without maintenance, the cooling effects of high albedo roof surfaces will decrease. Our findings provide a basis for future epidemiological research to leverage large-scale health datasets to advance understanding of the localized health effects of cool roofs in diverse urban and climatic settings, and evaluate how their material degradation properties may differentially pattern found health effects over time. As cool roof implementation programs grow in global cities to mitigate extreme urban heat, reflectivity maintenance initiatives must be incentivized to ensure the UHI mitigation potential of such programs is sustained. Future research should focus on performing comparative health outcome evaluations for municipal maintenance programs to determine which policy factors are essential to optimize longitudinal cool roof heat-health benefits.
Statements
Data availability statement
The raw data supporting the conclusions of this article will be made available by the authors, without undue reservation.
Author contributions
LB: Formal analysis, Investigation, Methodology, Software, Writing – original draft, Writing – review & editing. AB: Methodology, Supervision, Writing – review & editing. MH: Data curation, Formal analysis, Methodology, Software, Visualization, Writing – review & editing. AT: Formal analysis, Methodology, Writing – review & editing. HW: Conceptualization, Investigation, Methodology, Visualization, Writing – review & editing. OB: Conceptualization, Investigation, Resources, Writing – review & editing. WR: Formal analysis, Investigation, Writing – review & editing. AA: Conceptualization, Data curation, Formal analysis, Funding acquisition, Investigation, Methodology, Project administration, Resources, Software, Supervision, Validation, Visualization, Writing – original draft, Writing – review & editing.
Funding
The author(s) declare that financial support was received for the research and/or publication of this article. AA received support from the National Institute of Environmental Health Sciences (P2CES033423).
Conflict of interest
The authors declare that the research was conducted in the absence of any commercial or financial relationships that could be construed as a potential conflict of interest.
Generative AI statement
The authors declare that no Gen AI was used in the creation of this manuscript.
Any alternative text (alt text) provided alongside figures in this article has been generated by Frontiers with the support of artificial intelligence and reasonable efforts have been made to ensure accuracy, including review by the authors wherever possible. If you identify any issues, please contact us.
Publisher’s note
All claims expressed in this article are solely those of the authors and do not necessarily represent those of their affiliated organizations, or those of the publisher, the editors and the reviewers. Any product that may be evaluated in this article, or claim that may be made by its manufacturer, is not guaranteed or endorsed by the publisher.
Supplementary material
The Supplementary material for this article can be found online at: https://www.frontiersin.org/articles/10.3389/frsc.2025.1655812/full#supplementary-material
References
1
Aggarwal C. Molleti S. (2024). State-of-the-art review: effects of using cool building cladding materials on roofs. Buildings14:2257. doi: 10.3390/buildings14082257
2
Baniassadi A. Sailor D. J. Crank P. J. Ban-Weiss G. A. (2018). Direct and indirect effects of high-albedo roofs on energy consumption and thermal comfort of residential buildings. Energ. Buildings178, 71–83. doi: 10.1016/j.enbuild.2018.08.048
3
Ban-Weiss G. A. Woods J. Levinson R. (2015). Using remote sensing to quantify albedo of roofs in seven California cities, part 1: methods. Sol. Energy115, 777–790. doi: 10.1016/j.solener.2014.10.022
4
Barber E. Feng D. Fang Z. Carne D. Gonzalez O. G. R. Lee W. J. et al . (2025). Efficient, hydrophobic, and weather-resistant radiative cooling paints with silicone-based binders. ACS Appl. Opt. Mater.3, 1137–1144. doi: 10.1021/acsaom.5c00079
5
Benz S. A. Burney J. A. (2021). Widespread race and class disparities in surface urban heat extremes across the United States. Earths Future9:e2021EF002016. doi: 10.1029/2021EF002016
6
Bobb J. F. Obermeyer Z. Wang Y. Dominici F. (2014). Cause-specific risk of hospital admission related to extreme heat in older adults. JAMA312, 2659–2667. doi: 10.1001/jama.2014.15715
7
Bunker A. Compoaré G. Sewe M. O. Laurent J. G. C. Zabré P. Boudo V. et al . (2024). The effects of cool roofs on health, environmental, and economic outcomes in rural Africa: study protocol for a community-based cluster randomized controlled trial. Trials25:59. doi: 10.1186/s13063-023-07804-0
8
Chen J. Lu L. (2020). Development of radiative cooling and its integration with buildings: a comprehensive review. Sol. Energy212, 125–151. doi: 10.1016/j.solener.2020.10.013
9
Consumer Rebate Program | Los Angeles Department of Water and Power . (2025). Available online at: https://www.ladwp.com/residential-services/assistance-programs/consumer-rebate-program (Accessed August 24, 2025).
10
Cool Roofs in a Warm City . ArcGIS StoryMaps. (2023). Available online at: https://storymaps.arcgis.com/stories/0cdc24592f85480ebaa094037b47a767 (Accessed June 23, 2025).
11
Cool Roofs in a Warm City . ArcGIS StoryMaps. (2023). Available online at: https://storymaps.arcgis.com/stories/0cdc24592f85480ebaa094037b47a767 (Accessed August 29, 2025).
12
Dominguez-Delgado A. Domínguez-Torres H. Domínguez-Torres C. A. (2020). Energy and economic life cycle assessment of cool roofs applied to the refurbishment of social housing in southern Spain. Sustainability12:5602. doi: 10.3390/su12145602
13
Flohr T. Heris M. George R. Investigating New York City’s cool roof program implementation using remote sensing through an environmental justice Lens. Wichmann Verlag; (2023) (Accessed May 6, 2025).
14
Gaffin S. R. Imhoff M. Rosenzweig C. Khanbilvardi R. Pasqualini A. Kong A. Y. Y. et al . (2012). Bright is the new black—multi-year performance of high-albedo roofs in an urban climate. Environ. Res. Lett.7:014029. doi: 10.1088/1748-9326/7/1/014029
15
He C. He L. Zhang Y. Kinney P. L. Ma W. (2020). Potential impacts of cool and green roofs on temperature-related mortality in the greater Boston region. Environ. Res. Lett.15:094042. doi: 10.1088/1748-9326/aba4c9
16
Howard J. T. Androne N. Alcover K. C. Santos-Lozada A. R. (2024). Trends of heat-related deaths in the US, 1999-2023. JAMA332, 1203–1204. doi: 10.1001/jama.2024.16386
17
Hsu A. Sheriff G. Chakraborty T. Manya D. (2021). Disproportionate exposure to urban heat island intensity across major US cities. Nat. Commun.12:2721. doi: 10.1038/s41467-021-22799-5
18
Interactive Heat Vulnerability Index . Environment & Health Data Portal. Available online at: https://a816-dohbesp.nyc.gov/IndicatorPublic/data-features/hvi/ (Accessed June 23, 2025).
19
Kenny G. P. Tetzlaff E. J. Journeay W. S. Henderson S. B. O’Connor F. K. (2024). Indoor overheating: a review of vulnerabilities, causes, and strategies to prevent adverse human health outcomes during extreme heat events. Temperature (Austin)11, 203–246. doi: 10.1080/23328940.2024.2361223
20
Landsat Science Products | U.S. Geological Survey . (2023). Available online at: https://www.usgs.gov/landsat-missions/landsat-science-products (Accessed June 26, 2025).
21
LEED Certification. Cool Roof Rating Council . Available online at: https://coolroofs.org/resources/leed (Accessed August 22, 2025).
22
Li D. Bou-Zeid E. Oppenheimer M. (2014). The effectiveness of cool and green roofs as urban heat island mitigation strategies. Environ. Res. Lett.9:055002. doi: 10.1088/1748-9326/9/5/055002
23
Liang S. (2001). Narrowband to broadband conversions of land surface albedo I: algorithms. Remote Sens. Environ.76, 213–238. doi: 10.1016/S0034-4257(00)00205-4
24
Local Laws - Buildings . (2019). Available online at: https://www.nyc.gov/site/buildings/codes/local-laws.page (Accessed June 23, 2025).
25
Locke D. H. Hall B. Grove J. M. Pickett S. T. A. Ogden L. A. Aoki C. et al . (2021). Residential housing segregation and urban tree canopy in 37 US cities. npj Urban Sustain.1, 1–9. doi: 10.1038/s42949-021-00022-0
26
Longden T. (2025). Underestimating heat-related mortality—a comparison of excess mortality and death record studies for Australia. Lancet Reg. Health West. Pac.:58. doi: 10.1016/j.lanwpc.2025.101557
27
Lopez-Cabeza V. P. Alzate-Gaviria S. Diz-Mellado E. Rivera-Gomez C. Galan-Marin C. (2022). Albedo influence on the microclimate and thermal comfort of courtyards under Mediterranean hot summer climate conditions. Sustain. Cities Soc.81:103872. doi: 10.1016/j.scs.2022.103872
28
Lynch E. E. Malcoe L. H. Laurent S. E. Richardson J. Mitchell B. C. Meier H. C. S. (2021). The legacy of structural racism: associations between historic redlining, current mortgage lending, and health. SSM Populat. Health14:100793. doi: 10.1016/j.ssmph.2021.100793
29
Macintyre H. L. Heaviside C. (2019). Potential benefits of cool roofs in reducing heat-related mortality during heatwaves in a European city. Environ. Int.127, 430–441. doi: 10.1016/j.envint.2019.02.065
30
Madrigano J. Ito K. Johnson S. Kinney P. L. Matte T. (2015). A case-only study of vulnerability to heat wave–related mortality in New York City (2000–2011). Environ. Health Perspect.123, 672–678. doi: 10.1289/ehp.1408178
31
Madrigano J. Jack D. Anderson G. B. Bell M. L. Kinney P. L. (2015). Temperature, ozone, and mortality in urban and non-urban counties in the northeastern United States. Environ. Health14:3. doi: 10.1186/1476-069X-14-3
32
Milletich S. Manrique A. Karsan S. Spikes T. Nanavanti A. Bailey J. et al . (2025). Historical redlining and community-reported housing quality: a spatial analysis. J. Urban Health102, 49–60. doi: 10.1007/s11524-024-00935-y
33
NYC Community Air Survey Annual Report . Environment & Health Data Portal. (2023). Available online at: https://a816-dohbesp.nyc.gov/IndicatorPublic/data-features/nyccas/ (Accessed August 24, 2025).
34
NYC Cool Roofs Dashboard NEW . Available online at: https://www.arcgis.com/apps/dashboards/f5f1406830e741daab2c015ae6b4c33c (Accessed May 6, 2025).
35
NYC CoolRoofs - The HOPE Program . (2022). Available online at: https://www.thehopeprogram.org/nyc-coolroofs/ (Accessed June 23, 2025).
36
Orthoimagery. gis . Available online at: https://gis.ny.gov/orthoimagery (Accessed June 26, 2025).
37
Park J. Park S. Kang J. (2024). Detecting and classifying rooftops with a CNN-based remote-sensing method for urban area cool roof application. Energy Rep.11, 2516–2525. doi: 10.1016/j.egyr.2024.02.001
38
Rawat M. Singh R. N. (2022). A study on the comparative review of cool roof thermal performance in various regions. Energy Built Environ.3, 327–347. doi: 10.1016/j.enbenv.2021.03.001
39
Salata F. Golasi I. Vollaro A. d. L. Vollaro R. d. L. (2015). How high albedo and traditional buildings’ materials and vegetation affect the quality of urban microclimate. A case study. Energ. Buildings99, 32–49. doi: 10.1016/j.enbuild.2015.04.010
40
Simpson C. H. Brousse O. Taylor T. Grellier J. Taylor J. Fleming L. E. et al . (2024). Modeled temperature, mortality impact and external benefits of cool roofs and rooftop photovoltaics in London. Nat. Cities1, 751–759. doi: 10.1038/s44284-024-00138-1
41
Solar-Green-Roofs . (2019). Available online at: https://www.nyc.gov/site/buildings/codes/ll92-solar-green-roofs.page (Accessed June 23, 2025).
42
Song C. Chen Y. (2025). Energy-saving potential of cool roofs at the urban scale: a case study of Xiamen city. Energ. Buildings344:116034. doi: 10.1016/j.enbuild.2025.116034
43
South E. C. Hohl B. C. Kondo M. C. MacDonald J. M. Branas C. C. (2018). Effect of greening vacant land on mental health of community-dwelling adults: a cluster randomized trial. JAMA Netw. Open1:e180298. doi: 10.1001/jamanetworkopen.2018.0298
44
South E. C. MacDonald J. Reina V. (2021). Association between structural housing repairs for low-income homeowners and Neighborhood crime. JAMA Netw. Open4:e2117067. doi: 10.1001/jamanetworkopen.2021.17067
45
Swope C. Markley S. Whittaker S. Hillier A. (2025). How and why does redlining matter for present-day health? Critical perspectives on causality, cartography, and capitalism. Am. J. Public Health115, 769–779. doi: 10.2105/AJPH.2024.308000
46
Tan H. Kotamarthi R. Wang J. Qian Y. Chakraborty T. C. (2023). Impact of different roofing mitigation strategies on near-surface temperature and energy consumption over the Chicago metropolitan area during a heatwave event. Sci. Total Environ.860:160508. doi: 10.1016/j.scitotenv.2022.160508
47
Titus A. R. Benmarhnia T. Thorpe L. E. (2025). Linking “big” geospatial and health data: implications for research in environmental epidemiology. Environ. Health Perspect. doi: 10.1289/EHP15756
48
Treglia M. L. McPhearson T. Sanderson E. W. Yetman G. Maxwell E. N. (2022). Examining the distribution of green roofs in new York City through a lens of social, ecological, and technological filters. Ecol. Soc.27:20. doi: 10.5751/ES-13303-270320
49
Uong S. P. Zhou J. Lovinsky-Desir S. Albrecht S. S. Azan A. Chambers E. C. et al . (2023). The creation of a multidomain Neighborhood environmental vulnerability index across New York City. J. Urban Health100, 1007–1023. doi: 10.1007/s11524-023-00766-3
50
US EPA O . (2014). Using cool roofs to reduce heat islands. Available online at: https://www.epa.gov/heatislands/using-cool-roofs-reduce-heat-islands (Accessed June 23, 2025).
51
US EPA O . Local Heat Equity Examples. US EPA. (2020). Available online at: https://19january2021snapshot.epa.gov/heatislands/local-heat-equity-examples (Accessed August 24, 2025).
52
Vaidyanathan A. (2020). Heat-related deaths — United States, 2004–2018. MMWR Morb. Mortal Wkly. Rep.69, 729–734. doi: 10.15585/mmwr.mm6924a1
53
Wang X. Liu G. Zhang N. Liu H. Tang X. Lyu M. et al . (2023). Effects of cooling roofs on mitigating the urban heat island and human thermal stress in the Pearl River Delta, China. Build. Environ.245:110880. doi: 10.1016/j.buildenv.2023.110880
54
Yi S. Li X. Liu Y. Dong X. Tu W. (2025). A sub-meter resolution urban surface albedo dataset for 34 U.S. cities based on deep learning. Sci Data12:789. doi: 10.1038/s41597-025-05109-2
55
Yi S. Li X. Ma C. Wang R. Zhou Y. Xu Q. et al . (2025). Assessing the differential impact of vegetated and built-up areas on heat exposure environment: a case study of Los Angeles. Build. Environ.271:112538. doi: 10.1016/j.buildenv.2025.112538
Summary
Keywords
cool roofs, urban heat island mitigation, heat health, urban health, climate mitigation and adaptation, extreme heat, urban built environment
Citation
Bonanni L, Bershteyn A, Heris MP, Titus A, Wei H, Babayode O, Rom W and Azan A (2025) Trends in cool roof solar reflectivity degradation in New York City (2014–2020): an important consideration for health-based evaluations of high albedo urban roofing interventions. Front. Sustain. Cities 7:1655812. doi: 10.3389/frsc.2025.1655812
Received
03 July 2025
Accepted
16 September 2025
Published
02 October 2025
Volume
7 - 2025
Edited by
Lip Huat Saw, Tunku Abdul Rahman University, Malaysia
Reviewed by
Shengao Yi, University of Pennsylvania, United states
Meng Yang, Yangzhou University, China
Updates
Copyright
© 2025 Bonanni, Bershteyn, Heris, Titus, Wei, Babayode, Rom and Azan.
This is an open-access article distributed under the terms of the Creative Commons Attribution License (CC BY). The use, distribution or reproduction in other forums is permitted, provided the original author(s) and the copyright owner(s) are credited and that the original publication in this journal is cited, in accordance with accepted academic practice. No use, distribution or reproduction is permitted which does not comply with these terms.
*Correspondence: Alexander Azan, alexander.azan@nyulangone.org
Disclaimer
All claims expressed in this article are solely those of the authors and do not necessarily represent those of their affiliated organizations, or those of the publisher, the editors and the reviewers. Any product that may be evaluated in this article or claim that may be made by its manufacturer is not guaranteed or endorsed by the publisher.