Abstract
Rapid urbanization and climate change pose significant challenges to achieving sustainable and climate-adaptive urban development. This study develops an integrated evaluation framework that combines multi-indicator assessment, network analysis, and simulation to examine urban spatial typologies and identify optimization strategies. Applied to the city of Aachen, Germany, the framework reveals how key indicators such as energy use intensity, thermal comfort, and building density shape the trade-offs between environmental performance and spatial efficiency. Network analysis highlights leverage points where targeted interventions can generate cascading benefits across multiple domains, while simulation quantifies the impacts of alternative design strategies. The results show that compact typologies achieve higher spatial efficiency but often compromise daylight and thermal comfort, whereas open typologies perform better environmentally but underutilize land capacity. A hybrid typology demonstrates a more balanced performance, suggesting pathways for reconciling density with comfort and efficiency. Beyond technical outcomes, the study underscores the role of urban design as a governance mechanism: by embedding cross-sectoral performance requirements into the design process, it can enhance coordination, reduce institutional fragmentation, and support more coherent climate governance. The findings provide planners with actionable insights and methodological tools to balance multiple objectives and advance climate resilience in diverse urban contexts.
1 Introduction
Amid rapid urbanization and escalating climate risks, cities face mounting pressure to reconcile development imperatives with environmental constraints. This challenge highlights the imperative for climate-adaptive design strategies that optimize spatial configurations while advancing resilience goals across environmental and social dimensions (Jia et al., 2023; Brandsma et al., 2024). By integrating scientific knowledge and technological innovation, climate-adaptive design enhances energy efficiency, spatial comfort, and ecological performance (Jia et al., 2023), serving as a critical enabler of urban resilience.
Empirical studies demonstrate that spatial configurations, such as optimized building layouts, vegetated corridors, and well-distributed green infrastructure, can mitigate urban heat island (UHI) effects, reduce energy demand, and enhance outdoor thermal comfort (Santamouris, 2015; Emmanuel, 2012). Morphological indicators including sky view factor (SVF), building height ratios, and street canyon proportions have been shown to shape microclimatic conditions at the pedestrian level (Johansson and Emmanuel, 2006). Tools such as the Universal Thermal Climate Index (UTCI) provide actionable metrics to inform design decisions under variable environmental conditions (Bröde et al., 2012).
In parallel, recent reviews have synthesized climate-related urban indicators into structured frameworks. For instance, Patel et al. (2025) provides a comprehensive assessment of urban climate adaptation indicators with a focus on heat- and water-sensitive development, highlighting their role in operationalizing resilience measurement. Similarly, Pierce et al. (2024) introduce the Urban Nature Indexes (UNI) as a multi-dimensional framework that links ecological performance, resource use, and governance responses.
Nevertheless, while recent reviews have advanced the development of structured indicator frameworks, most applied approaches remain fragmented in practice, often addressing specific technical aspects independently rather than operationalizing indicators within an integrated framework for design and planning. Few efforts have succeeded in integrating diverse indicators into a coherent and coherent approach that can guide early-stage design processes (Mauree et al., 2019; Battiston and Schifanella, 2024; Jia et al., 2024). Without a structured, user-oriented methodology, designers and planners struggle to reconcile multiple objectives and often overlook performance trade-offs essential to long-term resilience (Meerow et al., 2016; Meerow et al., 2019).
Crucially, climate resilience in urban contexts is not merely a function of design outcomes, but also of the governance systems that shape how design is conceived, coordinated, and implemented (Coaffee et al., 2018). Recent studies highlights persistent barriers including institutional fragmentation, siloed responsibilities, and the misalignment between climate adaptation goals and practices (Yang and Heinzel, 2024; Chelleri et al., 2015b; Chelleri, 2012). In this context, urban design is increasingly recognized not just as a technical intervention but also as a governance mechanism that translates abstract policy goals into spatially grounded, performance-driven actions (Shi et al., 2017; Shi et al., 2021). By embedding cross-sectoral performance requirements into the design process, urban design can serve as a platform for aligning diverse actors across planning, infrastructure, and environmental domains (Munonye and Ajonye, 2025; Kempenaar et al., 2025). It becomes a medium through which coordination is operationalized, accountability is reinforced, and resilience ambitions are made spatially explicit.
This governance dimension is particularly critical in cities like Aachen, which has set an ambitious target of becoming climate-neutral by 2030. Achieving such goals requires not only innovative spatial solutions, but also institutional frameworks that support cross-departmental integration and performance-based implementation. In this context, climate-adaptive urban design must address both technical and governance challenges simultaneously.
To address these challenges, this study focuses on the following key aspects:
-
Development of an integrated evaluation framework that combines spatial typology analysis, network-based indicator assessment, and simulation-supported performance quantification, enabling a comprehensive understanding of climate-adaptive urban form.
-
Application of the framework to the city of Aachen, in order to examine how performance-driven spatial optimization can inform adaptive planning strategies under different environmental scenarios.
-
Investigation of the governance potential of urban design, with particular attention to how embedding cross-sectoral performance criteria in design processes can enhance coordination and enable more effective climate policy implementation.
2 Materials and methods
2.1 Development of the evaluation system and selection of key indicators
A foundational element of the proposed framework is the use of robust spatial and environmental indicators. These indicators not only measure technical performance but also function as boundary objects, facilitating integration across architecture, urban planning, transportation, and environmental governance. From a governance perspective, indicators serve as interfaces within institutional structures, linking analytical evaluation with policy implementation.
A set of 33 indicators was identified through a combined process of targeted literature review, expert consultation with professional urban planners, and iterative discussions within the research team. These indicators cover multiple spatial scales and governance dimensions, as detailed in Table 1. Supplementary notes on the indicators are provided in the Appendix.
Table 1
| Name | Short description | Governance/Institutional domain | References |
|---|---|---|---|
| Ceiling height | Vertical distance from floor to ceiling | Building regulations, indoor comfort standards | Guimarães et al. (2013) and Steemers (2003) |
| Floor area | Total usable interior space | Building design, housing policy | Guimarães et al. (2013) and Steemers (2003) |
| Sunshine duration (indoor) | Time sunlight directly enters interior spaces | Building design, energy codes | Shao (1990) and Compagnon (2004) |
| Solar radiation (indoor) | Amount of solar energy entering through openings | Energy efficiency, façade design | Compagnon (2004) and Fernández-Ahumada et al. (2019) |
| Predicted Mean Vote (PMV, indoor) | ISO-standard thermal scale from cold to hot for indoor comfort | Thermal comfort standards, building codes | ISO (2005) and Fanger (1970) |
| Number of floors | Total count of levels in a building | Building regulations, density control | Steemers (2003) and Filogamo et al. (2014) |
| Building height | Vertical distance from ground to highest point | Zoning, skyline management | Ratti et al. (2005) |
| Gross floor area | Total floor space in a building | Urban planning, real estate policy | Steemers (2003) |
| Energy consumption | Total energy used by a building/system | Energy policy, climate mitigation | Pérez-Lombard et al. (2008) |
| Building shape factor | Ratio of building envelope area to volume | Energy efficiency, passive design | Ratti et al. (2005) and Danielski et al. (2012) |
| Window-to-floor area ratio | Ratio of window area to floor area | Daylight regulations, indoor comfort | Nguyen and Korkina (2021) and Tregenza and Wilson (2011) |
| Solar collectors’ performance | Energy/heat generated by solar systems | Renewable energy policy | Nasir et al. (2017) and Duffie and Beckman (2013) |
| Street canyon aspect ratio | Average building height to street width | Urban morphology, ventilation planning | Schoetter et al. (2013) and Oke (1988) |
| Space syntax connectivity | Number of directly connected spaces | Urban design, accessibility | Al-Sayed et al. (2014) and Hillier and Hanson (1989) |
| Space syntax integration | Accessibility of a space within the system | Mobility planning, social inclusion | Al-Sayed et al. (2014) and Hillier and Hanson (1989) |
| Sky view factor | Degree of visible sky from urban canyons | Urban climate, heat island mitigation | Oke (1988) and Gong et al. (2018) |
| Street density | Total street length per land area | Transport planning, mobility networks | Handy (1996) and Ewing and Cervero (2010) |
| Tree view factor | Degree of visible tree coverage | Urban greening policy, climate adaptation | Oke (1988) and Gong et al. (2018) |
| Building view factor | Degree of visible built mass in urban canyons | Urban morphology, microclimate | Oke (1988) and Gong et al. (2018) |
| Universal Thermal Climate Index (UTCI) | Outdoor thermal comfort index | Climate adaptation policy, health standards | Bröde et al. (2012) and Jendritzky et al. (2012) |
| Sunshine duration (outdoor) | Total outdoor sunlight time | Environmental planning, public health | Shao (1990) |
| Solar radiation (outdoor) | Energy received from the sun | Climate-responsive design | Chang and Zhang (2020) and Santamouris (2014) |
| Floor area ratio | Ratio of total floor area to land parcel | Land use regulation, zoning policy | |
| Building density | Ratio of footprint area to land area | Land use efficiency, planning policy | |
| Block density | Number of blocks per land area | Urban morphology, transport planning | Ewing and Cervero (2010) and Cervero and Kockelman (1997) |
| Block length | Length of the longest block edge | Urban design, walkability | Ewing and Cervero (2010) and Handy et al. (2003) |
| Lot size | Parcel dimensions (width, length, area) | Land development, property regulation | Song and Knaap (2007) |
| Greenery percentage | Proportion of green space on land | Environmental policy, ecosystem services | Li et al. (2016) |
| Green plot ratio | Average LAI of greenery on site | Green infrastructure, ecological planning | Ong (2003) |
| Accessibility index | Ease of accessing retail from residences | Transport policy, land use planning | Song and Knaap (2004) |
| Walk/Transit/Bike score | Walkability, transit, cycling accessibility | Mobility policy, healthy cities | Hall and Ram (2018) |
| Land use mix | Diversity of land uses in area | Zoning, urban planning policy | Frank and Pivo (1994) |
| Energy use intensity (EUI) | Energy use per unit area | Building energy codes, sustainability policy | Pérez-Lombard et al. (2008) and Ma and Cheng (2016) |
Selected indicators for urban design evaluation.
To address the multidimensional character of climate-adaptive design, the evaluation system incorporates diverse quantitative methods that capture development intensity, energy efficiency, and human comfort simultaneously (Jia et al., 2024; Linhares de Siqueira, 2015). These dimensions are inherently interdependent and often involve trade-offs; for example, measures that improve thermal comfort may raise energy demand. The framework therefore emphasizes strategies that balance objectives across domains rather than privileging one at the expense of another.
To represent these interdependencies explicitly, the study employs a network-based analytical approach. This enables the examination of not only direct relationships among indicators but also their systemic significance within the broader urban performance structure. Centrality analysis, and specifically eigenvector centrality, is applied to identify the most influential indicators. This metric highlights nodes that are both highly connected and structurally embedded, indicating leverage points whose optimization may trigger cascading benefits across multiple domains (Bonacich, 2007). The details of the network construction and the computational results of the centrality analysis are presented in the Appendix.
Figure 1 visualizes the composite network that integrates the three types of indicator relationships, positive, negative, and seasonal correlations. The network was generated using Gephi, with node colors denoting the four thematic categories of indicators and edge colors representing the types of correlations.
Figure 1
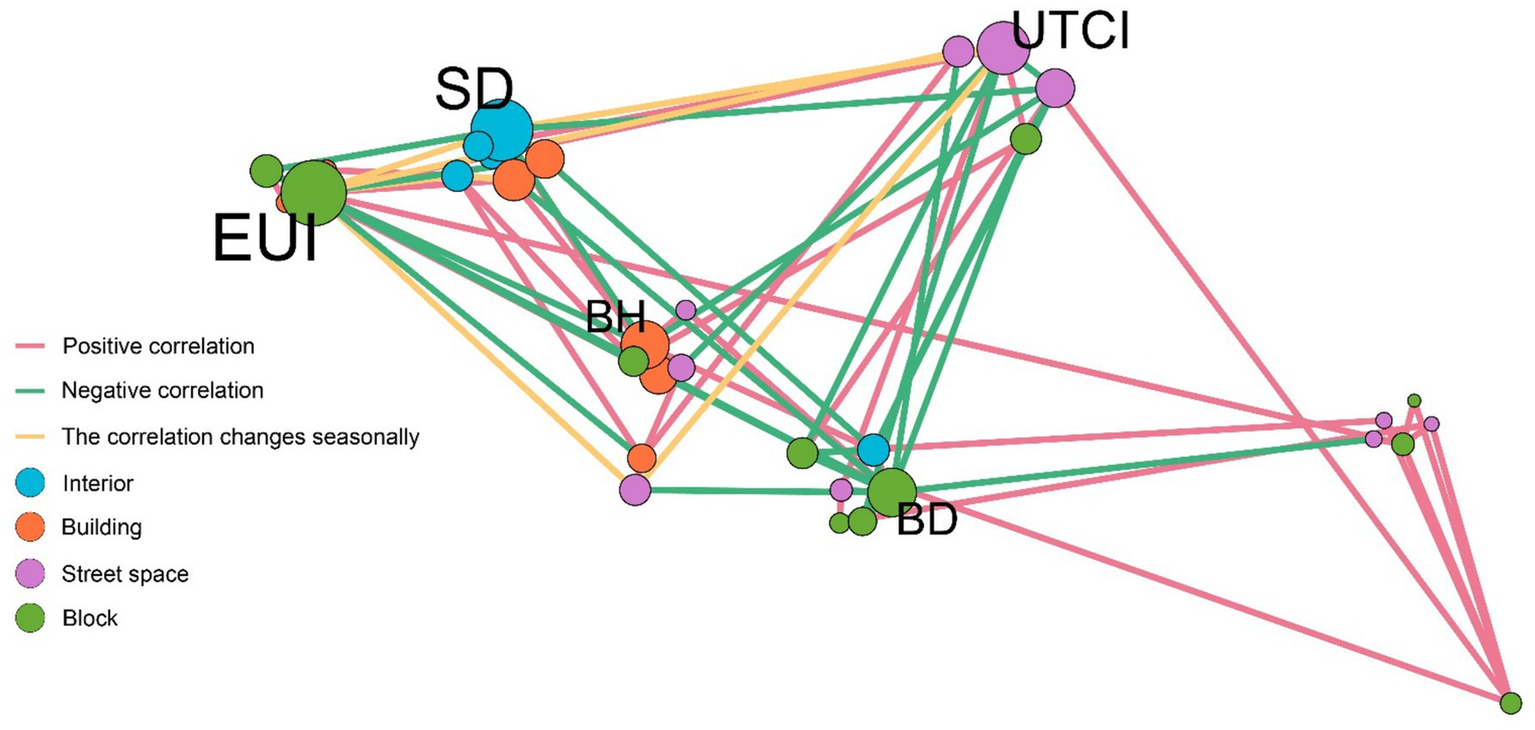
Network analysis of urban design indicators for climate adaptation.
The layout is based on the OpenOrd algorithm, which, although primarily designed for large-scale networks, offers useful clustering capabilities that enhance the interpretability of inter-indicator relationships. This visualization facilitates the identification of structurally significant indicators, highlights the density of their interconnections, and supports the translation of complex system dynamics into accessible insights for interdisciplinary audiences.
The analysis identified five indicators, energy use intensity (EUI), sunshine duration (SD), UTCI, building height (BH), and building density (BD), as the most structurally significant within the network. These indicators demonstrated high levels of interconnectivity and collectively represent the core dimensions of climate-adaptive urban performance, namely energy efficiency, environmental responsiveness, and spatial development intensity.
By narrowing the evaluative focus to these five metrics, the framework achieves a balance between analytical rigor and operational simplicity. The resulting indicator set offers a streamlined yet robust basis for assessing urban spatial performance, while also serving as a shared reference for facilitating cross-sectoral planning coordination.
2.2 Simulation method and workflow
To operationalize the evaluation system, this study employed an integrated simulation framework built upon the Rhinoceros and Grasshopper environment, with the Ladybug plugin serving as the core tool for environmental analysis (Roudsari and Pak, 2013). Grasshopper enables precise parametric modeling of urban form, providing the structural foundation for spatial design experimentation. In parallel, Ladybug facilitates climate-responsive analysis, linking seamlessly with OpenStudio and EnergyPlus to conduct detailed simulations of energy consumption and thermal performance.
A key strength of this framework lies in its multi-platform integration, which allows for a holistic and iterative assessment of urban design scenarios. For instance, OpenStudio and EnergyPlus are used to estimate EUI by combining localized weather data, geometric parameters, and usage profiles. Concurrently, Ladybug supports the calculation of solar hours and the UTCI by incorporating spatial and climatic variables. Together, these tools enable real-time feedback loops in the design process, allowing planners to adjust spatial configurations in response to performance insights.
By embedding this simulation suite within the broader indicator-based framework, the methodology bridges the gap between design experimentation and policy-relevant evaluation. It offers a versatile, scalable, and context-sensitive approach to support climate-adaptive urban design and cross-sectoral coordination.
To ensure transparency and methodological rigor, Table 2 summarizes the specific simulation platforms, calculation methods, and measurement units used for each of the five selected indicators. These indicators, identified through network analysis as central to climate-adaptive urban performance, were further operationalized through detailed simulation procedures.
Table 2
| Name | Rhinoceros | Grasshopper | Ladybug | OpenStudio | EnergyPlus | Calculation method | Unit |
|---|---|---|---|---|---|---|---|
| EUI | √ | √ | √ | √ | √ | kWh/m2/year | |
| SD | √ | √ | √ | √ | Average number of hours (1 year) during which the illuminance of natural light can reach 500 lux | h | |
| UTCI | √ | √ | √ | √ | The percentage of UTCI values between −13 and +26 in a year | % | |
| BH | √ | √ | Average height of the buildings | m | |||
| BD | √ | √ | % |
Simulation methods for key indicators.
The simulations draw upon the following data sources:
-
Meteorological data: DÜSSELDORF-104000-IWEC
-
Building 3D model data: 3D city model of the city of Aachen (LoD2)
-
Building plans and road data: OpenStreetMap (OSM)
This configuration ensures that all simulations reflect realistic local conditions and spatial configurations, supporting accurate and context-sensitive assessment of each performance indicator.
2.3 Typical urban typologies in Aachen, Germany
The quantification and classification of existing urban forms provide a critical foundation for climate-adaptive design, offering planners a basis for evaluating current spatial performance and developing targeted interventions. In urban typology theory, two primary approaches to typological analysis are widely recognized: process typology and architectural typology. Process typology, articulated by Sylvain Malfroy and Gianfranco Caniggia, emphasizes the sequential logic and evolutionary dynamics that shape urban development (Malfroy and Caniggia, 2021). In contrast, architectural typology, introduced by Aldo Rossi, conceptualizes typologies as the fundamental and persistent elements of urban form, highlighting their structural consistency and functional significance across time (Rossi, 1984).
To bridge the generative and morphological perspectives of these two traditions, this study adopts Ratti and Martin’s six general urban forms as a conceptual framework (Ratti et al., 2003). This typology has been widely applied in environmental performance simulations and provides a basis for systematic comparison (Ratti et al., 2003). In parallel, our classification approach is informed by the methodology developed by the ENUR Institute (Hamedinger and Dumke, 2013), which supports a context-specific interpretation of urban morphology tailored to the conditions of the Aachen region.
The resulting typology system identifies five representative urban forms, each reflecting different spatial logics and degrees of compactness, porosity, and building arrangement. These five categories, named according to Ratti’s nomenclature, were derived from actual urban blocks in Aachen, with each selected site covering 9 hectares to ensure comparable spatial scale (Figure 2).
Figure 2
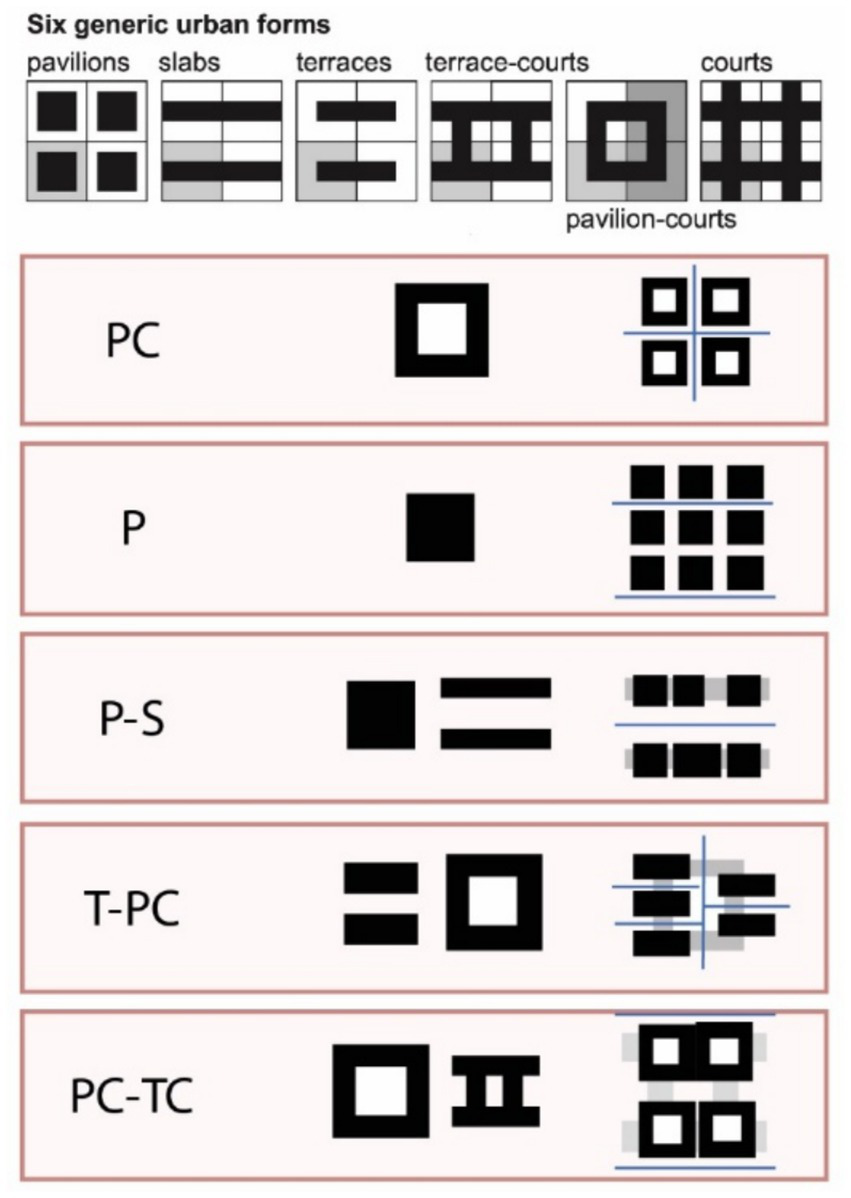
Urban typology analysis.
This classification also integrates a dual-scale analytical approach, encompassing both macroscopic and microscopic morphological characteristics. For example, the PC (Pavilion-court) type exhibits a consistent pavilion-based layout at both scales, resulting in a compact and regular structure. In contrast, the P-S (Pavilion-Slabs) type features small-scale pavilion units that, when aggregated, form larger slab-like configurations, demonstrating how micro-level forms influence larger spatial patterns. This multi-scalar reading allows for a more nuanced understanding of typological dynamics and their implications for environmental performance.
Aachen’s spatial structure reflects a historically layered and functionally diverse urban development. From the compact medieval core to post-war suburban expansions and recent peri-urban developments, the city exhibits a variety of spatial forms shaped by both topography and policy. In particular, ongoing urban expansion in areas such as Melaten illustrates current planning challenges, including the integration of new development with existing infrastructure and the pressure to balance growth with climate-neutrality goals. These real-world dynamics underscore the rationale for selecting Aachen as the case study: its spatial diversity and current planning ambitions provide a relevant context to explore how urban design can function as a climate-adaptive governance mechanism.
The typology samples selected in this study represent a cross-section of Aachen’s built environment, ranging from peripheral settlements such as Orsbach to high-density student residential areas near the city center (Figure 3). This diversity allows the framework to be tested across a range of spatial conditions, ensuring that the optimization strategies derived from simulation are both context-sensitive and practically relevant for cities pursuing integrated climate and spatial policy goals.
Figure 3
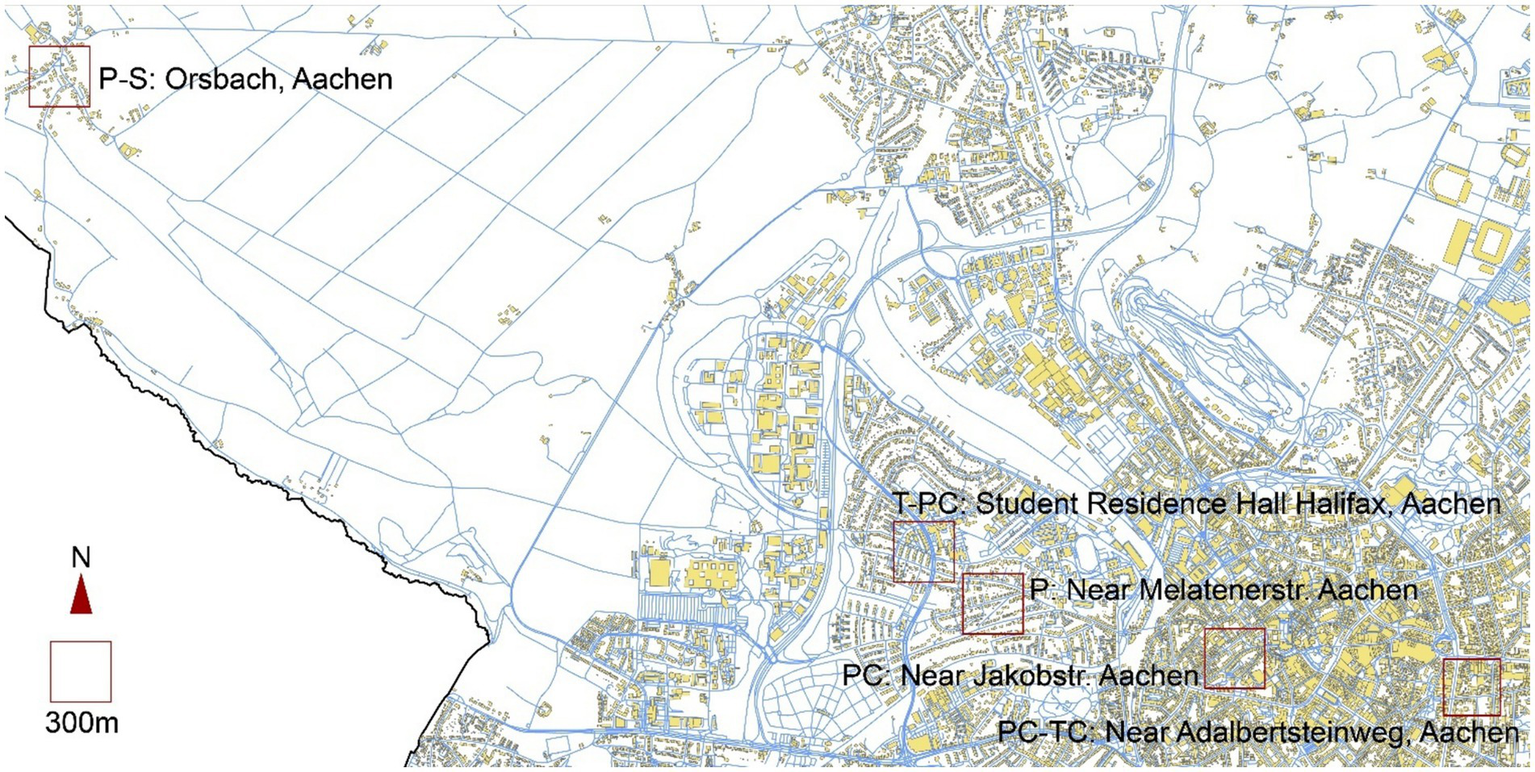
Location of typical urban typology samples in Aachen.
3 Results
3.1 Five core metrics linking urban morphology and climate adaptation
This study identifies five core indicators (EUI, SD, UTCI, BH, BD) as the foundation for evaluating climate-adaptive urban form. These indicators correspond to three essential dimensions in spatial planning: energy efficiency, environmental comfort, and development intensity. Together, they form a concise yet multidimensional framework that combines analytical clarity with practical relevance.
EUI reflects the relationship between building design and energy consumption. It is widely recognized in environmental assessment systems and energy codes, offering a measurable basis for evaluating design outcomes and informing regulatory standards. Its application allows planners to identify areas with excessive energy demand and to develop context-sensitive responses that improve energy performance across different urban zones.
SD and UTCI together provide insight into the environmental quality of urban spaces. While SD focuses on natural daylight access within buildings, UTCI captures outdoor thermal comfort conditions based on local climate and urban form. These indicators inform decisions related to building orientation, open space distribution, and vegetation planning. Their integration into spatial strategies strengthens the connection between physical design and public health, helping to anticipate the impact of urban form on everyday comfort and wellbeing.
BH and BD are long-standing parameters in planning systems. They influence urban forms at both the block and district levels and play a key role in shaping land use patterns, infrastructure capacity, and environmental exposure. When used in isolation, these indicators often serve static regulatory purposes. However, when assessed in combination with performance-based indicators like EUI and UTCI, they support a more adaptive approach to development control. This approach can better address trade-offs between compactness, livability, and environmental quality.
Beyond their technical value, these five indicators also function as governance tools. They provide a shared reference point for coordination among multiple sectors, including urban planning, environmental management, and infrastructure provision. By translating complex spatial and environmental processes into interpretable metrics, they enhance the transparency of planning decisions and promote more integrated, responsive policy implementation.
3.2 Energy use intensity
Figure 4 presents the EUI results of the five typologies, including the monthly distribution by end use and the annual totals.
Figure 4
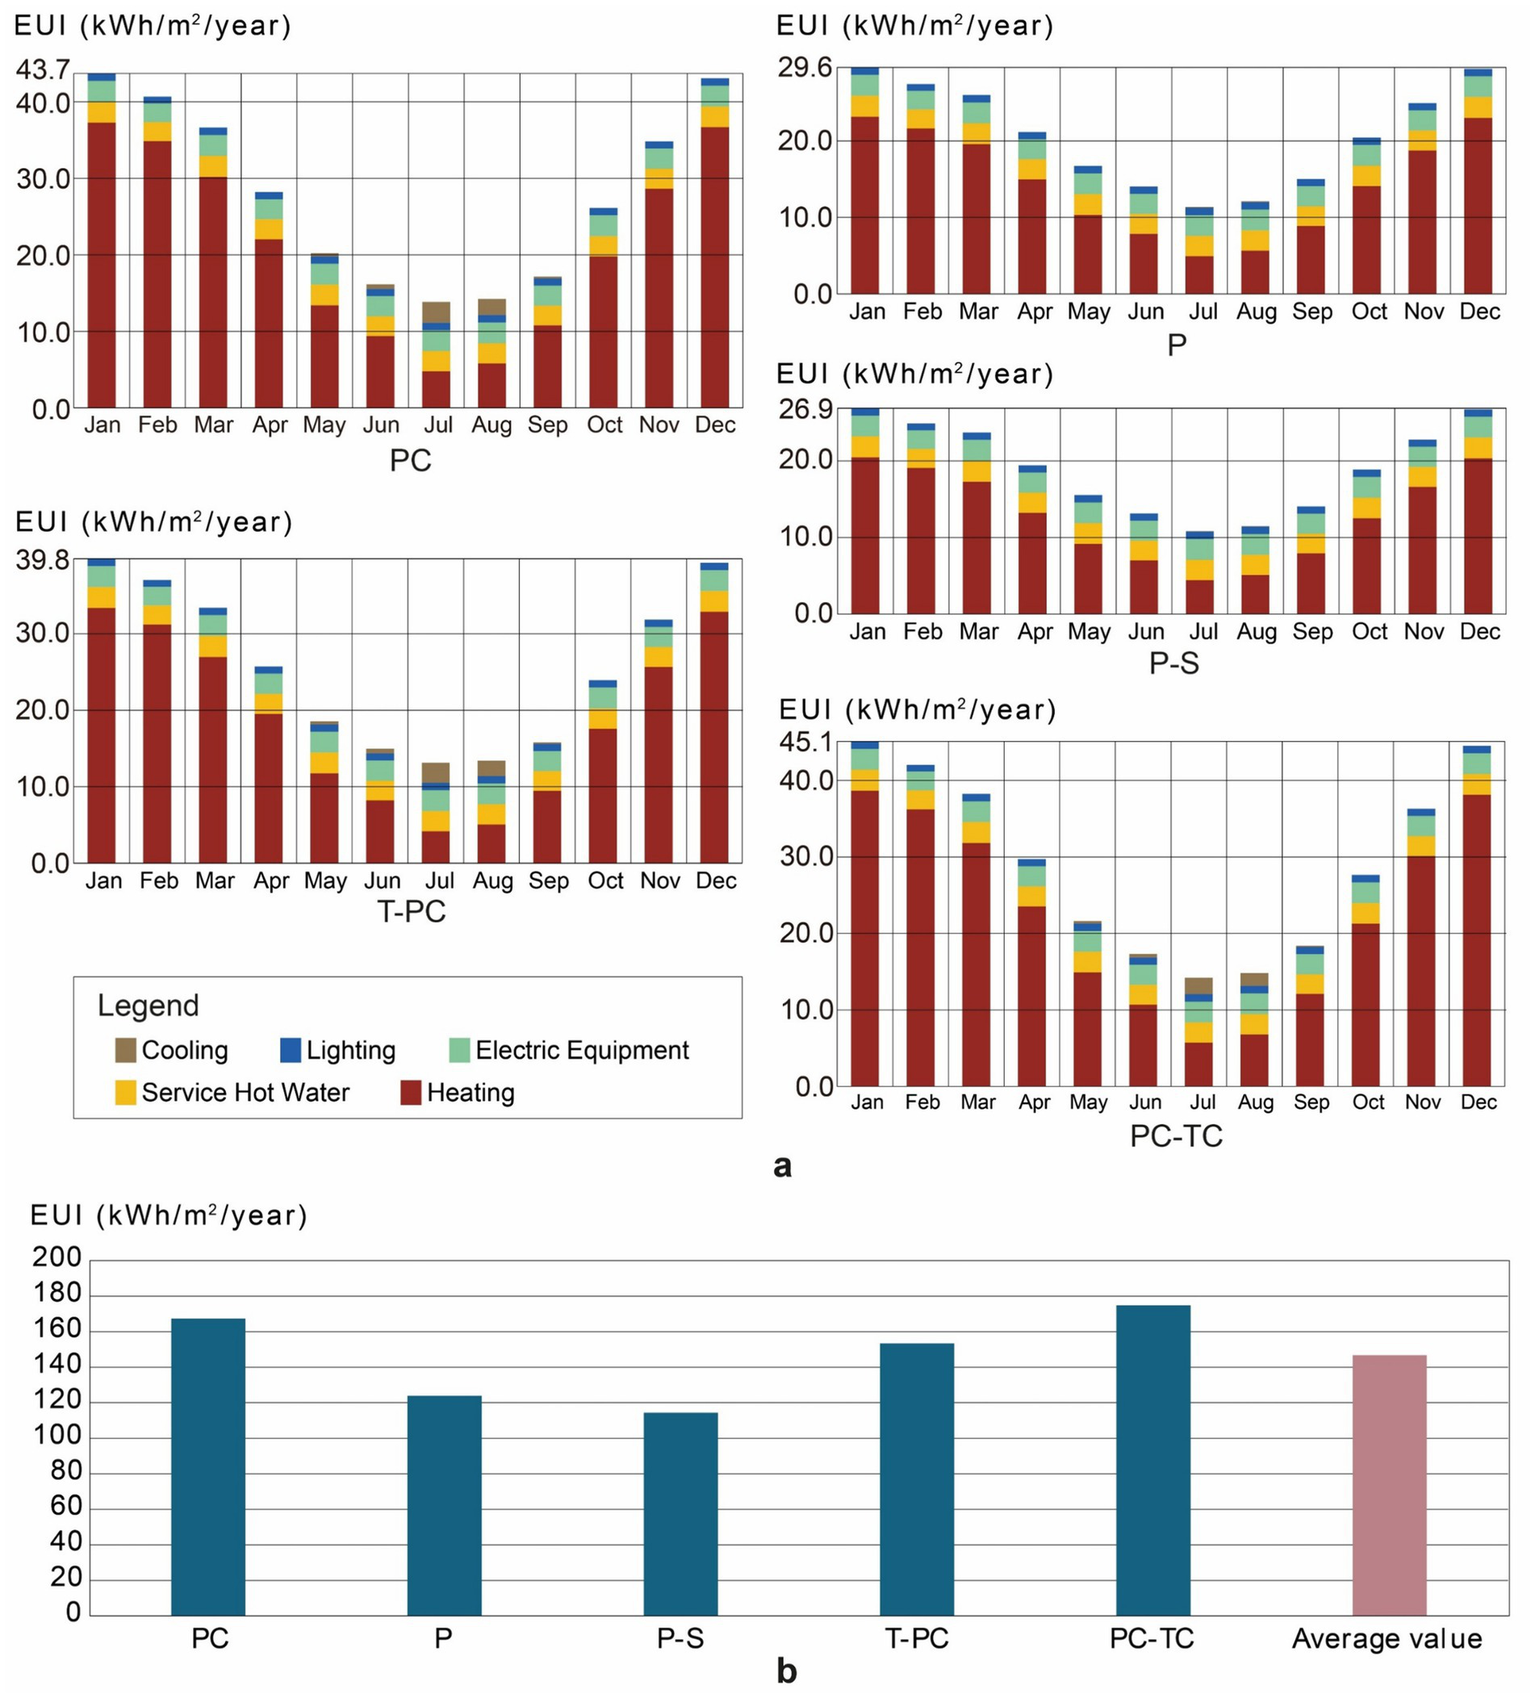
EUI monthly distribution and annual totals comparison across typologies. (a) Monthly distribution by end use; (b) Annual totals.
Figure 4a shows that the PC typology experiences higher energy consumption, particularly during summer months. This is attributed to its compact morphology, which contributes to increased shading, reduced airflow, and elevated indoor thermal loads. These conditions lead to greater reliance on mechanical cooling systems. Although the PC type demonstrates high development intensity, reflected in both building density and height, this spatial efficiency comes with environmental costs. Shorter daylight hours and limited street-level openness further exacerbate energy demand.
In contrast, the P (Pavilion) typology demonstrates relatively low EUI throughout the year. Its regular street network and spaced building layout support favorable lighting conditions and natural ventilation, contributing to lower energy use. However, this comes with low development intensity. Indicators such as EUI, building height, and building density all fall below the overall average, reflecting underutilized land and infrastructure capacity.
The P-S typology, although environmentally adaptable in layout, shows similarly low development intensity and relatively high energy use. The linear building configuration supports ventilation corridors and adequate daylight but results in underutilization of land, as indicated by its below-average performance in building height, density, and EUI.
Compared to the P and P-S types, The T-PC (Tower-Pavilion-court) typology displays higher energy consumption across most months. While its vertical massing contributes to strong indoor daylight conditions and development efficiency, it also limits passive cooling opportunities. The high EUI reflects energy demands driven by intensive building operations and limited climatic responsiveness.
The PC-TC (Pavilion-court-Tower-court) typology shows the highest monthly EUI values across all types. Its expansive block size and limited permeability constrain natural ventilation and solar access. As a result, high energy demands arise from dense construction combined with insufficient passive regulation. This typology is marked by spatial imbalance, where development intensity outweighs environmental considerations.
Figure 4b reinforces these findings by comparing the total annual EUI across typologies. The PC-TC type exhibits the highest overall EUI, followed by the PC and T-PC types, indicating that forms optimized for spatial intensity, whether through block compactness or vertical massing, tend to face energy efficiency challenges. By contrast, the P type records the lowest EUI, underscoring its environmental comfort advantages but also its relatively inefficient use of land. The P-S type, though favorable in spatial layout, does not achieve comparable energy efficiency due to underutilized development potential.
Overall, the results illustrate a key challenge in climate-adaptive urban design: reconciling the goals of spatial efficiency and energy performance. Typologies that concentrate development must incorporate stronger passive design strategies to mitigate mechanical energy reliance, while low-density forms must explore selective intensification to optimize land use without compromising their environmental strengths.
3.3 Sunshine duration
Figure 5 presents the simulation results for SD across the five typologies, including spatial distribution (Figure 5a) and annual averages (Figure 5b).
Figure 5
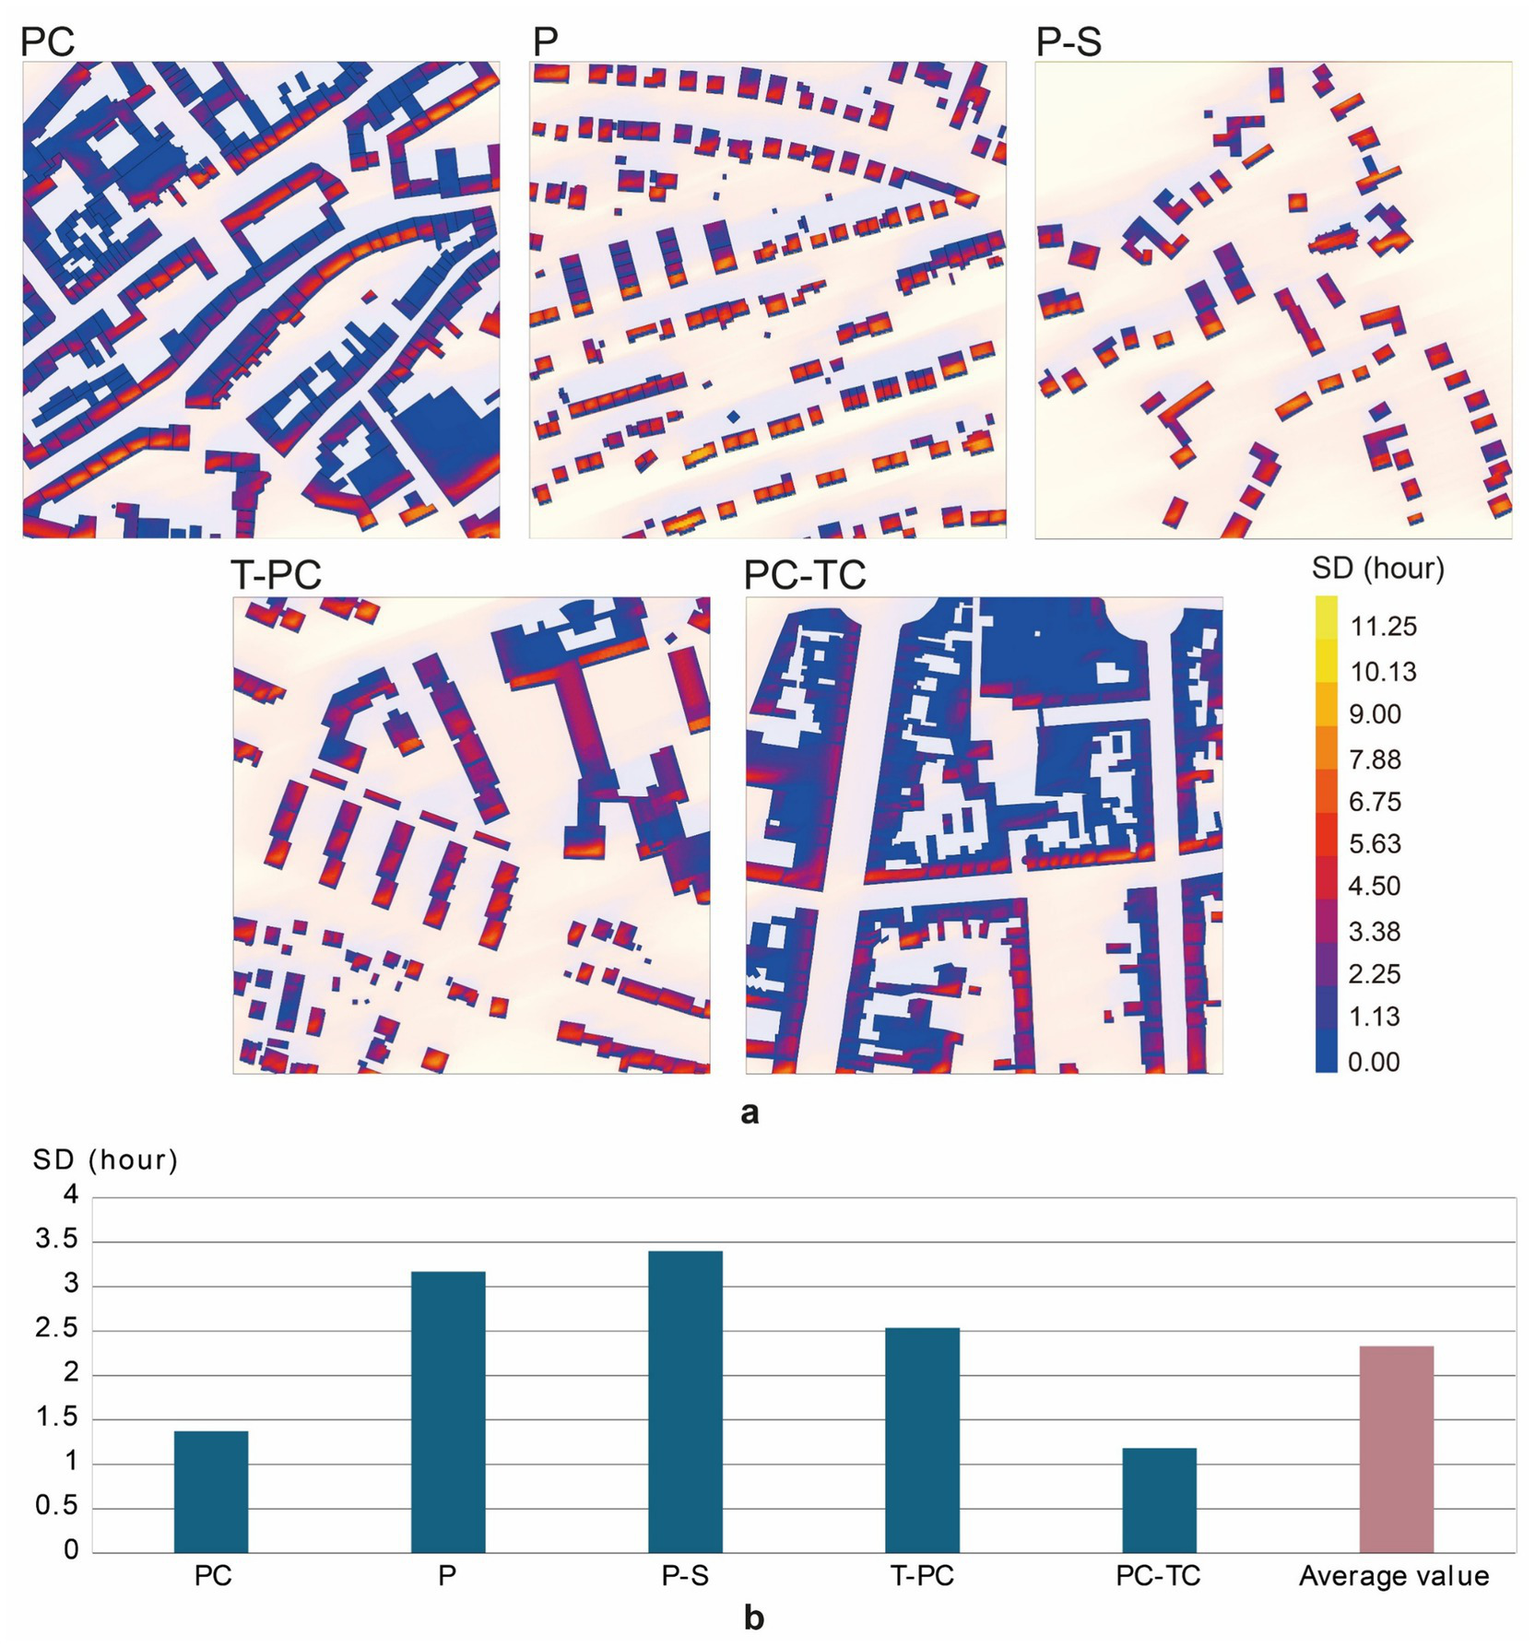
SD spatial distribution and annual averages comparison across typologies. (a) Spatial distribution; (b) Annual averages.
Figure 5a reveals that the PC typology, with its compact street network and smaller urban blocks, results in a dense spatial configuration that significantly limits Sunshine exposure. Shorter daylight hours and increased shading are clear drawbacks of this highly compact form. These constraints are exacerbated by reduced airflow and elevated indoor thermal loads, contributing not only to higher energy consumption but also to lower outdoor comfort. The compact morphology leads to insufficient solar access at the pedestrian level, reinforcing the need for strategies such as well-positioned open corridors to enhance natural ventilation and daylight penetration.
The P typology, with its well-structured and regularly spaced individual buildings, exhibits improved indoor SD. The spatial configuration supports favorable lighting conditions, contributing to a higher degree of environmental comfort. Its strong performance in SD is closely linked to its environmental advantages, as confirmed by other indicators such as the UTCI. However, this improved solar access occurs within a context of relatively low development intensity, raising questions about spatial efficiency.
Similarly, the P-S typology performs well in SD. Its linear building layout ensures adequate daylight access and supports favorable microclimatic conditions. The form allows for ventilation corridors, which improve solar exposure along streets and public spaces. These characteristics highlight the typology’s adaptability to climate-responsive urban design. Nevertheless, despite the strong performance in daylight access, the P-S typology shows below-average results in building height, density, and energy use intensity, pointing to underutilization of spatial resources.
In the T-PC typology, the Sunshine performance is also above average. The vertically oriented configuration enables stronger indoor daylight conditions due to increased building height and spacing. However, the building density is lower than expected, reflecting a form that prioritizes vertical massing over horizontal spread. While indoor light conditions benefit from the morphology, the outdoor environment remains challenged by limited passive ventilation and potential overshadowing at the street level.
By contrast, the PC-TC typology shows clear limitations in daylight access. Despite its prominent massing and large urban blocks, SD falls noticeably below average. The expansive street intersections and low permeability contribute to constrained solar exposure, particularly in street-level and courtyard environments. The spatial imbalance, where built mass dominates open space, exacerbates the lack of passive climatic regulation and reinforces the high energy demands observed in this typology.
Figure 5b further supports these findings through annual average SD. The PC and PC-TC types both fall below the average value, reaffirming the challenges of compact or massive built forms in ensuring sufficient daylight access. In contrast, the P and P-S types exceed the system average, confirming the effectiveness of their more open and linear configurations. The T-PC type, though compact in massing, maintains relatively good daylight performance due to building height and spacing.
In summary, the results indicate that spatial openness, building arrangement, and verticality all influence solar access. Typologies that distribute built mass more evenly across space or use linear layouts show higher SD and better environmental comfort. Conversely, overly compact or large-block forms restrict daylight penetration, impacting both indoor environments and the livability of public space.
3.4 Universal thermal climate index
Figure 6 presents the simulation results for UTCI across the five typologies, showing their annual and diurnal distribution. Overall, the patterns are broadly consistent across all cases: low UTCI values dominate in winter, rise progressively in spring, peak during the summer months, and decline again in autumn. High UTCI conditions are concentrated from late spring to early autumn, particularly during midday and afternoon hours, indicating the period of greatest thermal stress.
Figure 6
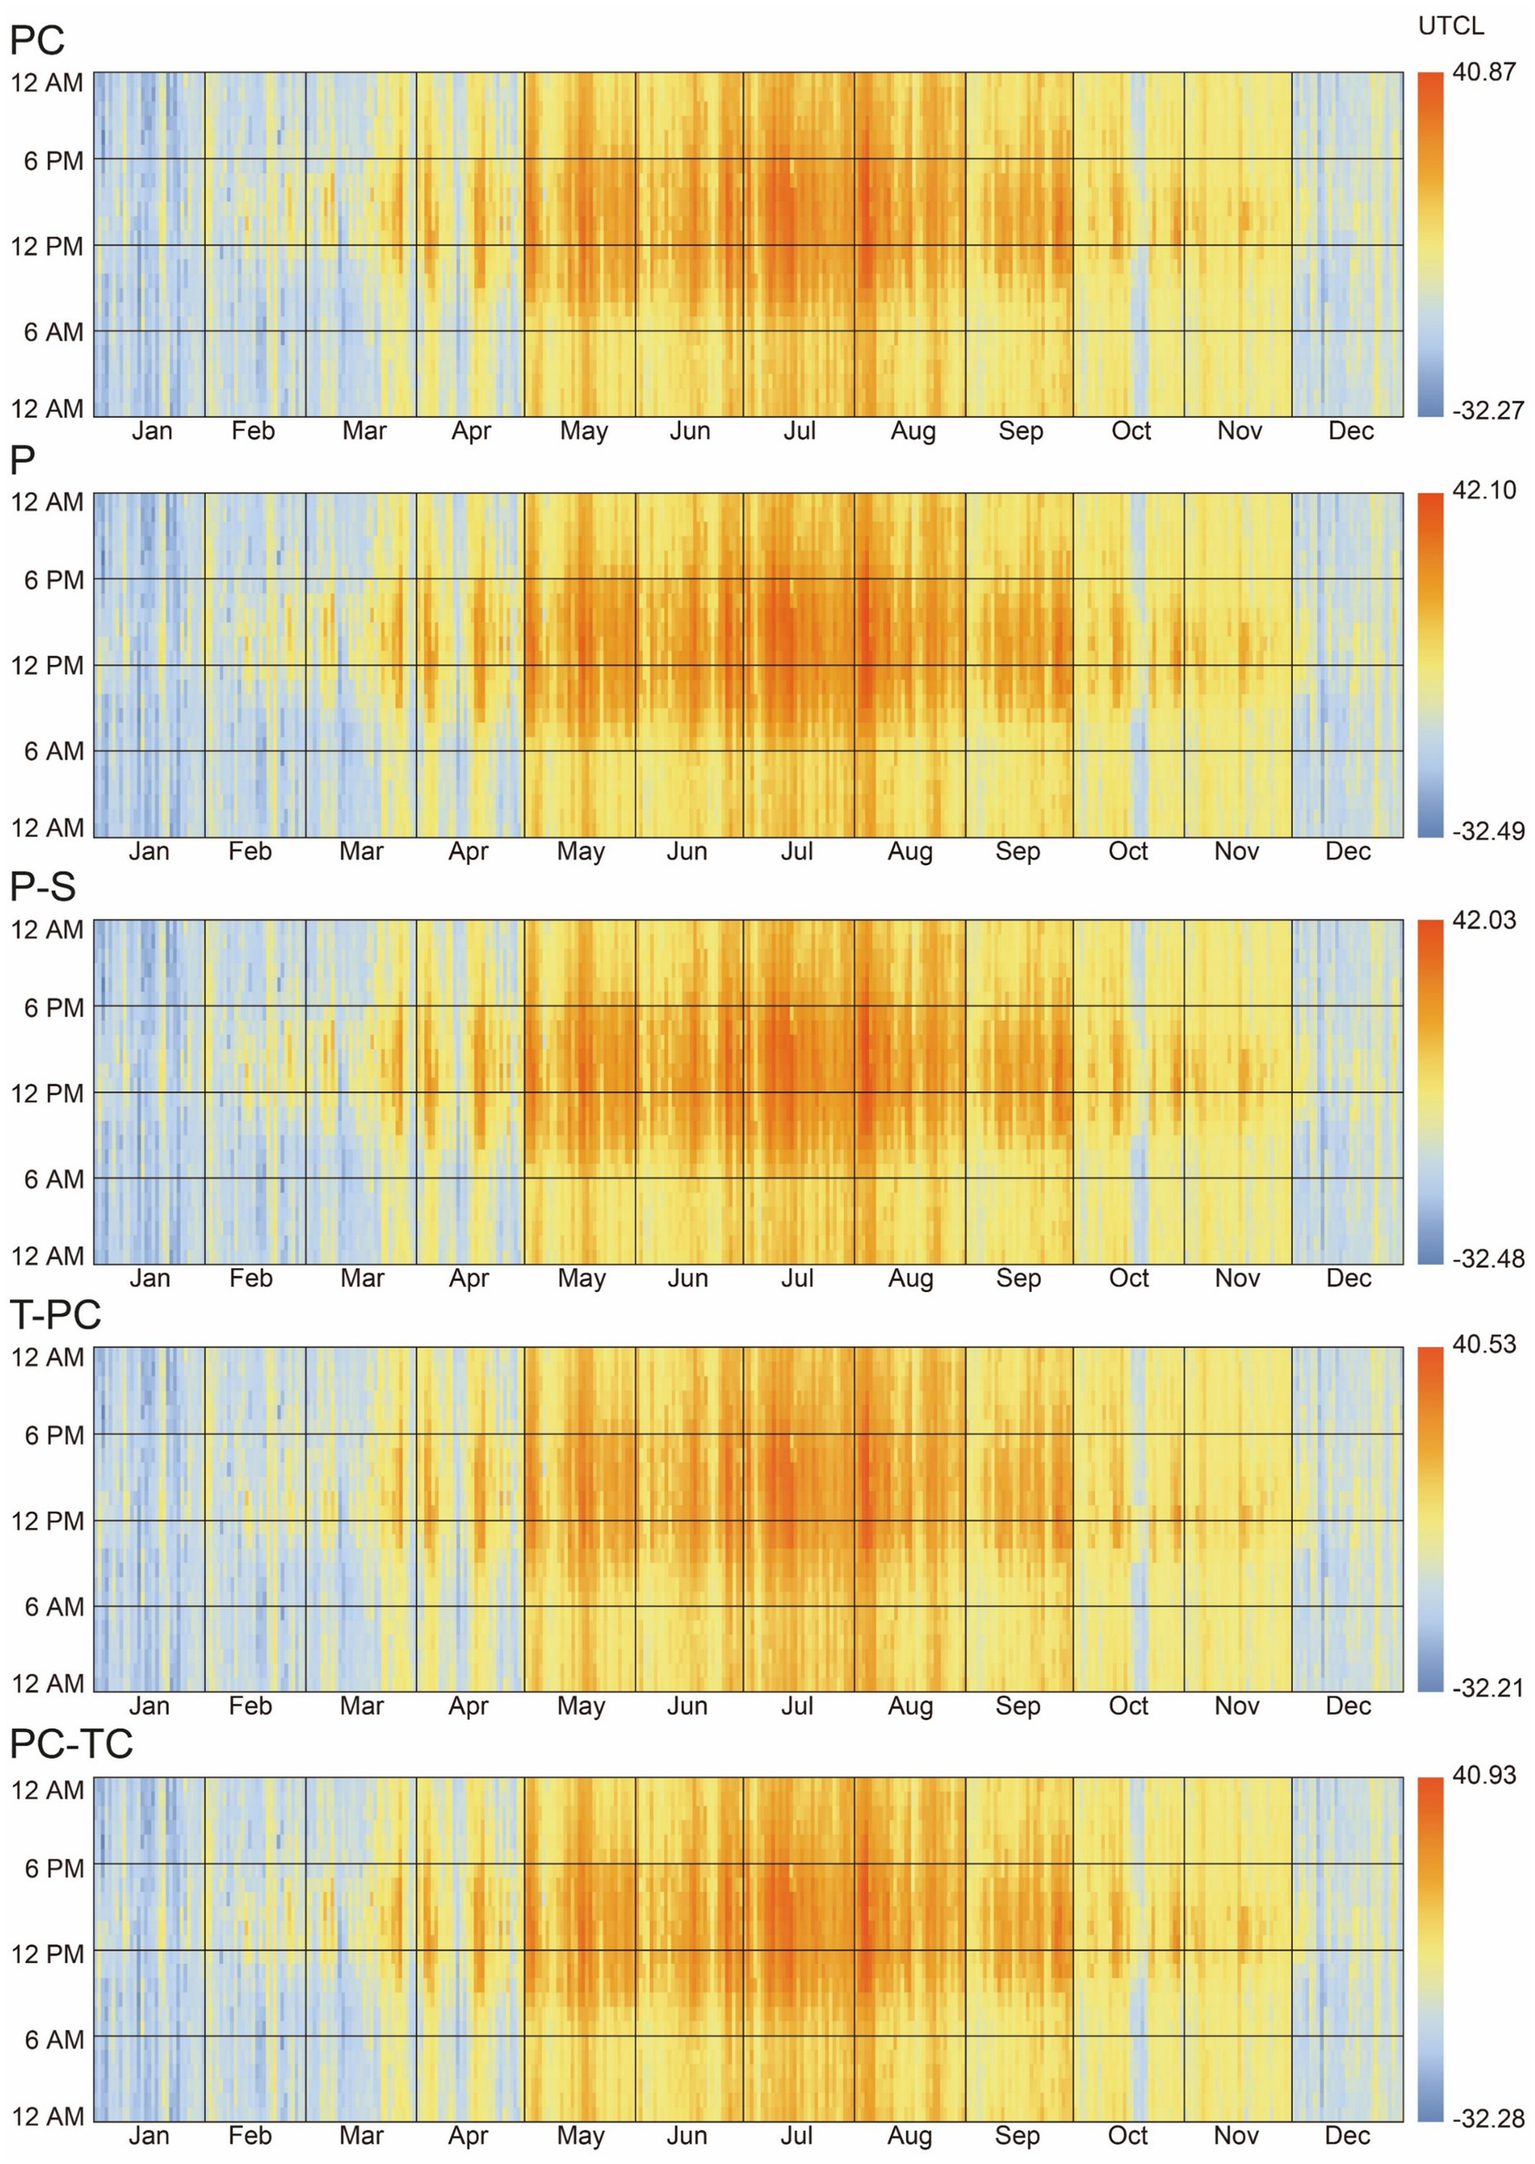
UTCI hourly dynamics.
The P typology demonstrates the longest duration of high UTCI in summer. Its relatively open configuration, while beneficial for daylight and ventilation, also exposes pedestrians to prolonged heat stress, resulting in extended periods of discomfort. A similar pattern is observed in the P-S typology, where the linear form allows for ventilation corridors and strong daylight penetration, but at the same time sustains high UTCI for longer periods during the hottest months.
By contrast, the T-PC typology experiences the shortest duration of high UTCI conditions in summer. The vertical massing and larger building spacing provide partial shading and reduce direct heat exposure, moderating thermal stress during peak hours. The PC and PC-TC typologies fall in between: while both exhibit clear summer peaks in UTCI, the duration of extreme heat exposure is less extended compared to P and P-S, though still notable given their compact massing and limited street-level openness.
Figure 7 further illustrates these differences by comparing mean, maximum, and minimum UTCI values. The P and P-S typologies record the highest mean and maximum UTCI, reinforcing their exposure to prolonged summer heat stress. In contrast, the T-PC typology shows the lowest maximum UTCI, confirming its relative advantage in moderating peak thermal conditions. The PC and PC-TC types again occupy an intermediate position, with values close to the overall average. Minimum UTCI values remain broadly similar across all typologies, suggesting that variations are most pronounced under hot rather than cold conditions.
Figure 7
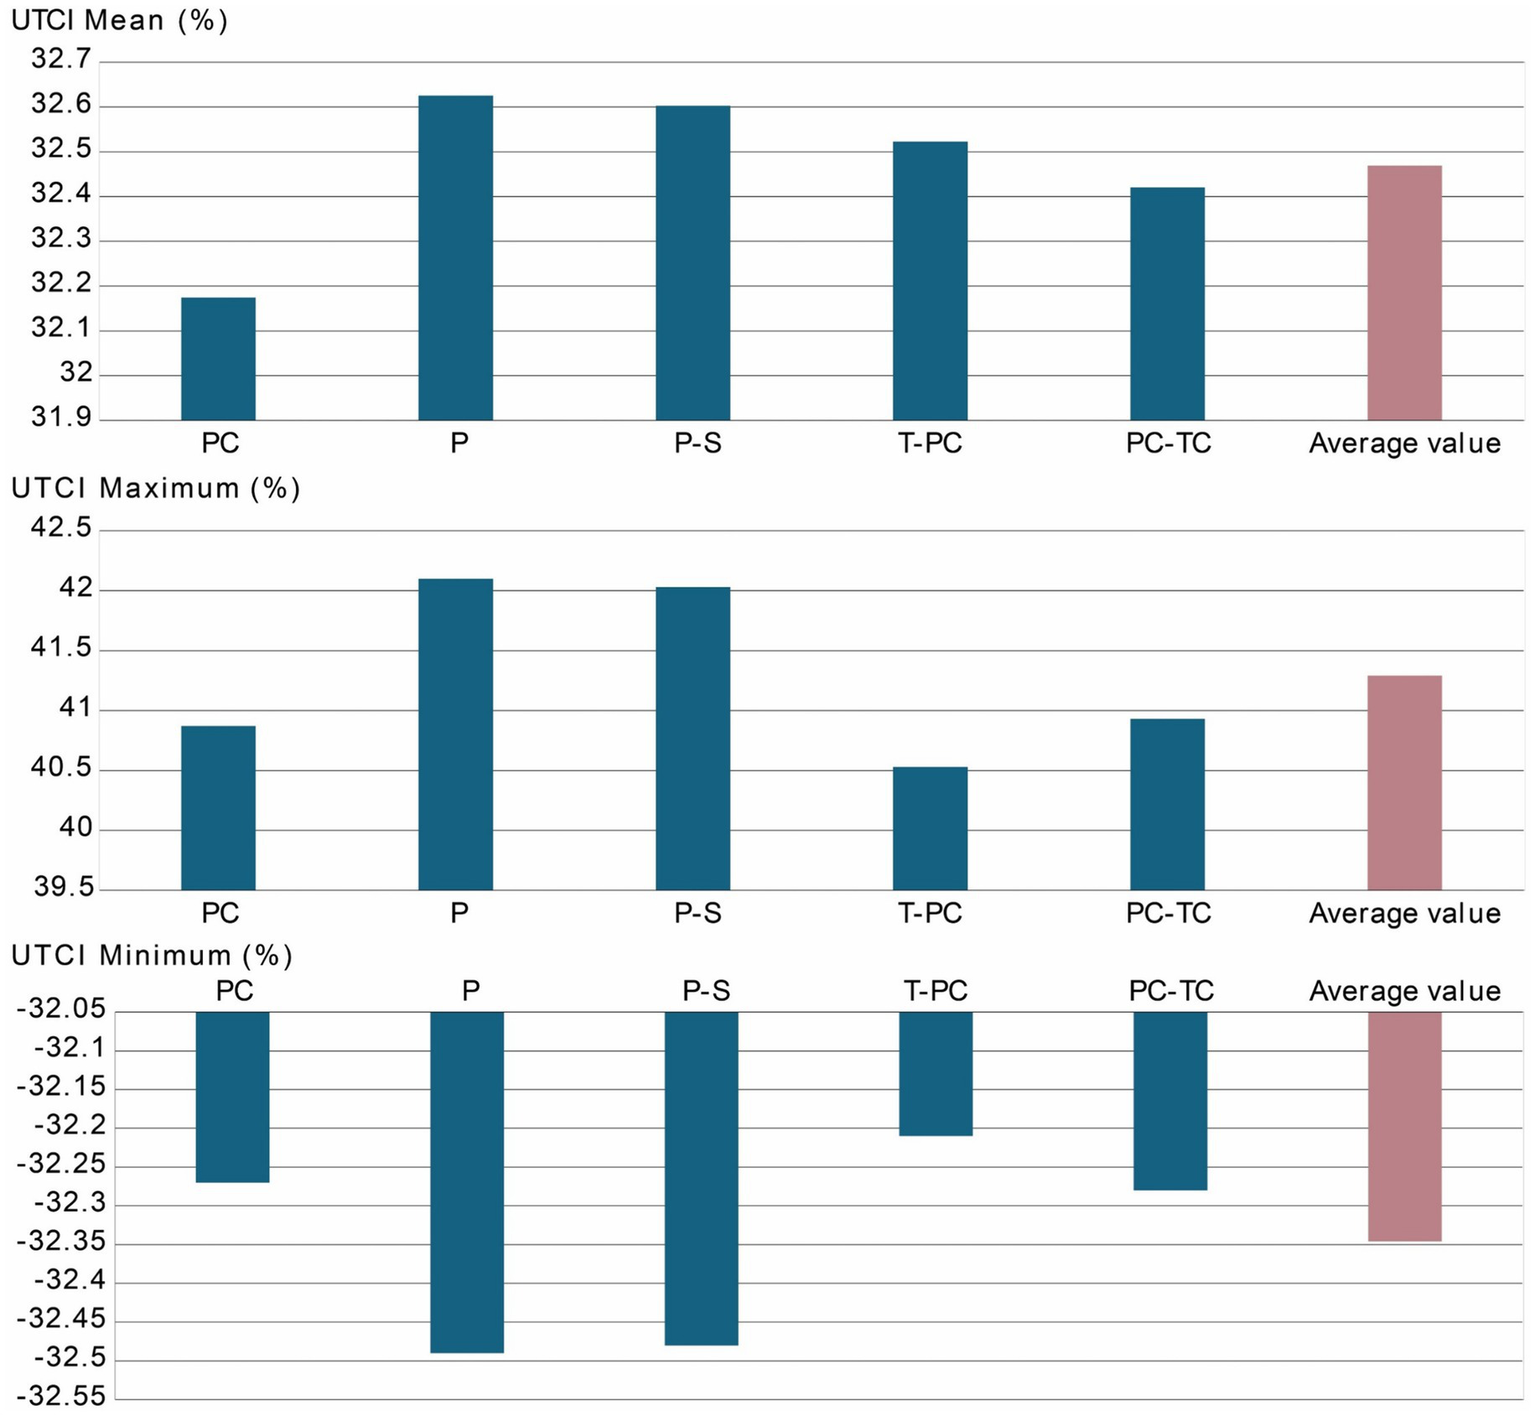
UTCI comparison across typologies showing mean, maximum and minimum values.
Taken together, the results highlight a clear trade-off between solar access and thermal comfort. Typologies that perform well in daylight exposure (such as P and P-S) also face longer periods of summer heat stress, whereas more compact or vertically oriented forms (such as T-PC) mitigate the duration of thermal discomfort but at the expense of reduced daylight.
3.5 Building height and building density
Development intensity, as measured by BD and BH, is a key consideration in sustainable urban design. Figure 8 presents a comparative assessment of these two indicators across the five spatial typologies.
Figure 8
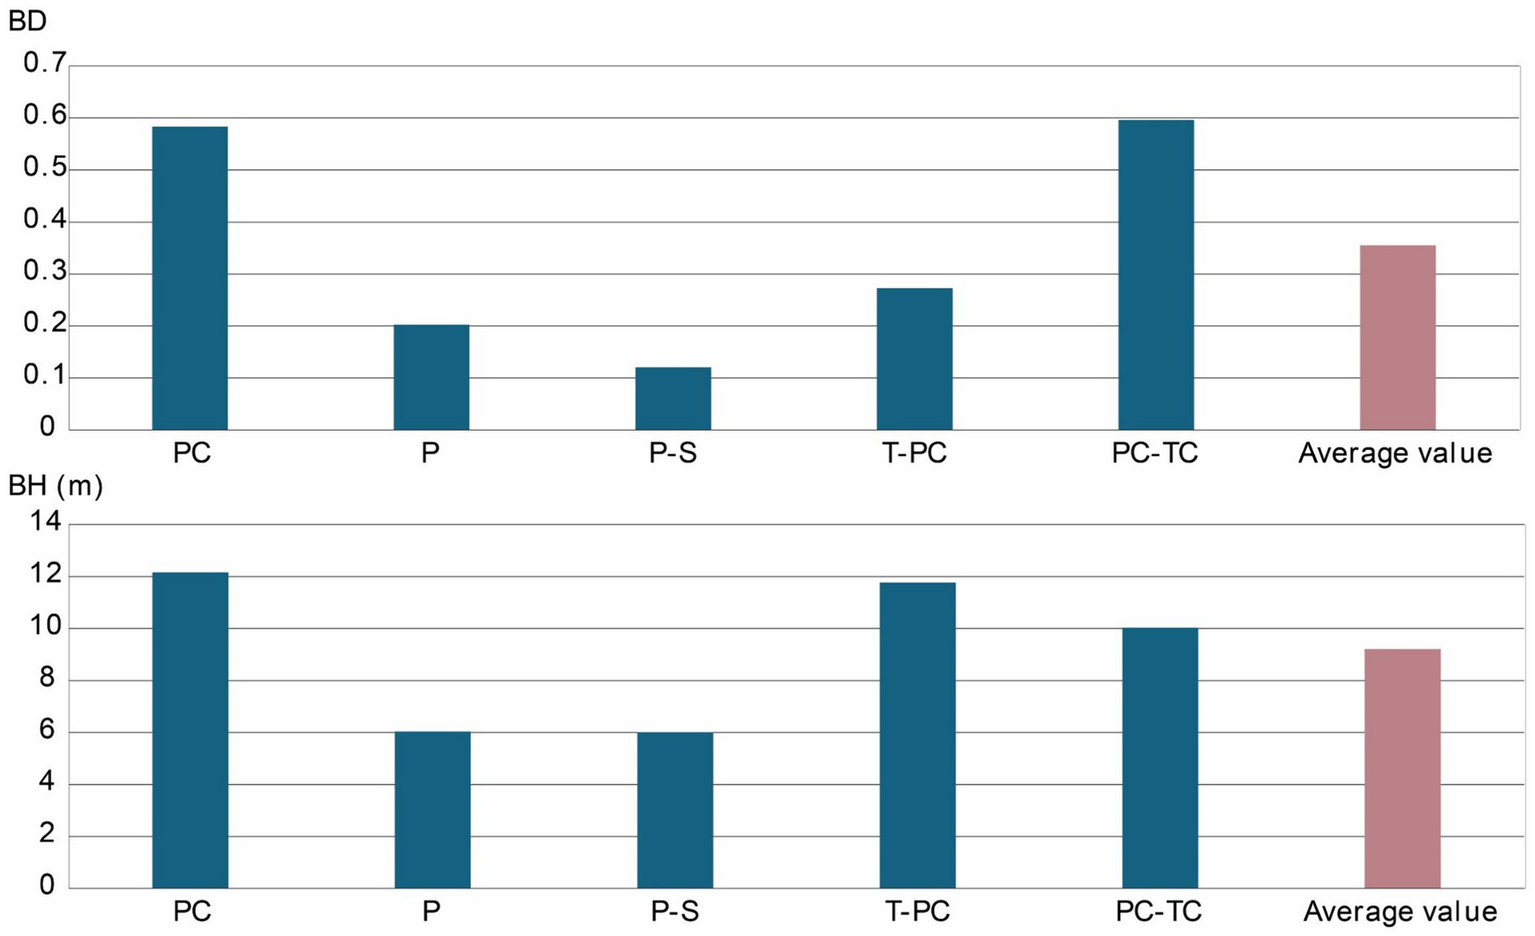
BD and BH comparison across typologies.
The PC typology is characterized by a compact street network and smaller urban blocks, resulting in a dense spatial configuration. It shows one of the highest values for both BD and BH, reflecting high spatial efficiency. However, this intensity is accompanied by notable environmental costs, such as reduced daylight hours and higher energy demands. In contrast, the P typology exhibits the lowest development intensity. Both BD and BH fall well below the system average, indicating a pattern of underutilized land and infrastructure capacity. The P-S typology also demonstrates low values for BD and BH. The T-PC typology performs above average in BH but moderately in BD. Finally, the PC-TC type records high values in both BD and BH, similar to the PC type. However, this intensity exacerbates environmental issues, including poor daylight access and low outdoor comfort (Figure 9).
Figure 9
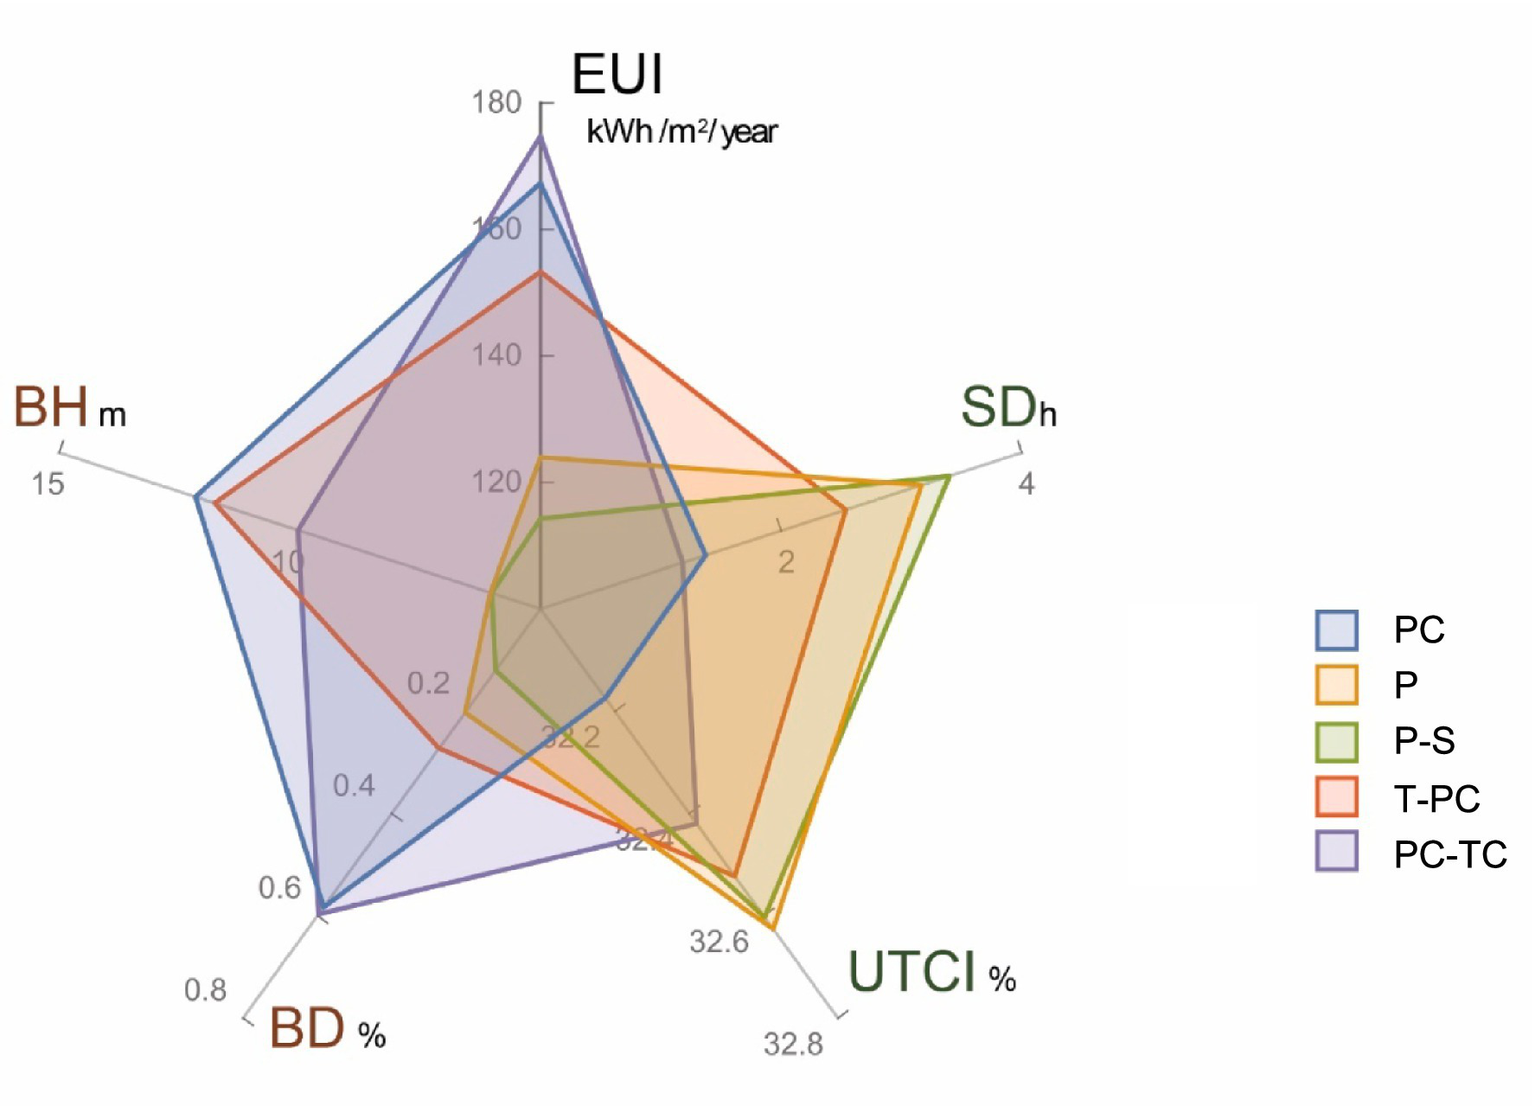
Visual representation of performance results using pentagonal coordinates.
In summary, higher development intensity, whether expressed through density, height, or both, often comes at the cost of environmental performance. Typologies like PC and PC-TC demonstrate this trade-off, while forms like P and P-S present the inverse challenge of underused capacity. The T-PC configuration offers a more balanced alternative. A comprehensive urban strategy must therefore reconcile intensity goals with spatial and environmental quality.
3.6 Visualizing trade-offs and potentials in urban typology performance
Based on the integrated evaluation framework, simulation results for the five representative urban typologies are summarized in Figure 4 and Table 3. The results are visualized using a pentagonal coordinate system, which enables a comparative understanding of each typology’s performance across five key dimensions. This multidimensional representation allows not only for straightforward comparison, but also for identifying performance trade-offs and optimization potentials.
Table 3
| Urban typology | EUI (kWh/m2/year) | SD (h) | UTCI % | BD | BH (m) |
|---|---|---|---|---|---|
| PC | 167.382 | 1.372912 | 32.174308 | 0.583413 | 12.167029 |
| P | 123.9875 | 3.16684 | 32.625571 | 0.202598 | 6.036539 |
| P-S | 114.2865 | 3.400328 | 32.60274 | 0.120348 | 6.01155 |
| T-PC | 153.3135 | 2.537887 | 32.522831 | 0.272625 | 11.771 |
| PC-TC | 174.7995 | 1.181011 | 32.420091 | 0.59656 | 10.038161 |
| Average value | 146.7538 | 2.3317956 | 32.4691082 | 0.3551088 | 9.2048558 |
Average results of the five spatial typologies.
The results reveal clear spatial and environmental characteristics unique to each urban form. The PC typology leans toward the upper-left portion of the pentagon, indicating high development intensity and energy use, but lower scores in environmental comfort metrics. In contrast, the P-S and P types tilt toward the lower-right, suggesting a more favorable balance of lower density and enhanced thermal, solar, and airflow conditions. The T-PC type exhibits a relatively balanced geometry, indicating moderate performance across all five dimensions. The PC-TC form, however, emerges as the least efficient, characterized by the highest energy consumption and poorest environmental comfort indicators.
The orientation and deformation of each pentagon carry critical interpretive value. A rightward and downward tilt of the pentagon indicates lower development intensity and reduced energy consumption. In contrast, an upward and leftward shift reflects a prioritization of density and development intensity, which often comes at the expense of thermal comfort and energy efficiency.
These results illustrate the inherent trade-offs embedded in urban spatial configuration. Denser forms may support land use efficiency and urban consolidation goals, yet simultaneously generate thermal burdens and higher energy demands. Conversely, more dispersed forms may offer better environmental comfort but risk underutilizing valuable urban land. It should be noted that in this study, EUI is calculated on the basis of floor area, reflecting energy demand per unit of built space. While this provides a robust measure of spatial efficiency, it does not directly capture per-resident energy demand, which may differ across typologies depending on household size and living space allocation. This limitation should be addressed in future research by incorporating demographic variables to complement area-based energy metrics.
More broadly, these findings affirm the utility of performance-based typology analysis in supporting climate-adaptive design. By translating complex environmental and spatial data into interpretable forms, the framework provides both diagnostic insight and design guidance. It enables planners to anticipate trade-offs, identify leverage points, and inform cross-sectoral decisions that align with broader policy objectives, including Aachen’s 2030 carbon neutrality target.
4 Discussion
4.1 Influence of indicators on typological performance
This study adopts a multi-indicator framework to evaluate the spatial and environmental performance of five representative urban typologies. The indicators not only provide a comprehensive view of performance dimensions but also help identify the distinct trade-offs embedded in each typology. This section discusses how each indicator influences the design logic, functional expression, and possible spatial strategies, highlighting where their spatial strengths and environmental limitations diverge.
SD serves as a key proxy for daylight access and visual comfort. Its variation across typologies reflects the impact of urban form on solar exposure. The P and P-S types show above-average SD, benefiting from their open and regularly spaced configurations, which allow for optimal solar penetration. In contrast, PC and PC-TC types experience significantly reduced sunshine duration due to their compact or enclosed morphologies, leading to higher shading and reduced daylight quality, especially at the pedestrian level. T-PC, despite its vertical form, manages to achieve relatively favorable daylight conditions due to strategic spacing and moderate building heights. To mitigate the daylight deficiency in compact forms, strategies such as staggered building arrangements, optimized block orientation, and stepped massing can be introduced to enhance solar penetration without substantially reducing density (Compagnon, 2004; Ratti et al., 2005).
Thermal comfort, as captured by the UTCI, shows similar spatial sensitivities. The P and P-S types again perform strongly, with higher UTCI values indicating enhanced outdoor comfort. Their looser building arrangements promote airflow and reduce thermal stress, particularly during summer months. The PC and PC-TC types, in contrast, are characterized by suboptimal thermal environments, largely due to dense massing and limited ventilation. The T-PC typology shows a mixed pattern: while its elevation helps mitigate surface-level heat accumulation, the lack of open ground space can still limit overall cooling, especially in dense configurations. Targeted interventions such as ventilation corridors, integration of vegetated open spaces, and porous block design could alleviate these challenges by strengthening urban wind flows and reducing localized heat stress (Ng, 2009; Norton et al., 2015).
EUI reflects the operational efficiency of the built form and its reliance on mechanical systems. PC and PC-TC record the highest EUI values, reinforcing the environmental costs of compact and vertically intensive urban fabrics. High shading and heat retention increase cooling loads, contributing to greater energy consumption. By contrast, the P-S and P types benefit from passive regulation, leading to lower EUI values. Interestingly, the T-PC typology, despite its development intensity, maintains a relatively moderate EUI due to its spatial openness and potential for vertical passive design interventions such as green façades and rooftop insulation. To reduce EUI across dense urban fabrics, design strategies could include distributed shading devices, improved building envelopes, and the use of reflective or vegetated surfaces to minimize cooling demands (Santamouris, 2014; Berardi et al., 2014).
Development intensity is further unpacked through BD and BH, which together define the volumetric and spatial logic of each typology. The PC and PC-TC types demonstrate the highest BD values, underscoring their compact land use and tight block configurations. BH values also peak in the PC and T-PC types, signaling their strong vertical emphasis. Conversely, the P and P-S types show significantly lower scores on both BD and BH, indicating underutilized land capacity and low verticality. These quantitative differences explain their lower EUI and higher comfort levels but also highlight the need for densification strategies if urban efficiency is to be improved. Potential measures include selective vertical extension, mixed-use infill development, and adaptive land readjustment to balance environmental comfort with efficiency (Boyko and Cooper, 2011).
Overall, the differentiated indicator profiles underscore the multidimensional trade-offs inherent in each typology. While the P and P-S types excel in environmental comfort, they lag in spatial efficiency. The PC and PC-TC types offer compactness but at the cost of daylight access and energy performance. T-PC provides a more balanced profile, combining vertical efficiency with relatively manageable environmental trade-offs. These variations reinforce the need for context-sensitive interventions, where individual indicators serve as levers to tailor design solutions that optimize both environmental performance and urban functionality.
In this context, resilience does not stem from the maximization of any single dimension, but rather from achieving a balanced configuration across these interdependent criteria. This view is consistent with recent studies that conceptualize urban resilience as the capacity to manage multidimensional trade-offs and reconcile competing objectives (Eldesoky and Abdeldayem, 2023; Sharifi, 2019).
4.2 Reframing urban design in the context of climate neutrality
The connotation of urban planning is undergoing significant transformation. Contemporary urban design is no longer confined to shaping physical spaces; it increasingly encompasses the development of spatial processes and governance strategies (Kempenaar et al., 2025). As cities confront mounting environmental and social challenges, the creation of livable, adaptable, and resilient habitats has become a core objective of planning practice (Meerow et al., 2016). Spatial qualities such as thermal and lighting environments play a vital role in shaping urban experience, while energy systems directly affect the sustainability and functionality of urban life (Santamouris, 2015; Chang and Zhang, 2020).
Climate-adaptive urban design seeks to align three key dimensions (urban form, energy performance, and human comfort) within an integrated design framework. This alignment is essential to support the broader goal of creating high-quality urban “places” capable of withstanding climate-related stresses and meeting evolving social needs (Reicher, 2016). Under the growing imperative of achieving climate neutrality, such as Aachen’s goal of becoming a climate-neutral city by 2030, there is an increasing demand for environmentally responsive urban development strategies that also enhance quality of life (Brandsma et al., 2024; U. N, 2025).
Climate-adaptive design is inherently contextual, shaped by local climatic conditions and human needs across multiple spatial scales (Emmanuel, 2012; Linhares de Siqueira, 2015). In recent years, numerous concepts and approaches have emerged, from building-level interventions to regional planning strategies, reflecting a diversification of tools and frameworks (Battiston and Schifanella, 2024; Shi et al., 2017). However, existing research often remains fragmented, focused either on technical parameter analysis, specific design strategies, or long-term development trends, without sufficient integration (Mauree et al., 2019; Shi et al., 2021). There is a notable gap in applying holistic, multi-criteria systems to bridge climate adaptation with mainstream urban design practice (Jia et al., 2023; Chelleri et al., 2015b).
This study responds to that gap by synthesizing a diverse body of literature and tools into a unified evaluation and simulation framework. It demonstrates how quantitative indicators, typically viewed as technical metrics, can inform the spatial logics of urban form while also enabling coordination across institutional sectors such as energy, environment, and planning (Jia et al., 2024; Roudsari and Pak, 2013). The typological evaluation presented in the case study of Aachen offers a concrete example of how such a system can guide spatial decisions and design strategies under climate neutrality objectives (Hamedinger and Dumke, 2013).
Importantly, this study recognizes that design is inherently interpretive and iterative. Quantification is not a substitute for creativity or judgment but rather a support structure that enables evidence-informed, performance-driven decision-making (Rossi, 1984; Ratti et al., 2003). While the framework presented here provides a replicable workflow, it is intended as an adaptable foundation, one that can incorporate new indicators, evolving climate goals, and stakeholder perspectives. As cities move toward climate neutrality, such integrated design systems offer a pathway to more responsive, coordinated, and effective urban transformation.
4.3 Trade-offs and prioritization in climate-adaptive design
Climate-adaptive urban design inherently involves negotiating trade-offs among competing objectives, namely development intensity, energy efficiency, and environmental comfort (Santamouris, 2015; Meerow et al., 2016). As the simulation results in this study demonstrate, no single urban typology excels uniformly across all dimensions. Instead, each presents a distinct spatial configuration shaped by its historical, morphological, and functional context, with strengths in some areas and weaknesses in others (Shi et al., 2021; Ratti et al., 2003).
For instance, typologies such as the PC and PC-TC types exhibit high development intensity, reflected in above-average building height and density, but this intensity often comes at the cost of increased energy use and diminished environmental comfort (Johansson and Emmanuel, 2006; Pérez-Lombard et al., 2008). Conversely, typologies like the P and P-S types perform well in terms of thermal comfort and natural lighting but suffer from lower land-use efficiency (Handy, 1996; Frank and Pivo, 1994). The T-PC type illustrates a relatively balanced configuration but still faces challenges in reconciling high energy consumption with outdoor comfort conditions.
These findings underscore the necessity of strategic prioritization in design. Urban form cannot simultaneously maximize all goals; instead, priorities must be set based on local policy targets, population needs, and climate resilience objectives (Chelleri et al., 2015b; Berrang-Ford et al., 2021). For Aachen, which has committed to becoming climate-neutral by 2030, this means that energy efficiency and development intensity should be treated not as secondary constraints but as central design parameters. Yet, in a growing city, development intensity also remains a pressing concern, particularly in the context of land scarcity and housing demand (U. N, 2025).
The simulation framework used in this study provides planners with a quantitative diagnostic tool to identify leverage points and spatial inefficiencies (Jia et al., 2023; Roudsari and Pak, 2013). For example, where development intensity is already high, targeted improvements in ventilation, shading, or greenery can enhance comfort without reducing density (Nguyen and Korkina, 2021; Gong et al., 2018). In contrast, underutilized typologies may benefit from selective densification, provided such interventions do not erode thermal comfort or daylight access (Emmanuel, 2012).
This balancing act also involves temporal and spatial calibration. Some interventions, such as green infrastructure or building retrofits, may yield delayed benefits but are essential for long-term resilience (Jia et al., 2024). Others, like layout reconfiguration or material changes, may produce immediate gains. Prioritizing such actions requires an understanding not only of static performance metrics but also of how design choices influence the dynamic evolution of urban microclimates and energy patterns over time (Mauree et al., 2019; Shi et al., 2017; Reimuth et al., 2023).
In summary, climate-adaptive design is not a fixed formula but a process of navigating constraints and opportunities through informed decision-making. The typological assessment presented in this study illustrates how integrated simulation and evaluation can support this process, helping planners make context-sensitive trade-offs while maintaining fidelity to long-term climate goals.
4.4 Governance implications and institutional integration
The transition toward climate-adaptive urban design does not depend solely on technical innovation or design optimization. It also requires an enabling institutional environment that supports the implementation of design solutions (Coaffee et al., 2018; Chelleri, 2012). More fundamentally, it demands shifts in governance structures, decision-making processes, and institutional coordination (Bröde et al., 2012; Grafakos et al., 2019). Lessons from cities such as Beijing and Munich further emphasize that the effectiveness of climate and risk governance depends not only on technical capacity, but also on institutional coordination and the ability to align policy tools across administrative and spatial levels (Peng L. et al., 2024).
Urban design decisions often involve overlapping mandates from different departments or agencies, each with its own priorities and performance metrics. For example, planning departments may prioritize development capacity and housing density, while environmental offices focus on emissions reduction and thermal comfort. Without mechanisms for cross-sectoral alignment, these objectives can easily become fragmented or even contradictory (Meerow et al., 2019; Chelleri et al., 2015b). In this context, integrated evaluation frameworks, such as the one developed in this study, can serve as boundary-spanning tools that promote shared understanding across disciplines and institutions (Kempenaar et al., 2025; Feng et al., 2025).
The city of Aachen’s commitment to achieving climate neutrality by 2030 exemplifies the urgency of such integration. Reaching this target requires aligning long-term spatial planning with short-term regulatory and investment decisions. However, this alignment is often challenged by temporal mismatches in policy implementation cycles, jurisdictional overlaps, and a lack of common evaluation standards (Grafakos et al., 2019). Indicators such as EUI or UTCI, when institutionalized in planning procedures, can bridge these gaps by embedding climate considerations into routine decision-making (Santamouris, 2015; Roudsari and Pak, 2013). This is particularly relevant in energy-intensive regions, where aligning urban form with sustainable energy systems is critical for long-term planning coherence (Peng Y. et al., 2024).
Furthermore, the study highlights the importance of institutional adaptability. Many urban typologies assessed here, such as the PC or PC-TC types, are legacies of earlier development logics that prioritized compactness and vehicular access. Upgrading these areas for climate resilience requires not only physical redesign but also institutional flexibility in zoning, incentives, and stakeholder engagement (Coaffee et al., 2018). This includes revising land-use codes to permit more adaptive building forms, encouraging retrofits through subsidies, and enabling participatory processes that reflect community needs (Jia et al., 2024; Chelleri and Baravikova, 2021).
Finally, climate-adaptive design must be embedded into governance not only as a regulatory requirement but also as a learning-oriented practice. Iterative evaluation, supported by simulation tools and dynamic indicator systems, can enable policymakers to monitor progress, adapt strategies, and coordinate interventions across spatial and institutional scales (Mauree et al., 2019; Chelleri et al., 2015a).
In conclusion, the findings underscore that the success of climate-adaptive urban design hinges as much on governance integration as on design innovation. Developing operational pathways that connect design metrics with policy instruments, across sectors, levels, and time horizons, is essential for turning spatial analysis into effective and equitable climate action (Chelleri and Baravikova, 2021; Haupt et al., 2020).
4.5 Limitations and future outlook
This study focuses primarily on the scale of urban design and block-level spatial configurations. While this level of analysis offers valuable insights into micro-scale spatial dynamics and design strategies, it does not fully address broader city-wide interactions, systemic planning constraints, or regional governance structures. As a result, the findings may only partially capture the complex, multi-scalar nature of climate adaptation in urban contexts.
In future work, the proposed simulation and evaluation framework could be extended to encompass larger urban areas and more diverse spatial settings. Applying the framework across different cities with varying planning systems, climatic conditions, and governance contexts would enhance its transferability and generalizability. Such comparative applications would also help identify context-sensitive design strategies and governance mechanisms that are effective across scales, thereby supporting more integrated approaches to climate-adaptive urban development. This expansion would also strengthen the framework’s practical relevance and its applicability in real-world urban design and planning processes.
5 Conclusion
This study develops a quantitative framework for evaluating and guiding climate-adaptive urban planning that integrates spatial morphology, environmental performance, and governance considerations. Using five key indicators including energy use intensity, sunshine duration, universal thermal climate index, building height, and building density, the framework balances analytical depth with practical applicability. Applied to the city of Aachen, it combines network analysis and simulation tools to assess the performance of representative urban typologies and to reveal interdependencies among indicators. The results demonstrate that compact forms deliver higher spatial efficiency but often compromise daylight and comfort, whereas more open forms enhance environmental performance but underutilize land. A hybrid typology shows a more balanced profile, suggesting feasible pathways to reconcile density with comfort and efficiency.
Beyond these technical insights, the framework emphasizes urban design as a governance mechanism that facilitates cross-sectoral coordination at the block scale. The selected indicators function not only as evaluation tools but also as boundary objects that enable communication among planners, architects, environmental experts, and policymakers. Since no single spatial type is without limitations, trade-offs are inevitable. Such trade-offs and integration are particularly important when ambitious climate goals must be translated into everyday planning practices.
At the same time, the framework provides a solid quantitative basis for action while acknowledging the contextual and adaptive nature of design. Future testing can be conducted in specific contexts, building on existing recommendations to identify types that may prove more advantageous under certain conditions. Such analyses should also take into account equity concerns, for example, the distribution of benefits and burdens across different populations in different spatial types. Overall, the framework should be understood as a flexible foundation that can evolve with new strategies, technologies, and stakeholder input. By linking spatial form with environmental performance and institutional coordination, the study offers a practical approach to advancing coherent, adaptive, and climate-resilient urban planning.
Statements
Data availability statement
The original contributions presented in the study are included in the article/Supplementary material, further inquiries can be directed to the corresponding author.
Author contributions
WF: Writing – original draft, Methodology, Software, Formal analysis, Visualization, Investigation, Validation, Conceptualization, Writing – review & editing. LY: Conceptualization, Writing – review & editing, Supervision. FZ: Conceptualization, Supervision, Writing – review & editing. JJ: Writing – review & editing, Supervision, Conceptualization. HZ: Writing – original draft, Writing – review & editing. ZW: Writing – review & editing.
Funding
The author(s) declare that financial support was received for the research and/or publication of this article. This research has received funding from ERC Starting Grant, STORIES (Spatial–Temporal Dynamics of Flood Resilience, Grant no. 101040939) and the Humanities and Social Science Fund of the Ministry of Education in China (Grant no. 24YJCZH012). WF received funding from the LMU-CSC Scholarship.
Acknowledgments
This study is partly based on my master’s thesis at RWTH Aachen University. I sincerely thank Prof. Christa Reicher and Prof. Rolf Westerheide for their guidance and support, and Andreas Klozoris for his assistance during the research process.
Conflict of interest
The authors declare that the research was conducted in the absence of any commercial or financial relationships that could be construed as a potential conflict of interest.
Generative AI statement
The authors declare that no Gen AI was used in the creation of this manuscript.
Any alternative text (alt text) provided alongside figures in this article has been generated by Frontiers with the support of artificial intelligence and reasonable efforts have been made to ensure accuracy, including review by the authors wherever possible. If you identify any issues, please contact us.
Publisher’s note
All claims expressed in this article are solely those of the authors and do not necessarily represent those of their affiliated organizations, or those of the publisher, the editors and the reviewers. Any product that may be evaluated in this article, or claim that may be made by its manufacturer, is not guaranteed or endorsed by the publisher.
Supplementary material
The Supplementary material for this article can be found online at: https://www.frontiersin.org/articles/10.3389/frsc.2025.1657008/full#supplementary-material
References
1
Al-Sayed K. Turner A. Hillier B. Iida S. Penn A. (2014). Space syntax methodology. London: Bartlett School of Architecture, UCL.
2
Battiston A. Schifanella R. (2024). On the need for a multi-dimensional framework to measure accessibility to urban green. NPJ Urban Sustain.4:10. doi: 10.1038/s42949-024-00147-y
3
Berardi U. GhaffarianHoseini A. GhaffarianHoseini A. (2014). State-of-the-art analysis of the environmental benefits of green roofs. Appl. Energy115, 411–428. doi: 10.1016/j.apenergy.2013.10.047
4
Berrang-Ford L. Siders A. R. Lesnikowski A. Fischer A. P. Callaghan M. W. Haddaway N. R. et al . (2021). A systematic global stocktake of evidence on human adaptation to climate change. Nat. Clim. Chang.11, 989–1000. doi: 10.1038/s41558-021-01170-y
5
Bonacich P. (2007). Some unique properties of eigenvector centrality. Soc. Netw.29, 555–564. doi: 10.1016/j.socnet.2007.04.002
6
Boyko C. T. Cooper R. (2011). Clarifying and re-conceptualising density. Prog. Plan.76, 1–61. doi: 10.1016/j.progress.2011.07.001
7
Brandsma S. Lenzholzer S. Carsjens G. J. Brown R. D. Tavares S. (2024). Implementation of urban climate-responsive design strategies: an international overview. J. Urban Des.29, 598–623. doi: 10.1080/13574809.2024.2314760
8
Bröde P. Fiala D. Błażejczyk K. Holmér I. Jendritzky G. Kampmann B. et al . (2012). Deriving the operational procedure for the universal thermal climate index (UTCI). Int. J. Biometeorol.56, 481–494. doi: 10.1007/s00484-011-0454-1
9
Cervero R. Kockelman K. (1997). Travel demand and the 3Ds: density, diversity, and design. Transp. Res. Part D Transp. Environ.2, 199–219. doi: 10.1016/S1361-9209(97)00009-6
10
Chang K. Zhang Q. (2020). Development of a solar radiation model considering the hourly sunshine duration for all-sky conditions – a case study for Beijing, China. Atmos. Environ.234:117617. doi: 10.1016/j.atmosenv.2020.117617
11
Chelleri L. (2012). From the «Resilient City» to urban resilience. A review essay on understanding and integrating the resilience perspective for urban systems. Doc. Anàl. Geogr.58, 287–306. doi: 10.5565/rev/dag.175
12
Chelleri L. Baravikova A. (2021). Understandings of urban resilience meanings and principles across Europe. Cities108:102985. doi: 10.1016/j.cities.2020.102985
13
Chelleri L. Schuetze T. Salvati L. (2015a). Integrating resilience with urban sustainability in neglected neighborhoods: challenges and opportunities of transitioning to decentralized water management in Mexico City. Habitat Int.48, 122–130. doi: 10.1016/j.habitatint.2015.03.016
14
Chelleri L. Waters J. J. Olazabal M. Minucci G. (2015b). Resilience trade-offs: addressing multiple scales and temporal aspects of urban resilience. Environ. Urban.27, 181–198. doi: 10.1177/0956247814550780
15
Coaffee J. Therrien M. C. Chelleri L. Henstra D. Aldrich D. P. Mitchell C. L. et al . (2018). Urban resilience implementation: a policy challenge and research agenda for the 21st century. J. Contingencies Crisis Manag.26, 403–410. doi: 10.1111/1468-5973.12233
16
Compagnon R. (2004). Solar and daylight availability in the urban fabric. Energ. Buildings36, 321–328. doi: 10.1016/j.enbuild.2004.01.009
17
Danielski I. Fröling M. Joelsson A. Norrlandsgatan V. (2012). The impact of the shape factor on final energy demand in residential buildings in Nordic climates. Denver, CO: WREF.
18
Duffie J. A. Beckman W. A. (2013). Solar engineering of thermal processes. New York, NY: John Wiley & Sons, 936.
19
Eldesoky A. H. Abdeldayem W. S. (2023). Disentangling the relationship between urban form and urban resilience: a systematic literature review. Urban Sci.7:93. doi: 10.3390/urbansci7030093
20
Emmanuel R. (2012). An urban approach to climate sensitive design: Strategies for the tropics. London: Taylor & Francis, 208.
21
Ewing R. Cervero R. (2010). Travel and the built environment: a meta-analysis. J. Am. Plan. Assoc.76, 265–294. doi: 10.1080/01944361003766766
22
Fanger P. O. (1970). Thermal comfort: Analysis and applications in environmental engineering. London: Danish Technical Press.
23
Feng W. Zhou B. Wang Z. Wang Y. Jia H. Chen J. et al . (2025). Synergizing flood mitigation and water quality goals through green infrastructure in Dali city, China. Int. J. Disaster Risk Reduct.105785. doi: 10.1016/j.ijdrr.2025.105785
24
Fernández-Ahumada L. M. Ramírez-Faz J. López-Luque R. Márquez-García A. Varo-Martínez M. (2019). A methodology for buildings access to solar radiation in sustainable cities. Sustainability11:6596. doi: 10.3390/su11236596
25
Filogamo L. Peri G. Rizzo G. Giaccone A. (2014). On the classification of large residential buildings stocks by sample typologies for energy planning purposes. Appl. Energy135, 825–835. doi: 10.1016/j.apenergy.2014.04.002
26
Frank L. D. Pivo G. (1994). Impacts of mixed use and density on utilization of three modes of TRAVEL: single-occupant vehicle, transit, walking. Transportation Research Record1466:425321.
27
Gong F. Y. Zeng Z. C. Zhang F. Li X. Ng E. Norford L. K. (2018). Mapping sky, tree, and building view factors of street canyons in a high-density urban environment. Build. Environ.134, 155–167. doi: 10.1016/j.buildenv.2018.02.042
28
Grafakos S. Trigg K. Landauer M. Chelleri L. Dhakal S. (2019). Analytical framework to evaluate the level of integration of climate adaptation and mitigation in cities. Clim. Chang.154, 87–106. doi: 10.1007/s10584-019-02394-w
29
Guimarães R. Carvalho M. Santos F. A. (2013). The influence of ceiling height in thermal comfort of buildings: A CASE study in BELO HORIZONTE. Available online at: https://www.semanticscholar.org/paper/THE-INFLUENCE-OF-CEILING-HEIGHT-IN-THERMAL-COMFORT-Guimar%C3%A3es-Carvalho/0e8a73bfa41534212797ee0fd042d0c06fce1b41 (accessed June 19, 2013).
30
Hall C. M. Ram Y. (2018). Walk score® and its potential contribution to the study of active transport and walkability: a critical and systematic review. Transp. Res. Part D Transp. Environ.61, 310–324. doi: 10.1016/j.trd.2017.12.018
31
Hamedinger A. Dumke H. (2013). Energie im urbanen Raum: Empirische Zwischenergebnisse des Governance-Moduls (Projekt ENUR). Verlag: NWV Neuer Wissenschaftlicher Verlag, 21–34.
32
Handy S. L. (1996). Urban form and pedestrian choices: study of Austin neighborhoods. Transp. Res. Rec.1552, 135–144. doi: 10.1177/0361198196155200119
33
Handy S. Paterson R. G. Butler K. S. (2003). Planning for street connectivity: getting from here to there. Chicago, IL: American Planning Association.
34
Haupt W. Chelleri L. van Herk S. Zevenbergen C. (2020). City-to-city learning within climate city networks: definition, significance, and challenges from a global perspective. Int. J. Urban Sustain. Dev.12, 143–159. doi: 10.1080/19463138.2019.1691007
35
Hillier B. Hanson J. (1989). The social logic of space. Cambridge: Cambridge University Press.
36
ISO . (2005). ISO. Available online at: https://www.iso.org/standard/39155.html (accessed June 19, 2025).
37
Jendritzky G. de Dear R. Havenith G. (2012). UTCI—why another thermal index?Int. J. Biometeorol.56, 421–428. doi: 10.1007/s00484-011-0513-7
38
Jia J. Zhang K. Liu H. Zlatanova S. (2024). A framework supporting green stormwater management for urban designers. J. Environ. Manag.370:122650. doi: 10.1016/j.jenvman.2024.122650
39
Jia J. Zlatanova S. Liu H. Aleksandrov M. Zhang K. (2023). A design-support framework to assess urban green spaces for human wellbeing. Sustain. Cities Soc.98:104779. doi: 10.1016/j.scs.2023.104779
40
Johansson E. Emmanuel R. (2006). The influence of urban design on outdoor thermal comfort in the hot, humid city of Colombo, Sri Lanka. Int. J. Biometeorol.51, 119–133. doi: 10.1007/s00484-006-0047-6
41
Kempenaar A. van den Brink M. van Dijk T. Laeni N. (2025). Bridging differences by design: competencies and individual characteristics of boundary-spanning spatial designers in urban climate adaptation planning. J. Urban Des.30, 295–314. doi: 10.1080/13574809.2024.2376682
42
Li X. Zhang C. Li W. Kuzovkina Y. A. (2016). Environmental inequities in terms of different types of urban greenery in Hartford, Connecticut. Urban For. Urban Green.18, 163–172. doi: 10.1016/j.ufug.2016.06.002
43
Linhares de Siqueira G. (2015). Klimaadaptive Entwurfsmethodik: eine Untersuchung der Wechselwirkung zwischen Klimadaten, klimagerechten Entwurfsmethoden und dem adaptiven Komforttmodell. Hamburg: HafenCity Universität Hamburg.
44
Ma J. Cheng J. C. P. (2016). Estimation of the building energy use intensity in the urban scale by integrating GIS and big data technology. Appl. Energy183, 182–192. doi: 10.1016/j.apenergy.2016.08.079
45
Malfroy S. Caniggia G. (2021). A morphological approach to cities and their regions. Zurich: Zurich University of Applied Sciences and Art (ZHAW), Department of Architecture, Design and Civil Engineering, Institute Urban Landscape.
46
Mauree D. Naboni E. Coccolo S. Perera A. T. D. Nik V. M. Scartezzini J. L. (2019). A review of assessment methods for the urban environment and its energy sustainability to guarantee climate adaptation of future cities. Renew. Sust. Energ. Rev.112, 733–746. doi: 10.1016/j.rser.2019.06.005
47
Meerow S. Newell J. P. Stults M. (2016). Defining urban resilience: a review. Landsc. Urban Plan.147, 38–49. doi: 10.1016/j.landurbplan.2015.11.011
48
Meerow S. Pajouhesh P. Miller T. R. (2019). Social equity in urban resilience planning. Local Environ.24, 793–808. doi: 10.1080/13549839.2019.1645103
49
Munonye W. C. Ajonye G. O. (2025). Energy-driven circular design in the built environment: rethinking architecture and infrastructure. Front Sustain Cities7:156932. doi: 10.3389/frsc.2025.1569362/full
50
Nasir D. S. N. M. Hughes B. R. Calautit J. K. Aquino A. I. Shahzad S. (2017). Effect of urban street canyon aspect ratio on thermal performance of road pavement solar collectors (RPSC). Energy Procedia105, 4414–4419. doi: 10.1016/j.egypro.2017.03.936
51
Ng E. (2009). Policies and technical guidelines for urban planning of high-density cities – air ventilation assessment (AVA) of Hong Kong. Build. Environ.44, 1478–1488. doi: 10.1016/j.buildenv.2008.06.013
52
Nguyen T. K. P. Korkina E. V. (2021). Connectivity of the window to floor area ratio and the daylighting assessment criteria. Iran. J. Sci. Technol. Trans. Civ. Eng.45, 2035–2045. doi: 10.1007/s40996-021-00681-0
53
Norton B. A. Coutts A. M. Livesley S. J. Harris R. J. Hunter A. M. Williams N. S. G. (2015). Planning for cooler cities: a framework to prioritise green infrastructure to mitigate high temperatures in urban landscapes. Landsc. Urban Plan.134, 127–138. doi: 10.1016/j.landurbplan.2014.10.018
54
Oke T. R. (1988). Street design and urban canopy layer climate. Energ. Buildings11, 103–113. doi: 10.1016/0378-7788(88)90026-6
55
Ong B. L. (2003). Green plot ratio: an ecological measure for architecture and urban planning. Landsc. Urban Plan.63, 197–211. doi: 10.1016/S0169-2046(02)00191-3
56
Patel N. Jänicke B. Burghardt R. Vulova S. Otto F. (2025). Assessing progress in urban climate adaptation: a review of indicators for heat- and water-sensitive urban development. Climate Resilience Sustainability4:e70009. doi: 10.1002/cli2.70009
57
Peng L. Wang Y. Yang L. Garschagen M. Deng X. (2024). A comparative analysis on flood risk assessment and management performances between Beijing and Munich. Environ. Impact Assess. Rev.104:107319. doi: 10.1016/j.eiar.2023.107319
58
Peng Y. Yang L. E. Scheffran J. Jiang P. Azadi H. (2024). Assessing and enhancing the regional sustainability of electricity generation technologies in an energy-importing megaregion in China. Sustain Energy Technol Assess65:103737. doi: 10.1016/j.seta.2024.103737
59
Pérez-Lombard L. Ortiz J. Pout C. (2008). A review on buildings energy consumption information. Energ. Buildings40, 394–398. doi: 10.1016/j.enbuild.2007.03.007
60
Pierce J. R. Costadone L. Mannetti L. Morpurgo J. Green C. E. Halder M. D. et al . (2024). Urban nature indexes tool offers comprehensive and flexible approach to monitoring urban ecological performance. NPJ Urban Sustain.4:22. doi: 10.1038/s42949-024-00143-2
61
Ratti C. Baker N. Steemers K. (2005). Energy consumption and urban texture. Energ. Buildings37, 762–776. doi: 10.1016/j.enbuild.2004.10.010
62
Ratti C. Raydan D. Steemers K. (2003). Building form and environmental performance: archetypes, analysis and an arid climate. Energ. Buildings35, 49–59. doi: 10.1016/S0378-7788(02)00079-8
63
Reicher C. (2016). Städtebauliches Entwerfen [Internet]. Wiesbaden: Springer Fachmedien.
64
Reimuth A. Hagenlocher M. Yang L. E. Katzschner A. Harb M. Garschagen M. (2023). Urban growth modeling for the assessment of future climate and disaster risks: approaches, gaps and needs. Environ. Res. Lett.19:013002. doi: 10.1088/1748-9326/ad1082
65
Rossi A. (1984). The architecture of the City. London: MIT Press, 216.
66
Roudsari MS Pak M . (2013). LADYBUG: A parametric environmental plugin for grasshopper to help designers create an environmentally-conscious design. Available online at: https://www.aivc.org/resource/ladybug-parametric-environmental-plugin-grasshopper-help-designers-create-environmentally (accessed June 19, 2025).
67
Santamouris M. (2014). Cooling the cities – a review of reflective and green roof mitigation technologies to fight heat island and improve comfort in urban environments. Sol. Energy103, 682–703. doi: 10.1016/j.solener.2012.07.003
68
Santamouris M. (2015). Regulating the damaged thermostat of the cities—status, impacts and mitigation challenges. Energ. Buildings91, 43–56. doi: 10.1016/j.enbuild.2015.01.027
69
Schoetter R. Grawe D. Hoffmann P. Kirschner P. Grätz A. Schlünzen K. H. (2013). Impact of local adaptation measures and regional climate change on perceived temperature. Meteorol. Z.22, 117–130. doi: 10.1127/0941-2948/2013/0381
70
Shao J. (1990). Calculation of sunshine duration and saving of land use in urban building design. Energ. Buildings15, 407–415. doi: 10.1016/0378-7788(90)90015-B
71
Sharifi A. (2019). Urban form resilience: a meso-scale analysis. Cities93, 238–252. doi: 10.1016/j.cities.2019.05.010
72
Shi Z. Fonseca J. A. Schlueter A. (2017). A review of simulation-based urban form generation and optimization for energy-driven urban design. Build. Environ.121, 119–129. doi: 10.1016/j.buildenv.2017.05.006
73
Shi Z. Fonseca J. A. Schlueter A. (2021). A parametric method using vernacular urban block typologies for investigating interactions between solar energy use and urban design. Renew. Energy165, 823–841. doi: 10.1016/j.renene.2020.10.067
74
Song Y. Knaap G. J. (2004). Measuring urban form: is Portland winning the war on sprawl?J. Am. Plan. Assoc.70, 210–225. doi: 10.1080/01944360408976371
75
Song Y. Knaap G. J. (2007). Quantitative classification of neighbourhoods: the neighbourhoods of new single-family homes in the Portland metropolitan area. J. Urban Des.12, 1–24. doi: 10.1080/13574800601072640
76
Steemers K. (2003). Energy and the city: density, buildings and transport. Energ. Buildings35, 3–14. doi: 10.1016/S0378-7788(02)00075-0
77
Tregenza P. Wilson M. P. (2011). Daylighting: Architecture and lighting design. London: Psychology Press.
78
U. N (2025). Global status report for buildings and construction 2024/2025. London: UNEP - UN environment Programme.
79
Yang L. Heinzel C. (2024). Klimarisiko und Resilienzstrategien in China. Geogr. Rundsch.5, 26–29. Available online at: https://www.westermann.de/anlage/4665052/Klimarisiko-und-Resilienzstrategien-in-China
Summary
Keywords
urban design, climate resilience, governance, spatial indicators, urban typology
Citation
Feng W, Yang LE, Zeng F, Jia J, Zhang H and Wu Z (2025) Enabling urban climate resilience through integrated optimization of urban design. Front. Sustain. Cities 7:1657008. doi: 10.3389/frsc.2025.1657008
Received
30 June 2025
Accepted
02 October 2025
Published
17 October 2025
Volume
7 - 2025
Edited by
Andrew Paul Kythreotis, University of Lincoln, United Kingdom
Reviewed by
Alysha Helmrich, University of Georgia, United States
Nisha Patel, University of Kassel, Germany
Updates
Copyright
© 2025 Feng, Yang, Zeng, Jia, Zhang and Wu.
This is an open-access article distributed under the terms of the Creative Commons Attribution License (CC BY). The use, distribution or reproduction in other forums is permitted, provided the original author(s) and the copyright owner(s) are credited and that the original publication in this journal is cited, in accordance with accepted academic practice. No use, distribution or reproduction is permitted which does not comply with these terms.
*Correspondence: Wenhan Feng, wenhan.feng@geographie.uni-muenchen.de; Liang Emlyn Yang, emlyn.yang@lmu.de
Disclaimer
All claims expressed in this article are solely those of the authors and do not necessarily represent those of their affiliated organizations, or those of the publisher, the editors and the reviewers. Any product that may be evaluated in this article or claim that may be made by its manufacturer is not guaranteed or endorsed by the publisher.