 Opeyemi Aniramu1*
 Oluwagbenga Orimoogunje2
- 1Institute of Ecology and Environmental Studies, Obafemi Awolowo University, Ife, Nigeria
- 2Department of Geography, Obafemi Awolowo University, Ife, Nigeria
The study involved the identification of urban flood-prone areas, followed by surface inundation mapping and the development of strategic flood solutions using an integrated approach. Digital elevation modeling of the satellite images and Sentinel-2 data, along with spatial rainfall data, was integrated for assessing spatial flood vulnerability using a Geographic Information System (GIS) approach. In addition, questionnaires were administered to participants on 40 elements outlined in the SWOT survey instrumentation, and responses were analyzed. The findings revealed high flood vulnerability in the study area, particularly the densely populated metropolitan areas with inadequate drainage infrastructure. Rainfall patterns during the June–July–August (JJA) and September–October–November (SON) periods were linked to flood frequency and high surface inundation, highlighting the need for early warning systems and drainage improvements. The Strengths, Weaknesses, Opportunities, and Threats-Analytic Hierarchy Process (SWOT-AHP) framework highlighted flood strategies across four thematic pillars: environment (0.45), legal and institutional (0.22), socio-economic (0.16), and urban engineering (0.16). Strategic alternatives were ranked based on global weight values and categorized into short-term strategies focused on critical infrastructure and evacuation planning. Mid-term priorities included green infrastructure and smart monitoring systems, while long-term strategies emphasized sustainable urban planning and regulatory enforcement. The findings also underscore the need for a more integrated policy implementation, community engagement, and improved investment on adaptive infrastructure to reduce flood risk. The structured decision-support tool suggested proactive, sustainable, and inclusive flood resilience strategies for stakeholders.
1 Introduction
Among natural hazards, floods account for nearly 90% of water-related disasters, affecting billions of people and costing hundreds of billions in damages (United Nations International Strategy for Disaster Reduction, 2022). The situation is particularly dire in developing nations, where rapid urbanization, inadequate infrastructure, and climate change exacerbate flood risks (Nigeria Hydrological Service Agency, 2024). According to the United Nations Environment Program (2022), over 592,000 individuals across at least 10 countries in the West African sub-region were impacted by floods in 2021. Meanwhile, unaccounted costs of flood disaster on human capital resources remain a challenge in the global south (United Nations Office for Disaster Reduction, 2023).
Lagos, Africa’s largest coastal megacity, faces acute flood vulnerability due to its low-lying geography, rapid population growth, and insufficient drainage systems (Ibeabuchi, 2023). Annual floods disrupt livelihoods (Oguntola, 2022), damage property, and spread waterborne diseases (Abdel-Karim et al., 2020). The 2022 floods alone displaced over 100,000 residents and caused estimated economic losses exceeding $4 billion (Lawanson et al., 2023). Poor urban planning has compounded these challenges (Aliyu et al., 2023), with many informal settlements infringing natural flood buffers, which have been degraded by human activity (Kasim et al., 2022).
Sustainable flood risk management is a key element in broader water resource utilization and disaster risk reduction effort in Africa (Ndimele et al., 2024). Perception knowledge system related to flood controls focus solely on structural measures, including drainage system adequacy, flood planning, and immediate mitigation or infrastructure development (Odunsi et al., 2024). A paradigm shift toward integrated flood risk management is required (Ogato et al., 2020; Aliyu et al., 2023; Nghiningwa et al., 2025), which will combine urban infrastructure solutions with community-based approaches and spatial knowledge of urban flood dynamics in the coastal settlement of Lagos State, Nigeria.
This study elucidates integrated methods that focus on participatory flood risk management using local knowledge and technical expertise to offer sustainable flood solutions. Studies in similar coastal cities demonstrated that involving residents in flood mapping and early warning systems improves preparedness and reduces vulnerability (Gregory and Gerald, 2020; Faccini et al., 2021). However, developing countries encounter serious challenges in flood vulnerability monitoring and sustainable solutions (Orimmogunje et al., 2016; Adelekan and Asiyanbi, 2016; Anifowose and Rollason, 2024). In fact, the adoption of traditional top-down flood risk management has failed in the coastal or riverine city of Lokoja-Benue trough of Nigeria (Osayomi et al., 2022). Ghorbani et al. (2022) highlighted the relevance of the SWOT framework combined with AHP to prioritize community-informed flood adaptation strategies (Ezugwu and Okpoko, 2025). Previous studies explored the SWOT technique to analyze coordinated development of water diversion projects (Long et al., 2021), evaluated irrigation systems to meet social and environmental demands (Katirtzidou et al., 2023), and assessed the productivity strategies of an industrial company (Popescu and Gasparotti, 2022). Data inadequacies were encountered during the monitoring of the disastrous impact of rainfalls and river floods (Tramblay et al., 2020), necessitating local perspectives and knowledge systems for flood risk management planning. This study examines sustainable flood solutions by integrating Participatory Geographic Information Systems (PGIS) into Perception Knowledge System (PKS) through a combined SWOT-AHP analytical framework, addressing urban flood vulnerability and resilience in Lagos, a megacity in Nigeria.
Developing a robust flood solution requires a more in-depth analysis, emphasizing an inclusive perception of sustainable flood management and the importance of a participatory approach that embraces diverse viewpoints (Das, 2020). This method, however, has not been fully explored in previous attempts or remains underutilized in urban flood resilience and disaster reduction efforts in many African flood-prone cities. The adoption of the AHP, a multicriteria decision-making tool, aims to improve the SWOT model and quantify stakeholder preferences through weighted criteria ranking. This study is novel in that it integrates PGIS, PKS, and SWOT-AHP to create context-specific urban flood solutions. It takes into account the recurring urban flooding and the challenges posed by existing flood control measures in the coastal megacity of Lagos State, Nigeria. This study addresses these gaps by investigating the following:
(a) How can PGIS effectively identify flood-prone areas, facilitating local knowledge on appropriate flood mitigation?
(b) How can flood inundation mapping contribute to community knowledge levels, enhancing urban flood preparations for all stakeholders?
(c) How can the SWOT-AHP framework help evaluate, prioritize, and improve flood resilience options for sustainable flood solutions?
The study was tailored keeping in mind the following specific objectives:
i. To apply PGIS in identifying flood-prone areas and gathering community knowledge for context-relevant flood mitigation strategies.
ii. To generate and analyze flood inundation maps that enhance community awareness, preparedness, and stakeholder engagement in urban flood resilience planning.
iii. To integrate the SWOT-AHP framework in evaluating and prioritizing flood resilience options, thereby developing sustainable, data-driven, and locally appropriate solutions.
This study is crucial for developing a structural methodology that enhances flood resilience through inclusive, appropriate urban planning and the use of sustainable resilience frameworks. The study contributes to the growing discourse on participatory environmental governance by demonstrating the value of bottom-up approaches in addressing complex urban flood challenges. This approach allows vulnerable community members and stakeholders to directly engage in mapping, problem-solving, analyzing unique flood experiences, and implementing appropriate coping strategies with timely solutions. The participatory spatial data and perception knowledge become contextualized, addressing urban flood dynamics, which is often lacking in formal planning processes. The study particularly examines how these approaches can contribute to achieving Sustainable Development Goals (SDGs) in Nigeria’s vulnerable coastal regions.
2 Method
2.1 The study area: Lagos State
Lagos State, a coastal megacity, is situated on the shallow floodplain of the Bight of Benin in southwestern Nigeria (Figure 1) and is bordered on the south by the Atlantic Ocean. It occupies a geographic area between latitudes 6° 22′ to 6° 42′ N and longitude 2° 42′ to 4° 22′ E. Lagos has experienced rapid population growth over the years, with its population expanding from 305,000 inhabitants in 1950 to 9.1 million in 2006, according to the National Population Commission (2006). The United Nations World Urbanization Prospects projected a staggering 26 million people by 2025. Remarkably, a significant proportion of this population resides within the boundaries of the water basins, particularly in the central and eastern mainland areas. Similarly, the bulk of the population density is clustered within the Lagos Metropolitan Area of the 16 Local Government Areas (LGAs), while Epe, Ibeju-Lekki, Badagry, and Ikorodu are considered suburban (Aliu and Ajala, 2014). Meanwhile, a significant proportion of the urban dwellers resides within the boundaries of the water basins and the Atlantic Ocean coastline. These vulnerable areas are mostly affected by severe flooding, posing a risk to both people and infrastructure (Oladipo, 2023). The landscape of Lagos is typically flat, with certain locations within Lagos State, such as the entire Lagos southern area, exhibiting a varying lowest altitude of around 23 meters, with the highest elevation point of 73 meters above sea level in Ifako-Ijaiye, west of Lagos State (Adeaga et al., 2020).
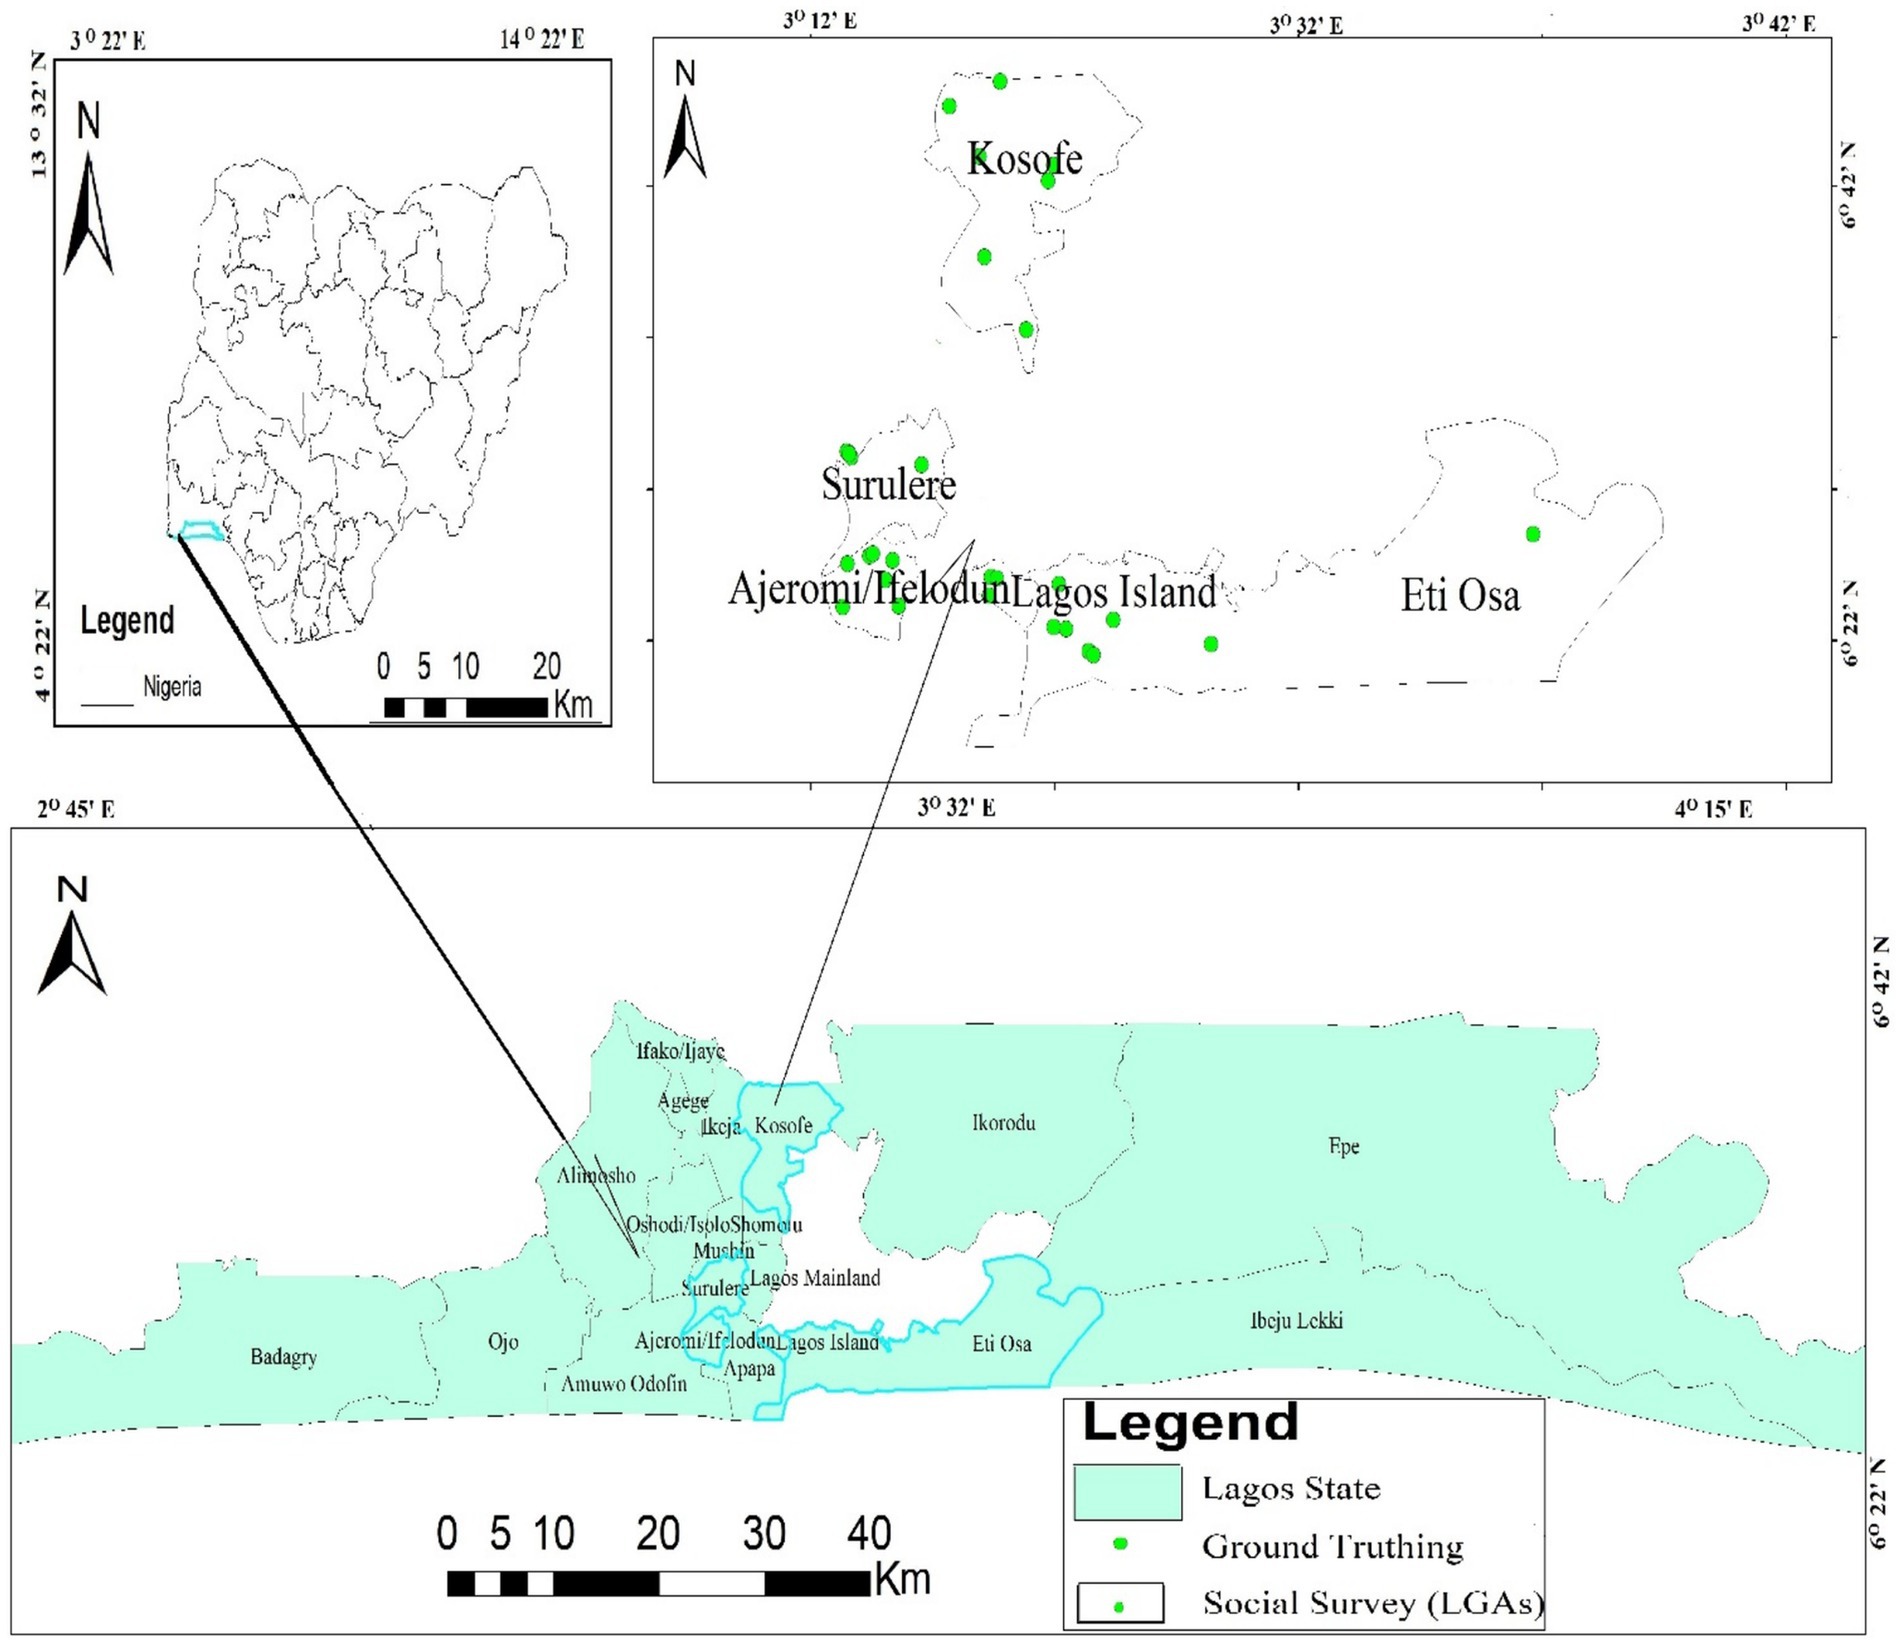
Figure 1. Map of the Lagos State, Nigeria.
The Nigeria Hydrological Services Agency (NIHSA) presented its Annual Flood Outlook (AFO) for 2024, noting that 148 LGAs in 31 states of the federation fall within the high flood risk areas, while 249 LGAs fall within the moderate flood risk areas. Major parts of Lagos State were classified under the high-risk area, including Agege, Alimosho, Ikorodu, Lagos Island, Ikeja, and Eti-Osa, while other LGAs were classified under moderate flood risk.
2.2 Survey design
The study assessed the knowledge of residents in communities on early warning systems and flood control through a SWOT-AHP experiment. Initially, participants were introduced to the four key aspects of the SWOT model to enhance existing flood solution strategies. They were also educated on the causes, frequency, and severity of floods due to climate change. Furthermore, it was noted that the rainfall pattern in the megacity has intensified, and the existing urban drainage systems are insufficient to address current challenges. Lastly, discussions were held on how to mitigate future floods and reduce damages through an integrated resilience approach that includes immediate, mid-term, and long-term goals.
The study utilized mixed methodologies, incorporating a structured questionnaire for both respondents and key informants. Copies of questionnaires were administered in person as well as offline, using Open Data Kit (ODK). Purbasari et al. (2021) described ODK as a modern open tool compatible with smartphones, which has proven useful in qualitative and quantitative studies. The SWOT assessment on sustainable flood solutions consisted of 40 statements, with 10 statements each under “strengths, weaknesses, opportunities, and threats.” Participants ranked their responses on a scale of 1 to 5, indicating the weakest to strongest agreement metric. The SWOT elements provided insights into existing flood resilience strategies and areas requiring improvement.
2.3 Sampling method
The study identified five highly vulnerable flood zones in Lagos State (Lagos State Emergency Management Agency, 2023) based on factors such as spatial flood vulnerability, population density, and socio-economic status. The study selected five LGAs (Ajeromi/Ifelodun, Eti-Osa, Kosofe, Lagos Island, and Surulere) that met the highlighted criteria. Participants were drawn from vulnerable communities identified in reports by Lagos State Emergency Management Agency (2023) and the Nigeria Hydrological Service Agency (2024). Systematic intervals were used to select streets and vulnerable houses in the flood zones, while systematic random sampling was employed to administer copies of the questionnaire to respondents in the selected communities. Key informant officials (KIO), including local community leaders and government officials, were also engaged with for questionnaire administration either online or through physical contact.
A total of 400 out of 1,597 households in the selected flood communities were surveyed, representing 25% of the vulnerable households in the area. The study used the Yamane (1967) formula to calculate the sample size at a confidence level of 0.05. A total of 398 copies of questionnaires were successfully retrieved from the residents at a response rate of 99.5%. As represented in the formula expressed in Equation 1.
Similarly, 15 key informant interview (KII) participants were contacted, including 6 executive officers from the Ministry of Environment and Water Resources, 5 community leaders from the selected LGAs, and 2 senior officers of the State Emergency Management Agency, as well as 1 representative each from the Waste Management Agency and Lagos Resilience Strategy Agency. Geographic coordinates of the observed urban flooding were collected using a handheld-GPS (Garmin 64 s) for ground-truthing purposes.
2.4 Spatial rainfall mapping and flood inundation knowledge
This study aimed to gather information on the spatial pattern of urban vulnerability and rainfall-related flood issues through GIS-mapping of Lagos megacity. The objectives were to map rainfall during transitional seasons for flood warning systems and simulate surface inundation through floodwater recession duration in urban impervious areas. Satellite imagery from the Shuttle Radar Topographic Mission-Digital Elevation Model (SRTM-DEM), obtained from the United States Geological Survey (USGS) was used for spatial vulnerability analysis. The boundary of the study area and features were overlaid on the DEM imagery to mark the study area extent using the ArcGIS Spatial Analyst tool.
Similarly, drainage basin and flow accumulation patterns were generated for the surface flood scenarios, and impacts were assessed. The DEM was used to create basin and sub-basin using the hydrological tool in ArcMap 10.8 software, extracting the flow direction grid, flow accumulation, stream order, and basin delineation. The DEM image was processed with sink filling to derive flow direction and accumulation. Basin delineation and sub-basins were generated for the watershed.
Sentinel-2 imagery data were used to classify the extent of land coverage, including vegetation, waterbodies, and built-up structures within the study area. The mosaic function was applied to merge multiple imagery scenes into a seamless raster layer covering the entire study area. The study followed the standard method described by Jensen (1996) to classify Land Use Land Cover (LULC), aiming to understand the urbanization trend through the assessment of spatial flood dynamics of vegetated versus non-vegetated areas. The Maximum Likelihood Classification (MLC) algorithm was employed in ArcGIS, given its widespread use and effectiveness in satellite image classification (Gowtham and Dhanapriya, 2025). Surface inundation zones were derived using the DEM, and the raster was overlaid on the delineated urban area to extract vulnerable regions, while different flood run-off times were simulated.
The study utilized gridded climate data and a base map of Lagos State for interpolation processing operations. Spatial rainfall data from the Climate Hazards Group InfraRed Precipitation with Station (CHIRPS) was obtained to monitor the spatial rainfall-flood relationship. These high-resolution gridded data were multivariate, time-series with variations in rainfall patterns covering the transitional seasons of rainfall in the study area. CHIRPS data was opted for due to its advantages for the study area, including high resolution (~5 km) and long-term record (1981 to near-present), and incorporation of station data to improve accuracy over other satellite-only products like Global Precipitation Measurement (GPM) or Tropical Rainfall Measuring Mission (TRMM), which are typically shorter in duration. In addition, CHIRP data is widely considered one of the best rainfall datasets for climate and flood studies, especially in regions such as Nigeria, where gauge networks are sparse or inconsistent. Hence, CHIRPS rainfall data for specific high rainfall years between January 1981 and December 2023 were collected for hydroclimatic analysis.
However, the rainfall pattern in Lagos State has phases: rainfall onset from April to July, break in August, and the second rainfall peak from September to October. This periodic transitional season reflected 3-month rainfall data acquired for spatial rainfall interpolation. Before analysis, preprocessing operations were conducted to convert spatial rainfall data into a common Geographic Tagged Image File Format (GeoTIFF), and it was georeferenced to a common resolution of WGS-UTM zone 31 using the ArcMap 10.8 software. The Nearest Neighbor resampling technique was used for spatial grids, while Inverse Distance Weight (IDW) interpolation was utilized as a spatial analyst tool. Results on spatial rainfall data were generated for the periodic transitional season of rainfall-related flood occurrence in the study area.
2.5 Ethical statement and informed consent
This study was conducted according to ethical standards and approved protocols. Ethical approval was obtained from the Departmental Review Board of Post-Graduate Studies, Obafemi Awolowo University Research Ethics Committee, as part of the propositional seminar. Informed consent was obtained from human participants before their participation in the study, as outlined in the administered questionnaires. The study adhered to all relevant national and institutional guidelines for studies involving human participants and field survey processes. Data collection was conducted by the authors over 6 months (June 2024–December 2024) in the study area. Figure 2 presents the conceptual methods and details of the data used in the study.
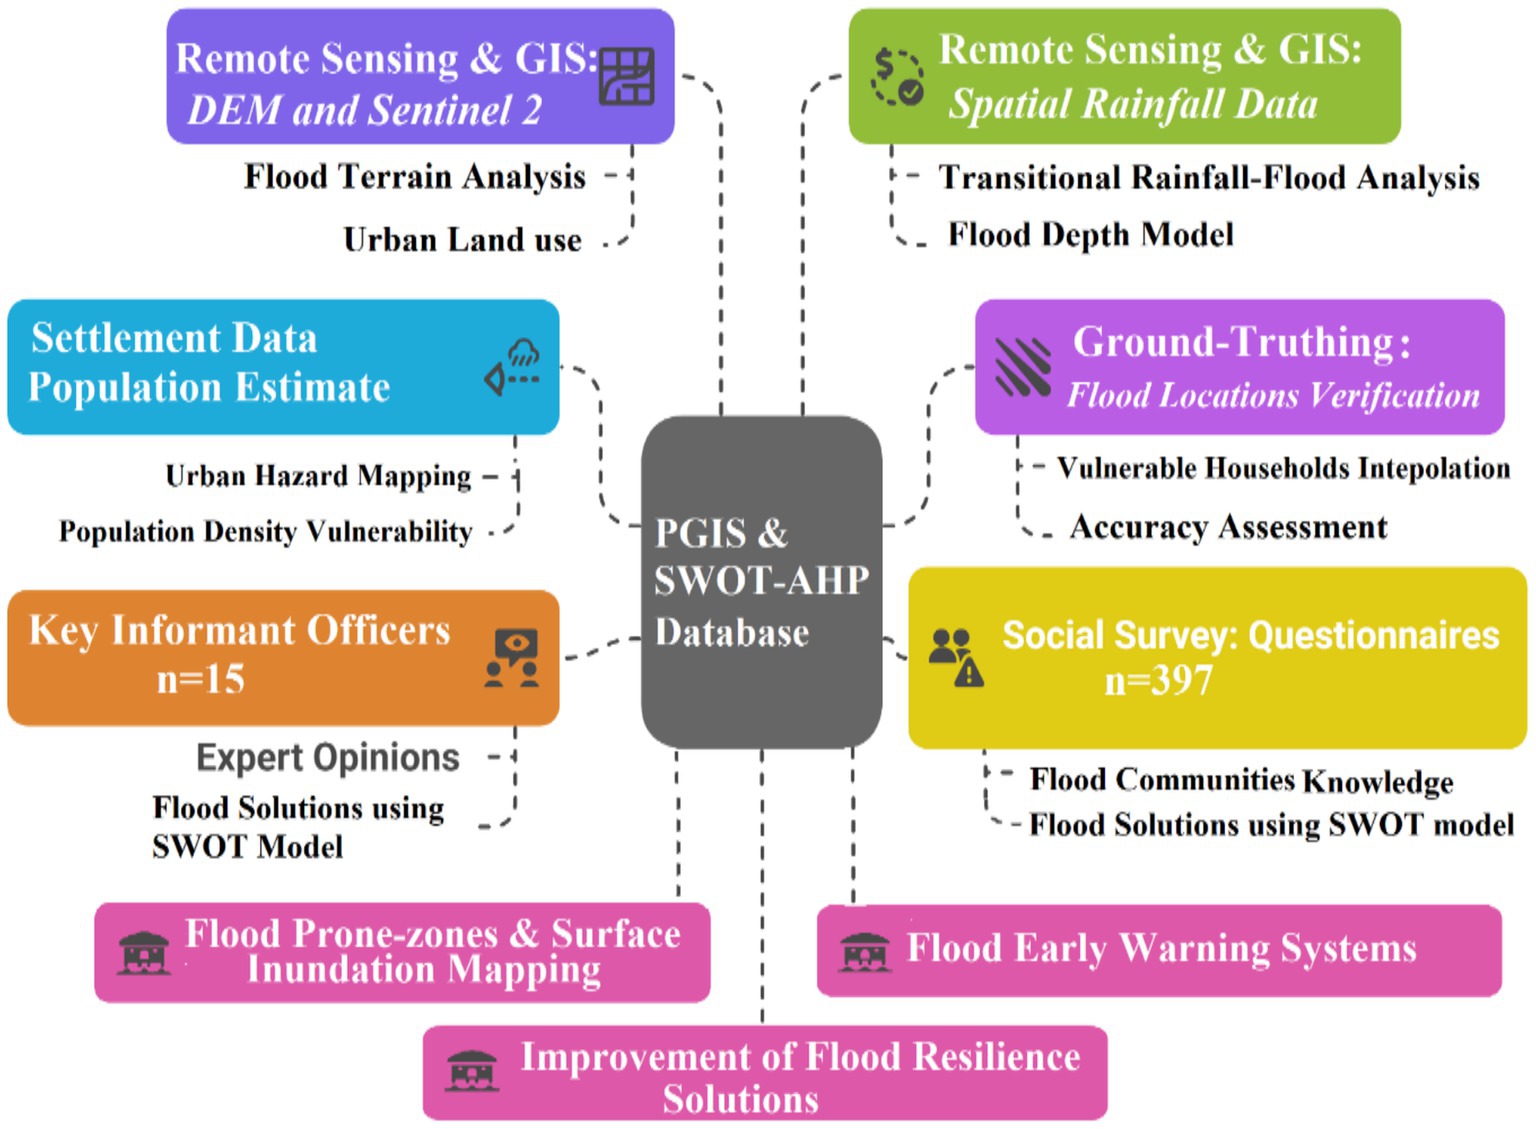
Figure 2. Methodological flow chat of the study.
3 Data analysis
3.1 Demographic analysis of respondents
The data collected through the questionnaires on flood solutions were analyzed using descriptive statistics. The demographic and socio-economic characteristics of the community residents are shown in Table 1. Most of the respondents were male (57.7%), while 42.3% were female. Respondents aged between 31 and 45 years accounted for 34.8% and approximately 47% of respondents were between the ages of 46 and 59 years, making up a larger portion of the total respondents. In terms of marital status, the majority of respondents identified themselves as married (62.5%). A significant proportion of the well-educated respondents (74.8%) had tertiary education, while 21.9% possessed postgraduate education. Approximately 84% were employed, which reflected the income status of the respondents. The majority (38.4%) of respondents had resided within their local communities for 11–15 years, while 33.2% had lived in their communities for about 16–20 years.
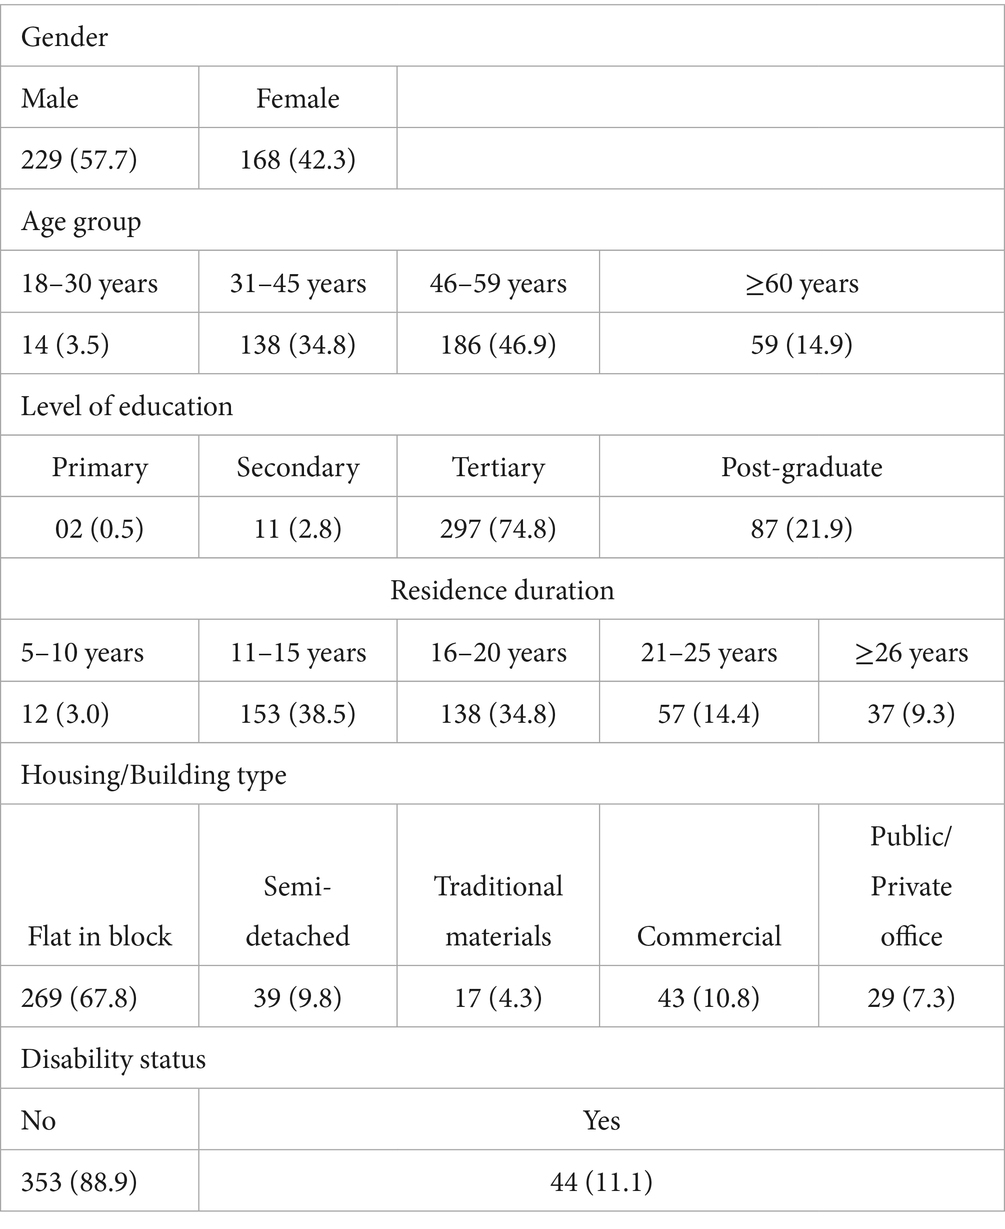
Table 1. Social and demographic characteristics of community residents.
Most respondents (67.8%) resided in flats in blocks, and the others lived in semidetached houses (9.8%), houses made of traditional materials (4.3%), commercial buildings (10.8%), and office buildings (7.3%). The age of the buildings was distributed as follows: less than 5 years (1.0%), 5 to 10 years (19.4%), 11 to 20 years (28%), 21 to 30 years (34%), and 31 years and above (17.6%). When considering disability status, the majority (88.9%) had no disability while 11.1% reported various levels of disability. Respondents demonstrated good knowledge of urban flooding, providing valuable responses on flood impacts, mitigating measures, and intervention schemes. The significant sociodemographic attributes indicated that the majority of respondents were mature, adult, well-educated men.
3.2 SWOT analysis
The SWOT analysis serves as an analytical tool to determine the strengths, weaknesses, opportunities, and threats of urban flood solutions. This study developed a distinct method similar to the studies of Ghazinoory et al. (2011) and Nathaniel et al. (2023), where each questionnaire targeted the participants’ responses to gain a thorough understanding of the statement in the SWOT questionnaire. The study analyzed the perception of the SWOT Index for each variable obtained by calculating the Summation Weight Value (SWV) for each attribute (variable) using frequency data. As represented in the formula expressed in Equation 2:
where Total Weighted Value (TWV) is the Summed Weighted Value (SWV) for each of the 10 questions, Pi is the number of respondents choosing a particular rating, and Vi is the weight assigned to rating i. The PSI for each variable was obtained by dividing the SWV by the total number of the respondents to each of the five ratings of a question. As represented in the formula expressed in Equation 3:
where SWOTperception is the perception index. It must be noted that the closer the SWOTperception of a question (variable) is to 5, the higher is the assumed significance of the SWOT index. The mean of Pi was also computed with the aim of calculating the mean value of each attribute (variable), their variance and standard deviation (SD). A total of 412 responses were analyzed from participants (community residents and KIIs) to obtain comprehensive flood knowledge. Table 2 reveals the summation and mean values of the SWOT Index (see Figures 3, 4 for more details on the SWOT elements), and coefficients of variation have also been presented.
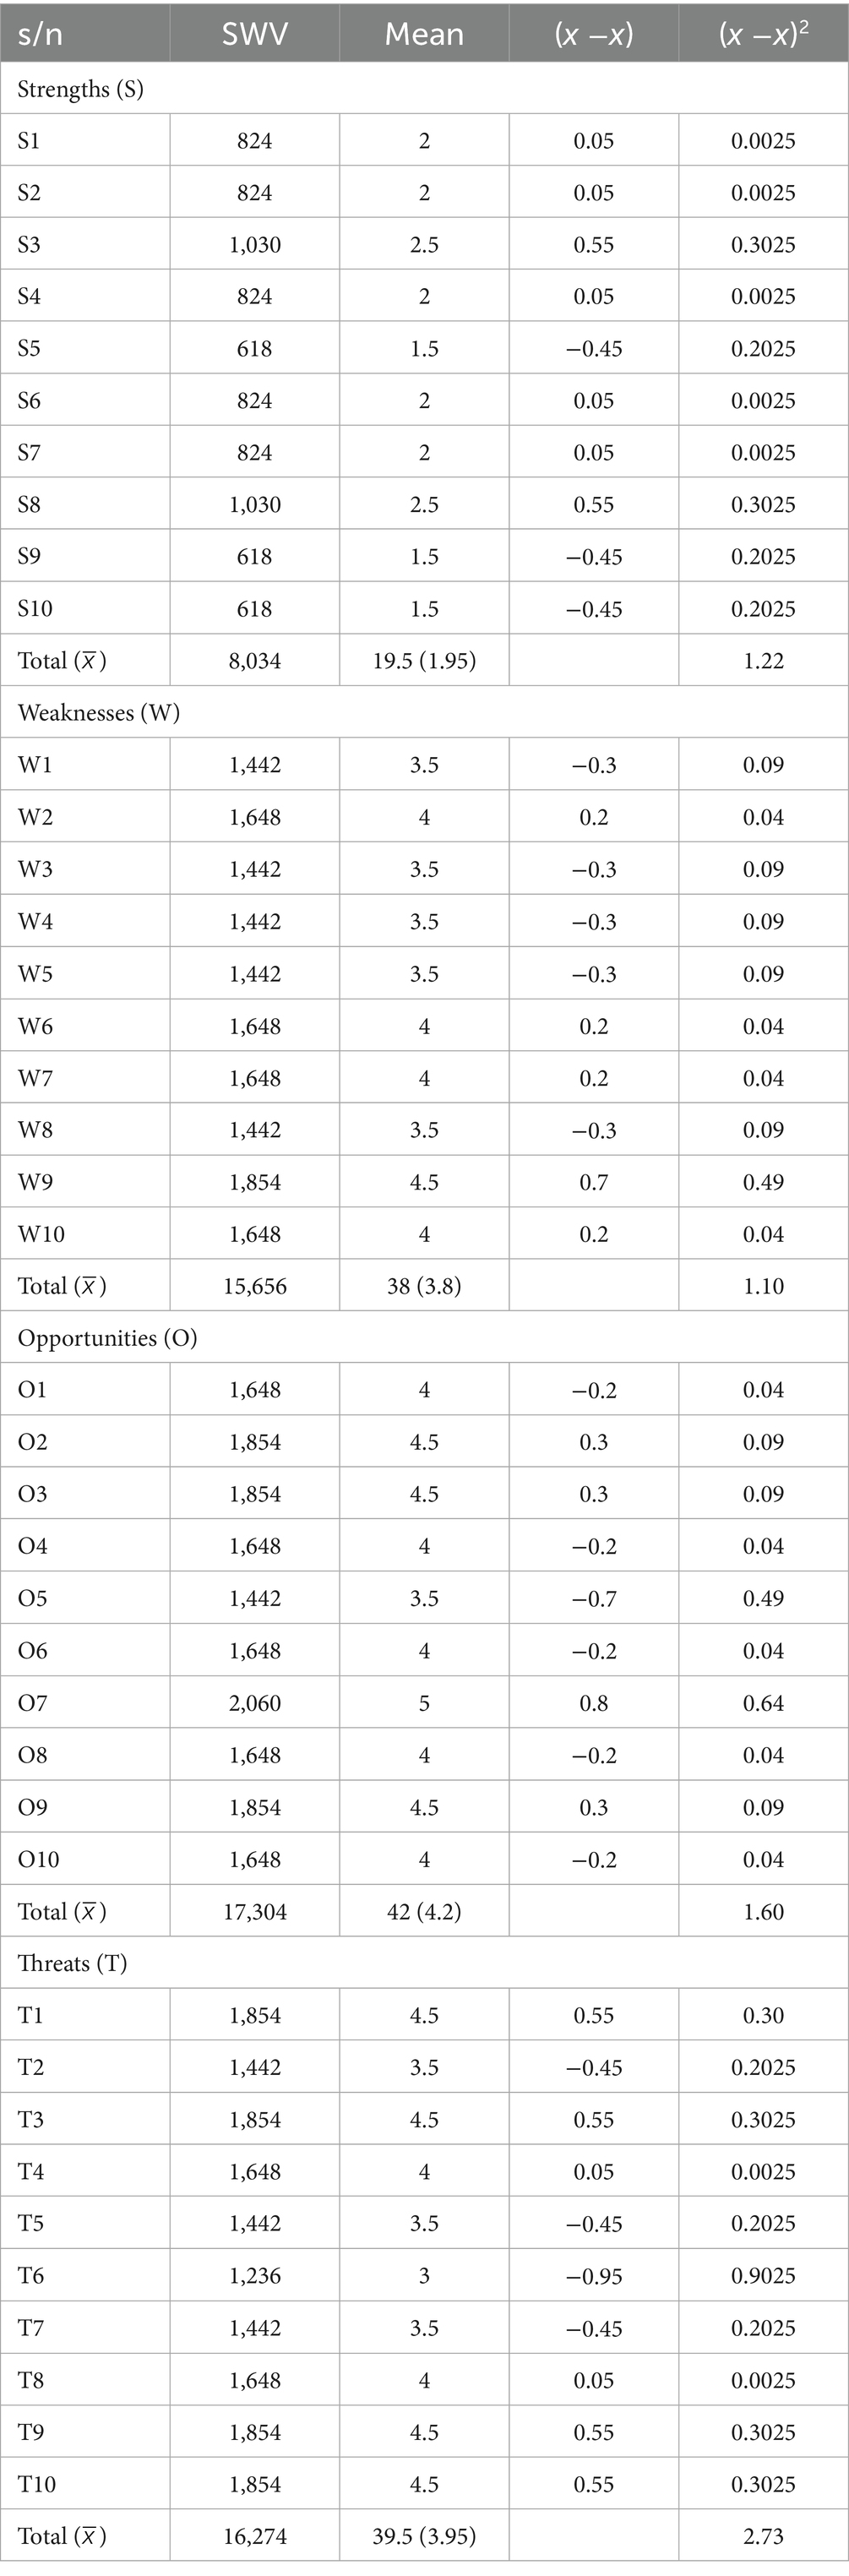
Table 2. Summary of SWOT model for flood control strategies.
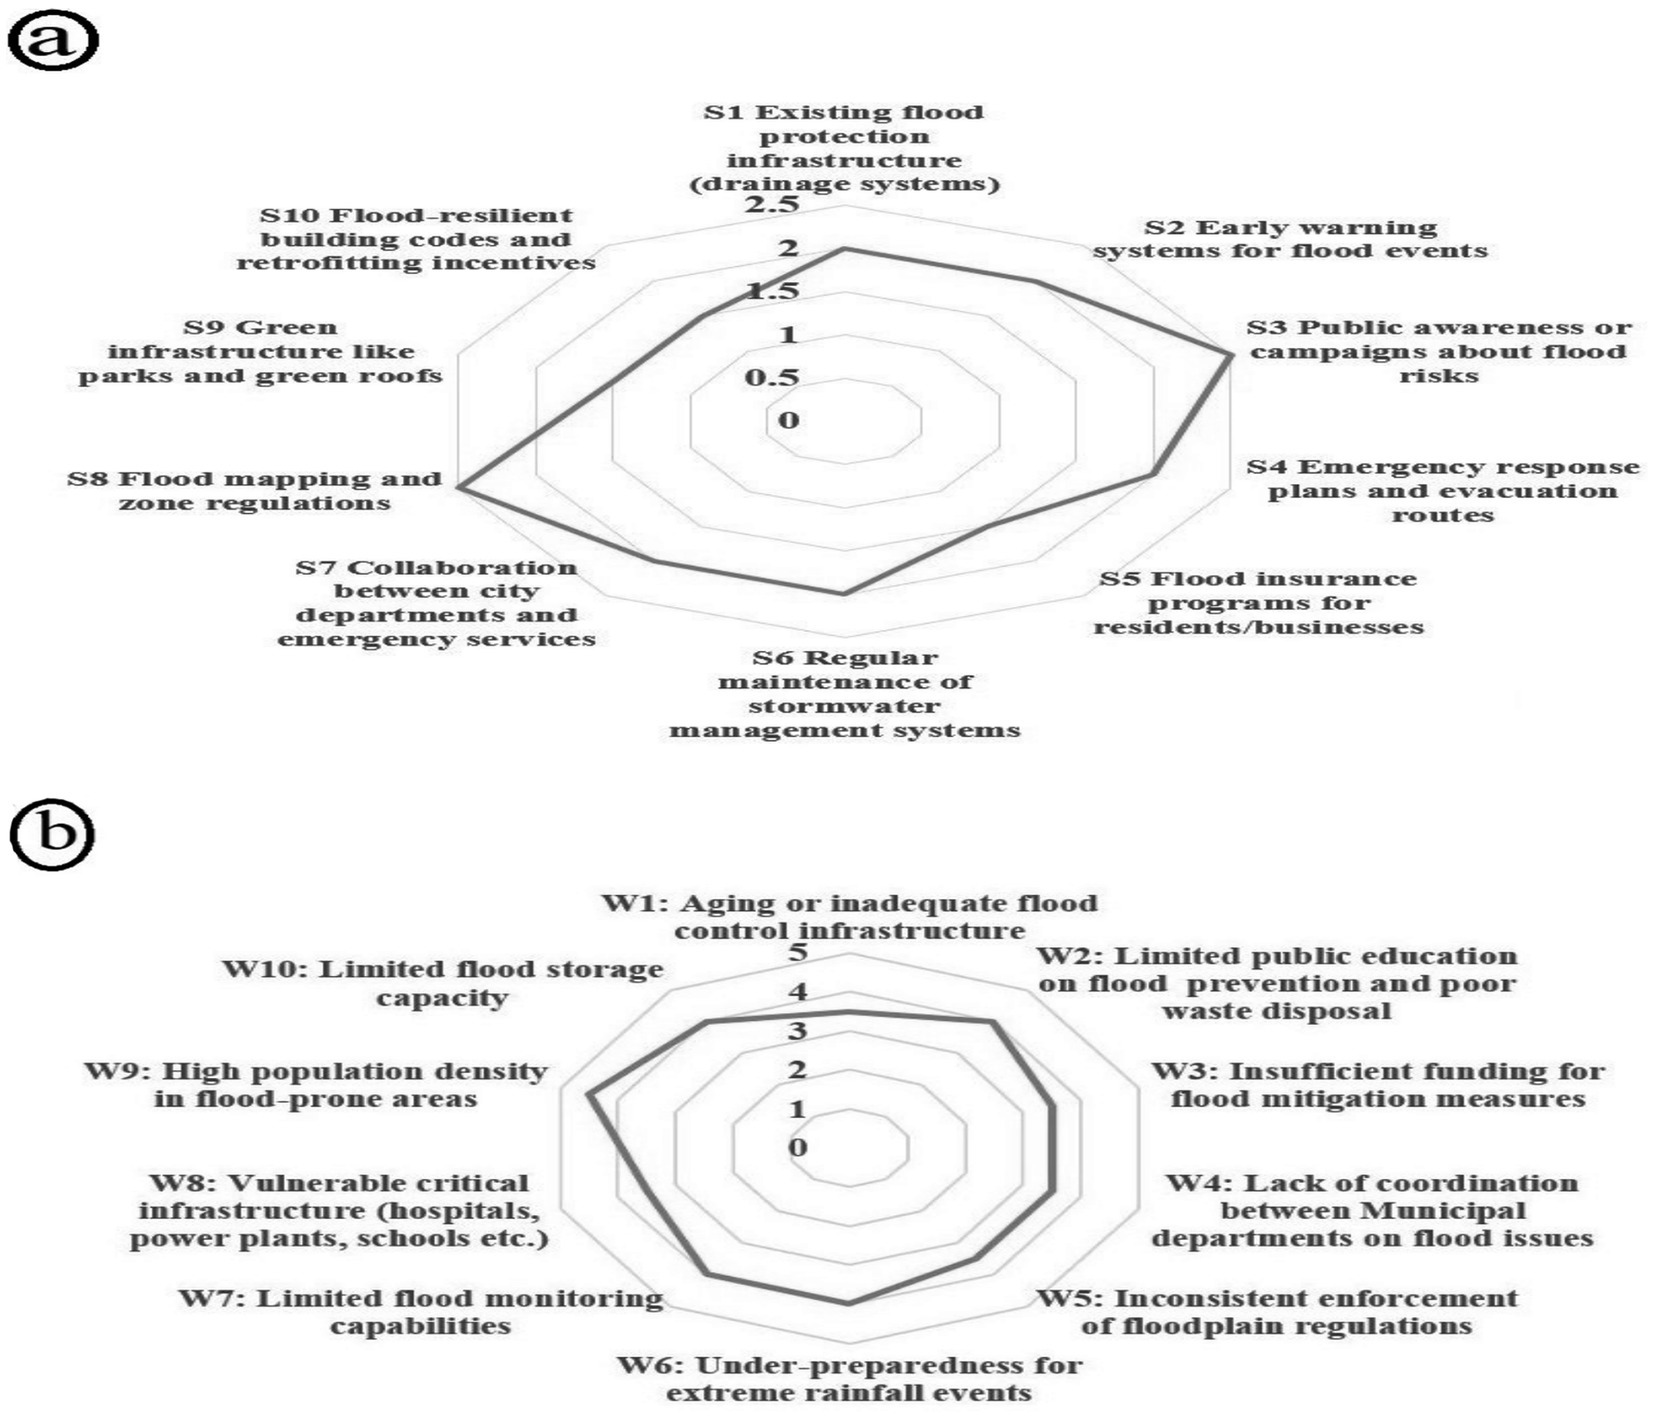
Figure 3. Spider charts of internal index of SWOT analysis. (a) Strength Index, (b) Weakness Index.
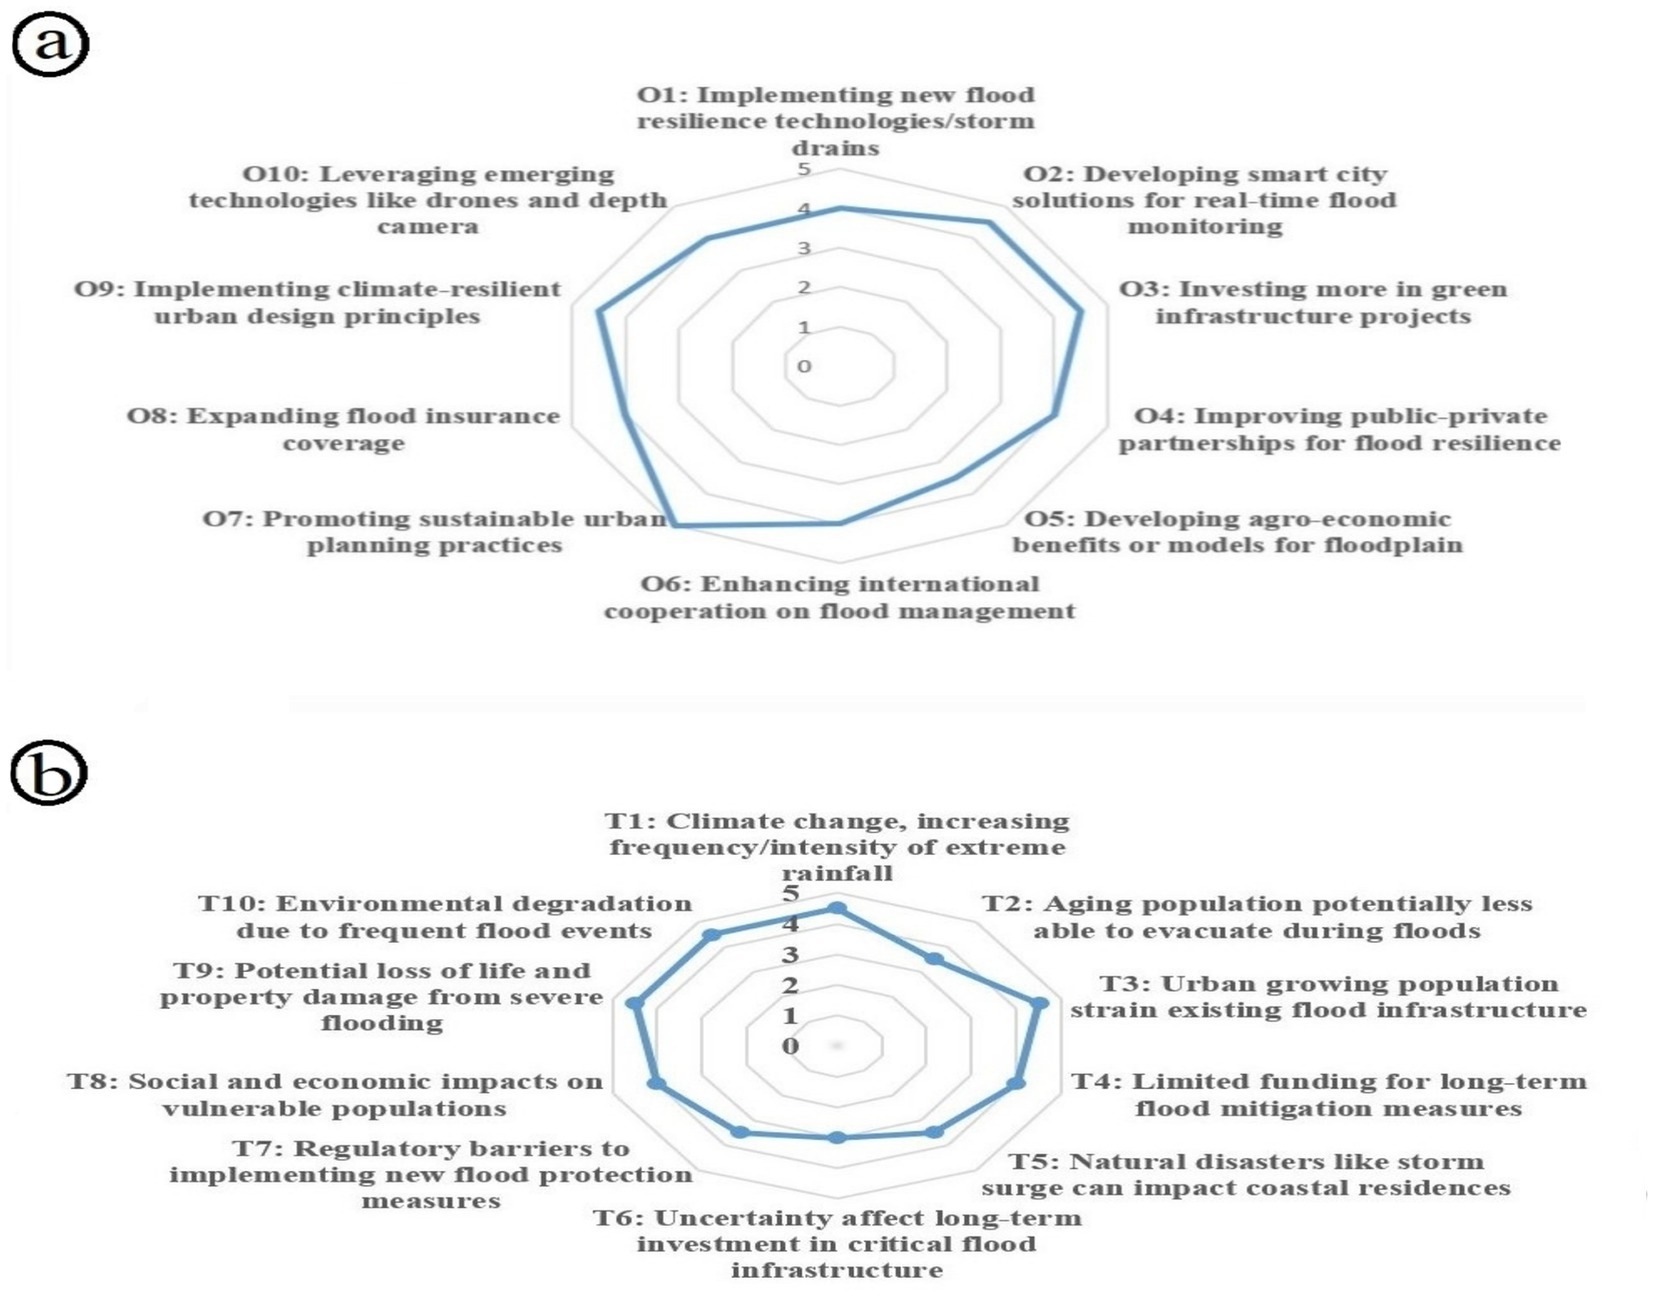
Figure 4. Spider charts of external index of SWOT analysis. (a) Opportunity Index, (b) Threat Index.
3.2.1 SWOT matrix analysis
The study utilized AHP, a popular tool for Multi-Criteria Decision-Making (MCDA). Saaty’s (1980) procedures were followed, focusing on the most important alternative, and the preference for all alternatives for each decision-making. The study utilized mean values of SWOT matrix (Nathaniel et al., 2023). The internal factors strategy (IFAS) focused on strengths and weaknesses, while the external factors strategy (EFAS) considered the opportunities and threats.
The study utilized a crosstab contingency matrix (Popescu and Gasparotti, 2022) to identify and formulate the strategic framework for flood solution components. Four criteria (environment, legal and institution, socioeconomic, and urban engineering) and corresponding alternative elements were generated for the pairwise comparison. As per strategic fit theory, recommended by Gresov (1989), coordinated points fall in the quadrants of the Opportunities-Weaknesses (O-W) model (Figure 5). In addition, the geometric mean calculation of the O-W variables was computed, while the normalization matrix was obtained by dividing the sum of column values in each matrix being compared. The weight of each element was determined by calculating the average value of each row of elements in the normalization matrix for the SWOT-AHP.
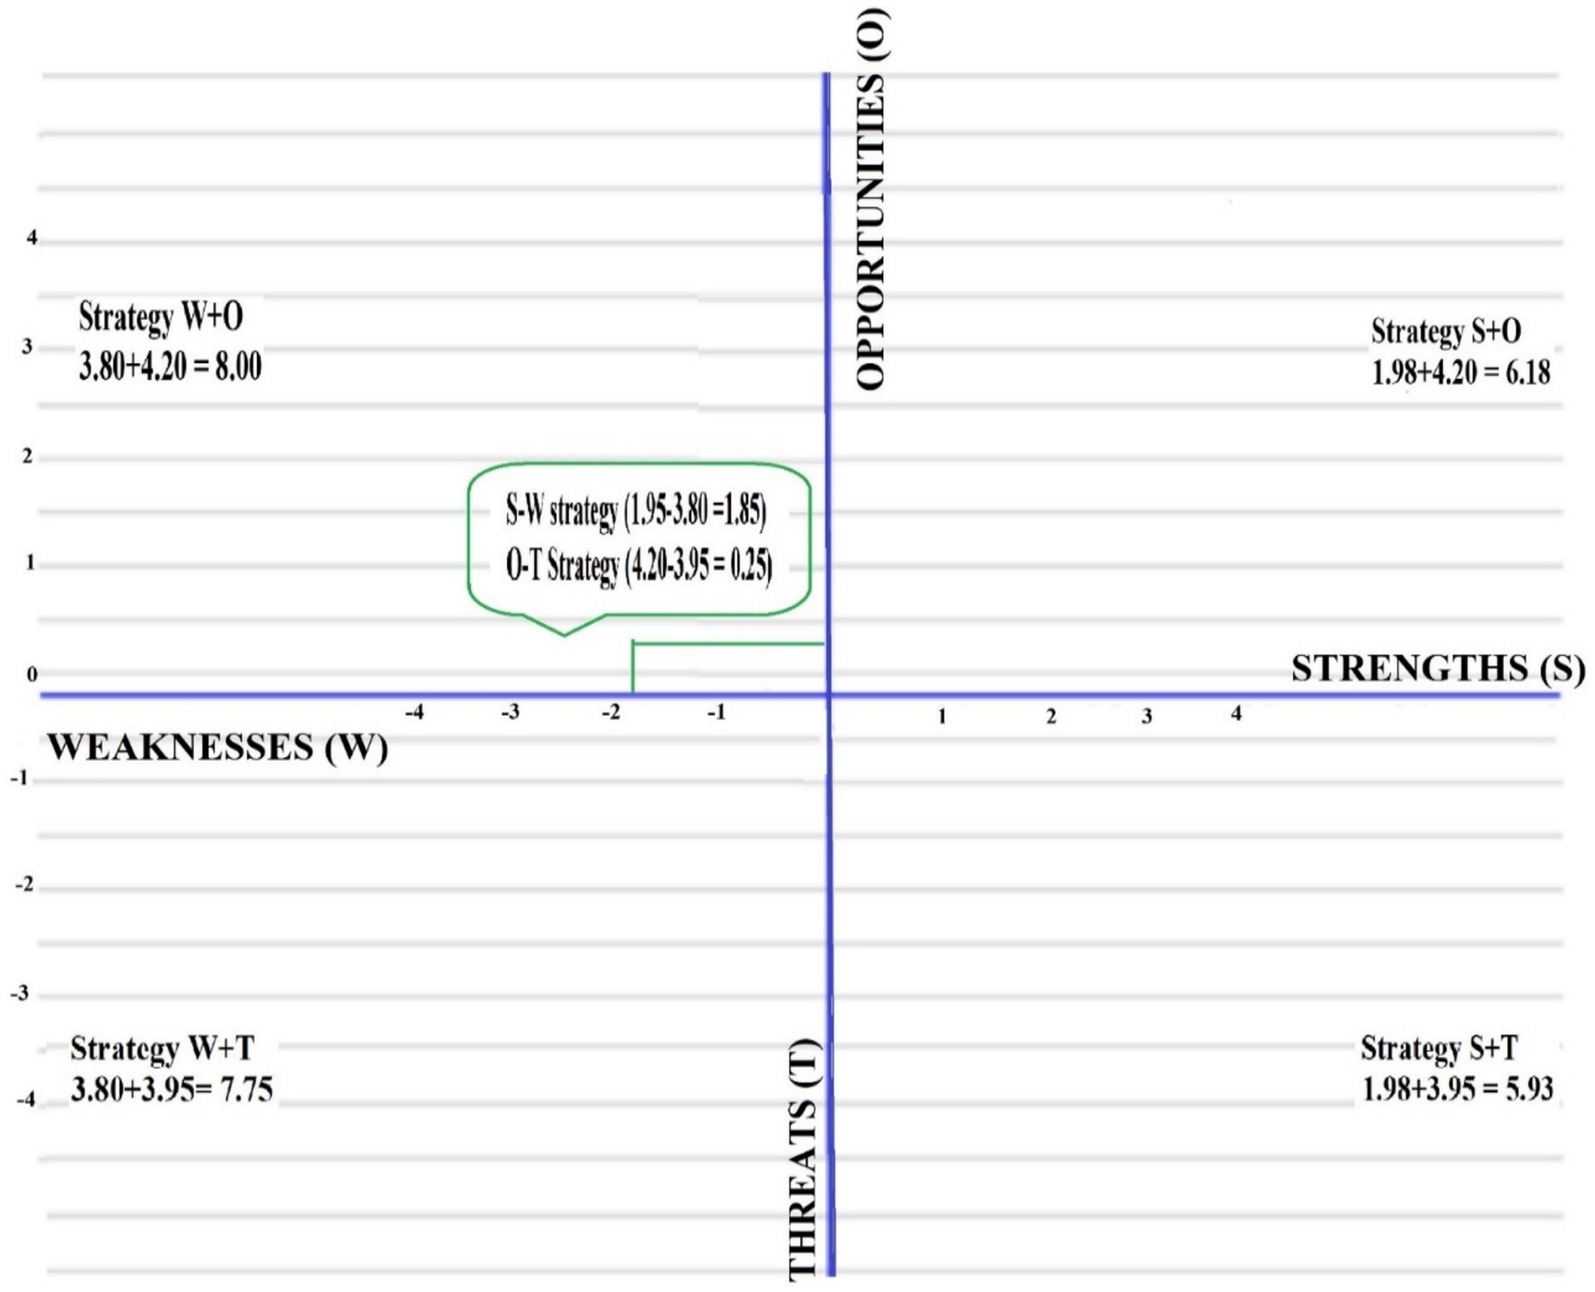
Figure 5. Quadrant fit point of the internal and external SWOT flood solutions.
The SWOT-AHP considered factors and criteria in the systematic evaluation of flood resilience strategies, prioritizing ten (10) formulated in the same pairwise procedures to obtain weighted values as presented in Furthermore, values of Strategic Framework Analysis (SFA) were used to determine the flood solution timeframe in three different categories. The weighted values of criteria and alternatives were used to calculate the final ranking score. Based on the final score, each strategic framework was classified into an aggregate ranking of short-, medium-, and long-term strategies. This is further defined as follows: If the score value < (𝑆𝐹𝐴/3 + 𝑀𝑖𝑛), it is termed a short-term strategy, while a long-term strategy is when the score value > (𝑀𝑎𝑥 − 𝑆𝐹𝐴𝑆/3). The medium-term strategy is defined as a score value between (𝑆𝐹𝐴𝑆/3 + 𝑀𝑖𝑛) and (𝑀𝑎𝑥 – 𝑆𝐹𝐴𝑆/3). The SWOT model is efficient for analyzing existing flood resilience structures and specific areas where significant improvement is required. The suggested strategic flood solution, classified and pairwise, generates in-depth insights into immediate actions under sustainable flood solutions in the study area. The integration of SWOT and AHP justified the need to overcome the subjectivity of SWOT and provide a structured, quantitative basis for decision-making (Görener et al., 2012). This hybrid approach is particularly valuable in Lagos, where recurrent flooding, limited data availability, and diverse stakeholder interests demand a robust methodology that is both participatory and analytically comprehensive (see Table 3).
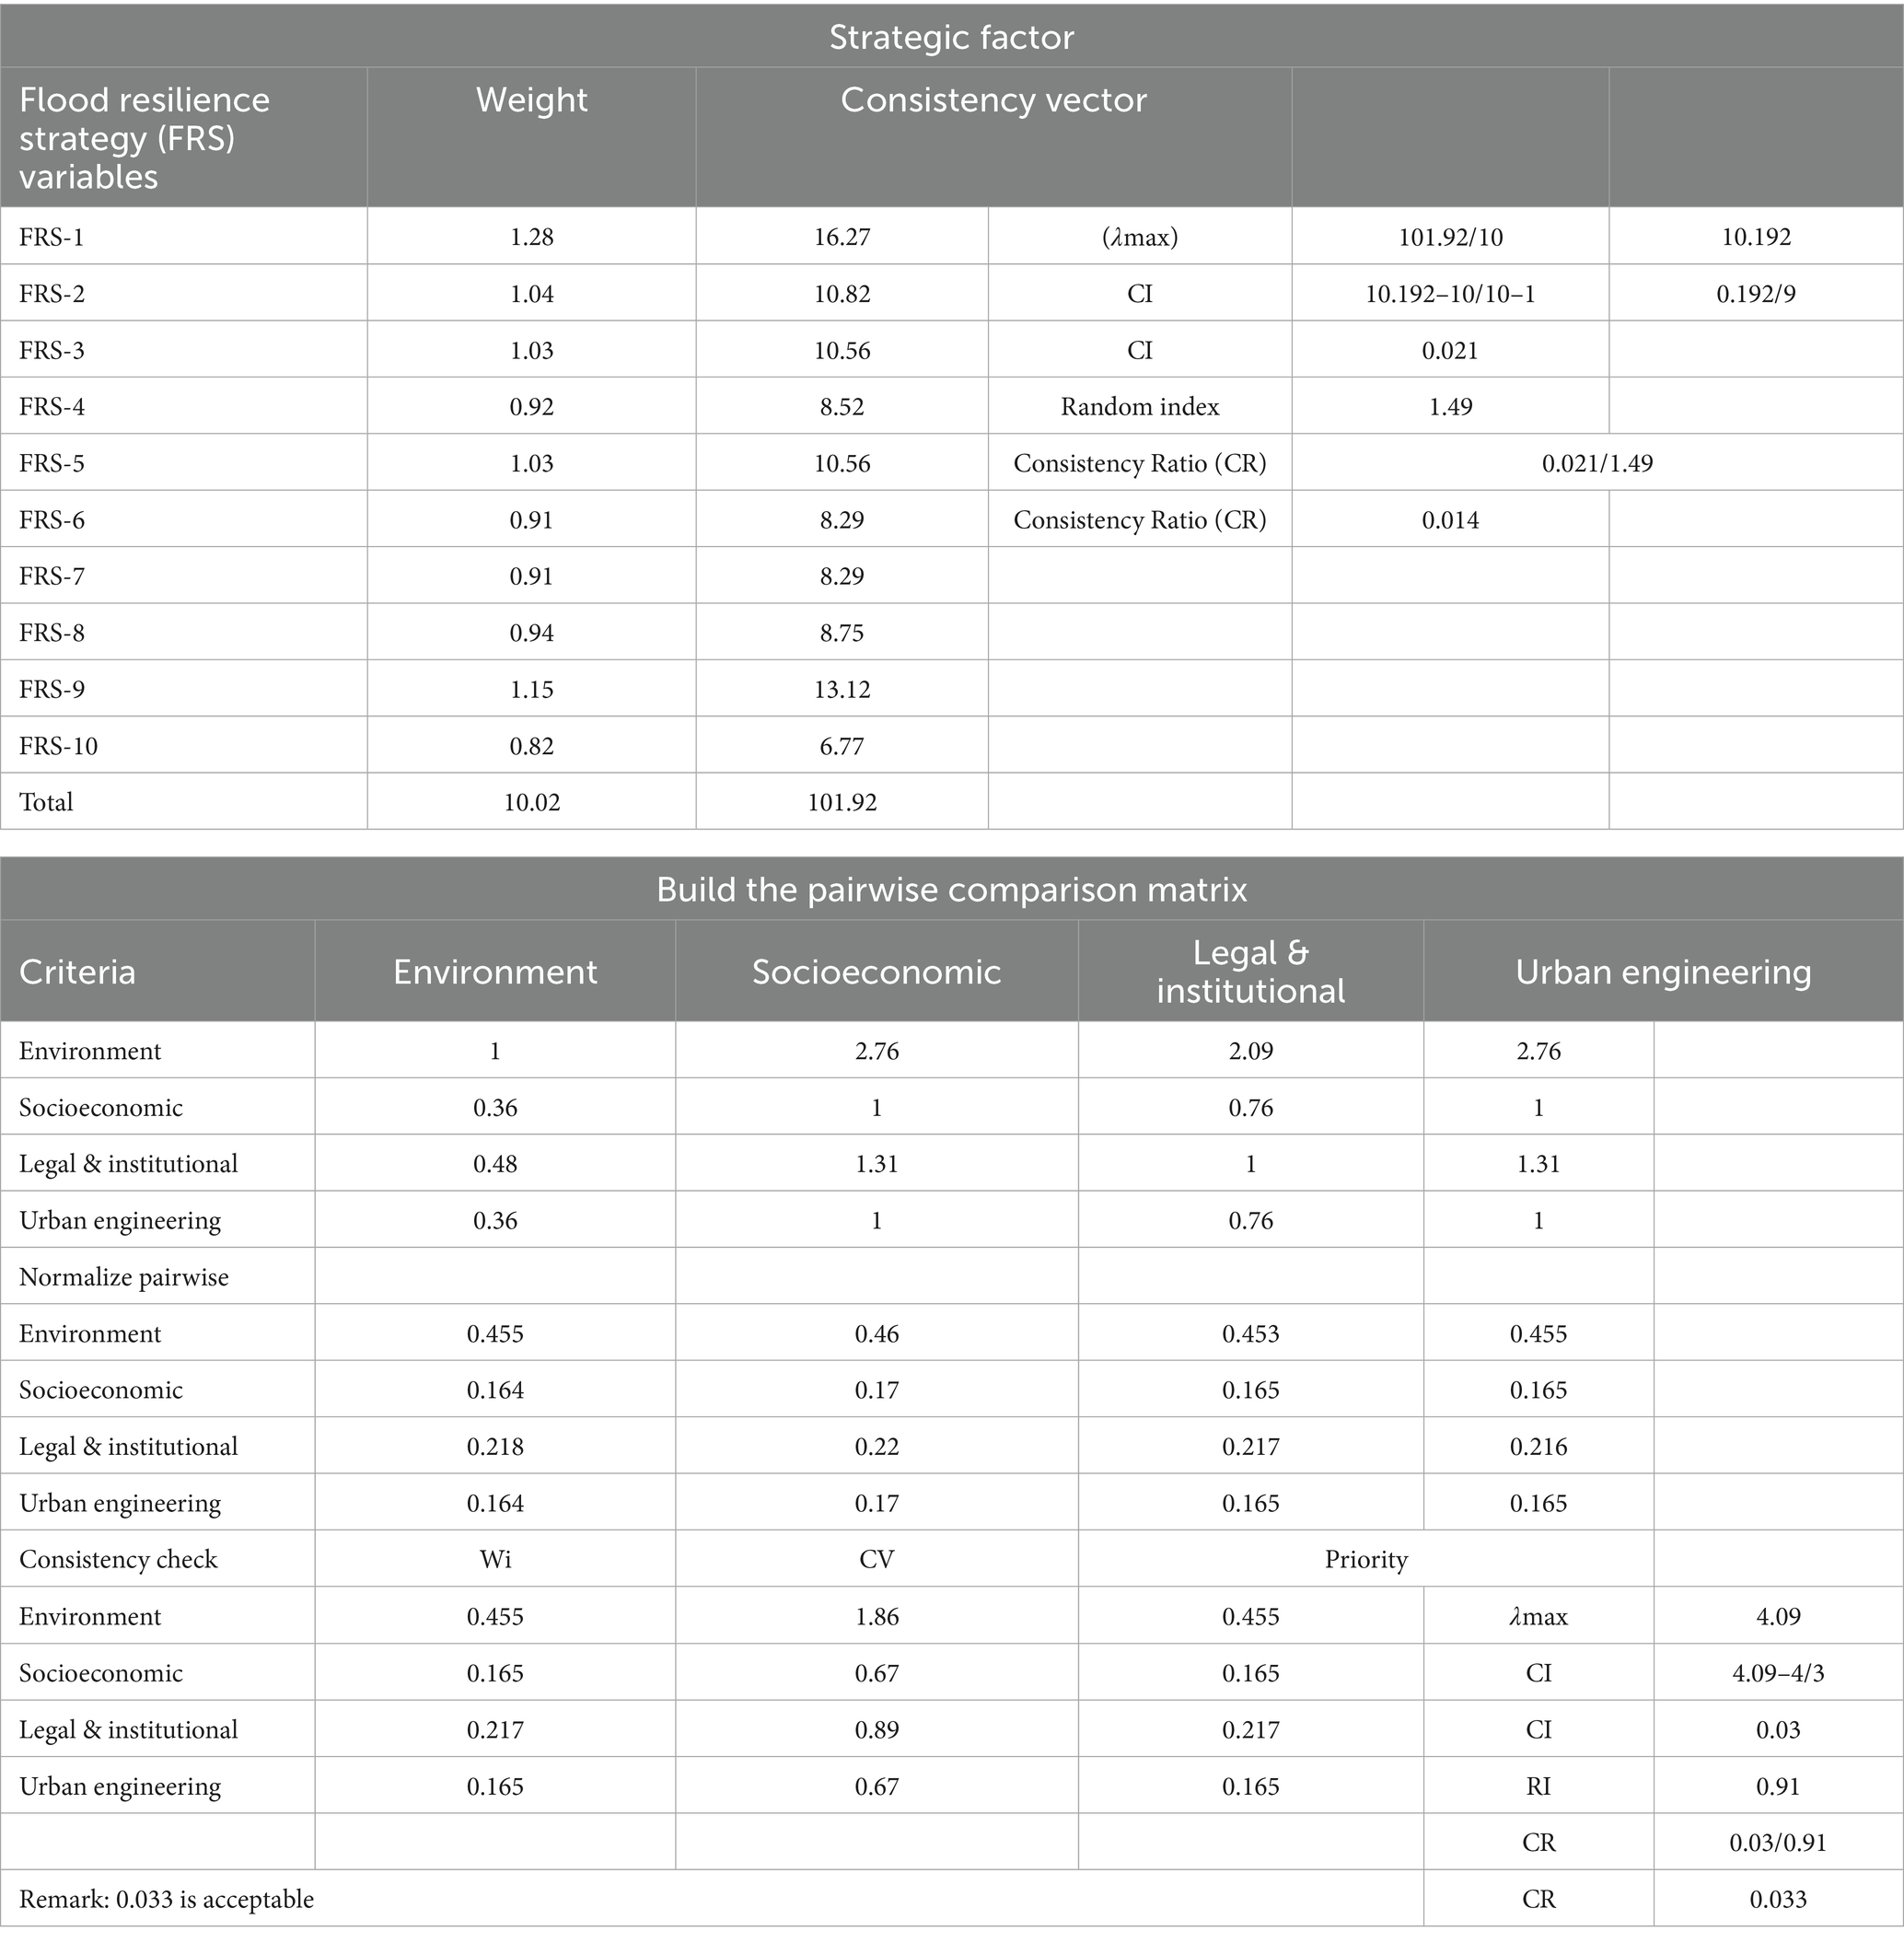
Table 3. Strategic factor of SWOT model and consistency index.
3.2.2 Logical consistency
The study validated the accuracy of calculated weight values using a consistency ratio (CR). AHP principles of quantitative weights using pairwise comparisons helped in ranking flood resilience options, rendering decision-making more transparent and systematic (Saaty and Vargas, 2001). However, major AHP studies require random index (RI) values, as adopted from Saaty (1980), and the CR threshold of 0.10, as suggested by Saaty (1990), was used to determine the acceptability of the pairwise comparison matrices. Therefore, the eigenvector value was obtained by multiplying the comparison matrix by the weight of each element as represented in the formula expressed in Equation 4:
The maximum eigenvector value (λmax) was calculated by dividing the eigenvector value and the weight of each element to obtain the average score as shown below as represented in the formula expressed in Equation 5:
where λmax = maximum eigenvector value and n = order of matrix.
The consistency vector (CV) was calculated by dividing each element of the weighted sum vector by the corresponding element in the weight vector. The average value of the CV is denoted as λmax. The AHP used the CR for its calculation as represented in the formula expressed in Equation 6:
where CI = consistency index, n = order of matrix.
However, the random index is a predefined value based on the size of the matrix that was used to obtain the average consistency index of randomly generated pairwise comparison matrices. The CR is calculated as follows in Equation 7:
where CR = consistency ratio, CI = consistency index, and RI = random index.
A CR value of ≤0.10 (10%) is regarded as acceptable, indicating a reasonable consistency level. However, if CR >0.10, the pairwise comparisons need to be revisited and improved for better consistency.
3.3 Integration of AHP weights for geospatial vulnerability mapping
The study identified flood-conditioning factors relevant to Lagos, including elevation, slope, distance to drainage, land use/land cover, soil class, rainfall intensity, drainage density, distance to coast, imperviousness, and population exposure. All layers were projected, clipped, and resampled to a common grid and standardized to a 0–1 vulnerability scale using monotonic linear transformations for continuous variables and expert-informed reclassification of categorical variables. Stakeholder elicitation informed AHP pairwise comparisons, and the resulting weight vector (CR ≤0.1) was applied in ArcGIS with the weighted sum tool to generate inundation outputs. The composite vulnerability surface was normalized and classified (Jenks) into six flood run-off categories. The robustness was evaluated via ± 10–20% weight perturbations and alternative stakeholder scenarios, and the map was validated against independent flood observations in the study area.
4 Results
4.1 Identifying flood-prone areas
The study presents findings on the population and aerial vulnerability mapping of recurring flooding in the 20 LGAs of Lagos State, drawing attention to the vulnerable settlements within the urban metropolis. Figure 6a shows the extremely high population density (>5 million persons/sq.km) in high-exposure flood zones, particularly areas such as Lagos Island, Mainland, and surrounding LGAs within the Urban Metropolitan Districts (UMD). The areas with moderate vulnerability had a varying density (1 to 5 million persons/sq.km), indicating moderate to poor infrastructure in densely populated areas of the informal settlements.
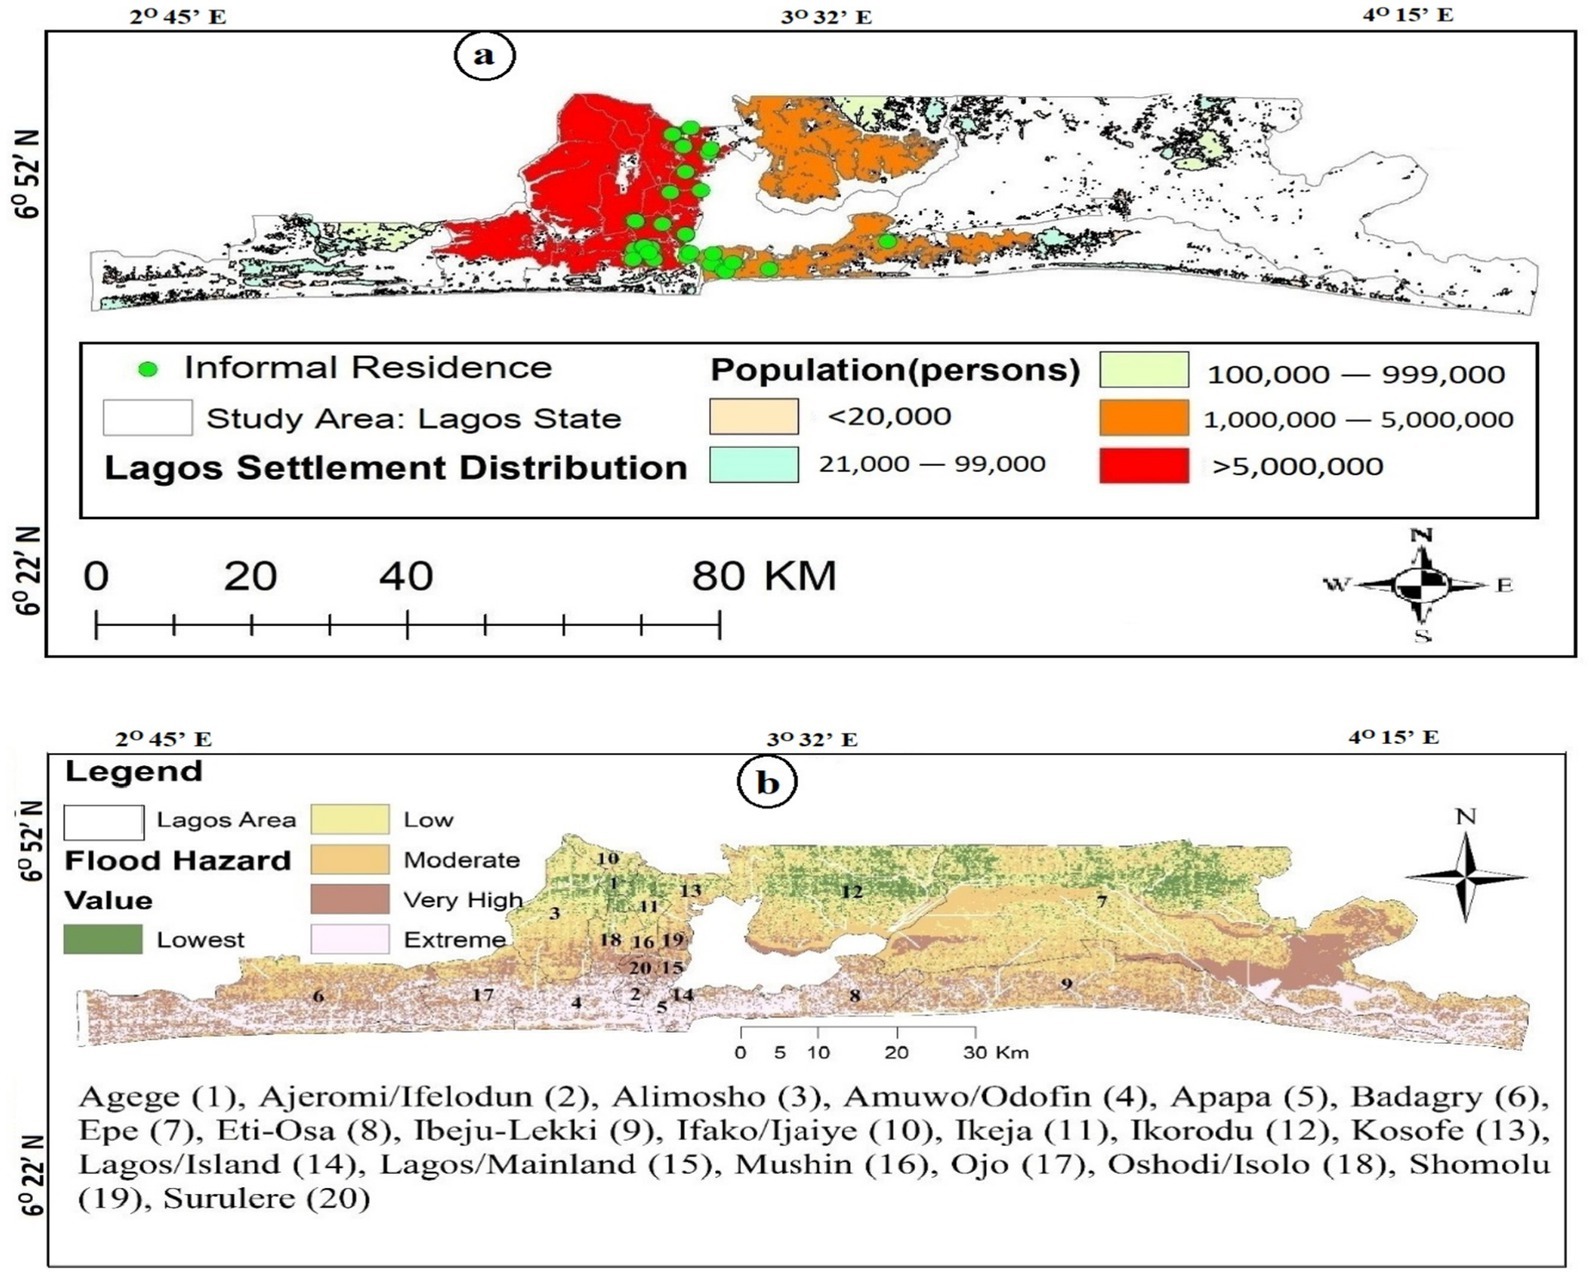
Figure 6. (a) Flood hazard mapping of the 20 LGAs of Lagos State. (b) Population density with their vulnerability to flood.
Figure 6b shows that the extremely vulnerable areas are concentrated in the southern coastal LGAs such as Eti-Osa (8), Lagos Island (14), and Amuwo-Odofin (4), while very high-risk areas extend to inland corridors through LGAs such as Ibeju-Lekki (9), Apapa (5), and Lagos Mainland (15). The lowest flood vulnerability levels were observed mostly in the northern LGAs, including Ifako-Ijaiye (10) and parts of Agege (1), Alimosho (3), and Ikorodu (12). Similarly, flood risk relative to the urban population density was mapped, revealing areas with high vulnerability to floods. The findings revealed a strong spatial overlap between extreme flood zones and densely populated settlements, especially in the southern coastal area and central metropolitan LGAs, noting a high rate of flood recurrence within the identified areas.
4.2 Flood early warning system and surface inundation mapping
Figure 7 presents findings on the need for flood early warning and rainfall-flood awareness during the first and second peaks of rainfall in Lagos State, addressing the important causes of flooding in the settlements. Therefore, resilience stakeholders should focus on the high rainfall periods across Lagos State in JJA, requiring community engagement on flood mitigation techniques. The second peak in SON, particularly in coastal regions where floods were significantly high, also needs attention. Areas with over 1,900 mm and 1,700–1,900 mm rainfall are most prone to flooding due to high annual rainfall. These zones are extensive across the northern and southern fringes during the peak JJA rainfall, indicating sustained flood risks. However, mid-range rainfall zones (1,300–1,700 mm) are transitional, even though still significant for planning purposes.
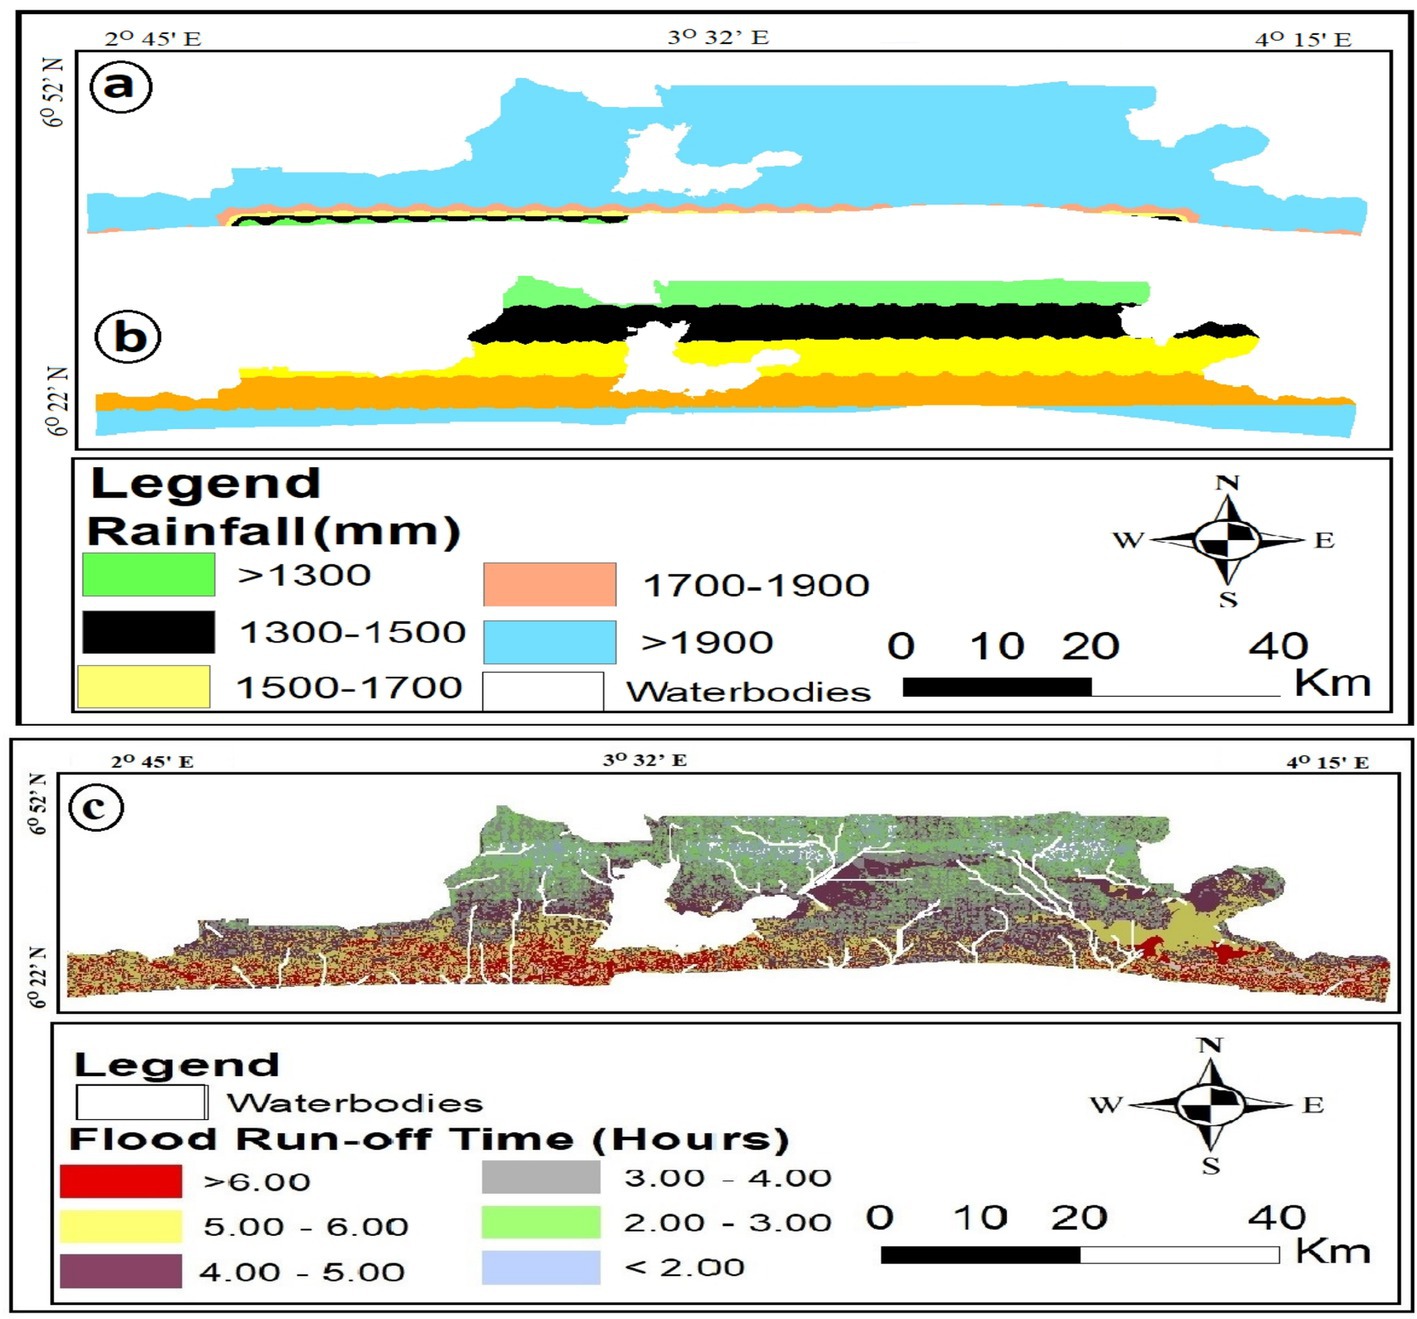
Figure 7. (a–c) Rainfall-induced flood awareness and early warning system. (a) First peak in JJA. (b) Second peak in SON. (c) Surface runoff time.
Figures 7a,b establishes an understanding of flood warning scenarios under rainfall extremes in JJA, emphasizing the southward shift of higher rainfall zones in the SON transitional rainfall peak. Real-time rainfall monitoring and integrated awareness campaigns should be prioritized in areas where the rainfall threshold is above 1,500 mm, particularly in coastal regions where 1,900 mm of rainfall is consistently received annually. This suggests a larger flood-prone region in JJA compared to SON, which is critical for the flood early warning system and excavation plans in the study area.
Figure 7c represents flood run-off time and response of shorter run-off time (2–3 h) observed in the northern region of the study area, as flooding occurs and recedes normally after the rainfall period. Moderate run-off time (4–5 h) offers more lead time for evacuation or intervention, but the rainfall may result in prolonged flooding due to slow water dissipation. The high-risk areas are mainly in the southern belt of Lagos State, dominated by a longer run-off time (6 h), which indicates high vulnerability due to slow drainage and accumulation of water. The JJA and SON rain periods necessitate early warning to residents of flood-prone areas in the Lagos metropolis. Similarly, findings emphasize the prolonged surface inundations of 6 h in coastal areas, resulting in significant losses across the rainfall peak season. Flood resilience efforts by appropriate municipal authorities should focus on depopulating coastal residences, channelizing waterways, and relocating vulnerable populations to a safe resettlement base.
4.3 Internal factor index
Figure 3a presents the results of internal factors of strengths and weaknesses in the SWOT model. The Perception Strength Index (PSI) obtained a SWV of 8,034 and a mean value () of 1.95. Positive deviations were observed in S3 (public awareness campaigns) and S8 (flood mapping and zoning regulations), with scores above 2.5, which suggests they are perceived as more impactful. Similarly, S1, S2, S4, S6, and S7 had individual scores of 2.0, indicating moderate effectiveness. In addition, S5, S9, and S10 each scored 1.5, which is below the PSI mean, showing their perceived weaker PSI.
Results in Figure 3b revealed that the Perception Weaknesses Index (PWI) obtained a SWV of 15,656 and a PWI mean value () of 3.8. A high positive deviation from the PWI mean was observed in W9 (high population density in flood-prone areas), indicating the most significant weakness with the highest deviation (+0.7). Similarly, W2, W6, W7, and W10 maintained scores above the PWI mean, indicating serious weaknesses and critical vulnerabilities. In addition, W1, W3, W4, W5, and W8 had mean scores of 3.5 each, which is below the PWI mean, showing considerable weak priority and relevance. However, the standout score of W9 (4.5) accounts for half of the total variance, showing one dominant weakness in the PWI results. This indicates limited implementation, awareness, or effectiveness, and suggests potential priority areas for improvement.
4.4 External index
Results in Figure 4a revealed that the Perception Opportunities Index (POI) obtained a POI mean value () of 4.2. Findings show that the topmost opportunity was found in O7 (5.0), while others, such as O2, O3, and O9, had a mean score of 4.5. Moderate opportunities were found in O1, O4, O6, O8, and O10, with a mean score of 4.0, which is considered viable but requires targeted execution. POI obtained the highest SWV of 17,304 with the highest mean score of 4.2 in the SWOT model, establishing a combination of high likelihood, severity, and mitigation of possible impacts of urban flooding through suggested opportunity indices. The high-rated opportunities appear to be proactive, integrated, and formidable strategies for addressing flood challenges and enhancing urban resilience and disaster reduction efforts.
Findings shared in Figure 4b revealed a mean value () of 3.95, while high-rated Perception Threats Index (PTI) around a mean score of 4.5 was found in T1, T3, T9, and T10. Similarly, T4 and T8, with a mean score of 4.0, aligned with the PTI mean. Negative deviations were observed in T2, T5, and T7, while T6 maintained a lower-scoring threat index. The SWOT model of internal and external factors accounted for variation in SWV, while the opportunities index scored the highest (17,304), signifying the perception of residents and stakeholders on the potential of counterreaction to threats through proactive measures such as green infrastructure (O3) or smart monitoring (O2). Furthermore, the mean scores of TPI (3.95), PWI (3.8), and lower PSI (1.95) indicate the need for urgent actions through TOI (4.2).
4.5 SWOT-AHP strategy for resilience improvement
The strategic factor positions suggested strengthening weaknesses through opportunities for flood resilience improvements in the study area. The SWOT-AHP model helps address the weaknesses and predict and mitigate threats using opportunity strategies. Thus, the formulation of policies to strengthen the strategic flood resilience and regulations can be maximized. Table 4 presents the formulated strategies and their rankings, which were further analyzed using the SWOT-AHP matrix. The weight of each variable was determined through the PI mean values, and criteria and alternatives were assessed using the AHP. In addition, environment, socioeconomic, legal and institution, and urban engineering had weighted values of 0.45, 0.16, 0.22, and 0.16, respectively. The highest and moderate weight values were assigned to the environment and legal and institution, indicating that focusing on the environment of the Lagos metropolis could result in optimal flood countermeasure strategies. In addition, alternative strategic variables were computed to generate weight values for ranking purposes. The global weight ranking for each strategy was determined based on the level of priority.
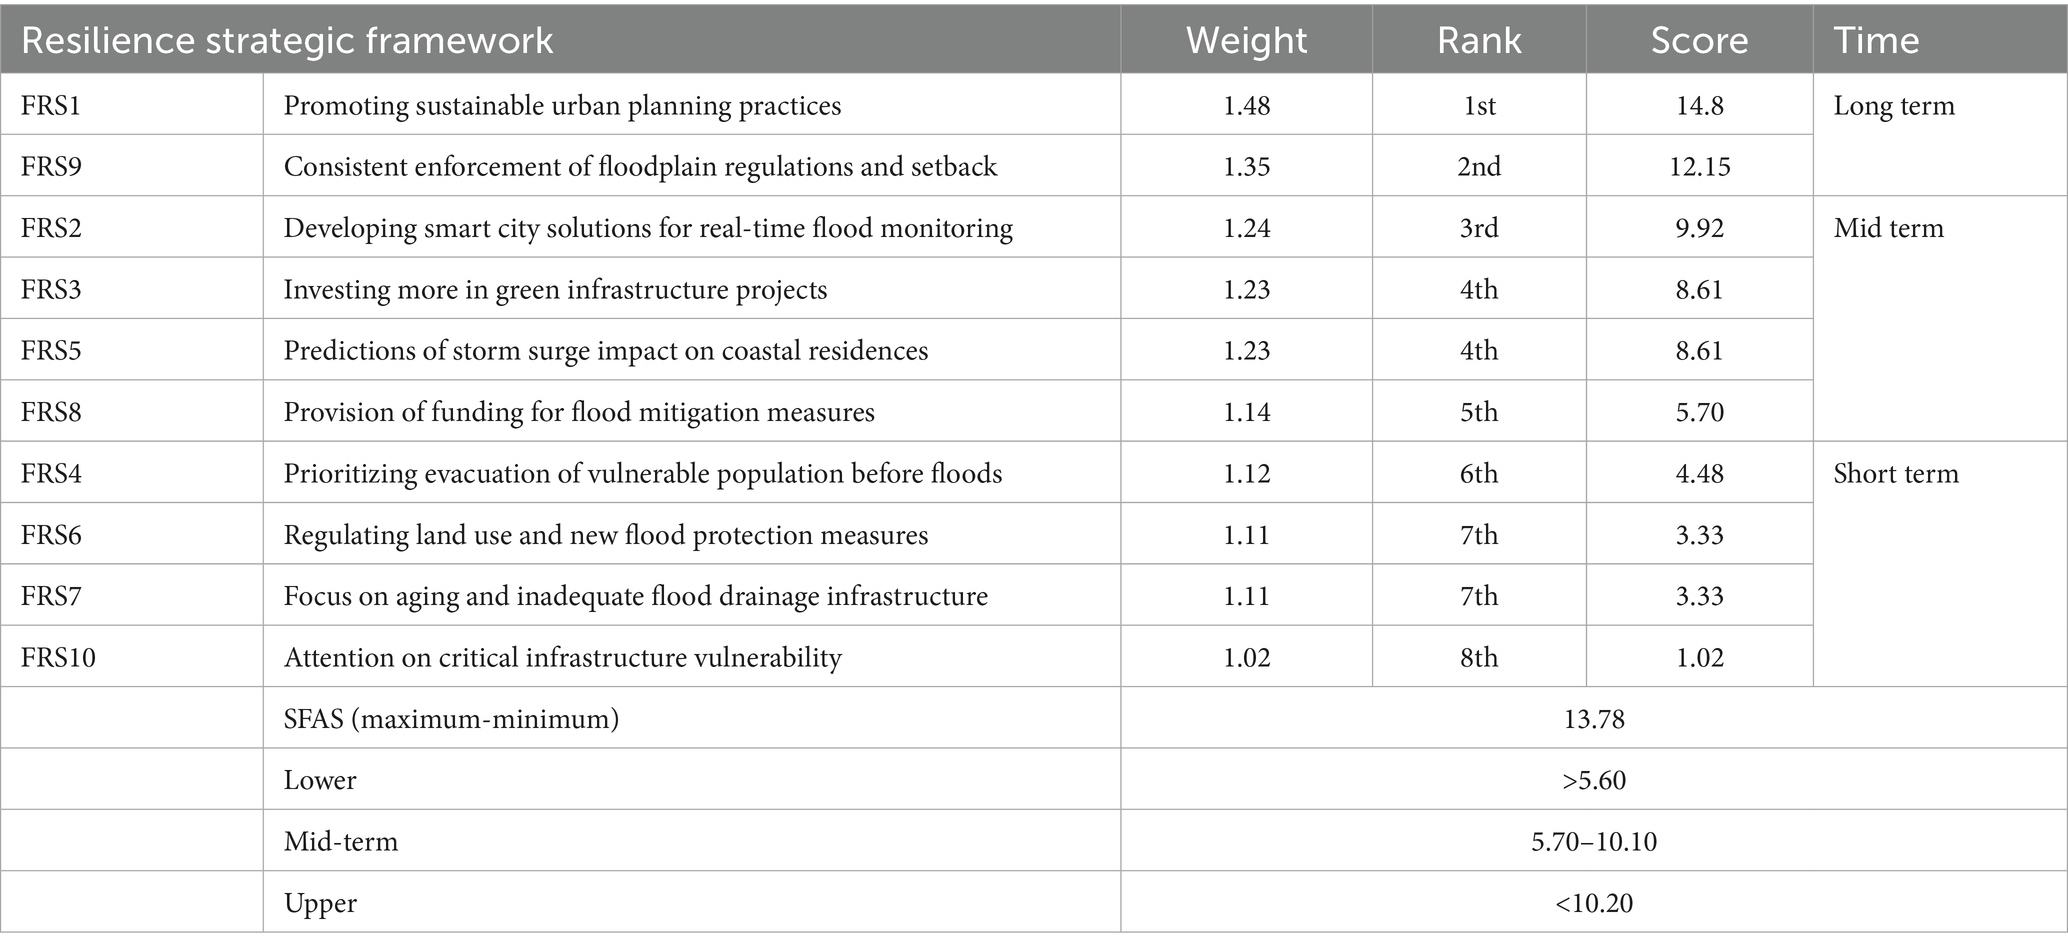
Table 4. Resilience strategic analysis and their timeframe.
The AHP model ranking was used to establish the strategy timeframe with formulated strategic frameworks. The timeframe was categorized into three phases: short-term, mid-term, and long-term plans. The aggregate weight score of all variables was calculated to determine the strategic timeframe for each variable. The SFA summary within the lower category indicated short-term plans, while mid and upper values defined mid-term and long-term plans, respectively. However, the short-term plans (<5.61) included RS10, attention on critical infrastructure vulnerability (1.02); RS7, focus on aging or inadequate flood drainage infrastructure (3.33); RS6, regulating land use and new flood protection measures (3.33); and RS4, prioritizing evacuation of vulnerable populations before floods (4.48). Mid-term plans ranged from 5.7–10.1, including RS8, provision of funding for flood mitigation measures (5.7); RS5, prediction of storm surge impact on coastal residences (8.61); S3, investing more in green infrastructure projects (8.61); and RS2, developing smart city solutions for real-time flood monitoring (9.92). In addition, the long-term plan (>10.2) consisted of RS9, which includes consistent enforcement of floodplain regulations and setback (12.15), and S1, which includes promotion of sustainable urban planning practices (14.8).
5 Discussion and future study
The significance of urban flood solutions is reflected in the assessment of current flood vulnerability and recurrence in Lagos State, using participatory GIS (PGIS) and perception knowledge systems. The findings of the study were in agreement with previous works by Salami and Otokiti (2022), Oladipo (2023), Ndimele et al. (2024), and Oguntokun and Fayomi (2025), which provided robust knowledge on the spatial dynamics of floods, challenges faced by residents, and how improvement can be achieved in sustainable flood risk management of the study area. The assessment quantifies flood vulnerability problems, temporal consequences of surface water inundation, and flood solutions using the advanced SWOT-AHP technique. Oguntola (2022) affirmed that flood likelihood assessment is intertwined with the general condition of low-lying land, proximity to drainage, and massive impervious surfaces, as well as a highly vulnerable population. The results highlighted that low elevation remains a major flood-influencing element promoting flood risk in a larger part of the Lagos coastal environment. The GIS-based spatial assessment revealed flood vulnerability classes of Lagos metropolis, establishing that low-lying coastal areas and densely populated UMDs are highly vulnerable and experience severe flood hazards (Kasim et al., 2022).
However, the observed surface inundation is extremely high due to the inherent nature of land configuration, impervious surfaces, and land utilization patterns in Lagos State, Nigeria. Findings revealed a high occurrence of rainfall-induced floods in JJA, which validated the spatial rainfall mapping of flood susceptibility of urban areas. The study analyzed the influence of transitional rainfall patterns and their effects contributing to urban flood impact in coastal residential areas, helping recreate flood prewarnings (Aliyu et al., 2023). The findings agree with Obiefuna et al. (2021), Osanyintuyi et al. (2022), and Isiaka et al. (2023), affirming the impact of high rainfall-induced flood on the coastal and lagoon settlers, emphasizing spatial rainfall frequency and accompanying flood severity in Makoko, Shomolu, Ojo, Apapa, Ebute-Metta, Obalende, Bariga, and other floating settlements in and around the corridors of Lagos water bodies.
The most significant impact is seen in the densely built-up and poorly planned urban areas, such as Ajeromi/Ifelodun, Surulere, Shomolu, Agege, Lagos Mainland/Island, and Isolo/Oshodi. The effect of surface runoff, backwash flood, and flash flood also aggravates the damage to lives and properties, limits road efficiency, and impacts public infrastructure (Oguntokun and Fayomi, 2025). These floods occur seasonally, aligning with the intensity and frequency of rainfall events, exacerbated by the rate of urbanization and unsustainable human practices (United Nations Development Programme, 2023). The findings of the study highlighted the areas where major flood programs are required, particularly during the first rainfall peak (JJA) and second peak (SON). The coastal residential areas require more focus because of their high vulnerability across the rainfall transitional periods, a finding that aligns with a study by Gregory and Gerald (2020) on flood risk management in the United States. This study contains useful information on the duration of surface area flooding and the severity of the expected flooding in time and space (Ahmad and Ma, 2020). Studies by Olowoopejo (2019), Rahman et al. (2021), and Lawanson et al. (2023) projected that coastal and densely populated areas have a prolonged period of flooded conditions due to the impact of climate change, emphasizing the need to undertake aggressive sensitization, awareness campaigns, and urban flood infrastructure improvement. Similarly, consistent clearing of the waterways and maintenance of drainage structures become essential as these initiatives will speed up runoff and floodwater removal from household premises. In addition, backwash floods in Lagos metropolitan areas are worsened by a poor inland drainage system, and poorer populations often reside in low-income areas with substandard housing conditions. The study validates Onifade et al. (2023) and Yoade et al. (2023) on the interconnected vulnerabilities and compounded flood risks attributed to the simultaneous effects of rainfall and a poor drainage system in a typical developing country. Orimoogunje et al. (2016), Asiedu (2020), Odunsi et al. (2024), and Nghiningwa et al. (2025) reported that many informal residents of most African countries suffer due to inadequate infrastructure, enhancing their vulnerability to flood damage.
However, the localization of strategic flood solutions through the SWOT-AHP approach provides a pathway to achieve flood minimization on short-, medium-, and long-term scales. The SWOT-AHP analysis helps establish robust modalities to achieve flood risk management and urban sustainability, emphasizing the improvement of the current shortcomings of flood reduction practices. Internal and external factors were prioritized using integrated hierarchical principles to address flood problems (Long et al., 2021). The study findings correspond to the results of a study by Tzanou and Skoulikaris (2024), which evaluated the SWOT-AHP framework combining geospatial databases with multicriteria decision-making in mapping flood protection infrastructure of the Strymonas river basin, Greece. Similarly, participatory mapping and community-led resilience studies in coastal cities in Accra, Ghana (Darkwah et al., 2018), present a relevant scientific contribution to the regional and global discourse of community-based flood adaptation.
The study resulted in a 10-point strategic framework that helps tackle urban flooding using a broad scale and time frame. Prioritizing flood recurrences as well as improving critical infrastructure, focusing on aging and vulnerable population groups, improving flood drainage infrastructure, regulating land use, developing new flood protection measures, and promoting urban green infrastructure were some of the required approaches identified through the SWOT-AHP analysis. The SWOT model proved effective (Ghazinoory et al., 2011), as the information obtained from the respondents and key informants significantly impacted the flood strategic framework (Nathaniel et al., 2023). However, the flood solutions framework may not uniformly mitigate floods across all urban landscapes (Ghorbani et al., 2022). The adoption of ideas and appropriate elements in the SWOT-AHP model can enable local flood solutions, suggesting better actions in a specific urban environment. Sustainable flood solutions focused on reducing future risks in line with SDGs (Orimoogunje and Aniramu, 2025), addressing flood challenges through immediate relief or livelihood tools that can foster long-term recovery in African coastal cities.
It was observed that the flood problem in Lagos is linked to environmental factors influenced by local practices of the overpopulated megacity. This study acknowledges the inherent subjectivity of the AHP method and discusses steps taken to mitigate it. However, potential limitations such as data resolution exist, which highlights the need to integrate machine learning with SWOT-AHP for multihazard assessment cascaded by climate impact in Lagos. Future studies should look into this direction and apply the framework to other megacities for comparative analysis.
6 Conclusion
Flooding in Lagos has become pervasive, prompting the need for proactive solutions through community engagement and spatial vulnerability modeling. The disparity in flood-rainfall transitional seasons highlights a critical gap in flood risk management across the Lagos coastal areas. This is a significant concern, as adequate knowledge systems and community-based solutions serve as immediate awareness interventions, reaffirming the role of stakeholders in providing comprehensive flood solutions. The overall grassroots efforts can be effective in solving flood issues if community knowledge is improved and the urban drainage system is effective, because Lagos residents are high taxpayers. Current developments in flood risk management place a strong emphasis on integrating SWOT-AHP frameworks and high-resolution flood inundation mapping through PGIS to improve flood resistance in the Lagos coastal region. As evidenced in Reading, UK, where local knowledge and flood zones were modeled, PGIS has been successful in bridging the gap between technical flood models and community perception to enhance flood risk management. In addition, the SWOT-AHP approach prioritizes flood protection measures, balancing the indices of technical, social, institutional, and environmental criteria. Similarly, GIS-based AHP models have been employed to rank flood mitigation projects, integrating sustainability dimensions, such as economic, ecological, and social, into spatial decision-making. Coupling SWOT with AHP allows quantitative prioritization of measures, effective decision-making, and social equity, representing a critical step in inclusive flood governance. The need for community involvement in improving flood risk assessments and early warning systems is highlighted by the study, emphasizing their relevance in flood disaster reduction in Lagos State, Nigeria, as well as identifying the adaptive framework necessary for flood reduction in megacities across Africa.
The study focused on protecting vulnerable communities and infrastructure links directly to SDG 11.5 (reduce the adverse per capita environmental impact of cities), with special attention to the blockage of waste material in urban drainage systems. The development of early warning systems and resilience strategies advances SDG 13.1 (strengthen resilience and adaptive capacity to climate-related hazards), and community awareness campaigns contribute to SDG 13.3 (improve education, awareness-raising, and human and institutional capacity on climate change mitigation, adaptation, impact reduction, and early warning).
Targeted actions on high-risk areas can significantly reduce vulnerability, as demonstrated in the geospatial study of the Lagos coastal area. Nigeria can greatly enhance flood resilience and progress toward the 2030 Sustainable Development Agenda by implementing participatory measures that enhance spatial planning to address the human-caused factors contributing to flooding. With more intense floods expected in Nigeria due to climate change, it is crucial that these integrated solutions are implemented promptly and precisely. By combining community knowledge with geospatial precision within a structured decision-making framework, African cities can develop flood solutions that are both technically sound and socially sustainable. This approach will protect vulnerable coastal populations and contribute to the achievement of several SDGs.
Data availability statement
The raw data supporting the conclusions of this article will be made available by the authors, without undue reservation.
Ethics statement
This study involving human participation was approved during the Propositional Seminar of the Postgraduate Review Committee, Obafemi Awolowo University, Ife Nigeria. Participants were properly inform about the purpose of the study, assuring them of the anonymity and confidentiality of their responses. In addition, consent was obtained before administering the questionnaire survey.
Author contributions
OA: Conceptualization, Data curation, Formal analysis, Investigation, Methodology, Project administration, Resources, Software, Validation, Visualization, Writing – original draft, Writing – review & editing. OO: Conceptualization, Data curation, Formal analysis, Investigation, Methodology, Project administration, Resources, Software, Supervision, Validation, Visualization, Writing – original draft, Writing – review & editing.
Funding
The author(s) declare that no financial support was received for the research and/or publication of this article.
Conflict of interest
The authors declare that the research was conducted in the absence of any commercial or financial relationships that could be construed as a potential conflict of interest.
Generative AI statement
The authors declare that no Gen AI was used in the creation of this manuscript.
Any alternative text (alt text) provided alongside figures in this article has been generated by Frontiers with the support of artificial intelligence and reasonable efforts have been made to ensure accuracy, including review by the authors wherever possible. If you identify any issues, please contact us.
Publisher’s note
All claims expressed in this article are solely those of the authors and do not necessarily represent those of their affiliated organizations, or those of the publisher, the editors and the reviewers. Any product that may be evaluated in this article, or claim that may be made by its manufacturer, is not guaranteed or endorsed by the publisher.
Supplementary material
The supplementary material for this article can be found online at: https://www.frontiersin.org/articles/10.3389/frsc.2025.1663269/full#supplementary-material
References
Abdel-Karim, A., Gaber, D., Youssef, M., and Pradhan, B. (2020). Flood hazard assessment of the urban area of Tabuk City, Kingdom of Saudi Arabia by integrating spatial-based hydrologic and hydrodynamic modelling. Sensors 19:1024. doi: 10.3390/s19051024
Adeaga, O., Oyeneye, O. T., and Akinbaloye, O. (2020). Urban flood vulnerability mapping of part of the Lagos metropolis. Proc. Int. Assoc. Hydrol. Sci. 383, 249–254. doi: 10.5194/piahs-383-249-2020
Adelekan, I. O., and Asiyanbi, A. P. (2016). Flood risk perception in flood-affected communities in Lagos, Nigeria. Nat. Hazards 80, 445–469. doi: 10.1007/s11069-015-1977-2
Ahmad, M. I., and Ma, H. (2020). An Investigation of the Targeting and Allocation of Post-Flood Disaster Aid for Rehabilitation in Punjab, Pakistan. International Journal of Disaster Risk Science. 44, 101–122.
Aliu, I. R., and Ajala, O. A. (2014). Intra-city polarization, residential type and attribute importance: a discrete choice study of Lagos. Habitat Int. 42, 11–20. doi: 10.1016/j.habitatint.2013.10.002
Aliyu, A., Liman-Hamza, K., and Lawal, A. (2023). Floods in Sub-Saharan Africa; causes, determinants and health consequences. Niger. Med. J. 64, 13–24.
Anifowose, M. S., and Rollason, E. D. (2024). Challenges in implementing flood disaster management policies and practices in Lagos State, Nigeria. Int. J. Anthropol. Ethnol. Res. Dev. 6, 78–89. doi: 10.70382/hijaerd.v06i6.001
Asiedu, J. (2020). Reviewing the argument on floods in urban areas: theoretical and empirical research. Urban Manage. 15, 24–41.
Darkwah, R. M., Cobbinah, P. B., and Anokye, P. A. (2018). Contextualising urban resilience in Ghana: local perspectives and experiences. Geoforum 94, 12–23. doi: 10.1016/j.geoforum.2018.05.023
Das, S. (2020). Flood susceptibility mapping of the Western Ghat coastal belt using multi-source geospatial data and analytical hierarchy process (AHP). Remote Sens. Appl.: Soc. Environ. 20:100379. doi: 10.1016/j.rsase.2020.100379,
Ezugwu, C. M., and Okpoko, C. (2025). Assessing public awareness and attitudes towards flood disaster safety messages among residents of Anambra state. Afr. J. Educ. Manage. Teach. Entrepreneurship Stud. 15, 722–732.
Faccini, F., Luino, F., Paliaga, G., Sacchini, A., Turconi, L., and de Jong, C. (2021). Role of rainfall intensity and urban sprawl in the 2014 flash flood in Genoa City, Bisagno catchment (Liguria, Italy). Appl. Geogr. 98, 224–241. doi: 10.1016/j.apgeog.2018.07.022
Ghazinoory, S., Abdi, M., and Azadegan-Mehr, M. (2011). SWOT methodology: a state-of-the-art review for the past, a framework for the future. J. Bus. Econ. Manag. 12, 24–48. doi: 10.3846/16111699.2011.555358
Ghorbani, M. K., Hamidifar, H., Skoulikaris, C., and Michael, N. (2022). Concept-based integration of project management and strategic management of rubber dam projects using the SWOT-AHP method. Sustainability 14:2541. doi: 10.3390/su14052541
Görener, A., Toker, K., and Uluçay, K. (2012). Application of combined SWOT and AHP: a case study for a manufacturing firm. Procedia. Soc. Behav. Sci. 58, 1525–1534. doi: 10.1016/j.sbspro.2012.09.1139
Gowtham, S., and Dhanapriya, M. (2025). Land use land cover (LULC) change detection of east lamp; south eastern coastal plain of Odisha from 1990–2018 and its impact over land surface temperature (LST). J. Exp. Agric. Int. 47, 1–26. doi: 10.9734/jeai/2025/v47i63466
Gregory, B. B., and Gerald, E. G. (2020). United States flood risk management in changing times. Water Policy 23, 234–269.
Ibeabuchi, U. (2023). Mapping seasonal flood inundation and developing an early warning system for Lagos Metropolis (Nigeria): A study between 1990 and 2011. Water Environ. Sustain. 3, 48–67. doi: 10.52293/WES.3.2.4867
Isiaka, I. O., Gafar, S., Ajadi, S. A., and Mukaila, I. (2023). Flood susceptibility assessment of Lagos State, Nigeria using geographical information system (GIS)-based frequency ratio model. Int. J. Environ. Geoinformatics 10, 76–89. doi: 10.30897/ijegeo.1181698
Jensen, J. R. (1996). Introductory digital image processing: a remote sensing perspective. Upper Saddle River, NJ: Prentice Hall, 55.
Kasim, O. F., Wahab, B., and Oweniwe, M. F. (2022). Urban expansion and enhanced flood risk in Africa: The example of Lagos. Environ. Hazards 21, 137–158. doi: 10.1080/17477891.2021.1932404
Katirtzidou, M., Skoulikaris, C., Makris, C., Baltikas, V., Latinopoulos, D., and Krestenitis, Y. (2023). Modeling stakeholders’ perceptions in participatory multi-risk assessment on a deltaic environment under climate change conditions. Environ. Model. Assess. 28, 367–388. doi: 10.1007/s10666-023-09890-5
Lagos State Emergency Management Agency. (2023). Flood vulnerability assessment and mapping of Lagos State using GIS technique. Available online at: https://ludi.org.ng/wp-content/uploads/2020/06/FLOOD-VULNERABILITY-ASSESSMENT-AND-MAPPING-OF-LAGOS-STATE.pdf.pdf. (Accessed July 21, 2024)
Lawanson, O. I., Proverbs, D., and Ibrahim, R. L. (2023). The impact of flooding on poor communities in Lagos State, Nigeria: the case of the Makoko urban settlement. J. Flood Risk Manage. 16:e12838. doi: 10.1111/jfr3.12838
Long, Y., Li, Y., Lei, X., Hou, Y., Guo, S., and Sun, J. (2021). A study on comprehensive evaluation methods for coordinated development of water diversion projects based on advanced SWOT analysis and coupling coordination model. Sustainability 13:13600. doi: 10.3390/su132413600
Nathaniel, Y. G., Soeryamassoeka, S., and Yulianto, E. (2023). Flood management strategy in the Singkawang City using SWOT analysis. J. Civil Eng. 23, 511–520. doi: 10.26418/jts.v23i4.68830
National Population Commission. (2006). Summary and Statistical Report of the 2006 Population and Housing Census, Abuja. 154–194.
Ndimele, P. E., Ojewole, A. E., Mekuleyi, G. O., Badmos, L. A., Agosu, C. M., and Olatunbosun, E. S. (2024). Vulnerability, resilience, and adaptation of Lagos coastal communities to flooding. Earth Sci. Syst. Soc. 4:10087. doi: 10.3389/esss.2024.10087
Nghiningwa, A. N., Adelekan, I. O., and Mshelia, Z. H. (2025). Shoreline change, sea level rise and the impacts along the coastline of Walvis Bay, Namibia. Ocean Coast. Manage. 266:107690. doi: 10.1016/j.ocecoaman.2025.107690
Nigeria Hydrological Service Agency. (2024). Annual flood outlook (flood history, mitigation, and adaptation measures). Available online at: https://nihsa.gov.ng/2024/04/18/honourable-minister-of-water-resources-unveils-2024-annual-flood-outlook-emphasizing-data-analytics-and-modeling-for-flood-risk-assessment-and-food-security/ (Accessed July 28, 2025).
Obiefuna, J. N., Adeaga, O., Omojola, A., Atagbaza, A. O., and Okolie, C. J. (2021). Flood risks to urban development on a coastal barrier landscape of Lekki Peninsula in Lagos, Nigeria. Sci. Afr. 12:e00787. doi: 10.1016/j.sciaf.2021.e00787
Odunsi, O. M., Olawuni, P. O., Daramola, O. P., Olugbamila, O. B., Odufuwa, B. O., Onanuga, M. Y., et al. (2024). Households’ resilience to flood disaster in Lagos State, Nigeria: developing a conceptual framework unifying disaster resilience components and dimensions. J. Environ. Stud. Sci. 14, 69–86. doi: 10.1007/s13412-023-00864-3
Ogato, G. S., Bantider, A., Abebe, K., and Geneletti, D. (2020). Geographic information system (GIS)-based multicriteria analysis of flooding hazard and risk in Ambo Town and its watershed, West Shoa Zone, Oromia Regional State, Ethiopia. J. Hydrol. Reg. Stud. 27:100659. doi: 10.1016/j.ejrh.2019.100659
Oguntola, T. (2022). Flood: 603 dead, 1.3 m displaced across Nigeria—federal government, leadership for god and country. Available online at: https://leadership.ng/2022-flood-603-dead-1.3m-displaced-across-nigeria-federal-government/. (Accessed February 20, 2023)
Oguntokun, B. F., and Fayomi, I. (2025). Impact of Urban Flood Management on the Values of Properties in Ibadan, Oyo State. African Journal of Environment and Natural Science Research. 8, 105–118.
Oladipo, M. O. (2023). Preview of causes, frequency, extent, magnitude and intensity of flooding in nigeria. IIARD International Journal of Geography & Environmental Management (IJGEM). 9, 52–60.
Olowoopejo, M. (2019). Lagos Blames Residents for Persistent Flooding Vanguard 27 June [Online]. Available online at: https://www.Vanguardngr.Com/2019/06/Lagos-Blames-Residents-Persistent-Flooding/ (Accessed February 8, 2022).
Onifade, V. A., Yoade, A. O., Olatunji, S. A., and Husseni, M. A. (2023). Effects of flooding on urban lives and properties in Lagos, Nigeria. Int. J. Infrastructure Res. Manage. 11, 46–62.
Orimoogunje, O., and Aniramu, O. (2025). Systematic Review of Flood Resilience Strategies in Lagos Metropolis: Pathways toward the 2030 Sustainable Development Agenda. Frontiers in Climate. 7:1603798.
Orimoogunje, O. O., Fashae, O. A., Oke, T. O., and Akinwumiju, A. S. (2016). Flood vulnerability in part of southwestern Nigeria. Acad. J. Environ. Sci. 4, 55–61. doi: 10.15413/ajes.2015.0101
Osanyintuyi, A. J., Wang, Y. H., and Mokhtar, A. H. (2022). Nearly five decades of changing shoreline mobility along the densely developed Lagos barrier-lagoon coast of Nigeria: a remote sensing approach. J. Afr. Earth Sci. 194:104628. doi: 10.1016/j.jafrearsci.2022.104628
Osayomi, T., Olobo, P., Ogunwumi, T., Fatayo, O. C., Akpoterai, L. E., Mshelia, Z. H., et al. (2022). “I lost all I had to the flood”: A post-disaster assessment of the 2018 Kogi state flood in Nigeria. Ife Soc. Sci. Rev. 30, 1–20.
Popescu, G., and Gasparotti, C. (2022). SWOT-AHP hybrid method for ranking the relaunching strategies of an industrial company. J. East Eur. Manage. Stud. 27, 709–730. doi: 10.5771/0949-6181-2022-4-709
Purbasari, A., Gusdya, W., Mulyanto, F., and Nurlatifah, V. F. (2021). Application of the open data kit for data collection presence of primary school teachers. IAIC Trans. Sustain. Digit. Innov. 2, 158–168. doi: 10.34306/itsdi.v2i2.409
Rahman, M., Ningsheng, C., Iftekhar, M. G., Monirul-Islam, M., Reza, P. H., Ahmad, H., et al. (2021). Flooding and its Relationship with Land Cover Change, Population Growth, and Road Density. Geoscience Front. 12, 101–114.
Saaty, T. L. (1980). The analytic hierarchy process: planning, priority setting, resources allocation 1980. New York, NY: McGraw Hill, 19–29.
Saaty, T. L. (1990). How to make a decision: the analytic hierarchy process. Eur. J. Oper. Res. 48, 9–26. doi: 10.1016/0377-2217(90)90057-I
Saaty, T. L., and Vargas, L. G. (2001) Models, methods, concepts & applications of the analytic hierarchy process ; New York: McGraw Hill.
Salami, H. S., and Otokiti, K. V. (2022). Ineffective Development Control and Flood Susceptibility in Lokoja, Nigeria. Discovery. 55, 468–476.
Tramblay, Y., Villarini, G., and Zhang, W. (2020). Observed changes in flood hazard in Africa. Environ. Res. Lett. 15, 104–121. doi: 10.1088/1748-9326/abb90b
Tzanou, E., and Skoulikaris, C. (2024). Geo-referenced databases and SWOT analysis for assessing flood protection structures, measures, and works at a river basin scale. Hydrology 11:136. doi: 10.3390/hydrology11090136
United Nations Development Programme. (2023). Climate change’s impact on coastal flooding to increase five times over this century. Available online at: https://hdr.undp.org/content/climate-changes-impact-coastal-flooding-increase-five-times-over-century. (Accessed August 28, 2024).
United Nations Environment Program. (2022). Flood control: how countries can cope with flooding. Available online at: https://www.millenniumassessment.org/en/Reports.aspx.Accessed. (Accessed January 11, 2024)
United Nations International Strategy for Disaster Reduction. (2022). The human cost of natural disasters: a global perspective. Available online at: https://www.preventionweb.net/publication/human-cost-natural-disasters-global-perspective. (Accessed August 28, 2024)
United Nations Office for Disaster Reduction (2023) Uncounted costs of disaster: gaps hide the true human impacts of disasters in 2023. Available online at: https://www.undrr.org/explainer/uncounted-costs-of-disasters-2023. (Accessed January 11, 2024)
Keywords: SWOT-AHP analysis, urban flooding, vulnerability mapping, early warning system, strategic planning, urban infrastructure
Citation: Aniramu O and Orimoogunje O (2025) Integrating geospatial mapping and stakeholders’ perception on sustainable flood solutions in a typical coastal megacity of Nigeria: a SWOT-AHP approach. Front. Sustain. Cities. 7:1663269. doi: 10.3389/frsc.2025.1663269
Edited by:
Kossivi Fabrice Dossa, University of Nigeria, NigeriaReviewed by:
Olamiposi Fagunloye, Georgia State University, United StatesAaron Tettey Tetteh, University of Energy and Natural Resources, Ghana
Copyright © 2025 Aniramu and Orimoogunje. This is an open-access article distributed under the terms of the Creative Commons Attribution License (CC BY). The use, distribution or reproduction in other forums is permitted, provided the original author(s) and the copyright owner(s) are credited and that the original publication in this journal is cited, in accordance with accepted academic practice. No use, distribution or reproduction is permitted which does not comply with these terms.
*Correspondence: Opeyemi Aniramu, c2FtdWVsYW5pcmFtdUBnbWFpbC5jb20=