Abstract
Smart city initiatives are increasingly promoted as strategies to foster urban sustainability. However, their actual impact largely depends on the feasibility and success of individual projects through which these strategies are implemented. Despite this relevance, feasibility analyses remain scarce in the scientific literature, particularly for small and medium-sized cities, where limited resources and high opportunity costs demand careful decision-making. This study addresses this gap by proposing a comprehensive and practical framework specifically designed to evaluate the feasibility of smart city projects in resource-constrained contexts. The framework is developed through a systematic literature review and a multi-stage analysis, resulting in a structured set of 38 indicators grouped into five core subject areas: spatial-population impact, social perception, technical readiness, institutional capacity, and economic-financial viability. It comprises a descriptive component, which gathers essential project data, and an evaluative component, which applies multicriteria decision-making techniques (Analytic Hierarchy Process) to generate feasibility scores for each thematic dimension. The framework was applied to a case study of implemented projects in a small city, offering exploratory findings on its capacity to anticipate outcomes and laying the groundwork for broader empirical validation across diverse urban contexts. Spearman correlation results revealed the decisive role of social acceptance and institutional support, while showing that technical readiness, though necessary, is not sufficient on its own. Designed as a decision-support tool for policymakers and urban planners, the framework fosters more transparent and inclusive governance and aligns with international agendas such as the UN Sustainable Development Goal 11.
1 Introduction
In recent decades, within a context characterized by the growing influence of technology in all aspects of society, cities have massively embraced the transformative potential of the smart city model (Gracias et al., 2023) The integration of information and communication technologies into urban planning seeks holistic management that optimizes resources (Geropanta, 2020) within the cyber-physical-social systems that cities have become (Cassandras, 2016; Golubchikov and Thornbush, 2022). With urban populations continuously growing (Gere, 2018), this approach aims to address the sustainability challenges cities face (De Genaro Chiroli et al., 2022), highlighted as one of the sustainable development goals in the UN’s 2030 Agenda (Aljowder et al., 2023).
Assessment models for smart cities, as a field of research developed over the past two decades (Lacson et al., 2023), have become a fundamental tool for measuring the performance that smart cities require (Carli et al., 2013). These assessment models adopt various approaches, such as the creation of rankings (Cohen, 2014; Giffinger et al., 2007), maturity level assessments (Aragão et al., 2023; Liu et al., 2022), or project evaluation frameworks (Fernandez-Anez et al., 2020; Wu and Chen, 2021). They typically include a set of indicators, either developed within the model itself or based on international standards, particularly ISO 37120 and 37,122 (ISO 37120, 2018; ISO 37122, 2019) as the most widely used in smart city evaluation models (Aragão et al., 2023; Lacson et al., 2023), measuring city performance across various dimensions such as governance, economy, environment, and mobility.
But, is every city prepared to undertake the transformative process implied by the smart city model? Judging by the widespread adoption of this model across cities worldwide, it might seem so. However, while performance analysis models for smart city policies have proliferated in recent years, models for the prior feasibility analysis of smart city policies are far less common, and those that include a comprehensive set of indicators are nearly non-existent. Nevertheless, the necessity of conducting a readiness assessment for a city to adopt smart city strategies is considered essential (Febiyanti and Susanto, 2024). Unlike maturity assessments, which evaluate the performance and developmental stages of smart city implementations, readiness or feasibility studies focus on assessing whether a city has the foundational capacities and conditions necessary to initiate smart city strategies (Orlowski, 2021). This distinction is critical, as feasibility emphasizes the prerequisites and early-stage evaluations needed to avoid failures and ensure sustainability (Febiyanti and Susanto, 2024). Specifically, feasibility assessments help anticipate and mitigate social and environmental risks that can undermine the long-term sustainability of urban transformation processes and are therefore a critical component of these policies (Sharifi, 2019). This lack of analysis and criteria has been repeatedly and prominently highlighted in recent studies on smart city evaluations (Arief et al., 2020; He, 2023).
Additionally, smart city policies are materialized through projects (Angelidou, 2015; BSI PAS, 2017). Just as the success of a general smart city strategy depends on its adaptability to the specific characteristics of a city (Fernandez-Anez et al., 2018), the scalability of projects successfully developed in one city is not straightforward and must be carefully analyzed (Manville et al., 2014). Conducting a feasibility study before project implementation proves fundamental to avoiding failures and inefficiencies in investments, especially in smaller cities with more limited resources (Mashau and Kroeze, 2024). These cities have distinct characteristics compared to larger ones and a great weight in the transition to sustainability (Mohareb and Perrotti, 2024). Moreover, the opportunity costs of failed investments in these cities are extraordinarily high and therefore the evaluation models and indicators employed must be adapted to their specific contexts (Dall’O et al., 2017). In line with this, the literature also emphasizes that assessment tools for smart and sustainable cities should be explicitly oriented toward decision-making by city managers and policy makers (Toh, 2022). Simplicity in their design and application (Huovila et al., 2019), together with transparency in their selection, is crucial to ensure that these frameworks remain accessible and genuinely support informed decisions rather than being used as artificial justification for pre-defined policies (Panagiotopoulou et al., 2020).
The relevance of this work lies in bridging the general gap detected in the lack of tools for analyzing the feasibility of smart city strategies, and specifically in the analysis of smart city projects. Although international standards such as those developed by ISO and ITU, together with frameworks based mainly on collections of indicators, provide useful benchmarks for monitoring smart city performance, their reliance on standardized metrics makes them insufficient for evaluating the feasibility of specific projects. The framework proposed in this study is intended to complement these approaches by addressing this missing dimension of early-stage analysis.
The primary objective of this research is to develop a framework that provides a comprehensive tool for evaluating the critical aspects of smart city project feasibility. The framework is conceived as a decision-support tool for urban planners and policy makers to optimize investments and resources, with a special focus on smaller cities, where smart city policies are less developed and consolidated. To achieve this goal, the framework emphasizes the aspects of practicality and simplicity as other models (ASCIMER, 2017a), particularly with regard to cities operating under resource constraints (Dall’O et al., 2017). Its structure is designed to enable easy data collection by technical staff within urban strategy departments, while also ensuring that the results are straightforward to interpret by institutional decision-makers. Finally, certain components of the framework are designed to adapt specifically to the city where it is applied, evolving over time in alignment with the progress of the city’s smart city plan.
The article is structured into three main parts: section 2 explains the methodology for developing the framework, while section 3 and 4 focus on results, discussion, and conclusions. Through a systematic literature review, designed as a transparent and replicable process of search, screening, and selection, a sequential analysis was then performed to define a basic structure based on the primary thematic areas for feasibility evaluation and the key factors within each core subject area. Using this structure, a collection of indicators and parameters is developed for each identified factor. Subsequently, multicriteria decision-making tools are applied to construct the evaluation indices corresponding to the framework’s assessment component, through a process of expert panel consultation. Finally, the framework is applied to a set of real projects with observed results as a case study, applying statistical tools to establish the correlation with these results and analyzing the most influential aspects on project feasibility and initial validity of the framework. The article also includes, as a supplementary appendix, the complete collection of developed feasibility indicators and the data for its application in the case study.
2 Materials and methods
The framework developed in this research serves as a support tool for analyzing the feasibility of smart city projects. It can function independently or as a complement to evaluations of other aspects, such as priority, impact, or alignment with the strategic objectives of the city’s plans related to the analyzed project. For this reason, it must have its own structure while remaining integrable into other evaluation models that assess complementary aspects to feasibility. Consequently, the methodology followed consists of several phases aligned with the development of the framework’s structure (Figure 1).
Figure 1
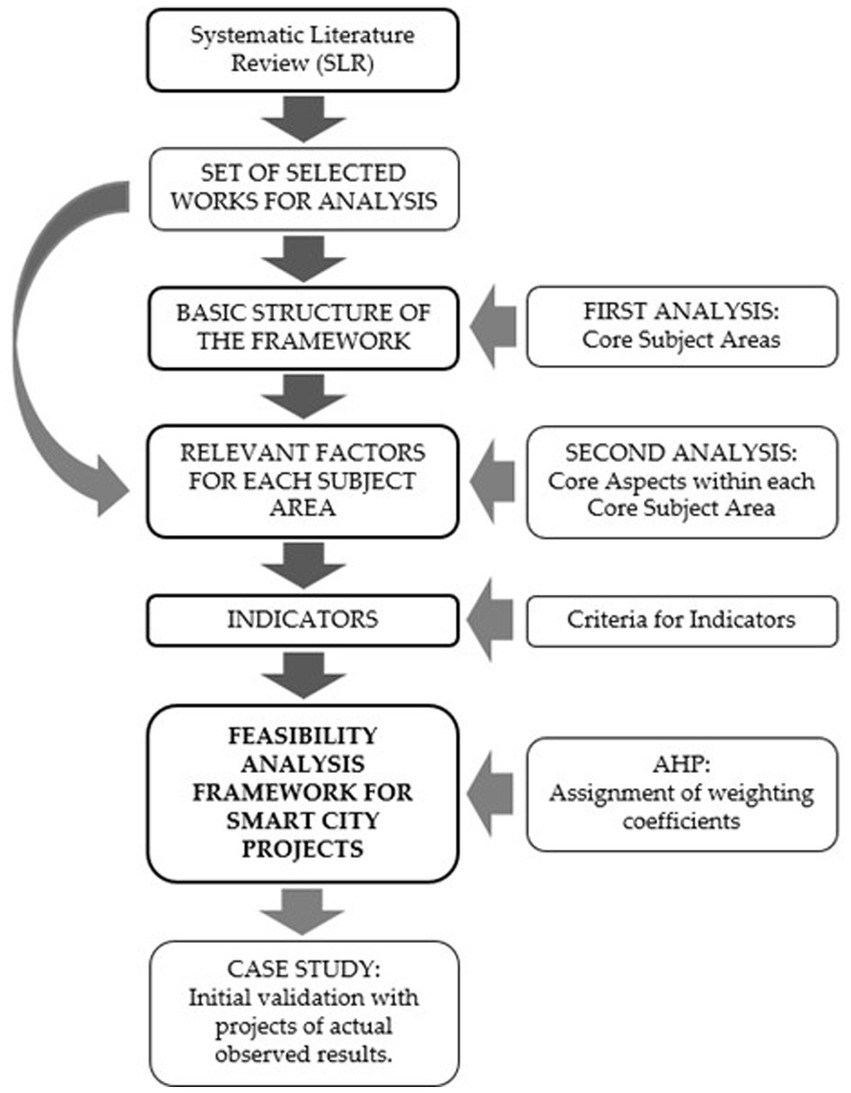
Workflow of the research methodology.
2.1 Literature review and sequential analysis
The first step involves establishing the theoretical foundations of the framework by conducting a systematic literature review (SLR) as the method for identifying, collecting, and analyzing relevant research in the field (Liberati et al., 2009). This approach is particularly suitable when the research field is still emerging and relatively narrow (Snyder, 2019), as is the case here. The analysis followed a structured and comparative logic, appropriate given the qualitative nature of most studies in this domain (Grant and Booth, 2009). To collect the data, searches were carried out in Web of Science1 and Google Scholar,2 both of which are frequently used in reviews and studies on smart cities due to their broad coverage and relevance for the field (Gracias et al., 2023; Lacson et al., 2023; Sharifi, 2019). While Google Scholar may present limitations in terms of indexing consistency, its inclusion ensured broader coverage and allowed the identification of emerging or less widely indexed studies, complementing the more selective scope of Web of Science. The search was limited to works published in English, including journal articles, proceedings, and book chapters, covering the period from 2014 to the time of execution (December 2024).
The keywords used combined the terms “smart cities” AND “projects” OR “initiatives” AND “feasibility” OR “viability” OR “readiness.” After an initial search and the removal of duplicates and obviously irrelevant records, 281 papers remained for preliminary screening. Their titles, keywords, and abstracts were reviewed for relevance to the feasibility of smart city projects, resulting in 37 papers retained for full-text analysis. From this set, 19 papers were subsequently excluded based on the following criteria:
-
Not specifically including elements of feasibility analysis within the scope of smart cities, even if the topic is addressed indirectly.
-
Readiness analyses that are more results-oriented and resemble maturity assessments, which represent a major difference in focus compared to this framework.
-
Complementary to the previous point, models based primarily on standardized indicators, mainly ISO 37120:18, ISO 37122:19, and ITU 1603 (2016), are excluded, as these are more related to performance evaluation of smart cities than to readiness from the approach proposed in this research.
-
Studies focused on very specific aspects such as technology or mobility that do not contribute to a more comprehensive view of project feasibility.
However, some documents were added even though they did not meet the initial search criteria, as they are institutional reports and therefore cannot be categorized strictly as scientific research. Nevertheless, they appeared as key references in other selected works and contain relevant information. This is the case for the reports by Portulans Institute (2024), Simpson (2017), and Smart Cities Council (2015).
In addition to the four selection criteria mentioned above, the selected articles must also provide information to address the two key questions that guide this stage of the research:
-
Question 1: What are the main thematic areas that a feasibility framework for smart city projects should include in order to provide a comprehensive view of the concept?
-
Question 2: Within each of these basic thematic areas, what specific indicators are necessary?
The 21 studies finally retained are presented in Table 1. The relatively low number of sources reflects the scarcity of empirical research specifically focused on project feasibility within the smart city field. Beyond the exclusion criteria, the final set of studies was selected based on their methodological soundness and their direct relevance to the research questions. While a broader literature exists on smart and sustainable cities, very few works explicitly address feasibility aspects. The limited number of retained sources therefore reflects not a restrictive selection process but the actual scarcity of feasibility-oriented research, underlining the originality and necessity of the framework proposed.
Table 1
| Title | Year | References | Description |
|---|---|---|---|
| Smart Cities Readiness: Smart Cities Maturity Model and Self-Assessment Tool. | 2014 | Scottish Cities Alliance (2014) | Smart cities maturity model to assess situation of the city and as a help to identify priorities for investment. |
| Mapping Smart Cities in the EU. | 2014 | Manville et al. (2014) | Report of the European Commission on smart cities. Identification of best practices in smart city projects, analyzing how they affect the dimensions of the city. |
| Smart Cities Readiness Guide: The planning manual for building tomorrow’s cities today. | 2015 | Smart Cities Council (2015) | Comprehensive handbook of strategies and tools for planning and building sustainable, efficient and smart cities. |
| Exploratory Research on the Success Factors and Challenges of Smart City Projects. | 2014 | Kogan and Lee (2014) | Analytical tool for Smart City success factors. Analysis of challenges and barriers of Smart City Projects implementations. |
| A multilevel method to assess and design the renovation and integration of Smart Cities. | 2015 | Mattoni et al. (2015) | Planning methodology based on a model for evaluating project actions and their synergies at various territorial levels. |
| City keys indicators for smart city projects and smart cities. | 2017 | Bosch et al. (2017) | Collection of impact indicators for project and smart city evaluation |
| Assessing Smart City Initiatives for the Mediterranean Region (ASCIMER). | 2017 | ASCIMER (2017b) | Assessment model for smart city initiatives in the Mediterranean Region, developed for EIB. |
| Smart cities – Developing project proposals for delivering smart city solutions – Guide. | 2017 | BSI PAS (2017) | Guidance on the development of project proposals to provide solutions and best practices in smart cities and the creation of viable projects. |
| Smart cities: understanding the challenges and opportunities. | 2017 | Simpson (2017) | Global survey of city leaders to identify perceptions, drivers and barriers to smart city infrastructure implementation. |
| Smart Cities: Implementation vs. Discourses. | 2019 | Sharifi (2019) | Review and critical analysis of smart city assessment tolls from different aspects with stakeholder engagement, contextual sensitivity and feasibility. |
| Smart Sustainable Cities - Vision and Reality The Egyptian Context as a Case Study. | 2019 | Konbr (2019) | Study on smart cities and their roadmap in the context of Egypt, identifying the local challenges and opportunities, and the key actions needed for this transformation. |
| Towards an Integrated Framework to Measure Smart City Readiness: The Case of Iranian Cities. | 2020 | Noori et al. (2020) | Indicator system to measure and assess smart city readiness with a theoretical framework focusing on the case of cities in Iran. |
| A structured method for smart city project selection. | 2021 | Wu and Chen (2021) | Model for the selection of smart city projects with the objective of configuring a viable project portfolio that meets citizens’ expectations. |
| Leading smart city projects: Government dynamic capabilities and public value creation. | 2021 | Barrutia et al. (2022) | Conceptual framework on the effect of different combinations of government capabilities on public value in innovation projects framed in smart cities, |
| Smart Cities Concept - Readiness of City Halls as a Measure of Reaching a Smart City Perception. | 2021 | Orlowski (2021) | Smart Cities assessment based on municipalities’ readiness for a smart city. |
| The role of dynamic managerial capabilities and organizational readiness in smart city transformation. | 2022 | Guenduez and Mergel (2022) | Study on the dynamic management capabilities of smart city managers and on the organizational readiness of a municipal administration needed to drive smart city transformation. |
| Feasibility Study of E-Readiness to Creating Smart Municipality. | 2022 | Mahmoudi and Ghasemi (2022) | Study on the adaptation needs of cities in the context of Iran for the process of transformation towards smart cities. |
| Assessing the smart city: A review of metrics for performance assessment, risk assessment and construction ability assessment. | 2023 | He (2023) | Critical review of metrics involving national frameworks, institutional standards and local reports, focusing on assessing methodologies, risk and construction ability of smart cities. |
| Network Readiness Index 2024. | 2024 | Portulans Institute (2024) | Index that evaluates 133 economies in four key dimensions (Technology, People, Governance and Impact), studying the global digital transformation. |
| Readiness Assessment Tool for Smart City Implementation in Small and Rural Municipalities. | 2024 | Mashau and Kroeze (2024) | Assessment tool specifically adapted to evaluate the readiness of small municipalities for the implementation of smart cities. |
| Identification Of Smart City Readiness Indicators: A Literature Review. | 2024 | Febiyanti and Susanto (2024) | Literature review to identify indicators and aspects to be measured for smart cities readiness. |
Result of the SLR for the analysis of feasibility issues in smart cities.
The selected results are not necessarily models specifically focused on project feasibility evaluation. In fact, this type of research is relatively uncommon, with most studies focusing instead on assessing a city’s readiness from specific perspectives. Questions 1 and 2 are addressed through a sequential analysis of the selected works, progressing from general to more detailed levels:
-
The first analysis defines the core structure of the framework by identifying the main thematic areas. This involves classifying the broad groups under which feasibility evaluation indicators are organized.
-
Once the basic structure was established, a second, more detailed analysis was conducted. For each core subject area, the studies were examined to identify specific elements discussed within them, with the aim of extracting relevant factors and detecting second-level consistencies, aligning them with the framework’s common structure.
2.2 Development of feasibility indicators
For each factor identified within the core subject areas, a corresponding indicator is developed. As this framework is primarily intended for use in smaller cities, indicators must strike a balance between providing meaningful, decision-supporting information and being simple to use. They should offer sufficient, precise, and relevant data to fully describe the project and enable comparison with other alternatives, while also being based on easily obtainable information from a well-developed project proposal. The goal is to create a collection of indicators that supports urban managers in selecting appropriate metrics for making better-informed political decisions (Panagiotopoulou et al., 2020).
To maintain simplicity, the number of indicators per thematic area should be kept to a minimum, avoiding redundancy through grouping and reduction. The development follows ISO 37122:19 principles, ensuring completeness, technology neutrality, simplicity, validity, verifiability, and availability.
Given the nature of the framework, indicators are designed for the evaluation of estimates or forecasts, i.e., before project implementation, and are mostly input indicators, which measure the quantity, quality, and timeliness of the resources needed (Bosch et al., 2017). In some cases, process or expected outcome indicators may also be included, depending on the evaluation aspect.
Three indicator types are used, depending on the data required:
-
Likert-scale indicators (five-point scale based on planner or manager estimation), which allow qualitative judgments to be incorporated in a structured way, facilitating comparison between projects and guiding decisions in the early planning stages (Joshi et al., 2015).
-
Binary indicators (yes/no responses),
-
Quantitative indicators (requiring specific numerical data).
Finally, the indicators are designed to be re-evaluable after project implementation, enabling comparison between projected and actual outcomes and supporting continuous improvement in future feasibility assessments.
2.3 Application of multicriteria decision-making methods
Once the indicators have been defined for each thematic area of the framework, multicriteria decision-making (MCDM) tools are applied to assign weights to each indicator within its respective area. This allows both an overall view of the project’s feasibility and the creation of synthetic indicators for each thematic area.
MCDM tools are used to support complex decision-making processes by helping identify the most influential factors in a given decision (Lacson et al., 2023). These techniques are among the most widely used quantitative methods for smart city evaluations, as they allow for the analysis of trade-offs between various criteria (Gracias et al., 2023), particularly in the weighting of individual indicators (Hajek et al., 2022).
The selected method is the Analytic Hierarchy Process (AHP), proposed by Thomas L. Saaty. AHP is based on the principles of decomposition, pairwise comparison, and hierarchical composition of priorities (Saaty, 2001). The decision problem is structured into different hierarchical levels, with the overall goal at the top, the alternatives at the bottom, and the criteria and sub criteria in the intermediate levels. These criteria must be clearly defined and mutually independent (Saaty, 1980). This method has been applied in other smart city evaluation models for the same purpose: determining the relative importance of different criteria (Stanković et al., 2017). In such models, the criteria typically correspond to the smart city dimensions, while the sub criteria align with the indicators for each dimension (Shi et al., 2018).
In this case, the criteria and sub criteria correspond to first-order and second-order indicators, respectively. Using Saaty’s comparison scale from 1 to 9, where 1 indicates equal importance and 9 indicates that one criterion is extremely more important than another (Saaty, 1980), comparisons are made based on the judgments of a panel of experts in each thematic area. The pairwise comparison of criteria at the same level results in a square matrix A, known as the criteria comparison matrix:
Where n is the number of criteria and are the values of the comparison between the pairs of criteria i and j. This matrix satisfies the condition of reciprocity (= 1/) and homogeneity (value 1 in the case of a criterion against itself). In addition, the consistency of the judgments used to construct the matrix must be verified. This is done through the following equations:
Where CI is the consistency index, is the maximum eigenvalue of the matrix, RI is the consistency index of a random matrix of the same size and CR is the consistency ratio. The weights of each criterion are obtained from the criteria comparison matrix A using the eigenvalue method, according to the equation:
Where is the eigenvector or preference criterion vector and includes the value of the weights for each criterion.
Although the AHP method has certain limitations compared to other multi-criteria techniques such as TOPSIS or PROMETHEE, particularly due to the potential subjectivity introduced by expert judgments, it also offers important advantages in this context: its relative simplicity facilitates the replicability of the framework across different urban contexts, as the weighting coefficients can be recalculated for each city to reflect local priorities and expert assessments. Moreover, its widespread use in smart city evaluation frameworks (De Genaro Chiroli et al., 2022; Shi et al., 2018; Stanković et al., 2017) provides additional support for its application in this research.
Expert panels for comparing criteria are configured separately for each of the evaluative core subject areas, that is, those requiring weighting coefficients for the construction of synthetic indices by thematic dimension. Experts were selected based on proven professional experience in the specific domain, combined with thorough knowledge of the city’s current situation to ensure that their judgments reflected local realities. In addition, complementarity of perspectives was sought by including both political or managerial profiles and more technical or operational ones, in order to achieve a balanced and representative set of viewpoints. This configuration aimed to reduce the potential bias of single-sector perspectives and to strengthen the robustness of the weighting process.
2.4 Application of the framework to a case study and correlation analysis design
During the expert panel consultations for determining the weighting coefficients, two open-ended questions were included to identify potential omissions in the parameters and indicators, and to incorporate any relevant additions:
-
Do you consider that the framework addresses the fundamental aspects for evaluating the feasibility of a smart city project?
-
If not, which additional aspects would you suggest including?
After incorporating relevant feedback, the framework is tested on a set of seven smart city projects from a case study, each with different characteristics. These projects, which had already been implemented, were selected based on their thematic diversity, varying contextual characteristics, and the availability of post-implementation information regarding outcomes. The results obtained through the application of the framework to these projects were then compared with their actual outcomes to assess the initial suitability and reliability of its application. To explore the potential consistency between the framework’s feasibility scores and actual project outcomes, a statistical procedure was designed through correlation analysis.
3 Results and discussion
3.1 First analysis: core subject areas
This initial analysis focuses on identifying the main thematic areas that will define the basic structure of the feasibility analysis framework. It does not involve an in-depth examination of how these areas are addressed, but rather a preliminary identification of those considered most relevant. The studies selected through the SLR vary in nature. On one hand, their approaches differ: some focus on collections of impact indicators (Bosch et al., 2017), others on general smart city evaluation models which also reflect aspects of viability (ASCIMER, 2017b; Mattoni et al., 2015), or on specific dimensions such as governance (Barrutia et al., 2022). On the other hand, the thematic scope also varies: ranging from conceptual analyses of feasibility (Orlowski, 2021), general approaches (Febiyanti and Susanto, 2024), application to specific project types (Mashau and Kroeze, 2024), geographical contexts (Noori et al., 2020), or focused on specific aspects like municipal institutional capacities (Guenduez and Mergel, 2022). Due to this diversity, few studies address all the core subjects of smart city project feasibility. Nevertheless, in this analysis we perform a tally of recurring themes across the entire set of selected studies.
An initial classification based on a high-level analysis includes the following categories: budgetary or economic-financial aspects, governance and municipal institutional/administrative aspects, technical and technological aspects, and social aspects (Febiyanti and Susanto, 2024). Issues related to budgeting, technical limitations, and institutional capacities are explicitly mentioned, for example, in Sharifi (2019), while social aspects are also indirectly. In fact, the vast majority of general studies refer, either directly or indirectly, to these four dimensions (Table 2).
Table 2
| References | Spatial and population incidence | Social | Technical | Governance | Economic-financial |
|---|---|---|---|---|---|
| Scottish Cities Alliance (2014) | O | O | O | O | |
| Manville et al. (2014) | O | O | |||
| Smart Cities Council (2015) | O | O | |||
| Kogan and Lee (2014) | O | O | |||
| Mattoni et al. (2015) | O | O | O | O | |
| Bosch et al. (2017) | O | O | O | O | O |
| ASCIMER (2017b) | O | O | O | O | O |
| BSI PAS (2017) | O | O | O | O | |
| Simpson (2017) | O | O | O | ||
| Sharifi (2019) | O | O | O | O | O |
| Konbr (2019) | O | O | O | O | |
| Noori et al. (2020) | O | O | O | ||
| Wu and Chen (2021) | O | O | O | O | O |
| Barrutia et al. (2022) | O | O | |||
| Orlowski (2021) | O | O | O | ||
| Guenduez and Mergel (2022) | O | O | O | O | O |
| Mahmoudi and Ghasemi (2022) | O | O | |||
| He (2023) | O | ||||
| Portulans Institute (2024) | O | O | O | ||
| Mashau and Kroeze (2024) | O | O | O | O | |
| Febiyanti and Susanto (2024) | O | O | O | O | |
| Total | 7 | 15 | 18 | 17 | 15 |
Treatment of core subjects in the analyzed papers.
To these four basic categories, a fifth should be added: aspects related to population and territorial impact. Although this dimension is addressed less frequently than the others, it is clear that a framework for analyzing the feasibility of smart city projects must take into account both the population directly and indirectly affected by the project, as well as its geographical area of implementation. With these five categories defined as the starting point for analysis, the result of the thematic overlaps is presented in Figure 2.
Figure 2
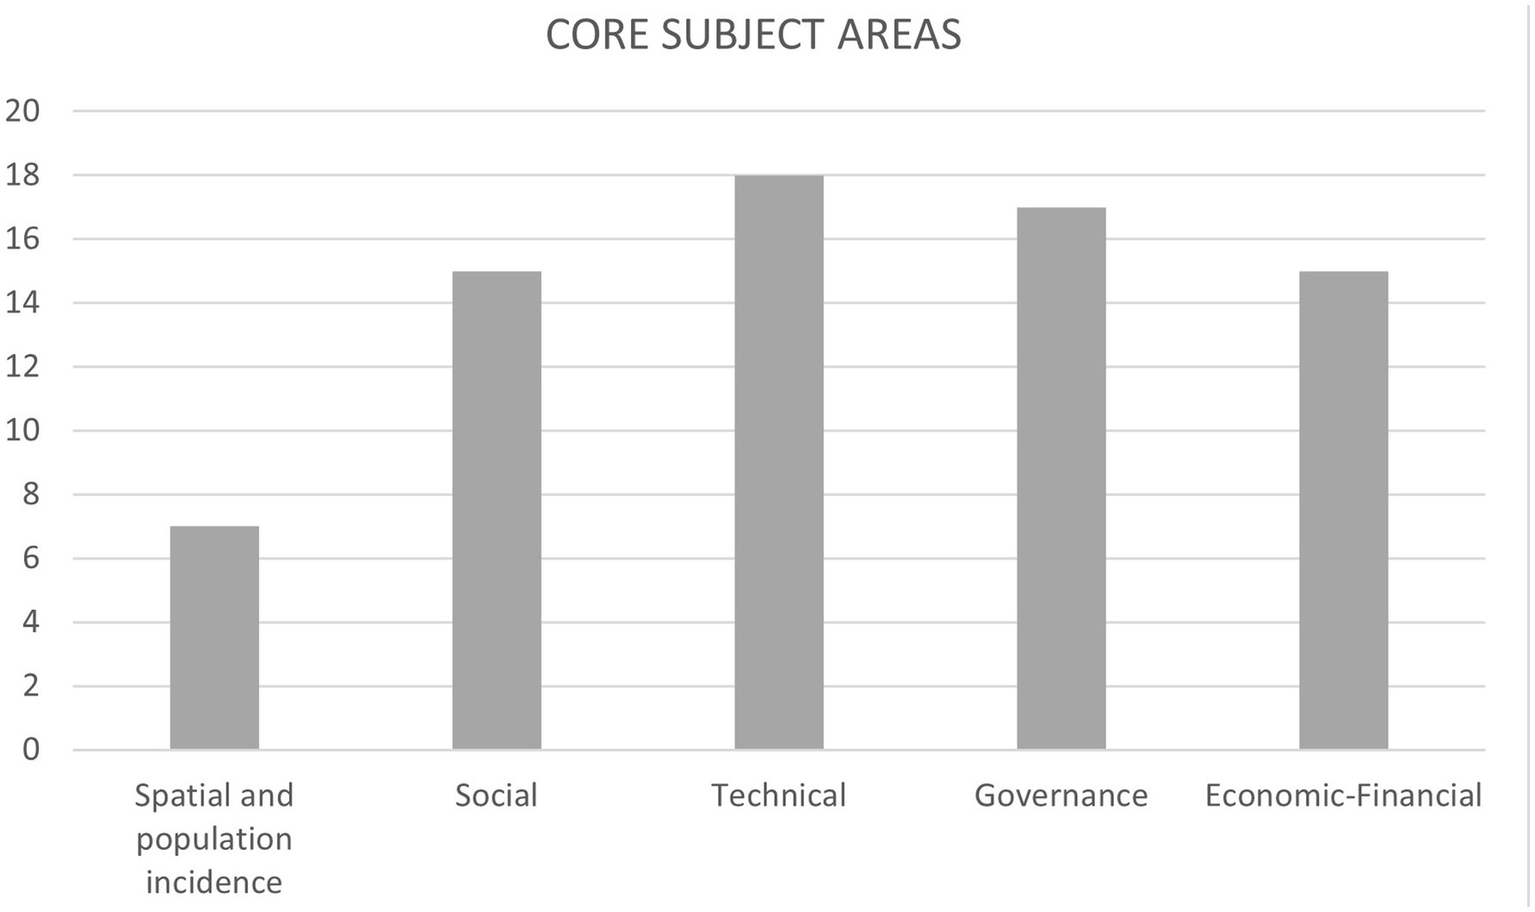
Main core subjects in the analyzed papers.
The four main groups initially identified appear in over 70% of the selected studies, while the fifth, though less frequent, also receives meaningful attention. Based on this, the basic structure of the framework is defined around the following general areas:
-
Spatial and population impact: covers the population affected and the geographic scope of the project.
-
Perception and social repercussion: refers to how the project is perceived by citizens and its social impact.
-
Technical feasibility: involves the availability of technical and technological resources for implementation, operation, and monitoring.
-
Institutional feasibility: initially identified under governance, includes planning, strategy, management, and resource availability from the perspective of municipal and institutional actors.
-
Economic-financial feasibility: addresses budgetary analysis and the availability of financial resources.
3.2 Second analysis: core aspects within each core subject area
Based on the identified core subject areas, a second analysis is conducted to determine the relevant factors within each thematic area individually, allowing for the definition of the necessary indicators.
3.2.1 Spatial and population incidence
In addition to the general aspects identified under spatial and population impact of the initiatives, two additional factors related to project scalability are also identified. This aspect is mentioned in several studies and is examined in detail, being one of the main objectives, in the report by Manville et al. (2014). A summary of these results is presented in Figure 3.
Figure 3
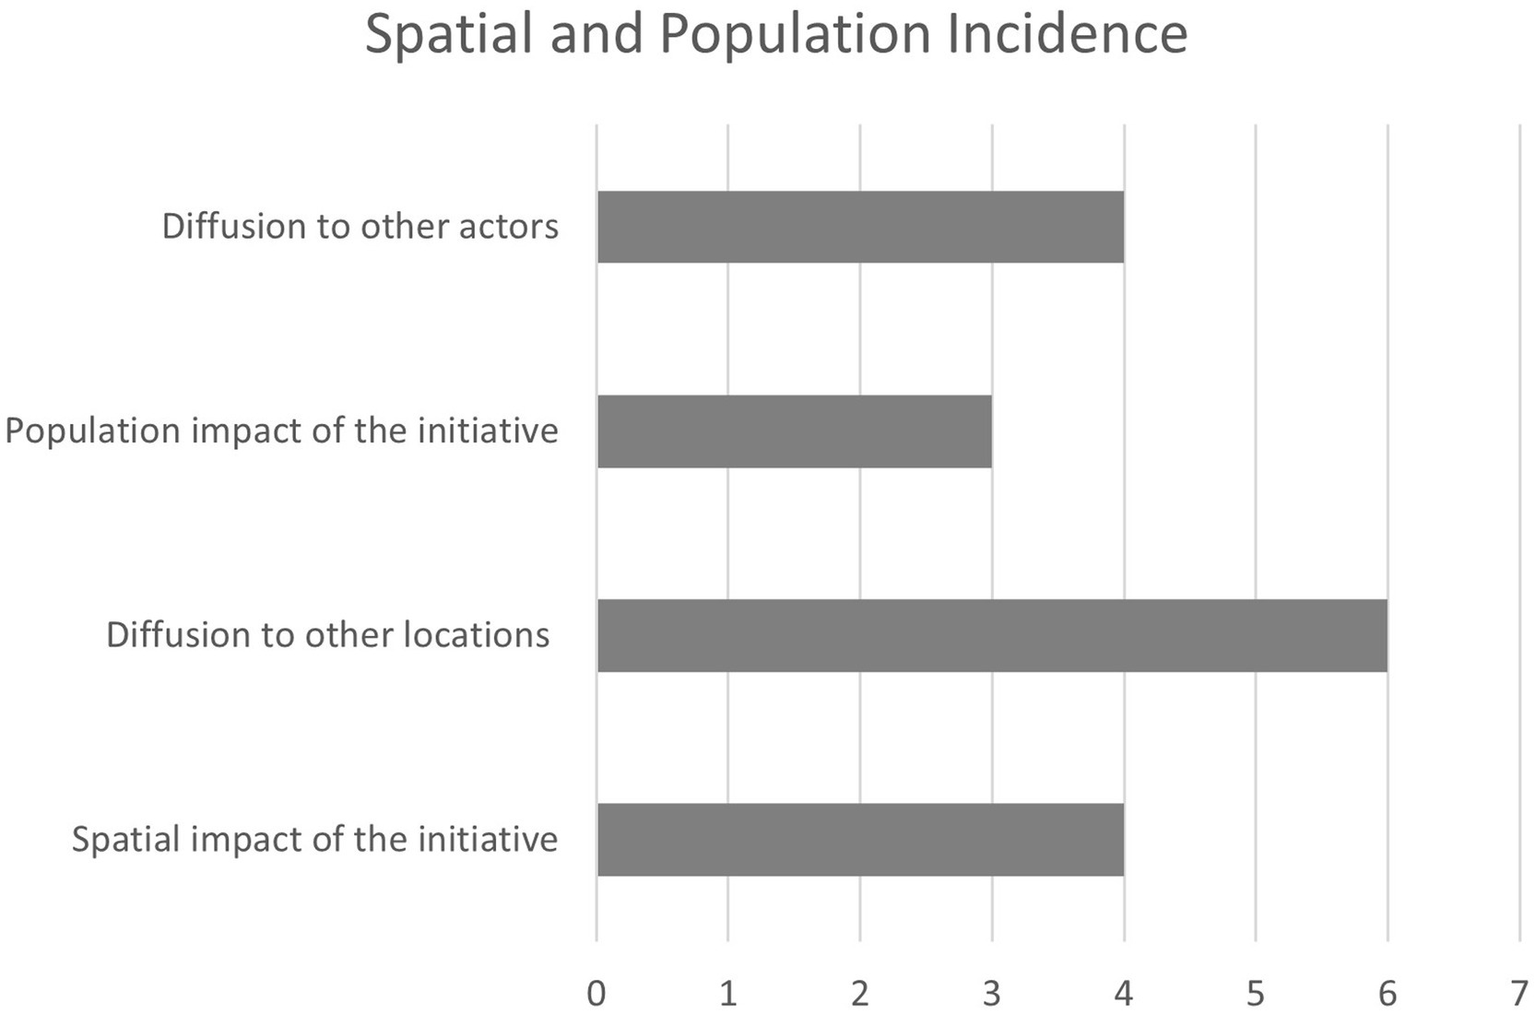
Relevant factors for indicator in spatial and population incidence.
Scalability is addressed in two distinct ways: first, as geographic scalability, the potential to replicate similar projects in different locations based on spatial scale, and second, as stakeholder scalability, referring to the dissemination of similar initiatives across other urban actors, such as within the private sector. In this case, the four identified factors are considered relevant and not subject to simplification.
3.2.2 Perception and social repercussion
The way a project affects and is perceived by citizens is addressed in various ways across the analyzed studies. The most consistently highlighted aspect is the engagement of key urban stakeholders in smart city projects. In fact, this is identified as a fundamental feature of smart cities (Esteban-Narro et al., 2025) and is a core component of many smart city evaluation models (Castelnovo et al., 2015; Fernandez-Anez et al., 2018; Lombardi et al., 2012; Nam and Pardo, 2011). Another commonly mentioned factor is the importance of reflecting local characteristics, the unique identity or idiosyncrasy of the city, within the models (Sharifi, 2019). To simplify the number of factors, these two aspects are merged into a single category called “social compatibility.” Although this means that stakeholder engagement is not explicitly labeled as a separate factor in the framework, it is inherently present in many of the criteria and is also embedded in the core structure of leading performance evaluation models.
Beyond these, it is difficult to find strong consensus on other perception-related factors (Figure 4), though several additional aspects are identified.
Figure 4
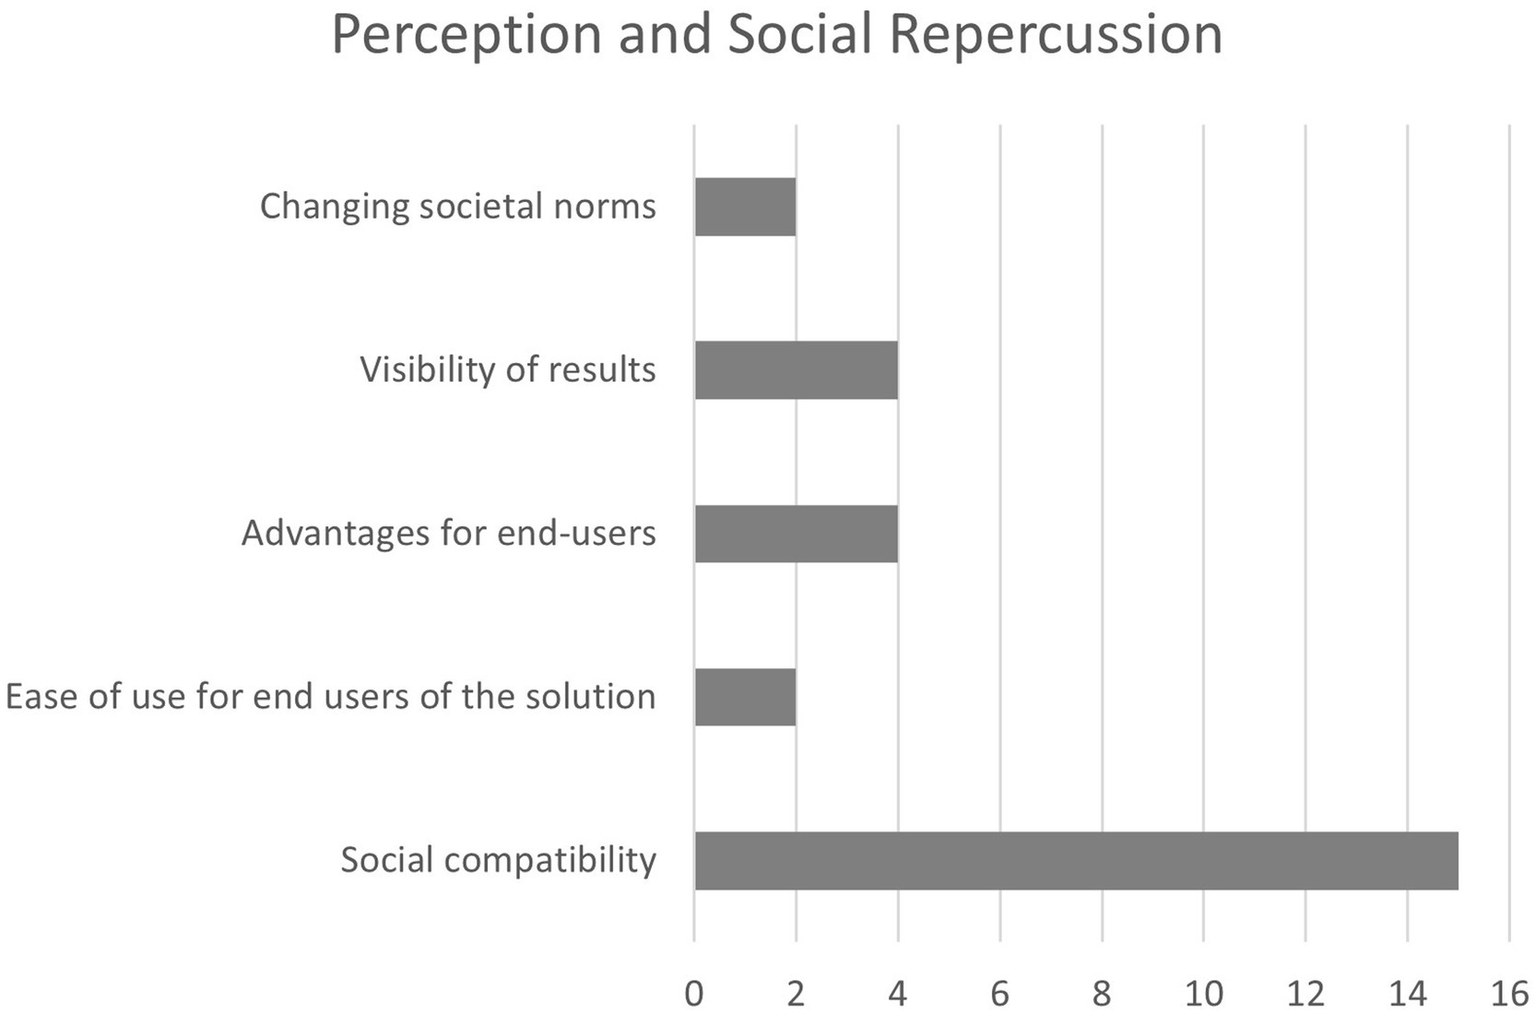
Relevant factors for indicator in perception and social repercussion.
3.2.3 Technical feasibility
The technical management capacity of projects is widely reflected across the literature and identified as a key factor. It is referenced through elements such as leadership or general management resources. To streamline the number of factors, the framework groups these aspects under the unified label “technical resources.”
Another broadly addressed area involves technology-related aspects. Although studies focused exclusively on technology were excluded from the selection (Achmad et al., 2018), and smart city philosophy emphasizes that technology is not an end in itself but a tool to support wider urban, social, and sustainability goals (Berezsky et al., 2025), the city’s readiness for implementing technological solutions and the compatibility with its existing infrastructure are consistently considered.
Additionally, other less frequently mentioned but still relevant factors are identified, including the testability of proposed solutions, the capacity to monitor results, and the project’s role in driving technical change and innovation (Figure 5). Regarding the latter, innovation is intrinsic to the smart city model (Leydesdorff and Deakin, 2010), making it essential for smart city projects to introduce innovative elements. Therefore, the framework incorporates innovation-related factors on main core subject areas as Technical, Social and Institutional.
Figure 5
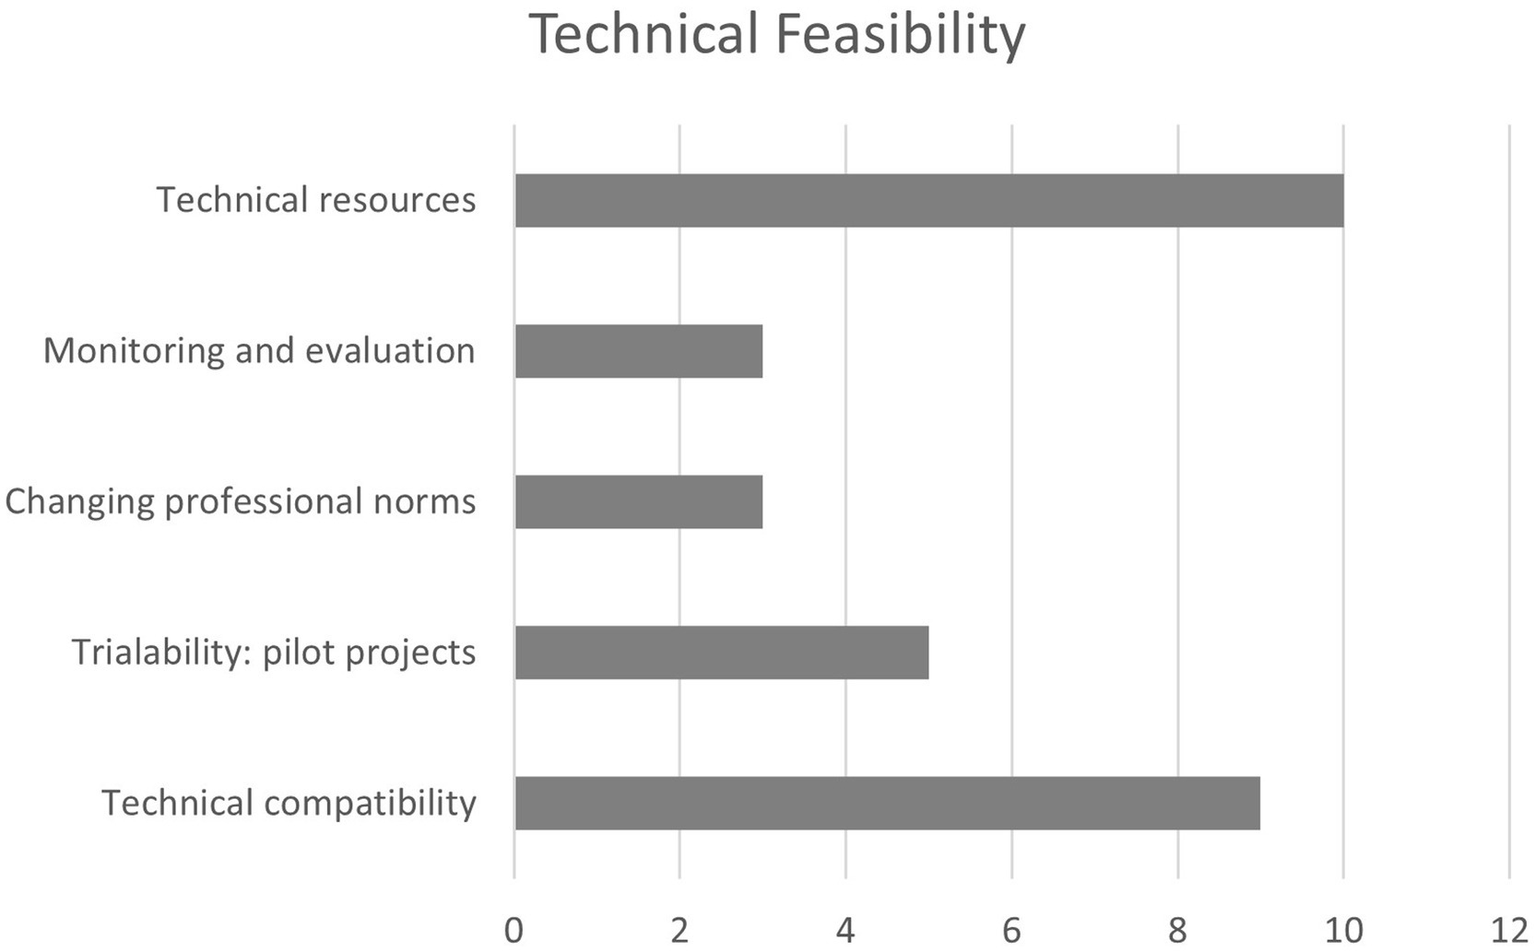
Relevant factors for indicator in technical feasibility.
3.2.4 Institutional feasibility
The role of governance in the development of smart cities has been explored in depth in several specialized studies, emphasizing the importance of overall institutional capacities (Neumann et al., 2019; Panagiotopoulos et al., 2019), specific capacities in areas such as data governance (Franke and Gailhofer, 2021) and the need for institutional change (Meijer and Bolívar, 2016). These factors are widely represented in the studies analyzed as the significance of leadership and the management capacity of municipal institutions. Both are translated into a single factor in the framework, referred to as institutional resources.
Another commonly addressed aspect is the existence of a predefined smart city strategy or plan. Given the project’s analytical focus, the framework distinguishes between two separate factors: one linked to the presence of a strategic plan, and another concerning the project’s coherence and integration within that strategy. Regulatory aspects, such as compatibility with the existing legal framework, potential for improving it, and the need for interdepartmental coordination and participation in smart city projects, are also included under this core subject (Figure 6).
Figure 6
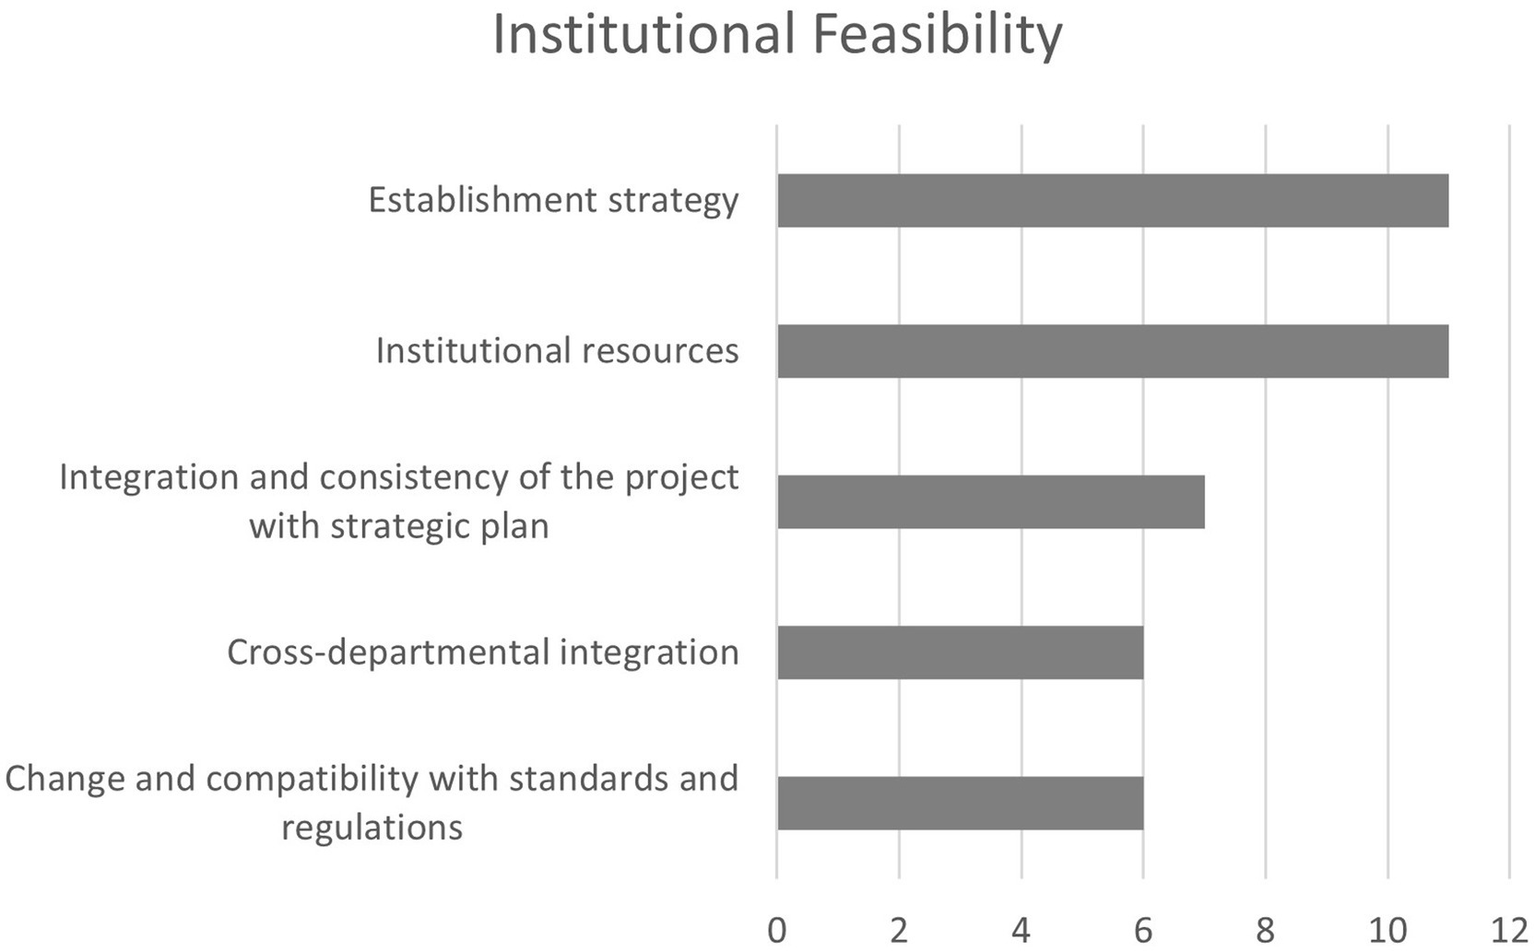
Relevant factors for indicator in institutional feasibility.
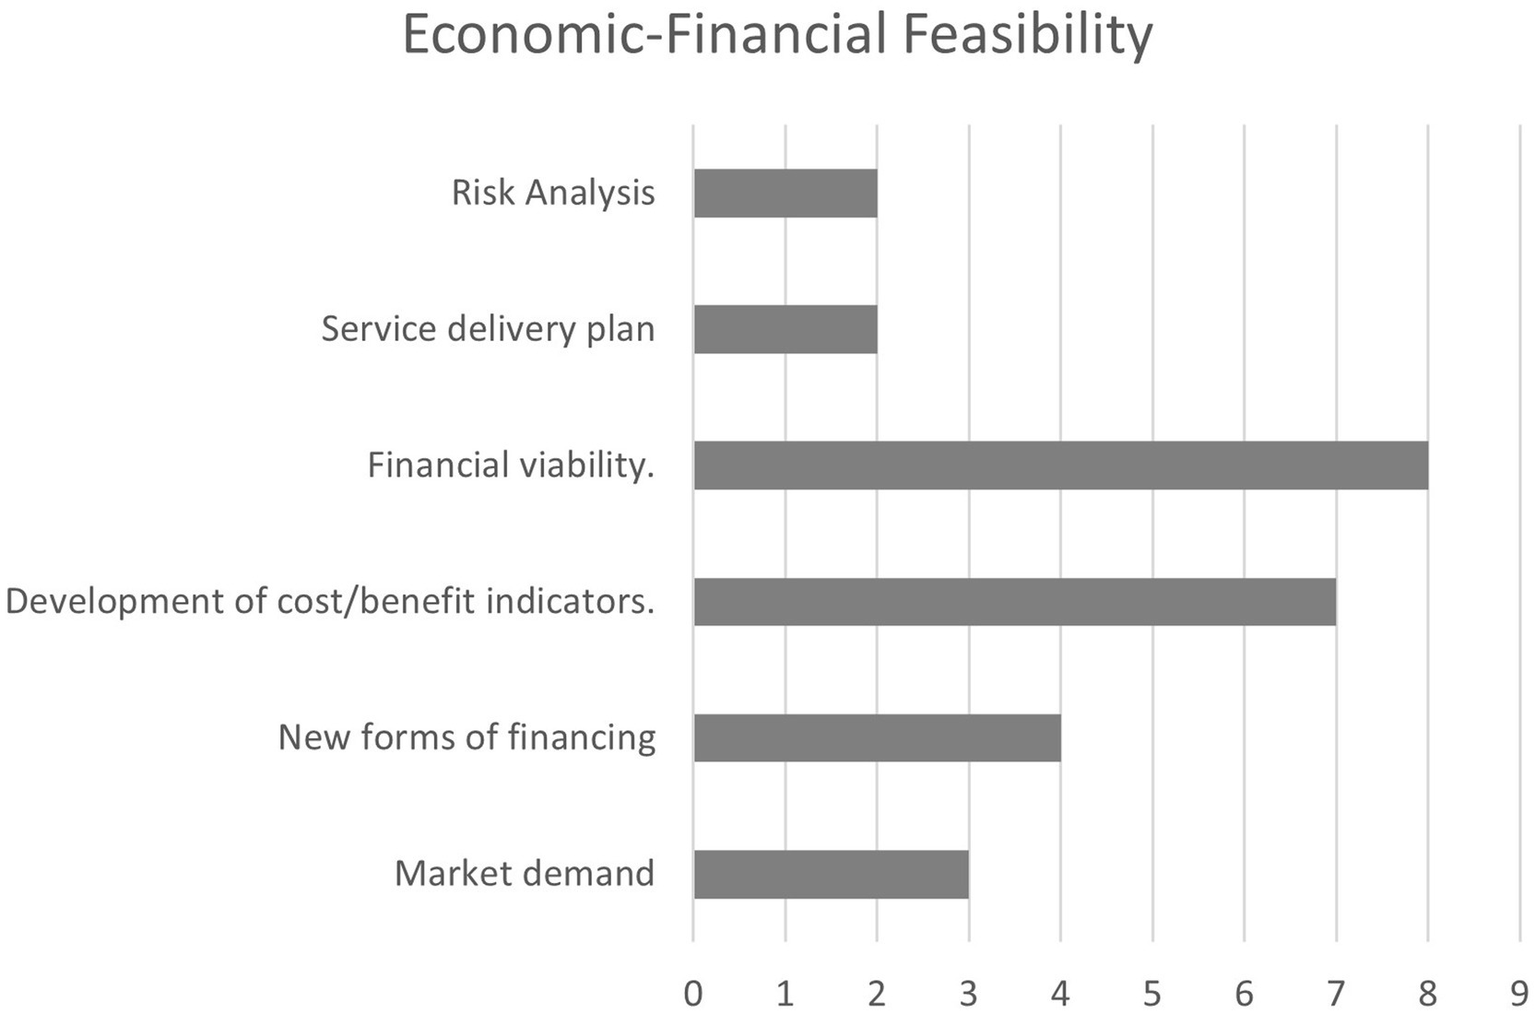
3.2.5 Economic-financial feasibility
Although it is arguably the most evident aspect when assessing the feasibility of a smart city project and is mentioned in the vast majority of readiness studies, it is not treated in detail in many works. Among the selected studies, only three address this thematic area more thoroughly (ASCIMER, 2017b; BSI PAS, 2017; Manville et al., 2014), offering specific aspects and parameters for analysis. These include:
-
Net Present Value (NPV) and Internal Rate of Return (IRR), calculated based on the project’s time horizon, social discount rate (SDR), and initial investment.
-
Cost–Benefit Ratio, considering both monetizable benefits and costs—direct and indirect—as well as broader impacts, including economies of scale and scope.
-
The importance of incorporating non-monetizable or intangible benefits and costs into the analysis.
Aspects related to business models and alternative financing instruments are also addressed in specific studies on this topic (Wolniak et al., 2024) and they are also included in the results of the SLR. These considerations are often linked to demand studies and delivery plans for the services provided by the projects (Figure 7).
Figure 7
Relevant factors for indicator in economic-financial feasibility.
Although the goal of the framework is not to conduct a detailed financial study, it must include a set of basic project data that allows for a general overview of its economic viability. This core subject area must therefore include both a quantitative component, which gathers key economic-financial data from the project, and a qualitative component, which captures information about the preliminary steps taken in the project’s feasibility analysis.
3.3 Development of indicators based on the detected factors
The result of the sequential analysis identifies five core subject areas, which in turn are broken down into a total of 25 relevant factors. In addition to these factors, a series of economic-financial parameters to be considered are identified. The next step is the development of the necessary indicators for each factor and parameter, following the indicator development guidelines established in Section 2.2. The type of indicator varies depending on the nature of the factor, with differences also arising between core subject areas (Table 3).
Table 3
| Core subject area | Indicator | Typology |
|---|---|---|
| Spatial and population incidence | Geographic scope where the project develops its activities and generates impact, according to spatial scale. | Likert (scale 5) |
| Possibility of scalability, replication and dissemination of the project in other geographical areas. | Likert (scale 5) | |
| Classification of the impact generated by the project in terms of the population benefited, differentiating between the direct and indirect scope of its effects. | Data | |
| Possibility of replication, dissemination and influence of the solutions pro-posed by the project to other urban stakeholders and actors. | Likert (scale 5) | |
| Social | Social compatibility: The extent to which the project solution does not negatively challenge the values, norms and customs of the population. | Likert (scale 5) |
| Ease of use for the end user: the degree to which the solution is perceived as difficult for potential end users to understand and use. | Likert (scale 5) | |
| End-user benefits: The extent to which the project offers clear benefits to end-users. | Likert (scale 5) | |
| Visibility of results: The extent to which the project’s results are visible to external stakeholders. | Likert (scale 5) | |
| Influence of the project on changing behavioral patterns and societal norms and values. | Likert (scale 5) | |
| Technical | Technical resources, breakdown in two indicators, one for planning, development and implementation phase of the project and other for operational and maintenance phase. | Likert (scale 5) |
| Continuous monitoring and supervision: The extent to which progress towards project objectives and compliance with requirements is monitored and reported. | Likert (scale 5) | |
| Technical compatibility of solutions: The extent to which the project solution fits with current existing technology standards/infrastructure. | Likert (scale 5) | |
| Technical innovation of the project: impact of the measures the project envisages from an innovation point of view and influence on changes from a technical point of view. | Likert (scale 5) | |
| Ability to test from a technical point of view (pilot projects): The degree to which the solution can be experimented with on a limited basis in the local context before full implementation. | Likert (scale 5) | |
| Institutional | Institutional resources, breakdown in two indicators one for planning, development and implementation phase of the project and other for operational and maintenance phase. | Likert (scale 5) |
| Interdepartmental coordination: The extent to which different departments of the local administration contribute to the management of the initiatives and projects. | Likert (scale 5) | |
| Implementation in the administration of the smart city strategy: Extent to which the smart city strategy has been assigned to a department/manager and staff resources have been allocated. | Likert (scale 5) | |
| Integration and consistency of the project with strategic plans and municipal master plans, and with regional and national level objectives. | Likert (scale 5) | |
| Compatibility of the initiative with standards, protocols and regulations. | Likert (scale 5) | |
| Economic- financial | Primary and secondary objectives of the project. | Data |
| Total monetizable project cost and benefits: Direct costs, Indirect costs, Overhead cost, Individual project benefit, Economies of scale and scope, Positive externalities, Negative externalities. | Data | |
| Time horizon and social discount rate. | Data | |
| Intangible Benefits and Intangible Costs. | Data | |
| Calculation of NPV, IRR and B/C. | Data | |
| Initial investment | Data | |
| Existence of a general demand for the services provided by the project. | Likert (scale 5) | |
| Existence of a detailed financial feasibility study with committed and consolidated resources and instruments. | Binary Yes/No. | |
| Development of a collection of indicators to enable cost/benefit monitoring. | Binary Yes/No. | |
| Development of a delivery plan of the services the project provides. | Binary Yes/No. | |
| Development of a risk analysis of the initiative including its identification, monitoring and management. | Binary Yes/No. | |
| Financing instruments: The extent to which the project plans to use alternative forms of financing. | Likert (scale 5) |
Summary of indicators developed by core subject area typology.
The final framework consists of a total of 38 indicators and parameters. All indicators directly correspond to the identified factors, except in the case of technical and institutional resources, which are split into two separate indicators to distinguish between resources available during the implementation phase and those available for operation and maintenance. This distinction is essential, as both phases are critical for assessing a project’s overall feasibility.
Indicators requiring quantitative data or binary responses only need a definition. Likert-scale indicators, on the other hand, provide five response options reflecting the degree of fulfilment, ranging from complete absence to an ideal level of availability (see example of operational-phase technical resource availability indicator in Table 4).
Table 4
| Technical resources in the operational phase and maintenance and upkeep during the operation and useful life of the project. | |
|---|---|
| 1. The necessary technical resources are not available for the operation, maintenance or exploitation phase of the project. | 0.00 |
| 2. Technical resources are only partially available, either in terms of resources, technology or human resources, or resources are available but without training and experience in operational and maintenance of this type of project. | 1.25 |
| 3. The necessary technical resources are fully available, although a needs study has not been carried out and there is a lack of previous experience in the operation and maintenance of similar projects or technology. | 2.50 |
| 4. A basic study of the necessary technical resources, means, technology and human resources has been carried out, and their incorporation or specific training is available or planned in a timely manner. | 3.75 |
| 5. A complete and detailed operational model has been previously made, including means, technology, data and human resources, and their incorporation is available or foreseen in due time and form. | 5.00 |
Relevant factors for indicators in economic-financial feasibility.
The detailed final formulation of each indicator, including the response options for Likert-type indicators, is provided in Appendix A.
3.4 Assignment of weighting coefficients through AHP
With the final structure of the indicator set, we can distinguish within the framework between a descriptive section, which provides general information about the project and corresponds to the core subject areas of spatial and population impact and economic-financial feasibility, and an evaluative section, which assesses project characteristics and corresponds to the areas of social perception and repercussion, technical feasibility, and institutional feasibility. The evaluation of these areas is based on 5-point Likert scale indicators, which allows for the calculation of a composite feasibility score on a 1–5 scale, weighted according to the relative importance of the indicators.
Following the methodology described in Section 2.3, the consultation was carried out with a panel of nine experts, three for each of the evaluative core subject areas. The panel was composed in equal parts of current municipal government representatives, municipal technical staff, and managers who had recently held responsibilities in local governance or maintained a direct professional relationship with it. The composition varied slightly depending on the domain: the social area placed more weight on political and managerial profiles, while the institutional and technical areas involved a stronger presence of experts with a technical background.
The results of these consultations were used to construct the criteria comparison matrix A, as defined in Equation 1, and are presented in Table 5:
Table 5
| Criteria | Social compatibility | Ease of use for end users of the solution | Advantages for end-users | Visibility of results | Influence on changing societal norms |
|---|---|---|---|---|---|
| Social compatibility | 1 | 3 | 0.289 | 1.667 | 4.333 |
| Ease of use for end users of the solution | 0.333 | 1 | 0.244 | 1.667 | 4.333 |
| Advantages for end-users | 3.462 | 4.091 | 1 | 4.333 | 5 |
| Visibility of results | 0.6 | 0.6 | 0.231 | 1 | 3.667 |
| Influence on changing societal norms | 0.231 | 0.231 | 0.2 | 0.273 | 1 |
Criteria comparison matrix for perception and social repercussion.
Consistency is verified using Equations 2, 3, with the resulting values presented in Table 6:
Table 6
| Metric | Value |
|---|---|
| λmax | 5.333 |
| CI | 0.083 |
| RI | 1.12 |
| CR | 7.43% < 10% |
Consistency check of the criteria comparison matrix for perception and social repercussion.
By applying Equation 4, the values of the preference criterion vector are obtained presented in Table 7.
Table 7
| Criteria | Preference criterion vector (weight coefficient %) |
|---|---|
| Social compatibility | 22.0 |
| Ease of use for end users of the solution | 13.7 |
| Advantages for end-users | 47.8 |
| Visibility of results | 11.6 |
| Influence on changing societal norms | 4.9 |
Preference criterion vector for perception and social repercussion.
In this case, the weight assigned to benefits for the end user was estimated by the expert panel to represent nearly 50% of the total value for the corresponding core subject area, while the influence on changes in social norms was weighted at less than 5%. The final weighting coefficients for the other two core subject areas are included in Appendix B.
However, these weighting coefficients should be calculated individually for each city, depending on its stage within the smart transformation process. This reflects the importance of managing context and adapting to temporal changes (Sharifi, 2019). To ensure relevance and accuracy, the weighting should be based on consultations with expert panels that have sufficient knowledge of the local situation and idiosyncrasies in the specific city where the framework is applied.
3.5 Project feasibility assessment framework: application in the case study
As mentioned in section 2.4, to further verify the completeness of the developed framework, two open-ended questions were included in the expert panel consultations. The results show that the vast majority (89%) consider the framework to be complete. The only additional elements suggested were two aspects, both of which have been incorporated into the economic-financial area: the project’s life horizon and the initial investment as a separate data point, as they were included in the NPV calculation.
To test the framework, it was applied to a selection of seven projects as a case study. These projects were implemented in the city of Alcoy, a municipality of 60,000 inhabitants located in southeastern Spain, which is classified as a small city under EU criteria (Dijkstra and Poelman, 2012). This city presents a set of characteristics that make it particularly suitable as a case study: it is located about 1 h away from two major metropolitan areas while maintaining a strong local identity and deep ties to its traditions; it combines a significant industrial sector with the presence of two protected natural parks within its municipal boundaries; and it hosts a university campus as well as an ongoing smart and sustainable city development plan.
The objective was to apply the framework to projects with known real-world observed success outcomes after implementation, enabling a comparison between the framework’s feasibility assessments and actual results. Although the number of projects included in the case study is limited, they were selected to represent a diverse range of typologies and outcomes, from very high to very low, distributed in several grades, which are assigned a value on a scale of 5. This strategic selection allows for a meaningful preliminary validation of the framework’s capacity to predict project feasibility. As such, this stage should be considered an exploratory application, paving the way for future empirical studies with larger samples and comparative city analyses. The results of applying the framework to these projects are presented in Table 8.
Table 8
| Assessment area | Project A | Project B | Project C | Project D | Project E | Project F | Project G |
|---|---|---|---|---|---|---|---|
| Social | 4.34 | 2.91 | 1.52 | 1.18 | 4.94 | 2.29 | 3.69 |
| Technical | 2.53 | 2.59 | 2.03 | 1.92 | 3.12 | 1.48 | 3.61 |
| Institutional | 3.22 | 3.35 | 2.78 | 2.26 | 3.45 | 2.13 | 3.13 |
| Existence of a general demand. | Some | Some | Some | Low | High | Some | High |
| Existence of a financial feasibility study. | Y | Y | Y | Y | Y | Y | Y |
| Cost/benefit tracking. | Y | Y | N | N | Y | N | Y |
| Delivery plan. | N | Y | N | N | Y | N | N |
| Risk analysis. | N | N | N | N | N | N | N |
| Observed outcome success | High | Medium-High | Medium-Low | Low | High | Medium-Low | Medium-High |
| 3.93 | 3.2 | 1.8 | 1.1 | 3.9 | 1.8 | 3.2 |
Summary of assessment scores for the seven case study projects.
The individual project analysis confirms that those with social feasibility issues also receive low scores in this core subject area within the framework (projects C and D). The same occurs with projects presenting technical and institutional shortcomings (project F).
Moreover, a statistical analysis is performed based on the correlation of the results of the framework application and the actual observed values. The feasibility scores (social, technical, and institutional) are derived from weighted averages of Likert-type indicators, which are inherently ordinal. Meanwhile, the observed outcome values represent performance estimates that are better interpreted as bounded ranges. For this reason, Spearman’s rank-order correlation coefficient was selected, as also employed in other smart city studies (Neirotti et al., 2014; Stanković et al., 2017). The correlation of the observed success is studied in the three core subject evaluative areas, their mean, maximum and minimum values (Table 9).
Table 9
| Metric | Social | Tech | Institutional | Mean | Max | Min |
|---|---|---|---|---|---|---|
| Spearman Coefficient | 0.973 | 0.698 | 0.844 | 0.899 | 0.973 | 0.753 |
| p-value | 0.0002 | 0.082 | 0.017 | 0.006 | 0.0002 | 0.050 |
Values obtained in the correlation analysis.
In the core subject areas, the results show a very strong correlation with the social dimension, a similarly significant correlation with the institutional dimension, and a weaker one with the technical dimension. This highlights the relevance of social feasibility as the most critical factor in the success of smart city projects. This aspect is widely highlighted in the scientific literature as very relevant in the performance of the smart city, either directly (Caragliu et al., 2011; Golubchikov and Thornbush, 2022; Kaluarachchi, 2022), on specific projects (Hansen and Dahiya, 2025), or through the engagement of the main urban stakeholders (Fernández-Güell et al., 2016; Marrone and Hammerle, 2018). Therefore, it is also fundamentally confirmed at the previous stage that the feasibility study means. In addition, the data collection processes required to achieve this engagement and to account for the social acceptance of the solutions are greatly facilitated by smart city technologies such as big data, the Internet of Things, and artificial intelligence (Panagiotopoulou et al., 2020).
The weaker correlation observed for the technical dimension suggests that, while technical readiness is a necessary condition, it is not sufficient on its own to guarantee the success of smart city projects. This finding indicates that the availability of technological solutions and infrastructure, although important, does not automatically translate into effective implementation or sustainable outcomes. Instead, the results highlight the decisive role of institutional support and social acceptance, which appear to exert a greater influence in shaping the feasibility and eventual success of projects. This reinforces the argument that technical feasibility should be understood as an enabling factor (Mattoni et al., 2015) that must operate in conjunction with governance capacity and citizen engagement (Fernandez-Anez et al., 2018), rather than as a standalone predictor of success.
The average and maximum values across the three areas also exhibit high correlation levels, while the minimum values show slightly lower correlations, though still close to the threshold of statistical significance (p < 0.05). Therefore, in addition to social aspects, average and extreme values, particularly high scores in at least one area, play a decisive role in project success. Within this sample, the framework thus demonstrates its initial effectiveness as a tool for anticipating potential feasibility challenges that smart city projects may face. Furthermore, the framework’s objective is to provide a comprehensive view of project feasibility, covering both descriptive and evaluative aspects. The core subject areas related to territorial impact and economic-financial viability serve as a “go–no go” threshold in the feasibility assessment process. Tables 10, 11 present the final framework in both its descriptive and evaluative components, using the application data from one of the selected projects (Project A from Table 9).
Table 10
| Core subject area | Indicator | Ind. value | Weight % | Value | Index |
|---|---|---|---|---|---|
| Social | Social compatibility. | 5.00 | 22.0 | 1.1 | 4.34 (86.6%) |
| Ease of use for the end user. | 5.00 | 13.7 | 0.7 | ||
| End-user benefits. | 3.75 | 47.8 | 1.8 | ||
| Visibility of results. | 5.00 | 11.6 | 0.6 | ||
| Influence on changing societal norms. | 3.75 | 4.9 | 0.2 | ||
| Technical | Technical resources: planning and implementation. | 2.50 | 18.6 | 0.5 | 2.53 (50.6%) |
| Technical resources: operational and maintenance phase. | 2.50 | 33.4 | 0.8 | ||
| Ability to test from a technical point of view (pilot projects): | 1.25 | 11.7 | 0.1 | ||
| Continuous monitoring and supervision. | 2.50 | 23.4 | 0.6 | ||
| Technical compatibility of solutions. | 5.00 | 7.1 | 0.4 | ||
| Technical innovation of the project. | 2.50 | 5.8 | 0.1 | ||
| Institutional | Institutional resources: planning and implementation phase | 2.50 | 16.0 | 0.4 | 3.22 (64.4%) |
| Institutional resources: operational phase. | 2.50 | 8.1 | 0.2 | ||
| Interdepartmental coordination. | 3.75 | 28.3 | 1.1 | ||
| Implementation in the administration of the smart city strategy. | 2.50 | 18.4 | 0.5 | ||
| Integration and consistency with strategic plans. | 3.75 | 22.4 | 0.8 | ||
| Compatibility with regulations | 3.75 | 6.8 | 0.3 |
Framework: perception and social repercussion, technical and institutional feasibility.
Table 11
| Core subject area | Subarea | Indicator and Data/Description | |
|---|---|---|---|
| Incidence | Spatial | Spatial scope | Total Urban Scope: The project impacts the entire urban core or city as a whole. |
| Scalability | The project is part of a supra-municipal plan for implementation and scalability in other cities. | ||
| Population | Direct | 4,500 inhab. | |
| Indirect | 55,500 inhab. | ||
| TOTAL | 60,000 inhab. | ||
| The technologies, principles and solutions adopted in the project are likely to be adopted and influence other urban stakeholders in a timely and isolated manner. | |||
| Economic-financial | Main and secondary objectives | Recovery of green spaces. | |
| Connect green areas with natural parks and between them. | |||
| Densify intra-urban green areas. | |||
| Promote environmental education among citizens. | |||
| Data | Time horizon of the project life (years): | 25 | |
| Initial investment (k€): | 3,695.0 | ||
| Total monetizable project cost (k€): | 8,950.0 | ||
| Total monetizable project benefits (k€): | 8,140.0 | ||
| NPV (k€): | -1,486.2 | ||
| IRR: | −2.14% | ||
| B/C: | 0.91 | ||
| Social discount rate | 3.00% | ||
| Intangible benefits and costs | Improvement of the environment. | ||
| Improvement of the quality of life of the inhabitants. | |||
| Improving the overall attractiveness of the city. | |||
| Increasing the city’s resilience to climate change. | |||
| Additional questions | Existence of a general demand for the services provided by the project. | Some demand: There is demand for the solution offered. | |
| Existence of a financial feasibility study. | YES | ||
| A collection of indicators has been developed to enable cost/benefit tracking. | YES | ||
| A delivery plan has been developed for the delivery of the services provided by the project. | NO | ||
| A risk analysis of the initiative has been developed. | NO | ||
| Financing instruments: The extent to which the project plans to use alternative forms of financing. | The project is innovative in using a new form of financing, with a high impact on this and future initiatives. | ||
Framework: spatial and population incidence and economic-financial feasibility.
Finally, some additional considerations are important for understanding the scope and applicability of the proposed framework. It relies primarily on data provided by local administrations, a limitation difficult to avoid in this type of evaluation. Whenever possible, these data should be cross-checked with complementary sources, and the assessment conceived as an exercise aimed at minimizing biases. The configuration of the expert panel follows the same principle, diversifying perspectives to reinforce objectivity. Additionally, although the initial pre-validation was carried out in a single city, the framework is designed for application in other urban and geographical contexts. Its fundamental components and theoretical basis are general in nature, which facilitates replicability and adaptation to diverse institutional, socio-economic, and territorial settings. This orientation, grounded in social acceptance, governance, and institutional capacities, also aligns with international frameworks such as the United Nations Sustainable Development Goal 11 and with European policies like the European Green Deal and the Digital Compass 2030, reinforcing its relevance in promoting viable, sustainable, and inclusive urban projects.
The full data from the application of the framework to the seven case study projects are provided in Appendix B.
4 Conclusion
The implementation of transformation processes aligned with the smart city paradigm relies on assessment models as tools for measuring performance and maturity (Hajek et al., 2022). However, pre-implementation feasibility studies, which are essential for the success of such strategies (Febiyanti and Susanto, 2024), remain notably scarce in the scientific literature.
This study presents a framework for the feasibility analysis of smart city projects, as they are the primary instruments through which smart city strategies are operationalized (BSI PAS, 2017). The framework incorporates the key feasibility assessment aspects identified in the scientific literature, structured into five thematic areas or core subjects, and broken down into a set of 38 indicators and parameters that gather essential and relevant information for evaluating project feasibility.
The first section of the framework is descriptive, encompassing general project data related to its spatial and population impact and its economic-financial aspects. In this phase, urban planners collect information to gain an in-depth understanding of the project. The spatial component addresses the direct and indirect impact on the population, geographic footprint, and potential scalability across other areas or urban actors. From the economic-financial perspective, both quantitative and qualitative data are gathered, including primary and secondary objectives, monetizable and intangible costs and benefits, financial parameters such as NPV and IRR, and evidence of financial analysis conducted. This section facilitates a comprehensive understanding of the project and enables feasibility to be assessed against the city’s actual capacities.
The second section of the framework is evaluative, producing feasibility indices in three dimensions: social, technical, and institutional. For each of these core subject areas, the urban planner rates the project using a group of indicators that yield an overall index for each dimension. The framework also accounts for the local context and idiosyncrasies of the city in which it is applied, as the indicator weights used to calculate these indices are derived from expert panels familiar with the specific city.
At a theoretical level, this two-part structure contributes a comprehensive feasibility framework that fills a gap in the literature, which has traditionally been more focused on performance or maturity assessment than on feasibility analysis. At the practical level, the tool provides municipal decision-makers with a replicable and accessible instrument, particularly suited to small and medium-sized cities, capable of anticipating risks and guiding choices in the early stages of projects, In this sense, it serves multiple functions for urban planners:
-
It offers structured guidelines for conducting feasibility analyses of smart city projects, prompting comprehensive evaluation.
-
It enables critical reflection and the identification of areas where a city must improve to undertake smart city initiatives.
-
It provides quantitative feasibility scores, allowing comparison between investment alternatives.
-
It is applicable in pre-implementation phases, and its results can be reviewed and refined after the project is operational, enabling feedback-based improvement of the tool in future applications.
The proposed framework aligns with global urban agendas such as the UN Sustainable Development Goals, particularly SDG 11, by supporting informed and efficient decision-making in urban transformation processes. Its integration into municipal planning tools can help assess policy feasibility, optimize the allocation of limited resources, and ensure that smart city projects are context sensitive. Furthermore, by facilitating early identification of potential environmental and social impacts, the framework contributes to minimizing unintended negative consequences and promoting more resilient and sustainable urban development. The general philosophy of the framework is to support smart city planning in smaller cities, which often face limited resources and elevated opportunity costs when making investment decisions. Accordingly, the indicator set was designed to strike a balance between analytical robustness and practical simplicity, ensuring accessibility for technical staff and decision-makers alike. Beyond its technical contribution, the framework also carries ethical implications, as it promotes participatory and transparent urban governance. By assigning significant weight to the social and institutional dimensions, it fosters inclusive and accountable decision-making, helping to prevent smart city projects from becoming merely technological exercises without social legitimacy.
The framework underwent an initial test in a city with these characteristics, using seven implemented projects with known outcomes. This application provided valuable preliminary evidence of its usefulness for anticipating both the strengths and weaknesses of proposed initiatives. Notably, the results revealed that social feasibility, as measured through citizens’ perceptions, engagement, and alignment with local needs, was the most strongly correlated factor with actual project success. This underscores the importance of embedding social considerations at the core of smart city project planning. Additionally, both high average and peak scores across the core dimensions were associated with more favorable outcomes, confirming the importance of multidimensional consistency in project feasibility. Several practical recommendations can be drawn: projects with low levels of social acceptance should be restructured or postponed until broader consensus is achieved; institutional feasibility must be ensured from the outset through the commitment of municipal departments; and while the technical dimension is necessary, it does not guarantee success on its own and must always be supported by strong social and institutional backing. Moreover, feasibility assessments should include, already in the planning stage, structured engagement exercises with key stakeholders, as this early dialogue can significantly increase legitimacy and reduce implementation risks. Special attention must also be paid to projects that, although technically viable, may exacerbate social challenges such as the digital divide, which can undermine inclusiveness. In addition, initiatives that combine multiple facets of urban life should integrate a strong social component and, where appropriate, be accompanied by awareness and information campaigns to foster citizen understanding and support. These findings highlight the framework’s potential as a practical and context-sensitive decision-support tool, especially for small and medium-sized cities where smart city investments must be both strategic and socially grounded.
One of the main limitations of this research lies in the lack of a more complete and extensive empirical validation. The work includes a preliminary validation with a sample of seven projects of different characteristics. The application of the framework to multiple real-world projects in different cities, followed by critical analysis and monitoring of results, would allow for the refinement of the framework based on empirical deficiencies observed during planning, implementation, and operation, and could even lead to the development of predictive tools based on large-scale data from comparable urban experiences. This gap also presents an important opportunity for future research.
Another limitation identified lies in the lack of scientific studies specifically addressing feasibility analysis for smart city projects. The framework is thus built by aggregating insights and factors from various related studies. While the sequential analysis, from general structure to detailed indicators, envelops the relevant literature, a broader body of empirical studies would have improved its definition and clarity.
Finally, the possible subjectivity inherent in the use of Likert-scale indicators, which requires a rigorous and consistent application to minimize bias, represents another limitation. Nonetheless, a more in-depth and complex version of the framework could be developed, sacrificing part of its simplicity for application in larger cities or those with greater resources. This represents another potential direction for future research.
Statements
Data availability statement
The original contributions presented in the study are included in the article/Supplementary material, further inquiries can be directed to the corresponding author.
Author contributions
RE-N: Data curation, Formal analysis, Investigation, Writing – original draft. VL-I-F: Methodology, Resources, Supervision, Writing – review & editing. JT-L: Conceptualization, Validation, Writing – review & editing.
Funding
The author(s) declare that financial support was received for the research and/or publication of this article. Funding for open access charge: Universitat Politècnica de València.
Acknowledgments
The authors want to acknowledge the Alcoy city Council’s support and interest in this research.
Conflict of interest
The authors declare that the research was conducted in the absence of any commercial or financial relationships that could be construed as a potential conflict of interest.
Generative AI statement
The authors declare that no Gen AI was used in the creation of this manuscript.
Any alternative text (alt text) provided alongside figures in this article has been generated by Frontiers with the support of artificial intelligence and reasonable efforts have been made to ensure accuracy, including review by the authors wherever possible. If you identify any issues, please contact us.
Publisher’s note
All claims expressed in this article are solely those of the authors and do not necessarily represent those of their affiliated organizations, or those of the publisher, the editors and the reviewers. Any product that may be evaluated in this article, or claim that may be made by its manufacturer, is not guaranteed or endorsed by the publisher.
Supplementary material
The Supplementary material for this article can be found online at: https://www.frontiersin.org/articles/10.3389/frsc.2025.1675890/full#supplementary-material
Appendix ASupplementary data, collection of developed feasibility indicators.
Appendix BSupplementary data, results of the application of the framework to the case study.
References
1
Achmad K. A. Nugroho L. E. Djunaedi A. Widyawan W. (2018). Smart City readiness based on Smart City council’s readiness framework. IJECE8:271. doi: 10.11591/ijece.v8i1.pp271-279
2
Aljowder T. Ali M. Kurnia S. (2023). Development of a maturity model for assessing smart cities: a focus area maturity model. Smart Cities6, 2150–2175. doi: 10.3390/smartcities6040099
3
Angelidou M. (2015). Smart cities: a conjuncture of four forces. Cities47, 95–106. doi: 10.1016/j.cities.2015.05.004
4
Aragão F. V. Chiroli D. M. d. G. Zola F. C. Aragão E. V. Marinho L. H. N. Correa A. L. C. et al . (2023). Smart cities maturity model—a multicriteria approach. Sustainability15:6695. doi: 10.3390/su15086695
5
Arief A. Abbas M. Wahab I. Latif L. Abdullah S. Sensuse D. (2020). The smart islands vision: towards smart city readiness in local government of archipelagos. J. Phys. Conf. Ser.1569:42006. doi: 10.1088/1742-6596/1569/4/042006
6
ASCIMER (2017a). Governance and implementation of Smart City projects in the Mediterranean Region. Deliverable 3. Available online at: https://institute.eib.org/wp-content/uploads/2017/02/2017_0131-ASCIMER-DELIVERABLE-3-GOVERNANCE-ANDIMPLEMENTATION-OF-SMART-CITY-PROJECTS-IN-THE-MEDITERRANEAN-REGION.pdf (accessed March 26, 2025).
7
ASCIMER (2017b). Smart City projects assessment guidebook Deliverable 2. Available online at: https://institute.eib.org/wp-content/uploads/2017/02/2017_0131-ASCIMER-DELIVERABLE-2-ASSESSMENT-METHODOLOGY-FOR-SMART-CITY-PROJECTS.pdf (accessed March 26, 2025).
8
Barrutia J. M. Echebarria C. Aguado-Moralejo I. Apaolaza-Ibáñez V. Hartmann P. (2022). Leading smart city projects: government dynamic capabilities and public value creation. Technol. Forecast. Soc. Change179:121679. doi: 10.1016/j.techfore.2022.121679
9
Berezsky O. Kovalchuk O. Berezka K. Ivanytskyy R. (2025). Assessing smart cities’ effectiveness: machine learning approaches. Frontiers in Sustainable Cities7:1400917. doi: 10.3389/frsc.2025.1400917
10
Bosch P. Jongeneel S. Rovers V. Neumann H.-M. Airaksinen M. Huovila A. (2017). CITYkeys indicators for smart city projects and smart cities. CITYkeys Report10:2027. doi: 10.13140/RG.2.2.17148.23686
11
BSI PAS (2017). Smart cities - developing project proposals for delivering smart city solutions - guide. London: BSI Standards.
12
Caragliu A. Bo C. Nijkamp P. (2011). Smart cities in Europe. J. Urban Technol.18, 65–82. doi: 10.1080/10630732.2011.601117
13
Carli R. Dotoli M. Pellegrino R. Ranieri L. (2013). “Measuring and managing the smartness of cities: A framework for classifying performance indicators,” in Proceedings - 2013 IEEE International Conference on Systems, Man, and Cybernetics, SMC 2013, 1288–1293.
14
Cassandras C. G. (2016). Smart cities as cyber-physical social systems. Engineering2, 156–158. doi: 10.1016/J.ENG.2016.02.012
15
Castelnovo W. Misuraca G. Savoldelli A. (2015). Smart cities governance: the need for a holistic approach to assessing urban participatory policy making. Soc. Sci. Comput. Rev.34, 724–739. doi: 10.1177/0894439315611103
16
Cohen B. (2014). The smart cities in theWorld: methodology 2014. Available online at: https://www.fastcompany.com/3038818/thesmartestcities- in-the-world-2015-methodology (accessed March 15, 2023).
17
Dall’O G. Bruni E. Panza A. Sarto L. Khayatian F. (2017). Evaluation of cities’ smartness by means of indicators for small and medium cities and communities: a methodology for northern Italy. Sustain. Cities Soc.34, 193–202. doi: 10.1016/j.scs.2017.06.021
18
De Genaro Chiroli D. M. Solek E. A. B. Oliveira R. S. Barboza B. M. L. De Campos R. P. Kovaleski J. L. et al . (2022). Using multi-criteria analysis for smart city assessment. Cidades22, 154–179. doi: 10.15847/cct.25677
19
Dijkstra L. Poelman H. (2012). Cities in Europe: The new OECD-EC definition. Paris: OECD.
20
Esteban-Narro R. Lo-Iacono-Ferreira V. G. Torregrosa-López J. I. (2025). Urban stakeholders for sustainable and smart cities: an innovative identification and management methodology. Smart Cities8:41. doi: 10.3390/smartcities8020041
21
Febiyanti W. Susanto T. D. (2024). “Identification of Smart City readiness indicators: A literature review,” in 2024 International Conference on Computer Engineering, Network, and Intelligent Multimedia (CENIM). IEEE, pp. 1–6.
22
Fernandez-Anez V. Fernández-Güell J. M. Giffinger R. (2018). Smart city implementation and discourses: an integrated conceptual model. The case of Vienna. Cities78, 4–16. doi: 10.1016/j.cities.2017.12.004
23
Fernandez-Anez V. Guillermo V. Fiamma P.-P. Monzón A. (2020). Smart city projects assessment matrix: connecting challenges and actions in the Mediterranean Region. J. Urban Technol.27, 79–103. doi: 10.1080/10630732.2018.1498706
24
Fernández-Güell J.-M. Collado-Lara M. Guzmán-Araña S. Fernández-Añez V. (2016). Incorporating a systemic and foresight approach into Smart City initiatives: the case of Spanish cities. J. Urban Technol.23, 43–67. doi: 10.1080/10630732.2016.1164441
25
Franke J. Gailhofer P. (2021). Data governance and regulation for sustainable smart cities. Front. Sust. Cities3:763788. doi: 10.3389/frsc.2021.763788
26
Gere L. (2018). An introduction and critical assessment of smart city developments. DETUROPE Central Eur. J. Tour. Reg. Dev.10, 33–52. doi: 10.32725/det.2018.022
27
Geropanta V. (2020). “The Smart City in relation to its environment, perception, and urban planning process: lessons for developing countries” in Perception, design and ecology of the built environment: A focus on the global south. ed. GhoshM. (Cham: Springer International Publishing), 547–561.
28
Giffinger R. Fertner C. Kramar H. Meijers E. (2007). Smart cities ranking of European medium-sized cities. Centre of Regional Science, Vienna University of Technology: Vienna, Austria. Retrieved from https://www.smart-cities.eu/download/smart_cities_final_report.pdf
29
Golubchikov O. Thornbush M. J. (2022). Smart cities as hybrid spaces of governance: Beyond the hard/soft dichotomy in cyber-urbanization. Sustainability14:10080. doi: 10.3390/su141610080
30
Gracias J. S. Parnell G. S. Specking E. Pohl E. A. Buchanan R. (2023). Smart cities—a structured literature review. Smart Cities6, 1719–1743. doi: 10.3390/smartcities6040080
31
Grant M. J. Booth A. (2009). A typology of reviews: an analysis of 14 review types and associated methodologies. Health Inf. Libr. J.26, 91–108. doi: 10.1111/j.1471-1842.2009.00848.x
32
Guenduez A. A. Mergel I. (2022). The role of dynamic managerial capabilities and organizational readiness in smart city transformation. Cities129:103791. doi: 10.1016/j.cities.2022.103791
33
Hajek P. Youssef A. Hajkova V. (2022). Recent developments in smart city assessment: A bibliometric and content analysis-based literature review. Cities126:103709. doi: 10.1016/j.cities.2022.103709
34
Hansen M. M. Dahiya B. (2025). Traffy fondue: a smart city citizen engagement. Front. Sustain. Cities7:1491621. doi: 10.3389/frsc.2025.1491621
35
He L. (2023). Assessing the smart city: a review of metrics for performance assessment, risk assessment and construction ability assessment cogent econ. Finance11:2273651. doi: 10.1080/23322039.2023.2273651
36
Huovila A. Bosch P. Airaksinen M. (2019). Comparative analysis of standardized indicators for smart sustainable cities: what indicators and standards to use and when?Cities89, 141–153. doi: 10.1016/j.cities.2019.01.029
37
ISO 37120 (2018). ISO 37120:2018. Sustainable cities and communities-indicators for city services and quality of life. Second. Edn. Geneva: ISO.
38
ISO 37122 (2019). Sustainable cities and communities-Indicators for smart cities. Geneva: ISO.
39
ITU 1603 (2016). ITU-T Y.4903/L.1603 evaluation and assessment key performance indicators for smart sustainable cities to assess the achievement of sustainable development goals. Geneva: ITU.
40
Joshi A. Kale S. Chandel S. Pal D. (2015). Likert scale: explored and explained. Br. J. Appl. Sci. Technol.7, 396–403. doi: 10.9734/BJAST/2015/14975
41
Kaluarachchi Y. (2022). Implementing data-driven smart city applications for future cities. Smart Cities5, 455–474. doi: 10.3390/smartcities5020025
42
Kogan N. Lee K. J. (2014). Exploratory research on the success factors and challenges of smart city projects. Asia Pac. J. Inf. Syst.24, 141–189. doi: 10.14329/apjis.2014.24.2.141
43
Konbr U. (2019). Smart sustainable cities —vision and reality. Resourceedings2, 101–127. doi: 10.21625/resourceedings.v2i1.455
44
Lacson J. J. Lidasan H. S. Spay Putri Ayuningtyas V. Feliscuzo L. Malongo J. H. Lactuan N. J. et al . (2023). Smart city assessment in developing economies: a scoping review. Smart Cities6, 1744–1764. doi: 10.3390/smartcities6040081
45
Leydesdorff L. Deakin M. (2010). The triple Helix model and the Meta-stabilization of Urban Technologies in smart cities. arXiv preprint arXiv:1003.3344. Available at: https://www.leydesdorff.net/smartcities/smartcities.pdf
46
Liberati A. Altman D. G. Tetzlaff J. Mulrow C. Gøtzsche P. C. Ioannidis J. P. A. et al . (2009). The PRISMA statement for reporting systematic reviews and Meta-analyses of studies that evaluate health care interventions: explanation and elaboration. Ann. Intern. Med.151, W-65–W-94. doi: 10.7326/0003-4819-151-4-200908180-00136
47
Liu J. Chen N. Chen Z. Xu L. Du W. Zhang Y. et al . (2022). Towards sustainable smart cities: maturity assessment and development pattern recognition in China. J. Clean. Prod.370:133248. doi: 10.1016/j.jclepro.2022.133248
48
Lombardi P. Giordano S. Farouh H. Yousef W. (2012). Modelling the smart city performance. Innov. Eur. J. Soc. Sci. Res.25, 137–149. doi: 10.1080/13511610.2012.660325
49
Mahmoudi S. M. Ghasemi S. (2022). Feasibility study of E-readiness to creating smart municipality (case study: Nasim Shahr). J. Urban Econ. Planning3, 100–113. doi: 10.22034/UEP.2022.351694.1265
50
Manville C. Cochrane G. Cave J. Millard J. Pederson J. K. Thaarup R. K. (2014). Mapping smart cities in the EU. Brussels: European Parliament, Policy Department A: Economic and Scientific Policy.
51
Marrone M. Hammerle M. (2018). Smart cities: a review and analysis of stakeholders’ literature. Bus. Inf. Syst. Eng.60, 197–213. doi: 10.1007/s12599-018-0535-3
52
Mashau N. L. Kroeze J. H. (2024). A readiness assessment tool for smart city implementation in small and rural municipalities. J. Inf. Syst. Informatics6, 2937–2964. doi: 10.51519/journalisi.v6i4.937
53
Mattoni B. Gugliermetti F. Bisegna F. (2015). A multilevel method to assess and design the renovation and integration of smart cities. Sustain. Cities Soc.15, 105–119. doi: 10.1016/j.scs.2014.12.002
54
Meijer A. Bolívar M. P. R. (2016). Governing the smart city: a review of the literature on smart urban governance. Int. Rev. Adm. Sci.82, 392–408. doi: 10.1177/0020852314564308
55
Mohareb E. Perrotti D. (2024). Sustainability transitions require an understanding of smaller cities. J. Ind. Ecol.28, 6–16. doi: 10.1111/jiec.13434
56
Nam T. Pardo T. (2011). Smart city as urban innovation: focusing on management, policy, and context. ACM Int. Conf. Proc. Series22, 185–194. doi: 10.1145/2072069.2072100
57
Neirotti P. De Marco A. Cagliano A. C. Mangano G. Scorrano F. (2014). Current trends in Smart City initiatives: Some stylised facts. Cities38, 25–36. doi: 10.1016/j.cities.2013.12.010
58
Neumann O. Matt C. Hitz-Gamper B. S. Schmidthuber L. Stürmer M. (2019). Joining forces for public value creation? Exploring collaborative innovation in smart city initiatives. Gov. Inf. Q.36:101411. doi: 10.1016/j.giq.2019.101411
59
Noori N. de Jong M. Hoppe T. (2020). Towards an integrated framework to measure smart city readiness: the case of Iranian cities. Smart Cities3, 676–704. doi: 10.3390/smartcities3030035
60
Orlowski A. (2021). Smart cities concept - readiness of city halls as a measure of reaching a smart city perception. Cybern. Syst.52, 313–327. doi: 10.1080/01969722.2020.1871224
61
Panagiotopoulos P. Klievink B. Cordella A. (2019). Public value creation in digital government. Gov. Inf. Q.36:101421. doi: 10.1016/j.giq.2019.101421
62
Panagiotopoulou M. Stratigea A. Leka A. (2020). “Gathering global intelligence for assessing performance of smart, sustainable, resilient, and inclusive cities (S2RIC)” in Citizen-responsive urban E-planning: Recent developments and critical perspectives. ed. Nunes-SilvaC. (Hershey, PA, USA: IGI Global), 305–345.
63
Portulans Institute (2024). Network readiness index 2024. Vermont Ave, NW: Portulans Institute.
64
Saaty T. L. (2001). “Fundamentals of the analytic hierarchy process” in The analytic hierarchy process in natural resource and environmental decision making. ed. SchmoldtD. L. (Dordrecht: Springer Netherlands), 15–35.
65
Saaty T. L. (1980). The analytic hierarchy process (AHP). J. Oper. Res. Soc.41, 1073–1076.
66
Scottish Cities Alliance (2014). Smart cities maturity model and self-assessment tool guidance note for completion of self-assessment tool. Available online at: https://scottishcities.org.uk/wp-content/uploads/2021/01/Smart-Cities-Scotland-Maturity-Model-and-Self-Assessment-Tool.pdf (accessed March 26, 2025).
67
Sharifi A. (2019). A critical review of selected smart city assessment tools and indicator sets. J. Clean. Prod.233, 1269–1283. doi: 10.1016/j.jclepro.2019.06.172
68
Shi H. Tsai S.-B. Lin X. Zhang T. (2018). How to evaluate smart cities’ construction? A comparison of Chinese Smart City evaluation methods based on PSF. Sustainability10:37. doi: 10.3390/su10010037
69
Simpson P. (2017). Smart cities: Understanding the challenges and opportunities. London: Smart Cities World and Philips.
70
Smart Cities Council (2015). SMART CITIES READINESS GUIDE the planning manual for building tomorrow’s cities today. Reston, VI: Smart Cities Council.
71
Snyder H. (2019). Literature review as a research methodology: an overview and guidelines. J. Bus. Res.104, 333–339. doi: 10.1016/j.jbusres.2019.07.039
72
Stanković J. Džunić M. Džunić Ž. Marinković S. (2017). A multi-criteria evaluation of the European cities’ smart performance: economic, social and environmental aspects Zbornik radova Ekonomskog fakulteta u Rijeci: časopis za ekonomsku teoriju i praksu. Proc. Rijeka Faculty Econ. J. Econ. Bus.35, 519–550. doi: 10.18045/zbefri.2017.2.519
73
Toh C. K. (2022). Smart city indexes, criteria, indicators and rankings: an in-depth investigation and analysis. IET Smart Cities4, 211–228. doi: 10.1049/smc2.12036
74
Wolniak R. Gajdzik B. Grebski M. Danel R. Grebski W. W. (2024). Business models used in smart cities—theoretical approach with examples of smart cities. Smart Cities7, 1626–1669. doi: 10.3390/smartcities7040065
75
Wu Y. J. Chen J.-C. (2021). A structured method for smart city project selection. Int. J. Inf. Manag.56:101981. doi: 10.1016/j.ijinfomgt.2019.07.007
Summary
Keywords
smart cities, urban sustainability, sustainable urban development, decision-support frameworks, small and medium-sized cities, project feasibility assessment
Citation
Esteban-Narro R, Lo-Iacono-Ferreira VG and Torregrosa-López JI (2025) Supporting sustainable urban transformation: a feasibility framework for smart city projects. Front. Sustain. Cities 7:1675890. doi: 10.3389/frsc.2025.1675890
Received
29 July 2025
Accepted
02 October 2025
Published
24 October 2025
Volume
7 - 2025
Edited by
Saeed Nosratabadi, Hungarian University of Agricultural and Life Sciences, Hungary
Reviewed by
Valentin Marian Antohi, Dunarea de Jos University, Romania
Parisa Omidmand, Texas Tech University, United States
Updates
Copyright
© 2025 Esteban-Narro, Lo-Iacono-Ferreira and Torregrosa-López.
This is an open-access article distributed under the terms of the Creative Commons Attribution License (CC BY). The use, distribution or reproduction in other forums is permitted, provided the original author(s) and the copyright owner(s) are credited and that the original publication in this journal is cited, in accordance with accepted academic practice. No use, distribution or reproduction is permitted which does not comply with these terms.
*Correspondence: Rafael Esteban-Narro, raesnar@upv.edu.es
Disclaimer
All claims expressed in this article are solely those of the authors and do not necessarily represent those of their affiliated organizations, or those of the publisher, the editors and the reviewers. Any product that may be evaluated in this article or claim that may be made by its manufacturer is not guaranteed or endorsed by the publisher.