Abstract
The rapid urbanization and industrialization of the Guangdong-Hong Kong-Macao Greater Bay Area (GBA) pose a severe challenge for rational land use. This study presents a multi-factor land-use suitability assessment system with economic, social, and environmental dimensions. System reliability and stability are confirmed by a Cronbach’s α coefficient (>0.7). We innovatively integrate the PS-DR-DP model with the Monte Carlo and Markov models. The Markov model analyzes transition probabilities between different land capacity states. The Monte Carlo method quantifies key parameter uncertainties through extensive random sampling, while the Markov chain-Monte Carlo approach dynamically evaluates and predicts land capacity. From 2002 to 2022, overall GBA land-population carrying capacity is stable above 0.6 and keeps rising, reflecting improved regional land capacity and successful coordinated development. However, the forecast results indicate that land capacity will first increase and then decrease between 2023 and 2042, with most cities reaching a peak carrying capacity (S-value approaching or exceeding 2) in 2027. This peak is followed by a projected decline, and by 2042, the overall land capacity may drop to around 0.5, signaling a significant long-term risk of overload. If current development trends continue, the region faces significant long-term risks of declining carrying capacity, particularly if the transition to a sustainable, innovation-driven economy is not managed effectively. This highlights the profound challenge of balancing economic growth, urbanization, and ecological protection. These recommendations offer scientific evidence and decision-making support for sustainable GBA development.
1 Introduction
Serving as a crucial fulcrum for China’s “dual-circulation” strategy, the Guangdong-Hong Kong-Macao Greater Bay Area (GBA) is one of the country’s most economically vibrant and open regions. With less than 0.6% of China’s land area, it contributes about 12% of the nation’s GDP, making it a core driver of regional collaborative and high-quality development (Chen and Xu, 2021; Zeng et al., 2020; Li et al., 2021). However, between 2010 and 2020, the annual expansion rate of construction land in the GBA reached 3.2%, much higher than the national average. This has intensified regional “production-living-ecological space” conflicts, manifesting as the fragmentation and shrinkage of ecological space. For instance, the total mangrove area decreased by 18% over the study period, a significant loss that contributes to habitat fragmentation. This percentage loss is calculated as =[(−)/] × 100%, where Ainitial and Afinal are the initial and final mangrove areas, respectively. This annual rate is calculated as the total converted farmland area relative to the initial area, divided by the number of years in the observation period (=[(/)/Y] × 100%). A higher rate signifies more rapid loss of essential agricultural land. These spatial imbalances have further triggered socioeconomic issues such as ‘job-housing mismatch’ (residential-job separation index rising to 1.32) (Zhang J. et al., 2022; Zhang Z. et al., 2022; Hu et al., 2021; Zhou et al., 2016), posing a challenge to the region’s sustainable development. This index quantifies the degree of separation between workplaces and residences, typically calculated as the ratio of the actual average commute distance to the theoretical minimum average commute distance (I=). A value greater than 1.0 indicates a spatial mismatch, with higher values signifying a greater degree of separation and potentially longer commuting burdens. Therefore, the core objective of this study is to provide a scientific basis for resolving these complex socioeconomic and environmental problems from the perspective of spatial planning and land suitability. Currently, ensuring sustained economic growth while resolving the population—resource—environment contradictions within the area has become a pressing issue. Land Suitability Assessment (LSA) (Ni and Wei, 2024; Ma et al., 2022) is key to solving the “trilemma” of spatial resource allocation, offering scientific backing for regional planning, land use, and ecological protection. Yet, LSA in the GBA faces many challenges like complex natural geography, multi-source data integration, cross-domain institutional barriers, and dynamic risk overlay (Zhong and Chen, 2025; Sun et al., 2025; Liu et al., 2020; Zhao et al., 2018). So, building a scientific and reasonable LSA system is of great importance for the GBA’s sustainable development.
As a core land resource management tool, the Land Suitability Assessment (LSA) methodological evolution mirrors the deepening understanding of complex human-environment systems. Early studies, typified by McHarg’s (1969) overlay analysis, focused on natural element superposition but were restricted by static evaluation and qualitative decision-making (Collins et al., 2001). With geographic information system (GIS) technology development, FAO’s systematic evaluation framework enabled multi-source data spatial integration (FAO, 1976), and Steiner et al.’s subsequent multi-criteria decision-making model (Steiner et al., 2000) marked the shift from one-dimensional to multi-dimensional LSA research. Current international frontier research shows two trends. First, dynamic simulation technology is widely used. For example, Batty combined Cellular Automata (CA) with Multi-Agent Systems (MAS) for dynamic urban expansion simulation (Batty, 2013). Second, uncertainty quantification has become a focus. Li et al. (2018) used Bayesian networks to integrate various uncertainties, improving the evaluation result credibility. Domestic research has evolved from adopting foreign experiences to independent innovation. In 2002, Wu’s (2002) “Human Settlements Science” theory provided a localized LSA framework, and Duan’s (2024) team developed the “spatial gene” technology in 2015 for quantitative local characteristic analysis. In terms of method innovation, Li Mianchun et al.’s CLUE-S model (Fan et al., 2023), integrating system dynamics and spatial allocation algorithms, has greatly improved simulation accuracy.
The “Pressure-Support; Destructiveness-Resilience; Degradation-Promotion” Model (PS-DR-DP Model). The PS-DR-DP model is an optimized version of the “Pressure-State-Response” model (P-S-R model) (Yu et al., 2023), developed by Wang Liang et al. It expands the framework from three dimensions to six dimensions, forming a regular hexagon model of interacting forces (Wang and Liu, 2019). As a framework for assessing resource and environmental carrying capacity (RECC), the PS-DR-DP model decomposes carrying capacity into the resultant sum of multiple forces. It simulates the dynamic changes in RECC using the filling degree of the hexagon model, providing a “warning-oriented” evaluation mechanism (Xinxin, 2024). This model addresses both the issues of “growth limits” and “structural stability,” using the hexagon’s filling degree to simulate RECC dynamics and establish its warning-oriented evaluation mechanism. Domestically, some scholars have applied it to evaluate the comprehensive carrying capacity of specific regions (such as resource-based cities, ecologically fragile areas, and river basins), validating its effectiveness in identifying key constraining factors and providing early warnings of carrying status (Ying et al., 2022; Li J. et al., 2024; Li M. et al., 2024; Zhang J. et al., 2022; Zhang Z. et al., 2022). Other research has attempted to integrate the PS-DR-DP model with other methods (such as system dynamics, neural networks, and GIS spatial analysis) to enhance its dynamic simulation capabilities and spatial visualization (Zhao et al., 2021; Wu and Ning, 2018). These studies have deepened the understanding of the interaction mechanisms among the six-dimensional forces and have made valuable explorations in areas such as indicator system construction, weighting methods, and setting warning thresholds for evaluation results. Internationally, literature directly applying the PS-DR-DP model is relatively limited. However, its core ideas (multidimensionality, dynamic nature, warning-orientation) align with the international forefront of carrying capacity research. Frameworks like the UN Sustainable Development Goals (SDGs) indicators, Ecological Footprint, Planetary Boundaries, and the PSR model and its derivatives (United Nations, 2015; Rockström et al., 2009; European Environment Agency, 2007) all focus on multidimensional comprehensive evaluation, human-nature system interactions, and tipping point warnings. The PS-DR-DP model’s expansion to six forces, explicitly distinguishing between “Destructiveness-Resilience” and “Degradation-Promotion,” provides a refined perspective for characterizing system resilience and recovery potential. This aligns with the international emphasis on Resilience and Sustainability Transitions research (Folke, 2016). Its “hexagon filling” visualization method for warnings intuitively displays multidimensional states. As research deepens and international exchange increases, the theoretical value and application potential of the PS-DR-DP model are expected to gain wider international recognition. Its multidimensional opposing forces framework and warning mechanism could provide new analytical tools for global sustainability science (Turner, 2010). Future research should promote its standardization and international application, strengthening comparisons and linkages with mainstream international frameworks.
International frontier research has not only made breakthroughs in model complexity and precision but is also exploring how to better handle uncertain factors within large-scale urban agglomerations. Against this backdrop, Monte Carlo simulation, as a powerful tool for uncertainty analysis, is increasingly becoming a research hotspot in the field of spatial planning. This method, through random sampling techniques, can effectively address uncertainty issues in complex systems, providing comprehensive risk assessment for decision-making. For example, the Probabilistic Cellular Automata (p-CA) model developed by Hagen-Zanker in 2008 (van Vliet et al., 2013), by introducing a random sampling mechanism, successfully resolved the parameter sensitivity problem inherent in traditional Cellular Automata models, significantly enhancing model adaptability and predictive capabilities. Domestic scholars are also actively exploring methods that integrate advanced computing technologies with Monte Carlo simulation (Wu et al., 2018; Weng et al., 2022; Dong and Xu, 2019). In 2021, Liu Yaolin’s team proposed a land change simulator integrating deep learning with Monte Carlo simulation (Li J. et al., 2024; Li M. et al., 2024). This tool possesses adaptive capabilities, enabling it to respond to complex and dynamic spatial environments. Nonetheless, existing research still faces challenges when dealing with geographic big data in the GBA, including computational bottlenecks (Chen et al., 2022) and inadequate capability in representing unstructured variables such as institutional factors (Yang et al., 2023). These challenges urgently require further exploration and resolution.
While existing models offer valuable tools, they exhibit specific limitations when applied to the dynamic and complex human-environment system of the GBA. The classic Pressure-State-Response (PSR) model, for instance, provides a foundational framework but often simplifies the intricate feedback loops into only three dimensions, potentially overlooking the opposing forces of system degradation and resilience. Spatio-temporal models like Cellular Automata-Markov (CA-Markov) excel at simulating the future patterns of physical land-use change but are less adept at forecasting the dynamic evolution of the overall carrying capacity state, which is an aggregate function of non-spatial economic, social, and environmental drivers. Furthermore, while methods like Bayesian networks can effectively model uncertainty, their application often requires complex conditional probability tables and may not be as transparent for simulating future trajectories based on temporal state transitions.
This study addresses these gaps by constructing an innovative analytical framework that synthesizes three powerful methodologies. Before this, to ensure the internal consistency of the constructed multidimensional indicator system, we employed Cronbach’s α coefficient for assessment, guaranteeing that the indicators are both independent and interrelated, thereby forming a reliable and effective evaluation system (Ahmad et al., 2024; Alexandrou et al., 2023). First, we move beyond the conventional PSR model by employing the Pressure-Support; Destructiveness-Resilience; Degradation-Promotion (PS-DR-DP) model. This six-dimensional framework provides a more granular and holistic understanding of the antagonistic forces that shape carrying capacity, offering a “warning-oriented” mechanism better suited to the GBA’s complexity. Second, we couple this with a Markov model to achieve a precise, dynamic simulation of future transitions between different carrying capacity states, focusing on the temporal trajectory rather than just spatial allocation. Third, we innovatively integrate Monte Carlo simulation to explicitly quantify the uncertainty associated with these future predictions. By generating a probabilistic range of outcomes, our approach provides a more robust and realistic forecast compared to deterministic methods.
2 Materials and methods
To systematically present the technical pathway and implementation flow of this study, and based on integrating the geographical characteristics of the GBA with scientific methodologies, this paper constructs a technical roadmap (as illustrated in Figure 1).
Figure 1
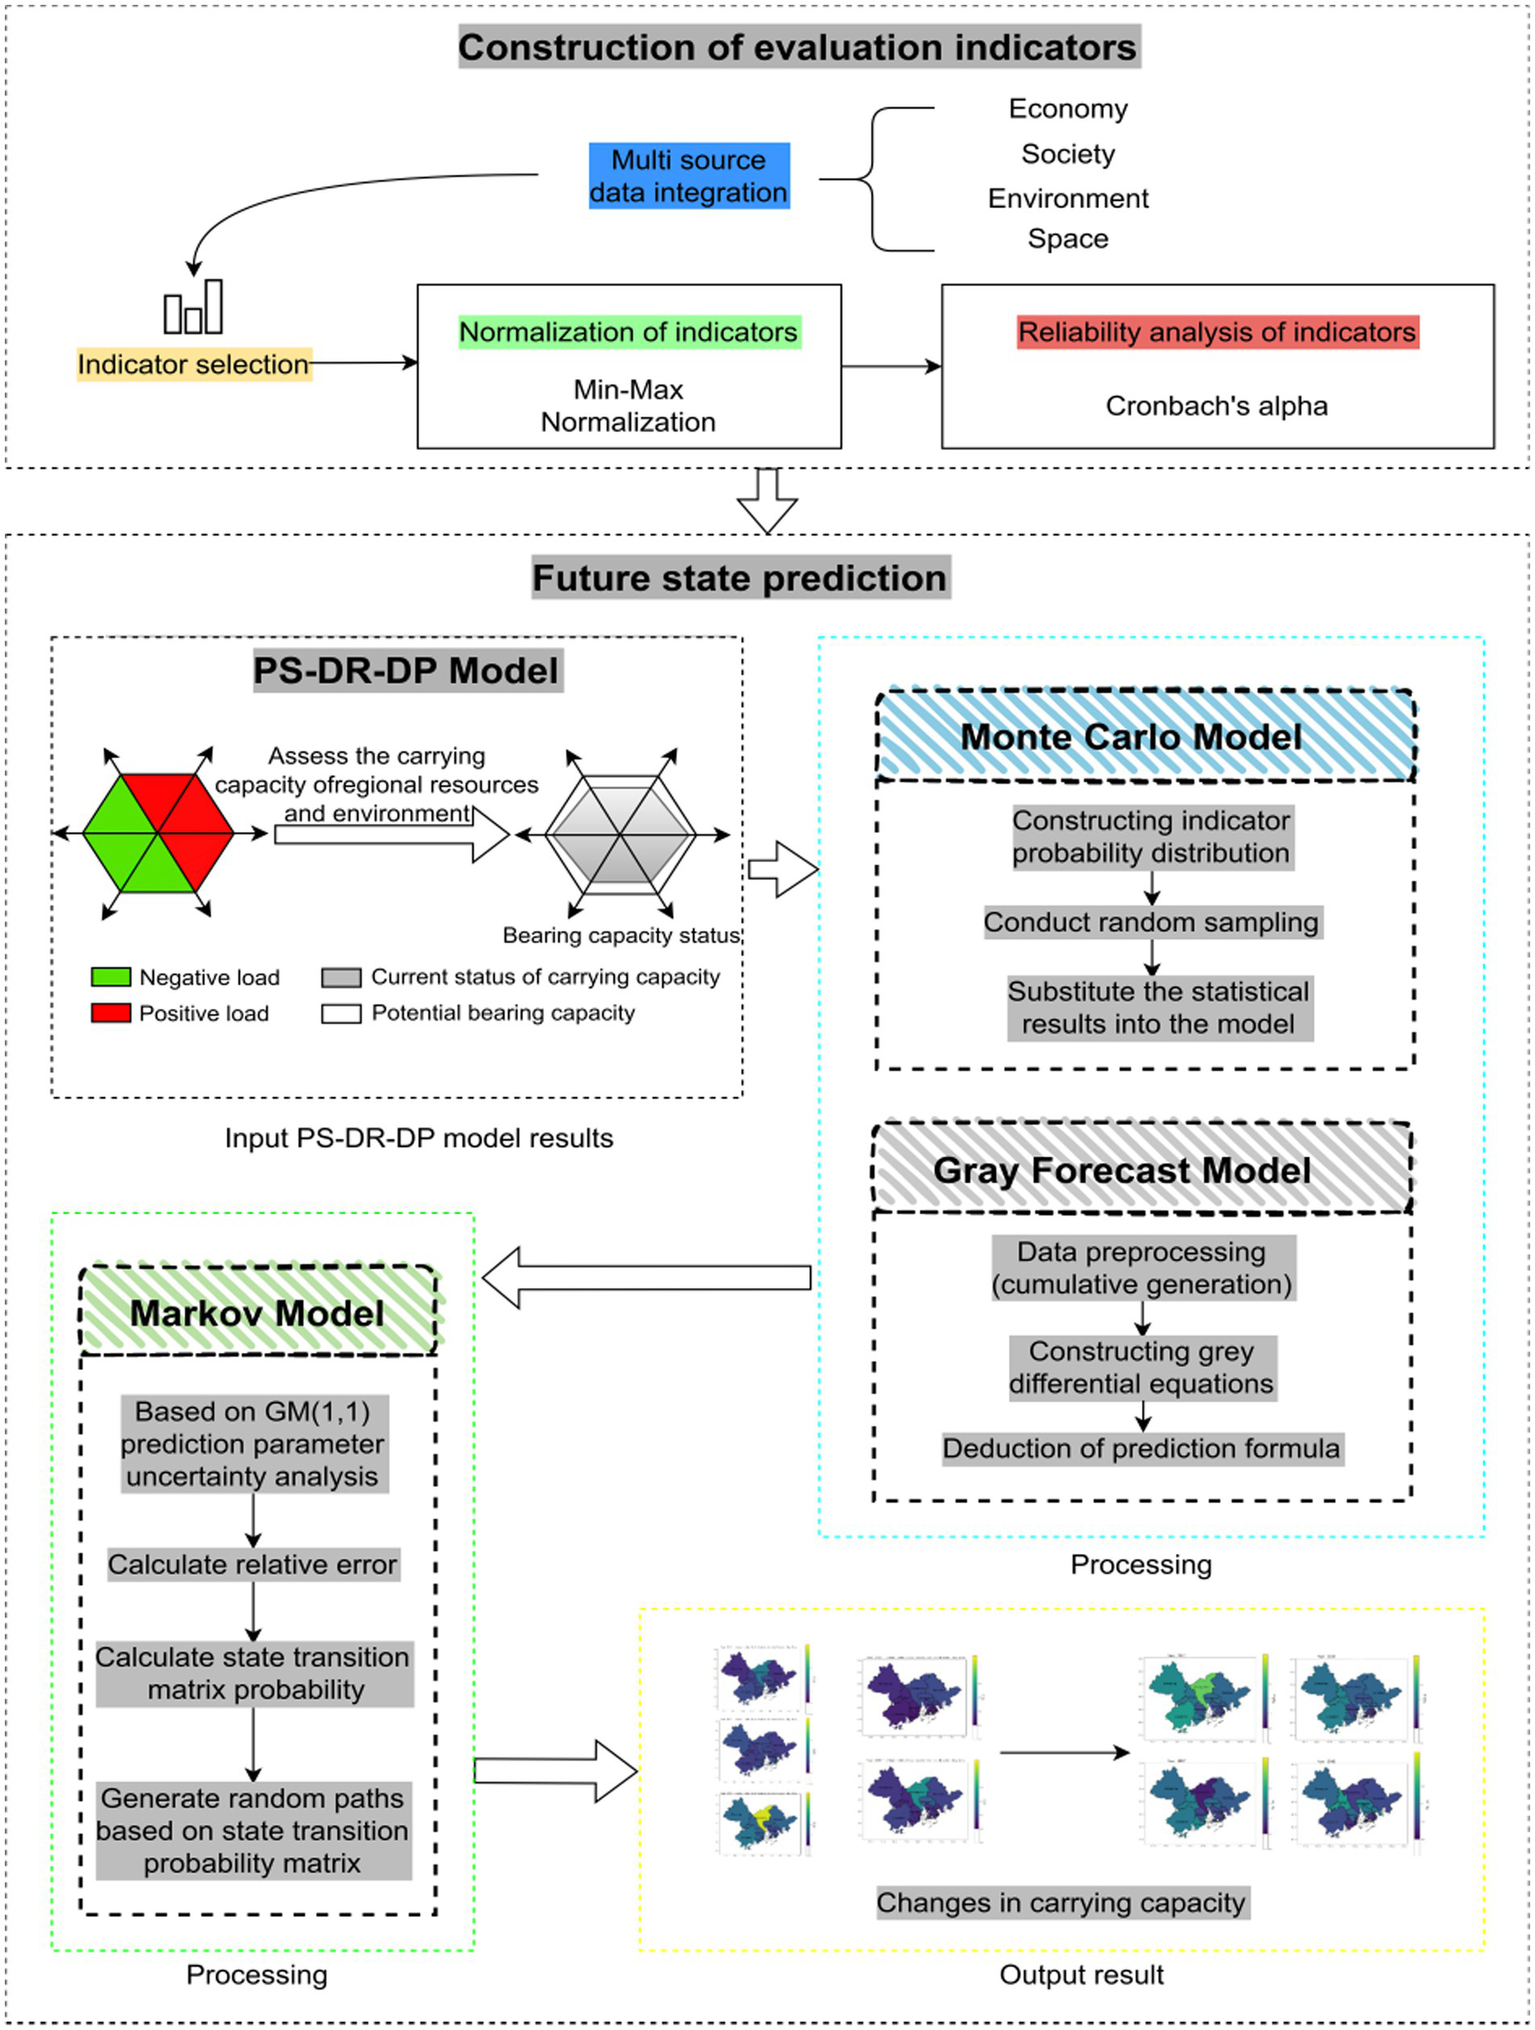
Overall technical roadmap of the project.
2.1 General situation
The GBA is located in the southern coastal region of China (21°–25°N, 111°–116°E), and consists of the “92+” city cluster pattern with a total area of about 56,000 km2, including nine cities in the Pearl River Delta, namely Guangzhou, Shenzhen, Zhuhai, Foshan, Dongguan, Zhaoqing, Huizhou, Zhongshan, and Jiangmen, as well as the two special administrative regions of Hong Kong and Macao (as shown in Figure 2). This area shows significant spatial differentiation characteristics. According to the 2023 China Statistical Yearbook and the spatial assessment report of the Chinese Academy of Sciences, the Guangzhou-Shenzhen dual-core (accounting for 26% of the area) has formed an economic pole through the siphon effect. In 2022, the total GDP reached 6.12 trillion yuan (Shenzhen 3.24 trillion yuan, Guangzhou 2.88 trillion yuan, ranking third and fourth in the country respectively), contributing 52% of the economic output of the GBA and supporting a resident population of over 30 million (32% of the total population of the area). Intensive development has led to spatial mismatch, with the Guangzhou-Shenzhen work-residence separation index reaching 1.32 (15% higher than the Pearl River Delta average of 1.15), highlighting the contradiction of high-density urban spatial resource misallocation. The regional ecological functions show a “west conservation-east squeeze” pattern: Zhaoqing, as the ecological shield of the GBA has, a forest coverage rate of over 70% (32% higher than the regional average of 53%), undertaking 60% of the water conservation and biodiversity maintenance functions of the West River Basin. Dongguan, driven by industrialization, has only 28% of ecological space. From 2011 to 2021, the expansion construction of land encroached on 120 square kilometers of basic farmland (15% of the total arable land in the city), reflecting the deep-seated conflict between economic growth and ecological security.
Figure 2
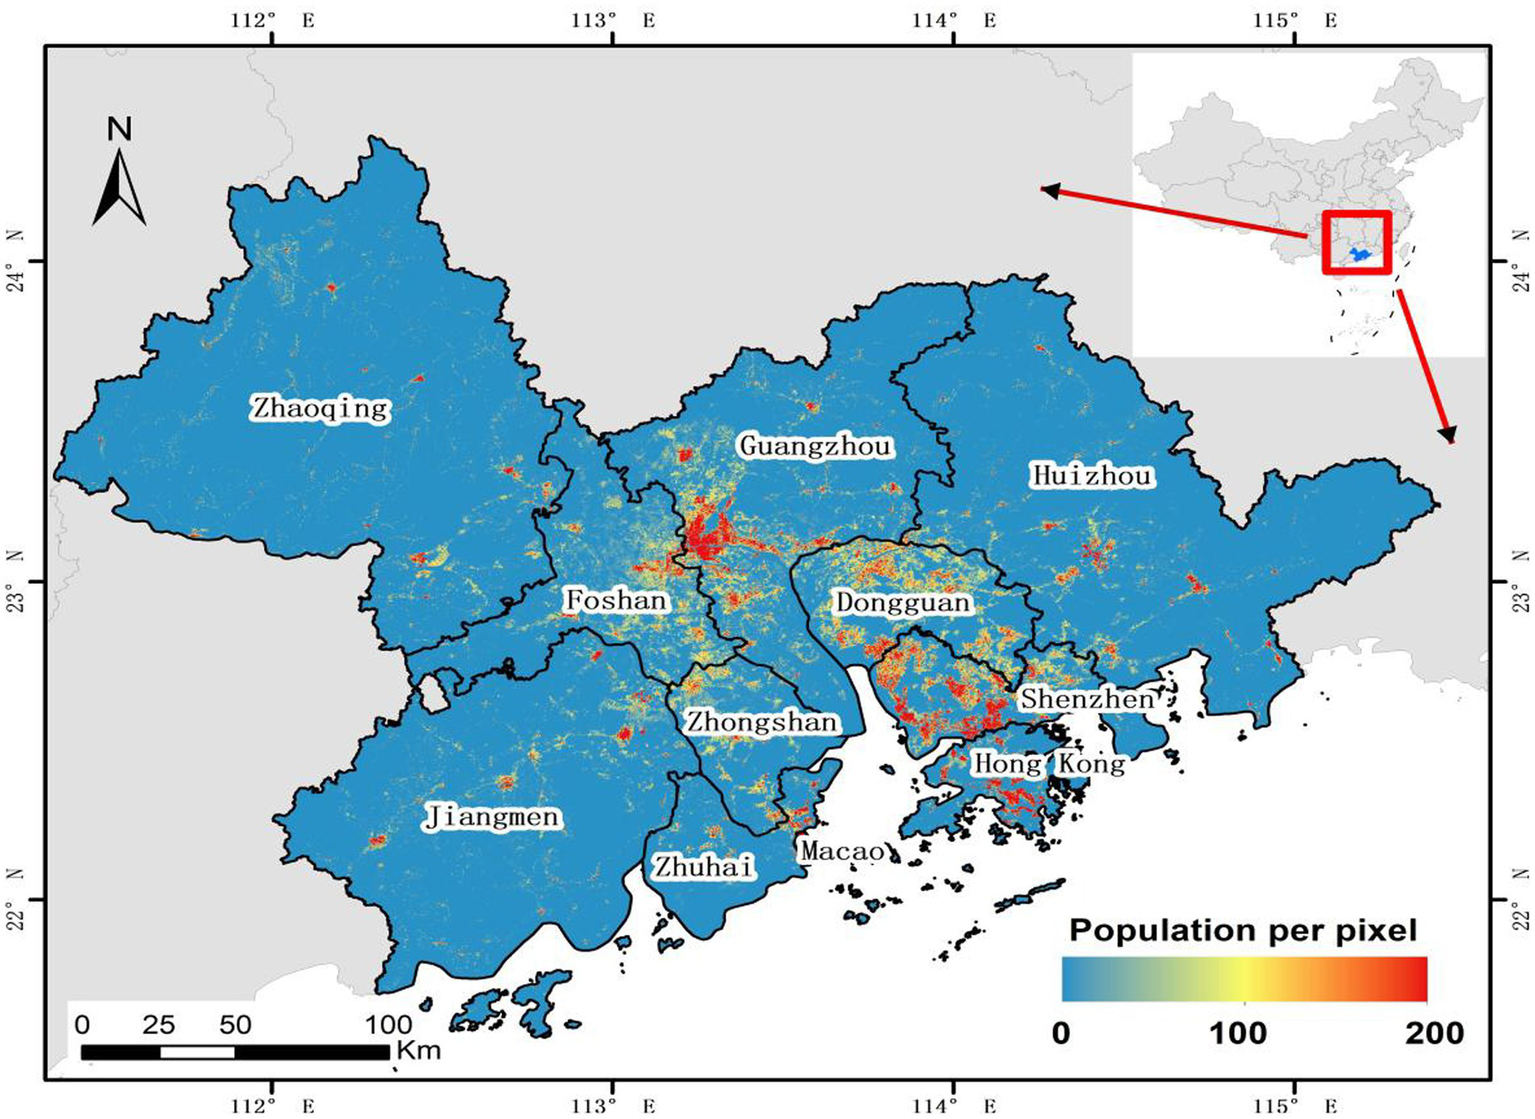
The location map of the GBA.
2.2 Data introduction
This integrates study multidimensional economic, social, and environmental data from authoritative sources, including the China Statistical Yearbook (2002–2020),1 Guangdong Statistical Yearbook, China Environmental Statistical Yearbook,2 China Forestry Statistical Yearbook,3 and local statistical bulletins. The data covers key indicators such as macroeconomics and energy (GDP, energy consumption), resources and environment (emissions, ecological area), population and social development (population, income, healthcare), and land use and infrastructure (construction land, greening rate).
To ensure data consistency and accuracy, all raw data underwent rigorous cross-validation, and missing values were addressed. For data gaps in some prefecture-level administrative regions, linear interpolation or spatial filling based on surrounding area averages was used. This guarantees dataset integrity and reliability, offering solid empirical support for in-depth research on the GBA’s territorial spatial planning.
2.3 Cronbach’s alpha coefficient
This study uses the Cronbach α coefficient to test the reliability of the standardized indicator system, assessing the evaluation system’s consistency in repeated measurements. As a measure of data stability, the reliability test reveals the evaluation tool’s reliability and aims to eliminate human-caused interference in the measurement results. According to psychometrics criteria, the α coefficient threshold is positively correlated with system reliability. An α coefficient > 0.9 indicates excellent internal consistency in the indicator system; 0.7 ≤ α < 0.9 shows the system meets basic empirical research requirements; 0.5 ≤ α < 0.7 suggests a need for indicator dimension optimization; and α < 0.5 points to systematic biases in the evaluation framework. The mathematical model of this coefficient can be expressed as follows:
In the formula, represents the reliability coefficient; stands for the number of indicator variables; is the sum of within-group variances of each variable; and is the overall variance of the indicator variables. Reliability analysis is conducted to ensure the reliability of the selected indicator system.
2.4 PS-DR-DP model
The regional land-population carrying capacity is quantitatively evaluated using the PS-DR-DP model, which culminates in a comprehensive Carrying State Index (). This index represents the dynamic balance between supportive (promotive) and restrictive (negative) forces within the regional system.
2.4.1 Calculation of the Carrying State Index (s)
The calculation of the index is a two-step process. First, the contribution value () of each of the six subsystems (positive/negative aspects of economic, social, and environmental resources) is calculated. This is achieved by quantifying the synergistic effect of all indicators within a given subsystem. Based on principles of combinatorial mathematics, the impact weight of each element is determined by the ratio of the characteristic polygon’s mean area to that of a standard regular N-gon. The specific formula for the partial carrying capacity contribution value () is as follows:
In the formula, denotes the partial carrying capacity contribution value for a specific subsystem. represents the number of indicators within that subsystem. and are the normalized values of the i-th and j-th indicators in the subsystem.
Second, the overall Carrying State Index () is calculated as the ratio of the sum of all positive (promotive) subsystem contribution values () to the sum of all negative (restrictive) subsystem contribution values () (see Equation 3):
where represents the contribution value of the i-th positive subsystem (i.e., Positive Economic, Social, and Environmental Resources), and represents the contribution value of the j-th negative subsystem.
2.4.2 Interpretation of the Carrying State Index (s)
The interpretation of the index is crucial for understanding the system’s condition. The value of =1.0 serves as a critical equilibrium threshold, where the supportive forces are perfectly balanced by the restrictive forces.
When >1 (Surplus State): The system is in a positive carrying state, indicating that the combined supportive forces (e.g., economic growth, social services, environmental quality) outweigh the restrictive pressures (e.g., resource consumption, population density, pollution). A higher S-value signifies a stronger and more resilient carrying capacity.
When <1 (Deficit State): The system is in a deficit or pressure state, suggesting that restrictive forces are dominant. This condition serves as an “overload warning,” signaling that the region’s development is becoming unsustainable and may be facing significant challenges.
To facilitate dynamic analysis and future prediction, the continuous values are discretized into four distinct states. These thresholds are defined based on conventions in carrying capacity literature and urban planning standards:
-
State 1 (Overload): < 0.6—Indicates a critical state where pressures significantly exceed the system’s supportive capacity, posing severe risks to sustainability.
-
State 2 (Pressure): 0.6 ≤ < 1.0—Represents a warning state where the system is under pressure, although not yet in a critical overload condition.
-
State 3 (Secure): 1.0 ≤ < 1.5—Signifies a healthy and balanced state with a reasonable buffer to absorb pressures.
-
State 4 (Optimal): ≥ 1.5—Represents a robust state with a strong carrying capacity and significant development potential.
2.4.3 Calculation example (using data for the year 2002)
To clearly demonstrate the calculation process, a hypothetical dataset for the year 2002 is used.
2.4.3.1 Step 1: calculate C-values for each subsystem
According to Equation 1, the C-values for the six subsystems are calculated, respectively. For example, the calculations for the Positive Economic subsystem and the Negative Economic subsystem are as follows:
Positive Economic Subsystem (N = 3), with indicator values: GDP Growth Rate (0.85), Per Capita GDP (0.72), and Urban Disposable Income per Capita (0.60).
Negative Economic Subsystem (N = 3), with indicator values: Energy Consumption per Unit of GDP (0.55), Growth Rate of Energy Consumption per Unit GDP (0.68), and Natural Gas Consumption (0.108).
Similarly, the C-values for the other subsystems can be obtained. The results are summarized below:
In the positive values (), the environment is 1.004, the economy is 1.482, and the society is 1.671; in the negative values (), the environment is 1.030, the economy is 0.945, and the society is 0.943.
2.4.3.2 Step 2: calculate the Comprehensive Index (S)
The Comprehensive Index S for the year 2002 is calculated by substituting the C-values into Equation 2.
-
Sum of Positive C-values:
-
Sum of Negative C-values:
-
Comprehensive Index S:
The calculation shows that the Comprehensive Index S for 2002 is approximately 1.425. As this value is greater than 1, it indicates that during this stage of development, the overall synergistic strength of the system composed of positive indicators outweighs that of the system composed of negative indicators.
2.5 Markov model
First, to construct the Markov transition matrix, the continuous carrying state (S) values must be discretized into four distinct states (). The definition of these states and their thresholds is primarily based on existing standards in urban planning and carrying capacity assessment literature, where S = 1.0 is generally considered the baseline for a balance between supportive and restrictive forces. The specific definitions are as follows:
-
State 1 (Overload): S < 0.6 – Indicates a critical state where pressures significantly exceed the system’s supportive capacity.
-
State 2 (Pressure): 0.6 ≤ S < 1.0 – Represents a warning state where the system is under pressure.
-
State 3 (Secure): 1.0 ≤ S < 1.5 – Signifies a healthy state with a good buffer.
-
State 4 (Optimal): S ≥ 1.5 – Represents a robust state with strong carrying capacity.
Based on the state definitions above, the one-step state transition probability matrix is calculated using historical data from 2002 to 2022.
Uncertainty analysis of prediction parameters based on GM (1,1):
The Monte Carlo method is used to randomly sample parameters of the GM (1,1) model (Equation 4). These parameters (a0, a1) are assumed to follow a normal distribution, with the mean determined from historical data analysis and the standard deviation based on the variance of historical prediction errors. A large number of random parameter combinations A (set to 10,000) are generated for subsequent parallel forecasting computations.
Among them, is the grey prediction value; is the actual value at the previous moment; and are model parameters.
Calculate relative error:
After obtaining the predicted values, it is necessary to evaluate their accuracy. The relative error between the grey prediction value and the actual value is calculated using the following formula (see Equation 5):
Among them, is the relative error; is the actual value.
Markov calculation of state transition matrix probability:
In order to predict future states, it is necessary to calculate the state transition probability matrix, which is calculated using the following formula:
Among them, is the number of times the state has undergone k steps to reach the state ; is the number of times the state appears. Thus obtaining the state transition probability matrix (see Equation 7):
When using Monte Carlo simulation to generate random paths for future state transitions, start from the current initial state. At each iteration step, based on the transition probabilities corresponding to the current state, a random sampling is performed on the distribution of the state transition matrix to select the next state. This dynamically constructs a state evolution sequence (Kang et al., 2019; Azabdaftari and Sunar, 2024; Tariq and Mumtaz, 2023). By repeating a large number of independent simulations, multiple potential random evolution paths of the system can be covered, thereby quantifying the randomness and uncertainty in the state transition process (Ratick and Schwarz, 2009; Ligmann-Zielinska and Jankowski, 2014; Jamroz and Williams, 2020), which endows the Markov model with probabilistic dynamic forecasting capabilities. To ensure the stability and reliability of the simulation, we conducted a convergence validation. By monitoring the mean and standard deviation of the predicted carrying state S for the final year (2042) as the number of iterations increased, we found that the output results stabilized after approximately 8,000 iterations. Therefore, setting 10,000 iterations is sufficient to ensure the robustness of the results and avoid interference from random noise. This helps understand the system’s development trend and formulate corresponding strategies.
2.6 Uncertainty and sensitivity analysis
To address the inherent uncertainties in long-term forecasting and to ensure the robustness of our conclusions, we integrated a comprehensive uncertainty and sensitivity analysis into our modeling framework.
2.6.1 Monte Carlo simulation setup
The probabilistic forecast was generated using a Monte Carlo simulation with 10,000 iterations. This number was chosen to ensure the statistical stability and convergence of the results, as preliminary tests showed that the mean and standard deviation of the final year’s predicted S-value stabilized after approximately 8,000 iterations.
2.6.2 Parameterization of uncertainty
Uncertainty was primarily introduced through the parameters of the GM(1,1) forecasting model (Equation 4). The model parameters, and , were not treated as fixed values but as random variables following a normal distribution. The mean of this distribution was determined by fitting the model to historical data, while the standard deviation was calibrated based on the variance of the historical prediction errors.
2.6.3 Stochastic sampling strategy
For each of the 10,000 iterations, a unique future pathway for the land carrying capacity was simulated. This was achieved by first sampling a set of parameters for the GM(1,1) model from their respective distributions. Then, starting from the last known state (year 2022), the future state for each subsequent year was determined by randomly sampling from the state transition probability matrix (Equation 6), which defines the likelihood of moving from one carrying capacity state to another. This process created a large ensemble of possible future trajectories, allowing us to quantify the forecast’s uncertainty.
2.6.4 Sensitivity analysis
To identify the most influential drivers of future carrying capacity, a One-At-a-Time (OAT) sensitivity analysis was conducted. Key input indicators from the economic, social, and environmental subsystems (e.g., GDP Growth Rate, Population Density, Total Wastewater Discharge) were systematically perturbed by ±10% from their baseline forecast values, while all other indicators were held constant. The simulation was re-run for each perturbation, and the resulting percentage change in the median S-value for the final forecast year (2042) was calculated. This allowed us to rank the indicators based on their impact on the long-term carrying capacity.
3 Results
3.1 Construction of indicator system
When selecting indicators, the following principles must be followed: firstly, the principle of systematicity. Indicators should not only reflect their independence and specificity, but also consider their inherent connections and establish a systematic indicator system. The second principle is scientificity. Each evaluation indicator should have typical representativeness and avoid phenomena such as overly complicated indicators, overlapping or missing information. The third principle is operability. It is necessary to consider the difficulty level of data collection, as well as the practicality and authenticity of the data. The fourth principle is regional specificity. To reflect the comprehensive characteristics of the research area as much as possible. In summary, the reason for choosing the specific indicators mentioned above is that they can comprehensively reflect the uniqueness of the GBA and support scientific decision-making. Based on the regional characteristics of the GBA and the needs for evaluating the suitability of national land space, we have selected a series of indicators from multiple dimensions such as economy, society, and environment (Radermacher, 2021; Hu and Xi, 2023; Zhu et al., 2022). These dimensions not only reflect the current development status of the region, but also provide a basis for future planning. The indicator system constructed in this article is shown in Table 1.
Table 1
| Subsystem | Evaluation indicator | Subsystem | Evaluation indicator |
|---|---|---|---|
| Economic resources Positive subsystem (A1) |
GDP growth rate (%)-GGR | Economic resources Negative subsystem (A0) |
Energy consumption per Unit of GDP (tce/10,000 yuan)-ECU |
| Per capita GDP (10,000 yuan/person)-PCG | Growth rate of energy consumption per unit GDP (%)-GRE | ||
| Urban disposable income per capita (yuan/person)-UDI | Natural gas consumption (100 million m3)-NGC | ||
| Economic density (100 million yuan/km2)-ED | Electricity consumption (100 million kWh)-EC | ||
| Land area (km2)-LA | Annual water supply (10,000 tons)-AWS | ||
| Social resources Positive subsystem (B1) |
Overall labor productivity (%)-OLP | Social resources Negative subsystem (B0) |
Population density (persons/km2)-PD |
| Per capita paved road area (m2/person)-PCP | Permanent resident population (year-end, 10,000 persons)-PRP | ||
| Highway passenger traffic (10,000 persons)-HPT | Natural population growth rate (%)-NPG | ||
| Hospital beds per 10,000 people (units)-HBP | Per capita construction land area (m2/person)-PCC | ||
| Infrastructure investment per unit area (10,000 yuan/km2)-IIU | Registered unemployed persons (year-end, 1,000 persons)-RUP | ||
| Environmental resources Positive subsystem (C1) |
Urban green coverage Rate (%)-UGC | Environmental resources Negative Subsystem (C0) |
Sulfur dioxide emissions (10,000 tons)-SDE |
| Forest stock volume (10,000 m3)-FSV | Smoke/dust emissions (tons)-SDE | ||
| Forest land area (hm2)-FLA | Total wastewater discharge (10,000 tons)-TWD | ||
| Grassland area (hm2)-GA | Industrial hazardous waste generation (10,000 tons)-IHW | ||
| Mangrove area (hm2)-MA | Ambient noise compliance area (km2)-ANC |
Evaluation index system of PS-DR-DP model in GBA.
3.2 Reliability analysis of indicators
This paper collects raw data on land-population carrying capacity indicators of six sub-systems in the cities of the GBA (Hong Kong SAR, Macao SAR, Guangzhou, Zhuhai, Shenzhen, Foshan, Huizhou, Dongguan, Zhongshan, Jiangmen, Zhaoqing) over the past 20 years. Using the min-max standardization method, the data is standardized to compute correlations, presented in a heatmap (Figure 3) that shows part of the indicators due to the large number of cities and indicators. Given the economic, social, and environmental interdependence among cities in the GBA, some indicators correlate highly, particularly between economic and social resource sub-systems. Thus, the Cronbach α coefficient is needed for reliability analysis of the indicators.
Figure 3
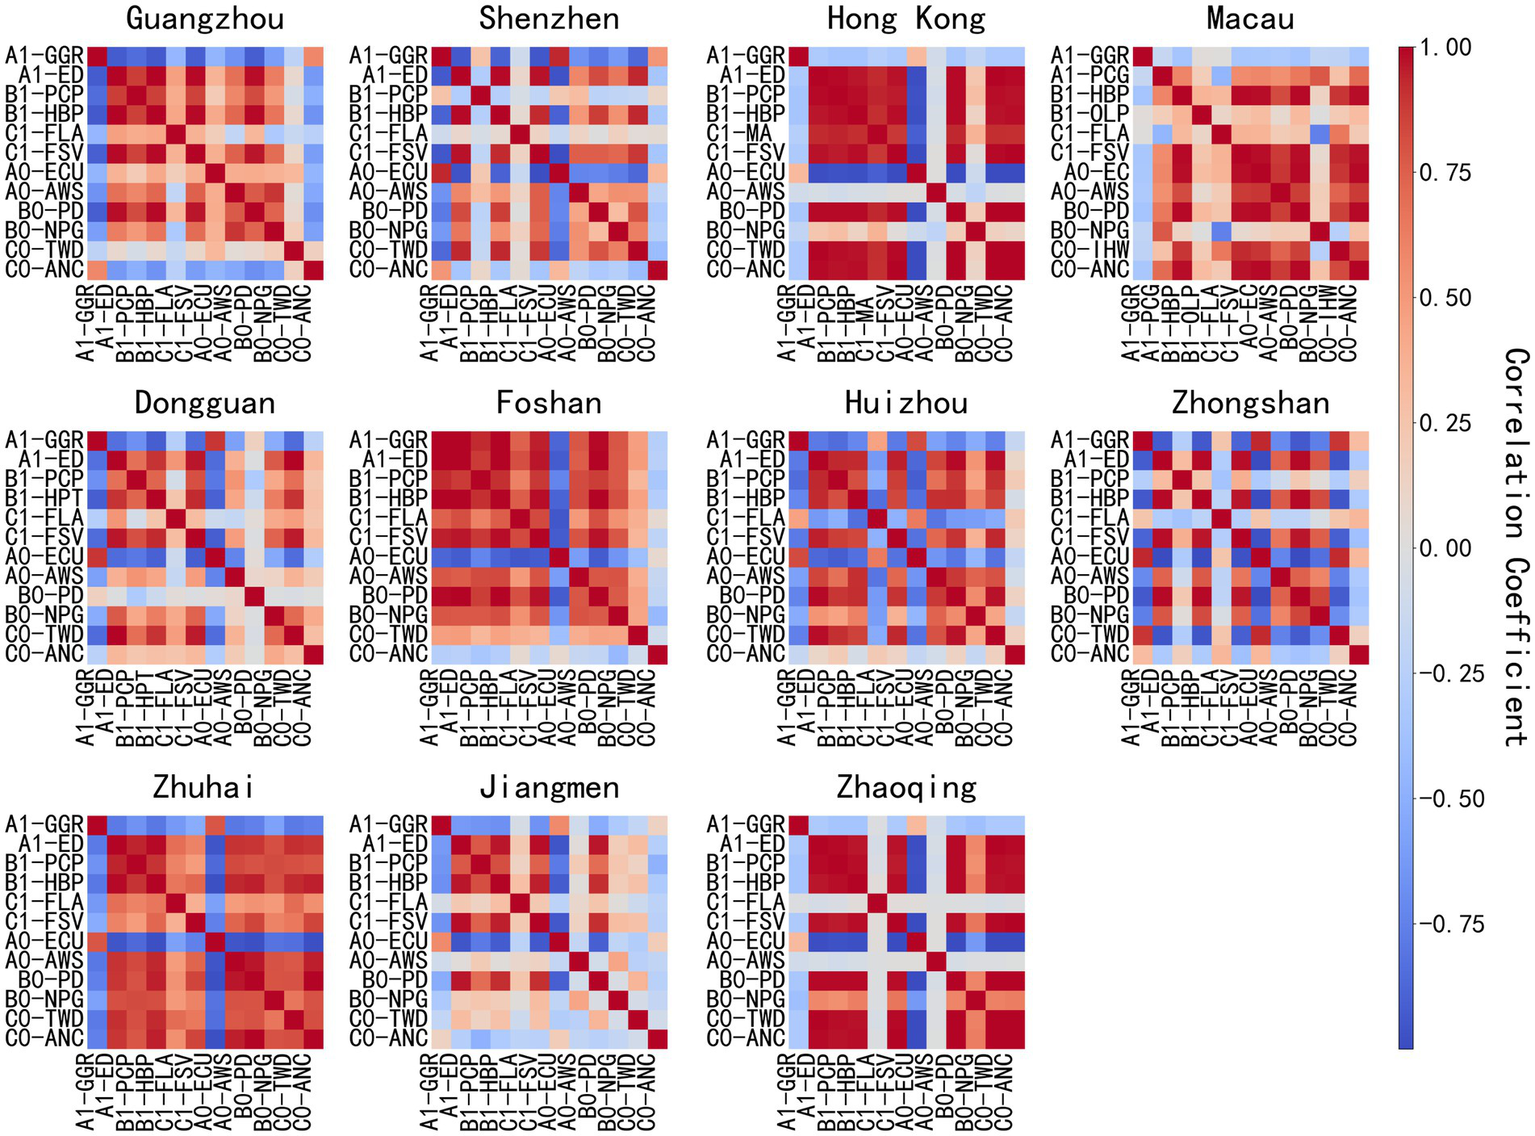
Correlation analysis of evaluation index system for PS-DR-DP model in the GBA.
From the reliability analysis of the GBA (see Table 2), the positive environmental and resource indicators show the best internal consistency. All cities in this category have a Cronbach’s α coefficient above 0.85, up to 0.9852, indicating strong consistency and stability. Further comparison of Cronbach’s α values for the six indicators across cities (see Figure 4) shows that Guangzhou’s values are close to or exceed 0.95 across all indicators. This reflects a well-designed indicator system and stable data structure in Guangzhou, with high credibility. Generally, core cities like Guangzhou, Shenzhen, and Zhuhai have high α coefficients, while peripheral cities like Huizhou, Zhongshan, and Jiangmen have relatively low α values in some dimensions, possibly due to unbalanced regional development or data collection quality differences. Overall, most cities and indicator dimensions have α coefficients above 0.7, showing the indicator system has good internal consistency and stability. In conclusion, the PS-DR-DP model indicator system for cities in the GBA constructed in this study has high reliability. It can largely exclude subjective factors and objectively and accurately reflect the actual situation of land development suitability in the area.
Table 2
| Cronbach’s α for positive economic indicators | Cronbach’s α for negative economic indicators | Cronbach’s α for positive social indicators | Cronbach’s α for negative social indicators | Cronbach’s α for positive environmental indicators | Cronbach’s α for negative environmental indicators | |
|---|---|---|---|---|---|---|
| Hong Kong | 0.7941 | 0.8911 | 0.8392 | 0.7665 | 0.9852 | 0.7799 |
| Macao | 0.7921 | 0.7396 | 0.9567 | 0.8020 | 0.8800 | 0.7471 |
| Guanzhou | 0.9612 | 0.9614 | 0.9537 | 0.9648 | 0.9624 | 0.9477 |
| Zhuhai | 0.9550 | 0.9401 | 0.8501 | 0.8666 | 0.9574 | 0.8175 |
| Shenzhen | 0.9482 | 0.9448 | 0.9305 | 0.9641 | 0.9602 | 0.9587 |
| Foshan | 0.9522 | 0.8724 | 0.8739 | 0.8660 | 0.8548 | 0.9752 |
| Huizhou | 0.9375 | 0.8807 | 0.8946 | 0.7564 | 0.8672 | 0.7000 |
| Dongguan | 0.8406 | 0.9107 | 0.7587 | 0.9424 | 0.8350 | 0.7531 |
| Zhongshan | 0.9468 | 0.8048 | 0.8723 | 0.8494 | 0.8537 | 0.7466 |
| Jiangmen | 0.9333 | 0.8125 | 0.7927 | 0.8275 | 0.8670 | 0.8961 |
| Zhaoqing | 0.7637 | 0.7243 | 0.7715 | 0.9202 | 0.8723 | 0.8538 |
Reliability of indicators in the GBA.
Figure 4
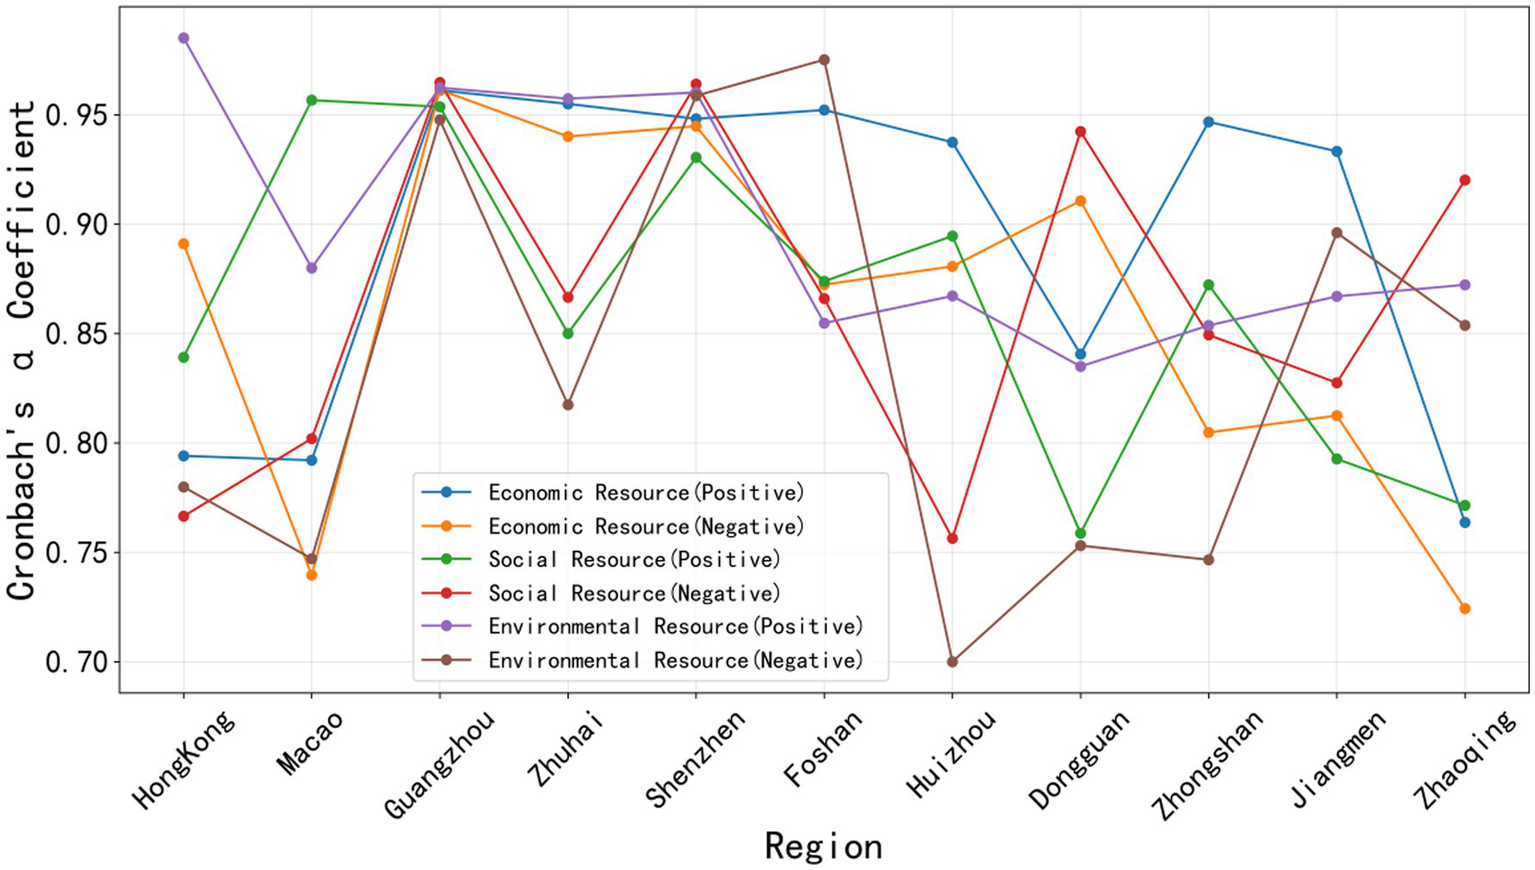
Line chart of reliability analysis of indicators for the GBA.
3.3 PS-DR-DP model results
Over the two-decade period from 2002 to 2022, the GBA, comprising Hong Kong, Macao, and nine Guangdong cities, has shown dynamic and complex patterns of development in economic, social, and environmental aspects, as presented in Figure 5. Economically, urban clusters led by core cities like Guangzhou, Shenzhen, and Hong Kong have been the main drivers of positive economic indicator growth, with all such indicators surpassing the benchmark value of 1 by 2022. This reflects the vitality of the regional economy and the resource concentration effect. Moreover, the negative economic indicators of most cities, like resource consumption intensity and pollution-related indices, show a downward trend and fluctuate around the benchmark value of 1. However, in 2022, the negative economic indicators of Macao and Guangzhou exceeded the warning threshold of 1.5. These cities need to enhance resource utilization efficiency and pollution control capacity. In terms of social resource development, core cities like Guangzhou and Shenzhen have significantly improved social positive indicators by optimizing public service systems, reaching above 1.6 in 2022. With enhanced social equity and public security, negative social indicators have declined. However, non-core cities still lag behind core ones. To narrow this development gap, some regions need to boost social investment in education, healthcare, etc. Regarding the environment, the GBA’s overall environmental quality has improved due to ecological restoration and pollution control, with positive indicators rising, the highest reaching 1.83. Yet, highly urbanized areas like Dongguan and Foshan still face severe environmental pressure. Although there’s some improvement in negative environmental indicators in certain areas, they have not stably dropped to the ideal threshold (generally below 1). This shows that achieving dynamic balance between ecological protection and economic growth requires long-term coordinated efforts.
Figure 5
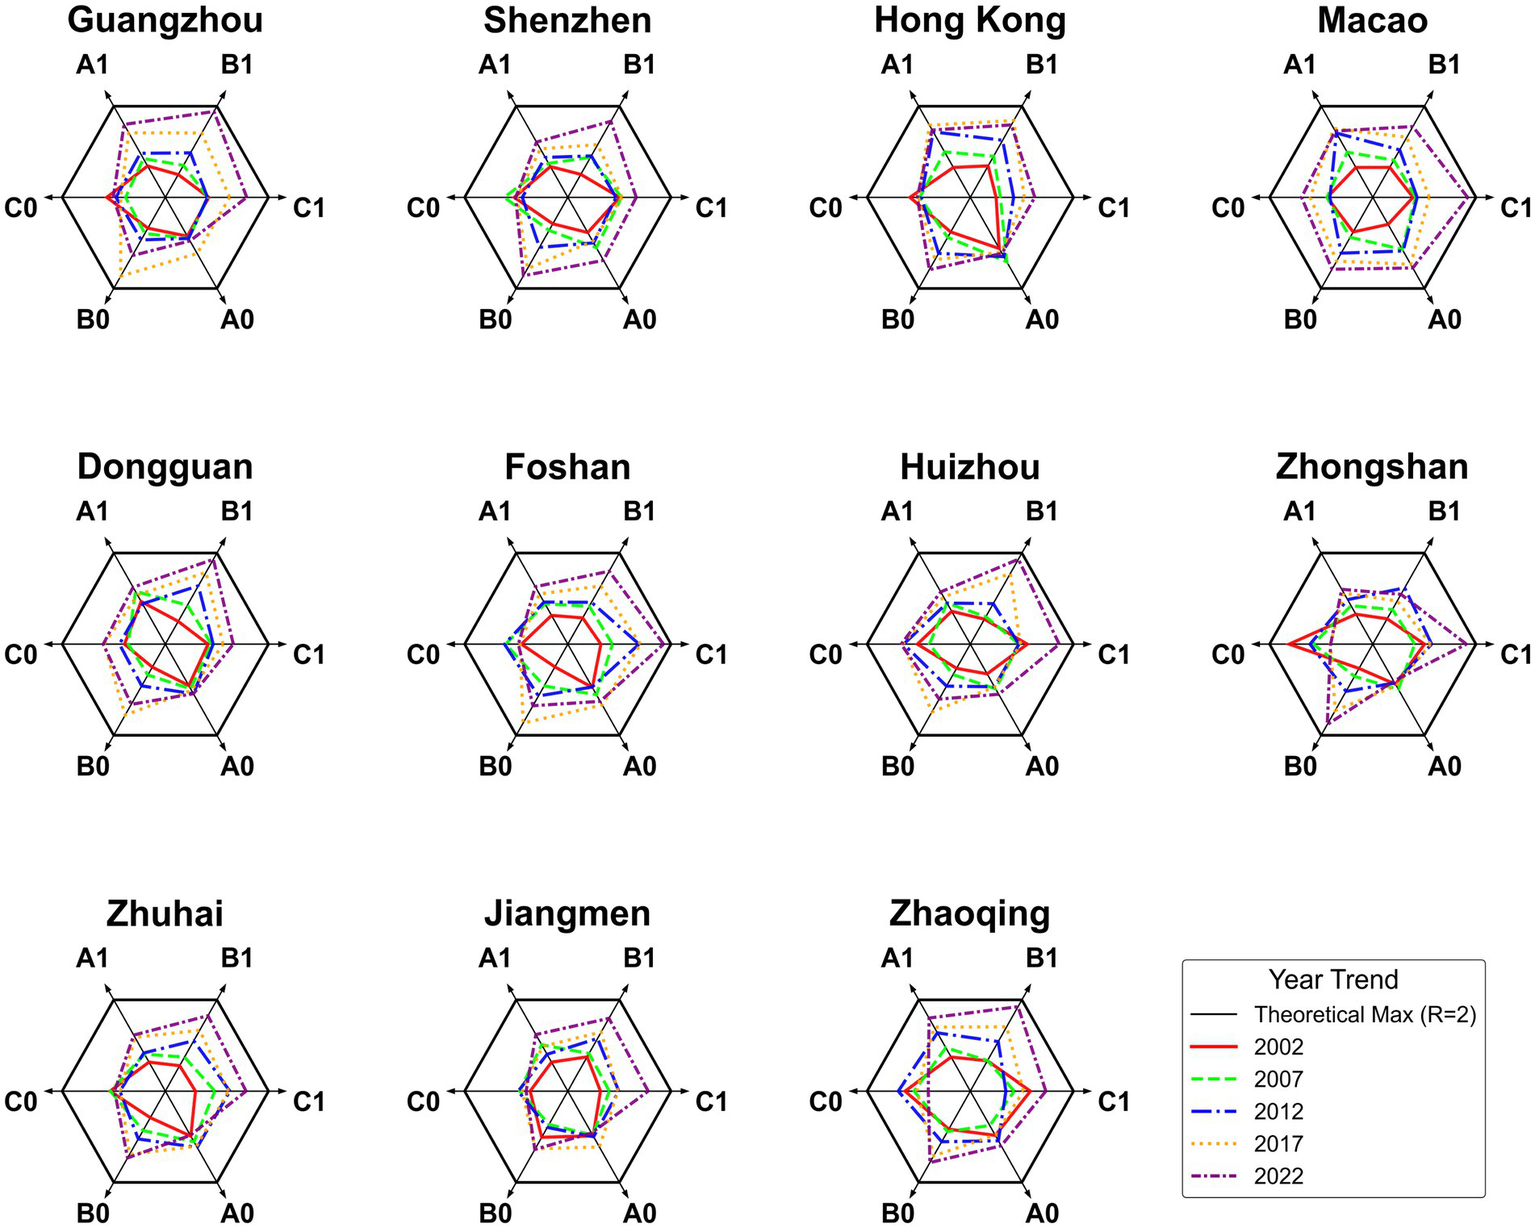
Dynamic changes of the PS-DR-DP model in the GBA over the past 20 years.
Based on the positive and negative subsystem calculations, the GBA’s land-space carrying state (S) from 2002 to 2022 showed dynamic changes (Figure 6). Except for Guangzhou in some years, the overall carrying state (S-value) in the GBA stayed above 0.6 and rose long-term, indicating continuous enhancement of the land-population carrying capacity over nearly 20 years. This improvement was driven by coordinated advances in regional economic development, urban construction, and management. These advances enhanced the region’s population accommodation potential and supported sustainable urban development. Significant differences existed in S-value changes among cities. Core cities with developed economies and industrial clusters (e.g., Guangzhou and Foshan) saw more remarkable capacity improvements. For instance, Guangzhou’s S-value rose from 1.03 in 2002 to 2.8 in 2022, a 172% increase, linked to economic expansion, industrial upgrading, and population agglomeration. In contrast, medium- and small-sized cities like Huizhou experienced greater S-value fluctuations. Huizhou’s S-value decreased from 1.07 in 2002 to 0.83 in 2021, then rebounded to 1.29 in 2022, reflecting the impact of weak industrial foundations and unstable population flows. Dongguan’s S-value fluctuated between 1.0 and 1.2 due to economic cycles, policy shifts, and population migration. Regarding the relationship between carrying-capacity status and the regression line, an S-value above the regression line suggests both positive and negative subsystem indicators are at low levels, indicating a low-level carrying-capacity state. In contrast, an S-value below the regression line implies the emergence of deep-seated contradictions in economic, social, and environmental resources. Notably, the rapid growth of some cities’ S-values (e.g., Guangzhou) shows that ongoing reform policies have effectively eased development constraints and unleashed regional potential. However, short-term fluctuations (e.g., in Huizhou and Dongguan) warn of potential population-land resource imbalances. It is recommended to set up dynamic monitoring mechanisms in land-use planning, and to optimize resource allocation and policy regulation based on carrying-capacity trends.
Figure 6
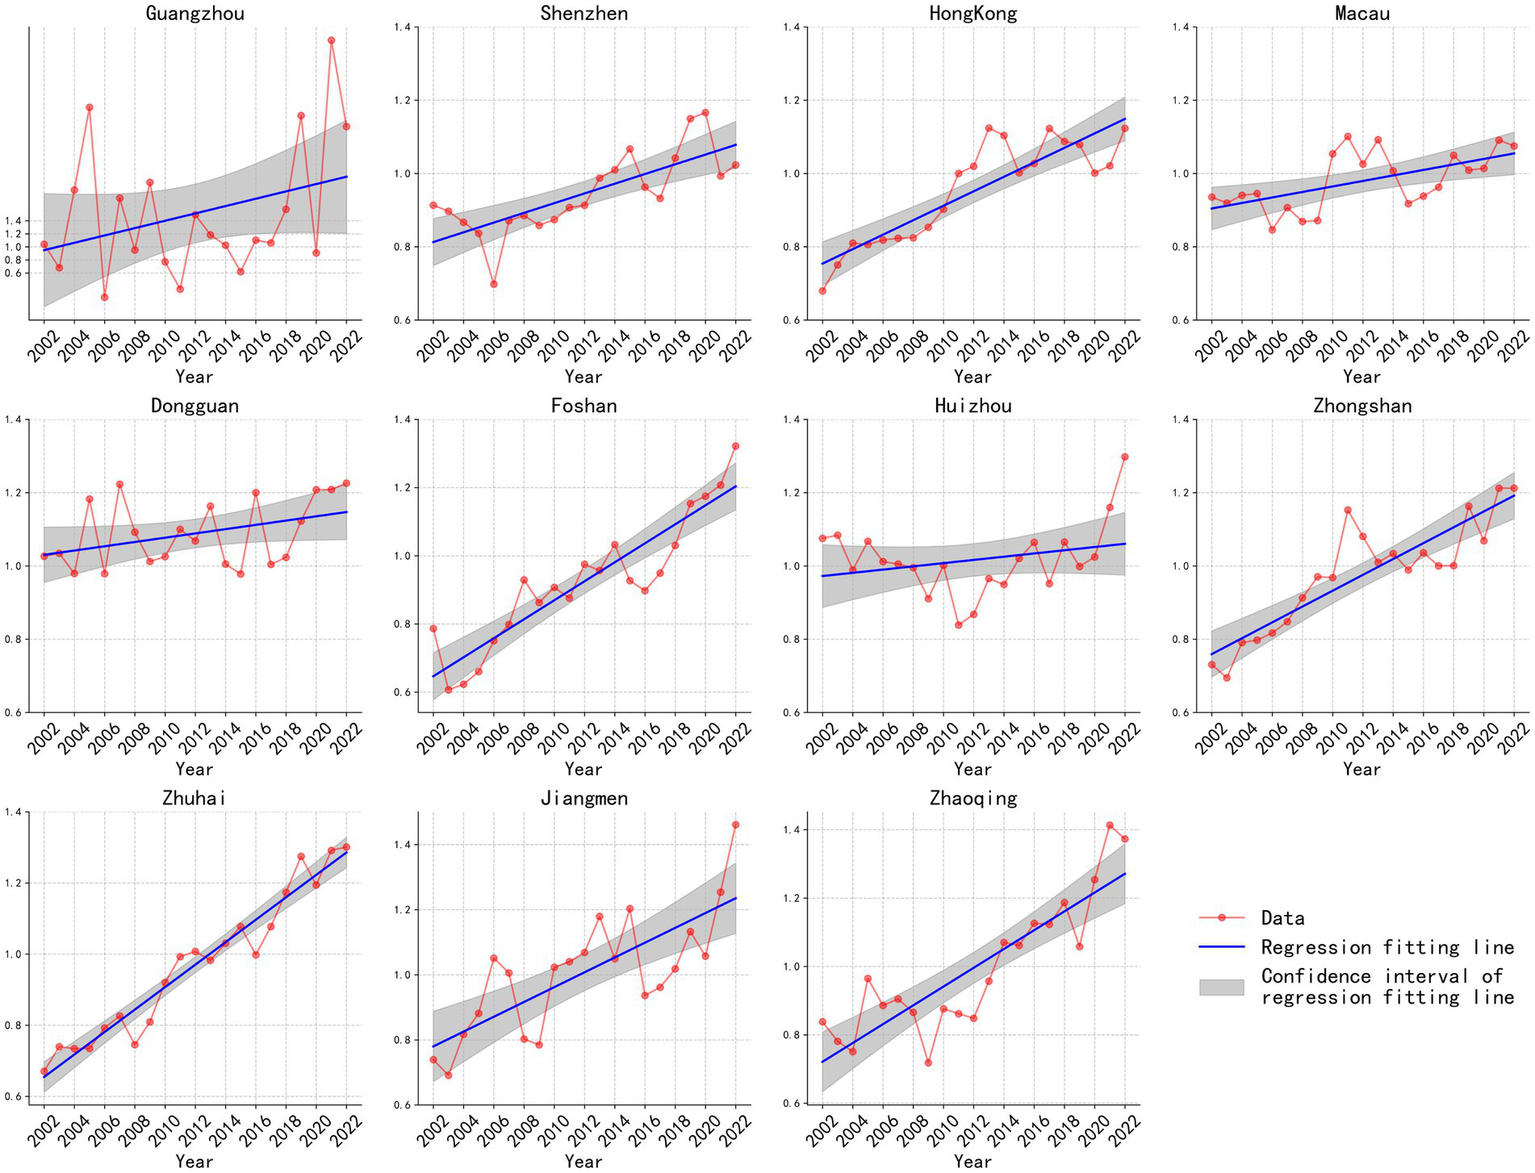
Trends of the land-population carrying state (S-value) for cities in the GBA from 2002 to 2022. The graphs show the data points, regression fitting line, and the confidence interval.
3.4 Spatial distribution and future prediction of national spatial carrying capacity status
Figure 7 shows the changes in the GBA’s land-population carrying state (S) from 2002 to 2022, calculated from the positive and negative subsystems. From 2002 to 2022, the GBA’s land-population carrying state showed gradual improvement. Between 2002 and 2007, most areas were in deep colors, indicating high land-carrying pressure. But over time, especially after 2012, colors lightened, showing overall improvement in the land-population carrying state. Core cities like Guangzhou and Shenzhen were in relatively deep colors throughout, showing continued carrying pressure. As regional economic centers, they attract population inflows, causing land resource tension. In contrast, peripheral cities like Foshan and Zhongshan had smooth color changes, gradually matching core cities’ colors. This shows their functional and industrial integration with core cities, jointly sharing carrying pressure. Over the past 20 years, the GBA’s land-population carrying state has improved significantly, reflecting progress in urban planning, resource allocation, and regional coordination. However, core cities like Guangzhou and Shenzhen still face high carrying pressure and need more policy support and resource optimization for sustainable development.
Figure 7
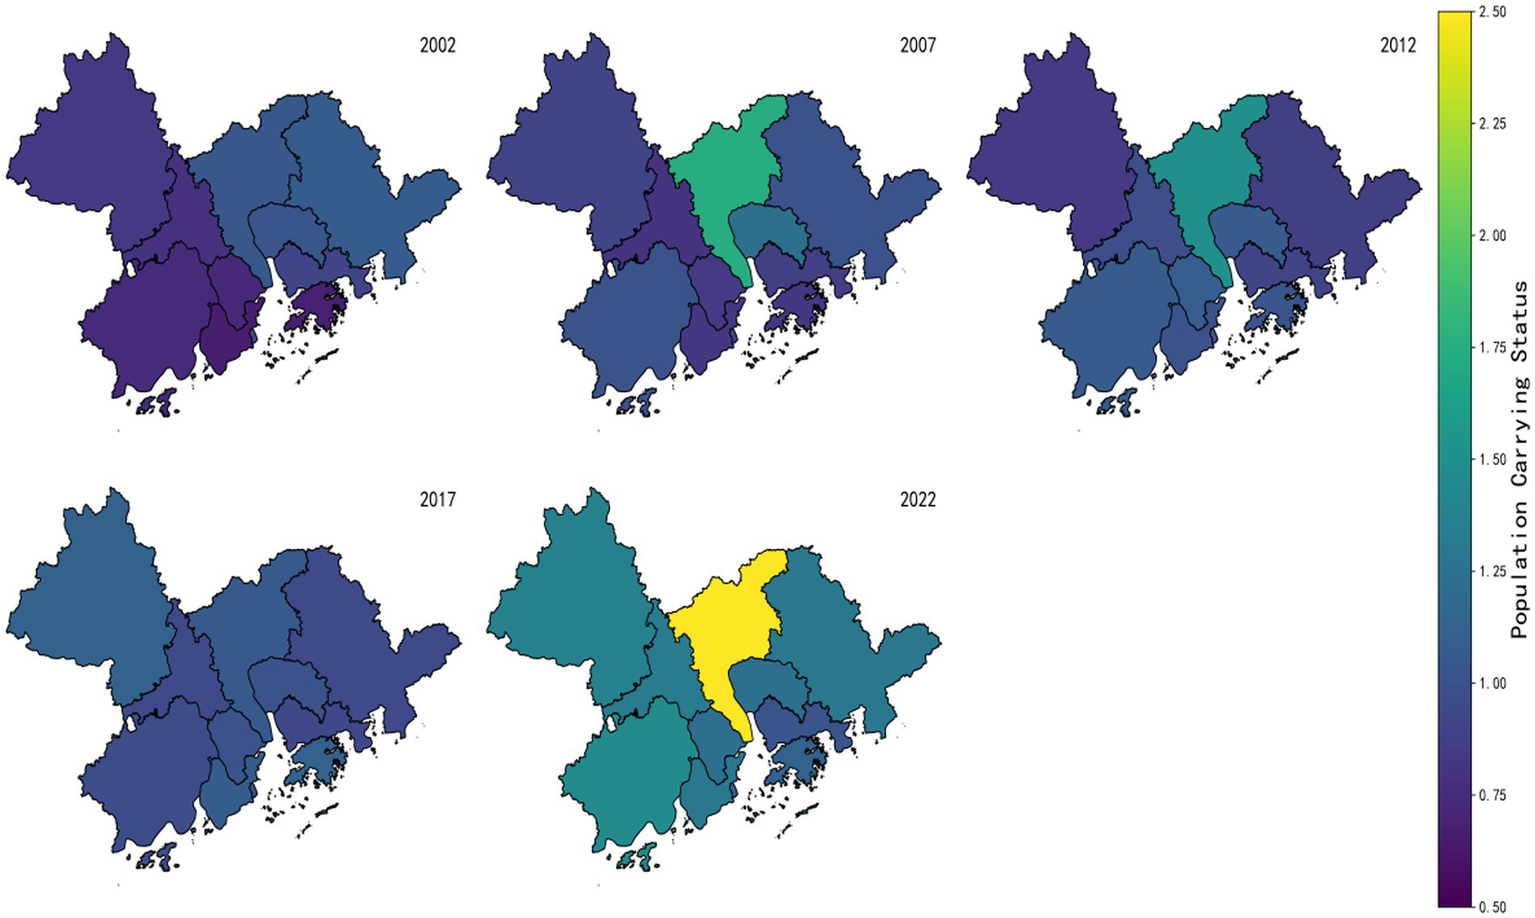
Changes in land and population carrying Status (S) in the GBA from 2002 to 2022.
The Markov-based state transition prediction simulation of the GBA’s future 20-year situation, it can be seen from Figure 8 that the overall stability of urban indicators in the GBA will be enhanced in the coming two decades, indicating that development within the region is gradually becoming more balanced. In 2027, the complex color distribution reflects significant differences in the development patterns and speeds of various cities at the initial stage. However, as time goes by, by 2042, colors tend to be uniform, showing that resource allocation within the region has become more rational, economic development levels are gradually converging, social inclusiveness is increasing, environmental protection measures are being implemented, and the overall situation is entering a relatively stable state. Despite the positive overall trend, there are still local fluctuations. For example, in 2037, the colors of some areas deepen, which may be due to challenges such as population growth and resource pressure faced by these regions. Nevertheless, with policy adjustments and the optimization of socio-economic structures, these problems have been alleviated, demonstrating the region’s dynamic adaptability and self-regulation ability in development. Among them, Guangzhou and Shenzhen, as regional economic growth poles, have a high concentration of population and economic activities, leading to greater carrying pressure in these areas. This reflects the attractiveness of core cities and their radiating and driving role on surrounding regions. Other surrounding cities, such as Foshan, Dongguan, Zhuhai, etc., integrate with core cities, forming complementarities in functions and industries. Together with core cities, they construct an organic whole of the GBA, thereby reducing the burden on core cities and promoting coordinated regional development.
Figure 8
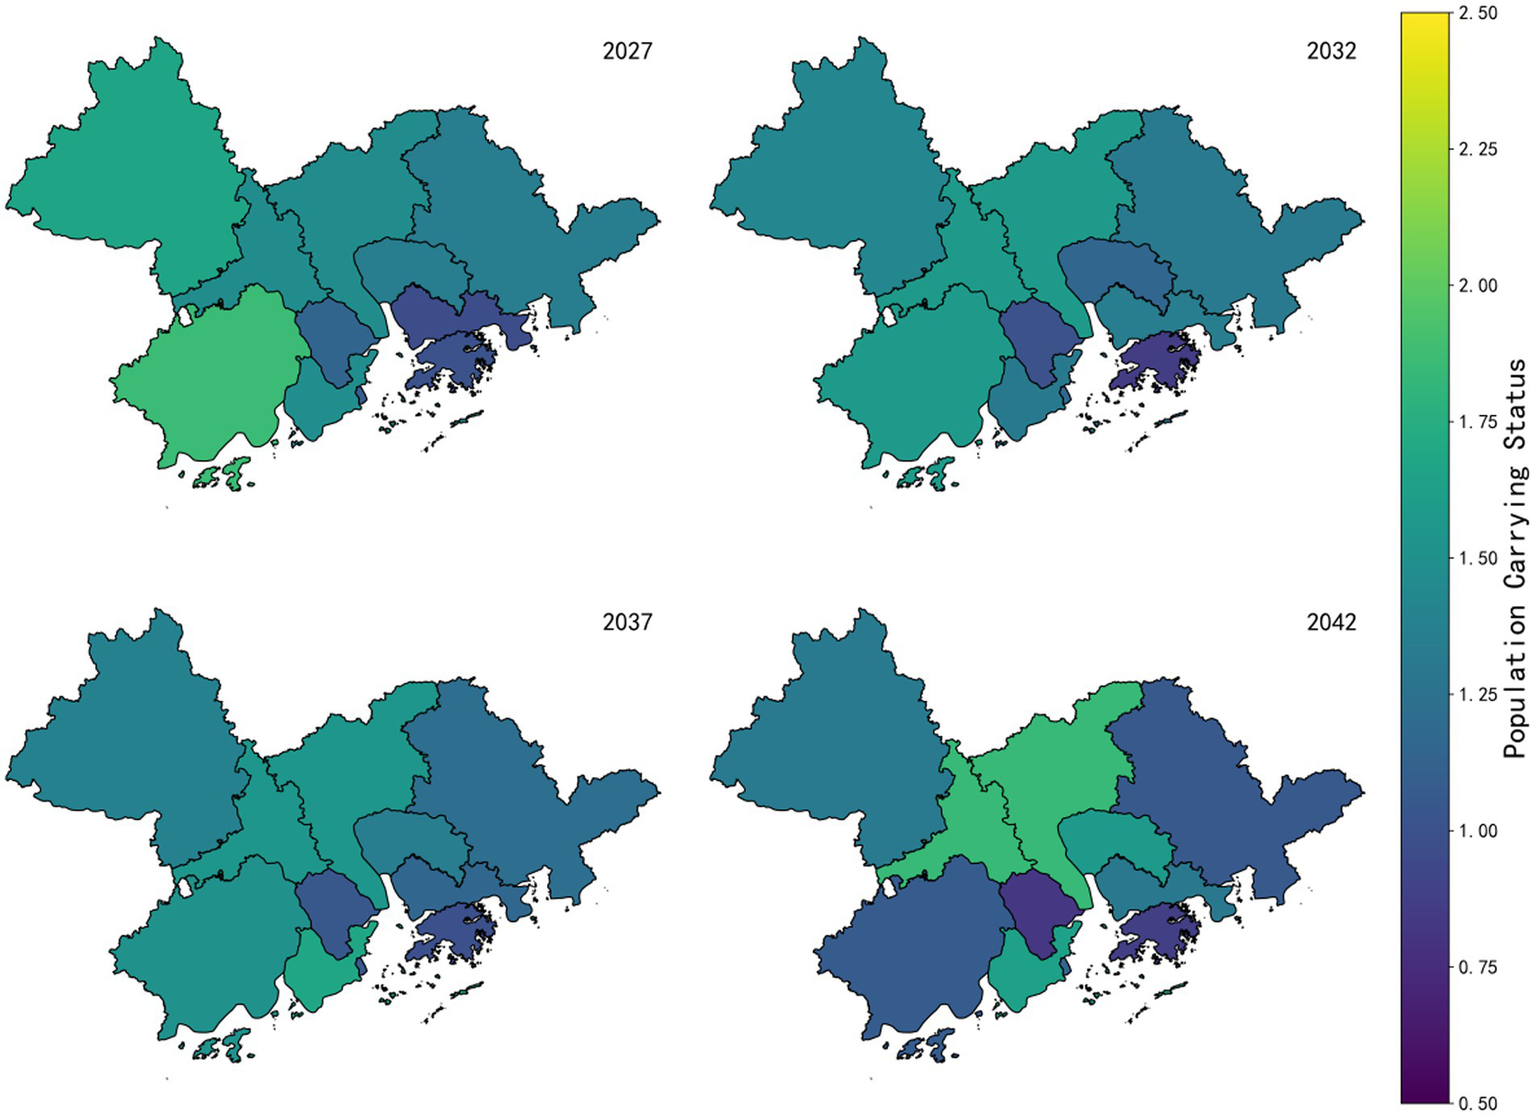
Changes in land and population carrying status (S) in the GBA from 2023 to 2042.
4 Policy recommendations
Drawing on the study’s findings regarding the spatiotemporal dynamics of land carrying capacity and the projected risks, this paper advances targeted, city-specific, and actionable policy recommendations designed to balance the “economic growth-social equity-ecological conservation” trilemma within the GBA.
4.1 Alleviating overload pressure in core cities through spatial restructuring
For core cities like Guangzhou and Shenzhen, which face sustained high carrying pressure and significant job-housing separation, policies must shift from simply accommodating growth to smartly managing it. A key strategy is to promote polycentric urban structures by accelerating the development of sub-centers in peripheral districts. This can be achieved by relocating specific municipal functions, large-scale public facilities, and corporate headquarters to these new hubs. This spatial restructuring should be tightly integrated with the implementation of Transit-Oriented Development (TOD), which mandates high-density, mixed-use development around major metro and rail transit stations. Together, these strategies can create vibrant, self-sufficient communities where residents can live, work, and access services without heavy reliance on private vehicles, directly addressing the job-housing mismatch. To ensure social equity and prevent the spatial mismatch from replicating, the approval of new industrial or commercial zones must be linked to the concurrent construction of affordable public housing and rental units in adjacent areas.
4.2 Balancing industrial upgrading with ecological redlines in industrial hubs
Industrial hubs such as Dongguan and Foshan face acute conflicts between rapid industrialization and environmental degradation, particularly the loss of basic farmland and high pollution loads. To address this, a multi-pronged approach is necessary. First, land use management must be strengthened by re-evaluating and adjusting industrial zoning to protect farmland. The conversion of designated basic farmland for industrial use should be prohibited, and a “zoning swap” policy could be implemented to allow industries on ecologically sensitive land to relocate to upgraded, high-density industrial parks with better pollution control infrastructure. Second, as a preventative measure, a “negative list” of high-pollution and high-water-consumption industries should be established to bar their entry into areas adjacent to ecological protection zones or high-quality farmland. Finally, to mitigate the impact of existing industries, the retrofitting of industrial parks should be mandated to promote a circular economy with closed-loop systems for water recycling, waste heat recovery, and industrial symbiosis, thereby reducing the overall negative environmental footprint (Negative Subsystem C0).
4.3 Leveraging ecological assets in peripheral cities through compensation mechanisms
Peripheral cities like Zhaoqing, Huizhou, and Jiangmen serve as the GBA’s ecological shields but show signs of lagging development. Policies should focus on converting their ecological advantages into sustainable economic ones. A formal cross-city ecological compensation mechanism should be instituted, where core cities provide dedicated funds to peripheral cities for protecting critical ecosystems such as forests and water sources. The funding could be linked to the value of the ecosystem services provided and the development constraints imposed by conservation. In parallel, instead of pursuing heavy industry, these cities should focus on developing high-value, low-impact industries like eco-tourism and wellness, which leverage their pristine natural environment to create sustainable livelihoods that are compatible with their conservation goals.
4.4 An adaptive governance framework for the entire GBA
To proactively manage the predicted “increase then decline” trajectory of carrying capacity and avoid the projected 2042 trough, a region-wide adaptive governance framework is essential. This framework would be centered on a GBA Land Carrying Capacity Monitoring Platform, which operationalizes the PS-DR-DP model developed in this study into a dynamic, real-time tool for policymakers. The platform would track the overall carrying state (S-value) and the six underlying forces for all cities. To make this tool actionable, predefined S-value thresholds should be established (e.g., a sustained S-value below 0.8 or a rapid decline of 15% in 2 years) that automatically trigger a mandatory review and adjustment of a city’s current land-use and industrial policies. This creates a crucial feedback loop for adaptive management, ensuring that regional planning remains flexible and responsive to emerging risks.
5 Discussion
This study combines the PS-DR-DP conceptual model, Monte Carlo simulation, and Markov state transition prediction. It deeply examines the dynamic changes in the human-land system carrying capacity, regional differences, and future risks of the GBA city cluster. Key findings reveal a complex “six-force” (PS-DR-DP subsystems) interaction network behind the S-value-based carrying capacity rise in the Bay Area. They also show how the “core-periphery” structure causes spatial heterogeneity. Notably, probabilistic predictions highlight the risk of a “first rise, then fall” inflection point.
5.1 The complex dynamical mechanisms and regional heterogeneity revealed by the PS-DR-DP model
The PS-DR-DP model developed in this study deconstructs carrying capacity into six-dimensional interacting forces, providing a novel perspective for understanding the complexity of the human-environment system in the GBA. As shown in Figures 5, 6, the steady improvement in the region’s overall carrying capacity (S-value) over the past two decades (>0.6 with an upward trend) has been primarily driven by robust contributions from the positive economic resource subsystem (e.g., GDP growth, increased per capita income) and positive social resource subsystem (e.g., enhanced public service investment). This increase in the S-value is closely correlated with tangible social outcomes. Taking Guangzhou as an example, its S-value increased by 172% between 2002 and 2022. This numerical change shows a strong correlation with significant improvements in the city’s public service sector during the same period (e.g., an increase in hospital beds per 10,000 people and an expansion of per capita paved road area), directly reflecting how the optimization of land-space utilization translates into substantial enhancements in residents’ quality of life. However, the model precisely captures significant internal disparities within this trend.
First, the core engine effect. As pivotal cities, Guangzhou, Shenzhen, and Hong Kong witnessed their positive economic indicators (e.g., GDP growth) being the first to exceed baseline values and maintain sustained leadership. However, accompanying high-intensity development, their negative economic indicators (e.g., resource consumption, pollution linkages) and negative social pressures (e.g., job-housing separation) were also the first to reach or surpass critical thresholds. For instance, Macao and Guangzhou recorded negative economic indicators exceeding 1.5 in 2022, highlighting the substantial resource, environmental, and social costs embedded within this growth trajectory.
Second is the fluctuation and lag in the periphery. Cities on the periphery such as Huizhou and Jiangmen experience significant fluctuations in their S values. The positive indicators of their social resources have relatively lagged in improvement, and the negative environmental indicators have shown limited improvement. This reflects the greater challenges that non-core areas face in attracting high-quality resources and balancing development with conservation. Furthermore, the lower Cronbach’s α values observed in peripheral cities like Huizhou and Jiangmen (Figure 4, Table 2) warrant specific attention. This statistical instability may not only reflect data collection inconsistencies but, more importantly, signal an underlying structural vulnerability. Unlike the diversified and resilient economies of core cities, the economic and social systems in peripheral areas may be less complex and more susceptible to shocks, leading to less stable relationships among indicators. This highlights a regional equity challenge, suggesting that a “one-size-fits-all” policy approach is inadequate. Targeted policies are needed to bolster the economic diversification and data governance capacity of peripheral cities to ensure balanced and sustainable regional development. This regional heterogeneity is deeply rooted in the “core-periphery” spatial structure of the GBA, as well as its industrial division of labor and the imbalance in resource allocation. The PS-DR-DP model’s differentiation between “destructiveness-resilience” (DR) and “degradability-promotiveness” (DP) particularly highlights the arduous task faced by fast-industrializing cities like Dongguan and Foshan. They struggle to make their resilience and promotiveness catch up with destructiveness and degradability. This is crucial for assessing regional resilience. Compared with the classic PSR model, the PS-DR-DP model has advantages in depicting the complex feedback mechanisms and warning of specific-dimension issues (such as exceeding limits in a certain negative force) in multi-dimensional, high-intensity, and fast-changing regions like the GBA. Its “hexagon” visualization also more intuitively reveals system balance.
5.2 The early warning significance and uncertainty management of Markov state transition prediction
This study’s most cautionary finding is the Markov state transition prediction of urban carrying capacity showing a “first rise then fall” trajectory (Figure 8). Projections show that the S value (a comprehensive indicator of urban sustainable development capacity) of most cities will peak around 2027, with some even exceeding 2. But it will then drop significantly, possibly causing the regional average to fall to about 0.5 by 2042. This inflection point projection is highly significant for policy-making. The upward trend before 2027 is mainly due to the continuation of current development momentum. This includes the spillover effects of major infrastructure projects (e.g., the Hong Kong-Zhuhai-Macao Bridge), the dividends of innovative industrial policies, and the potential for continued population and economic agglomeration. The model captures the cumulative effect of these positive factors, driving short-term carrying capacity growth. The projected decline after the peak, however, signals the combined effect of multiple long-term pressures, which our sensitivity analysis identified as critical drivers.
Firstly, resource and environmental constraints are becoming rigid. Decades of rapid urbanization, characterized by a 3.2% annual expansion of construction land and shrinkage of ecological spaces like mangroves (down by 18%), suggest that natural capital such as land, water, and environmental capacity may approach saturation thresholds, making further growth unsustainable without significant technological or policy breakthroughs. Secondly, social costs continue to accumulate, and structural contradictions are becoming increasingly prominent. The decline in carrying capacity that we forecast indicates long-term social risks. Long-standing issues such as job-housing separation (index at 1.32), high housing costs in core areas, and insufficient public services in peripheral regions will further undermine the long-term attractiveness of the area and affect social stability. Specifically, persistent land resource constraints in core areas are likely to continue driving up housing and living costs, exacerbating the “job-housing mismatch” phenomenon. At the same time, due to sluggish growth in the S-value, peripheral cities face challenges in providing adequate public services. This not only weakens the overall appeal and social stability of the region but may also entrench issues of spatial justice, posing long-term challenges to coordinated regional development, potentially leading to population outflow or slower growth. Thirdly, economic transformation brings risks and diminishing marginal benefits. As the dividends from the traditional factor-input growth model weaken, the transition to a high-quality, innovation-driven economy is fraught with uncertainty. A slowdown in key industries or a failure to successfully transition could directly impact the economic resource subsystem, triggering a decline in the overall carrying capacity.
The core value of Monte Carlo simulation lies in quantifying the uncertainty of these predictions. Through sensitivity analysis (as shown in the added “Sensitivity Analysis Figure”), it reveals the high sensitivity of prediction results to key parameters such as future GDP growth, resource-efficiency improvement from technological progress, and inter-regional population-flow scale. The model itself, for instance, state-transition-probability estimation and the GM (1,1) extrapolation method, also introduces some uncertainty. The “overall stability with local fluctuations” phenomenon shown in Figure 8 partly reflects partial convergence of later-stage simulation paths. This suggests decision-makers should focus on the prediction interval, not just the mean value. Therefore, planning needs enough flexibility to handle various possible scenarios.
5.3 Policy implications for spatial planning and regional governance
This study offers scientific support and early warnings to resolve the GBA’s “economic growth-social equity-ecological conservation” trilemma. To achieve this, precise interventions are needed to balance the “six forces.” This involves boosting positive forces (PS, and the promotion force in DP), with a focus on increasing social resource investment and enhancing the environment in peripheral cities (e.g., via ecological restoration and green infrastructure). Meanwhile, strict restrictions should be imposed on factors that negatively impact the environment and society. For instance, set stricter control targets and establish incentive mechanisms for economic negative indicators that have exceeded warnings (such as resource consumption intensity), like carbon emission trading and resource taxation.
To enhance regional resilience against the decline risk after 2027, planning needs early deployment. Specific measures involve optimizing land resource allocation. This means strictly controlling new construction land, promoting the redevelopment of existing and under-performing land, and prioritizing the protection of ecological and high-quality agricultural spaces. Accelerating industrial-structure upgrading and the clean-production process is also crucial. This can be done by improving energy and resource-utilization efficiency and developing a circular economy. To ease job-residence separation and regional disparities, it is necessary to enhance rail-transit systems, offer more affordable housing, and promote equitable public services. Moreover, implementing ecological-protection red lines and restoring key ecosystems like mangroves and water sources can boost ecosystem resilience and service functions.
Moreover, it is crucial to establish a dynamic monitoring, early-warning, and scenario-simulation platform based on the PS-DR-DP evaluation framework and Monte Carlo model developed in this study. The platform can serve the planning decisions for the GBA. It can also be further developed to include policy-scenario simulation functions. In this way, it can quantitatively assess the impacts of different policy mixes (such as ecological-protection policies of varying intensities, industrial-dispersal plans, and infrastructure-investment programs) on the “six forces” and the trajectory of the S value. Thus, it can achieve closed-loop management from early warning to assessment and then to optimization. All of this is based on the unification and sharing of data standards across the Guangdong-Hong Kong-Macao regions. This ensures information flow and data accuracy, providing solid support for scientific decision-making.
5.4 Research limitations and future directions
While this study has made theoretical and practical progress, it still has several methodological and practical limitations that need further exploration and improvement.
First, the model results demonstrate a certain degree of sensitivity to indicator weights. Although the PS-DR-DP model in this study determines the contribution of each subsystem through specific algorithms (such as principles of combinatorial mathematics), the final carrying state (S-value) remains sensitive to the selection of initial indicators and their weight allocation. While internal consistency of the indicator system was ensured using Cronbach’s α coefficient, a systematic sensitivity analysis was not conducted to examine the robustness of final predictions (such as the inflection point expected in 2027) under different weighting schemes. Future research should incorporate more weight determination methods (e.g., a combined AHP-entropy weight approach) and carry out parameter sensitivity tests to enhance the reliability of the conclusions. Secondly, the integration of cross-regional data faces challenges arising from inconsistencies in statistical standards. This study combines data from Guangdong, Hong Kong, and Macao, yet significant differences exist among Hong Kong, Macao, and mainland China in terms of statistical criteria, data collection frequency, and indicator definitions (for example, the specific definitions of “greening coverage rate of built-up areas” or “urban registered unemployed population” may vary). These discrepancies pose difficulties in constructing a fully consistent long-term time-series dataset, potentially introducing systematic biases that may affect the precision of the evaluation results. Future research should focus on promoting data standardization across the three regions and exploring the integration of multi-source and heterogeneous big data. For instance, remote-sensing images, mobile-phone signaling data, and social-media information can be used to develop a more comprehensive and compound indicator system. This will enhance the model’s explanatory and predictive power.
In terms of model mechanisms, the interactions among the “six forces” in the current PS-DR-DP model are still simplified, without fully incorporating complex mechanisms like nonlinear feedback. Meanwhile, the future state predictions of the Markov model are primarily based on the extrapolation of historical trends, making it difficult to fully simulate the complex institutional background of the GBA (e.g., Hong Kong and Macao’s special policies, land-management differences) and the behaviors of diverse stakeholders (governments, enterprises, residents). To address these issues, future work could integrate Multi-Agent Systems (MAS) into the model framework. This will more realisticly simulate the micro-decision-making processes of different stakeholders and their macro-level spatial emergence effects.
Finally, this study does not adequately account for the impacts of extreme scenarios such as climate change. As a typical coastal mega-urban agglomeration, the Greater Bay Area is highly vulnerable to climate change events, including sea-level rise, frequent typhoons, and extreme heat. The current forecasting model, which is based on historical data trends, does not explicitly incorporate different climate change scenarios (e.g., RCP pathways from IPCC reports) into its simulations. This limitation restricts our ability to assess the resilience of land space suitability in the Greater Bay Area under future extreme stressors. Future efforts should focus on enhancing the model’s adaptability to uncertainties and expanding its simulation of extreme scenarios to boost its practical value in emergency management and strategic planning.
Regarding scale-related issues, this study mainly focuses on municipal-level analysis. How to effectively connect the research results to finer-grained district/county or community scales, and how to link them to the broader context of the GBA, national strategies, and even global development require further exploration. Future research should strengthen the study of scale-transformation methods and optimize parameter-adjustment strategies. This will enable model results to better serve multi-level and multi-dimensional spatial governance and development planning.
6 Conclusion
This paper uses Monte Carlo and Markov state transition prediction models. It builds a multi-factor land-space suitability evaluation system that integrates economic, social, and environmental dimensions. This system is applied to the GBA. From six angles (positive and negative aspects of economic, social, and environmental resources), it builds an index system reflecting the multi-factor coupling and constraints of land population-carrying capacity. After verifying with Cronbach’s α coefficient, the results show that the α coefficients of cities and index systems in all dimensions are mostly over 0.7, indicating the system is reliable and stable. It can filter out subjectivity and objectively show the actual land population-carrying capacity in the region.
Based on the PS-DR-DP hexagonal interaction model, this paper analyzes the dynamic changes in land population-carrying capacity in the GBA from 2002 to 2022. Core cities like Guangzhou, Shenzhen, and Hong Kong saw their economic positive indicators surpass the benchmark 1 in 2022, showing strong development vitality and agglomeration effects. Most cities’ economic negative indicators declined and fluctuated near 1, yet some cities’ negative indicators went beyond the warning level of 1.5, reflecting ongoing management pressure. In 2022, the social positive indicators of core cities jumped to above 1.6, driven by the optimized public service system, which advanced regional social equity and security. The social negative indicators dropped overall. However, non-core cities still lag behind core cities, with some areas needing more investment to bridge the development gap. From the environmental perspective, the Bay Area’s overall environmental quality has improved, with positive indicators rising, peaking at 1.83. Yet, in highly urbanized areas, environmental pressure remains high. Although negative indicators have locally improved, they have not stably fallen to the ideal level (below 1), indicating that balancing ecological protection and economic growth is a long-term task. Overall, the land-space carrying capacity in the Bay Area has stayed above 0.6 and risen in recent years. Over the past two decades, the land’s population-carrying capacity has strengthened. Regional economic development, urban construction, and management have continuously improved, strongly supporting the sustainable development goals.
To enhance the predictive ability regarding future land-population carrying capacity trends, this paper introduces the Monte Carlo model. It compensates for traditional models’ deficiencies in handling uncertainties. Also, it conducts Markov state-transition prediction on the GBA’s land-population carrying capacity from 2023 to 2042. The prediction shows that by 2027, most areas in the Bay Area will have a land-space carrying capacity of over 1, with some cities even reaching 2. However, over time, despite some cities’ improved carrying capacity, the overall capacity of the Bay Area is expected to decline to around 0.5. Therefore, it is recommended to formulate flexible land-use planning schemes based on the changing carrying capacity and establish a regular evaluation and dynamic adjustment mechanism to handle potential risks.
In summary, the research method proposed in this paper can scientifically and systematically show the dynamic trends of land population-carrying capacity in the GBA over the next two decades. It also greatly improves the accuracy and scientific nature of land-use planning. The research findings offer policymakers solid data support and a theoretical basis, comprehensively aiding the GBA in achieving its long-term goals of high-quality and sustainable development.
Statements
Data availability statement
The original contributions presented in the study are included in the article/supplementary material, further inquiries can be directed to the corresponding author.
Author contributions
CL: Conceptualization, Funding acquisition, Supervision, Writing – review & editing. XL: Data curation, Formal analysis, Investigation, Methodology, Software, Validation, Visualization, Writing – original draft. BS: Data curation, Investigation, Resources, Writing – review & editing. KW: Project administration, Resources, Writing – review & editing. ZZ: Data curation, Formal analysis, Software, Validation, Visualization, Writing – review & editing. CY: Conceptualization, Project administration, Supervision, Writing – review & editing.
Funding
The author(s) declare that financial support was received for the research and/or publication of this article. This research was funded by Guangdong Philosophy and Social Sciences Planning Project (No. GD23XGL081), Student Innovation and Entrepreneurship Training Program (No. X202413667110 and X202513667091) and Guangdong Basic and Applied Basic Research Foundation (No. 2024A1515010039 and 2023A1515110472).
Conflict of interest
The authors declare that the research was conducted in the absence of any commercial or financial relationships that could be construed as a potential conflict of interest.
Generative AI statement
The authors declare that no Gen AI was used in the creation of this manuscript.
Any alternative text (alt text) provided alongside figures in this article has been generated by Frontiers with the support of artificial intelligence and reasonable efforts have been made to ensure accuracy, including review by the authors wherever possible. If you identify any issues, please contact us.
Publisher’s note
All claims expressed in this article are solely those of the authors and do not necessarily represent those of their affiliated organizations, or those of the publisher, the editors and the reviewers. Any product that may be evaluated in this article, or claim that may be made by its manufacturer, is not guaranteed or endorsed by the publisher.
Footnotes
References
1
Ahmad N. Alias F. A. Hamat M. Mohamed S. A. (2024) 'Reliability analysis: application of Cronbach’s alpha in research instruments', Proceedings of the pioneering the future: delving into E-learning’s landscape, virtual, p. 114.
2
Alexandrou G. Chatzittofis A. Karanikola M. Sokratous S. (2023) 'Reliability and validity of the full-length Greek-Cypriot version of the children's depression inventory 2 (CDI-2)', in Proceedings of the WPA World Congress of Psychiatry Virtual, 28–31, 2023.
3
Azabdaftari A. Sunar F. (2024). Predicting urban tomorrow: CA-Markov modeling and district evolution. Earth Sci. Inform.17, 3215–3232. doi: 10.1007/s12145-024-01340-4
4
Batty M. (2013). The new science of cities. Cambridge, MA: MIT Press.
5
Chen Y. Xu M. (2021). The role of the Greater Bay Area in China's regional integration: challenges and opportunities. J. Chin. Econ. Bus Stud.19, 245–261.
6
Chen J. Zhang C. Huang B. Liu Y. Li X. Wu J. et al . (2022). High-performance computing for geospatial big data: challenges and opportunities. Int. J. Geogr. Inf. Sci.36, 1075–1098. doi: 10.1080/13658816.2021.2005533
7
Collins M. G. Steiner F. R. Rushman M. J. (2001). Land-use suitability analysis in the United States: historical development and promising technological achievements. Environ. Manag.28, 611–621. doi: 10.1007/s002670010247
8
Dong Y. Xu L. (2019). Theoretical and empirical study of a bidirectional composite dynamic evaluation method of urban comprehensive carrying capacity. Acta Sci. Circumst.39, 3171–3179. doi: 10.13671/j.hjkxxb.2019.0118
9
Duan J. (2024). Theory of urban space development. Singapore: Springer.
10
European Environment Agency (2007). Europe's environment: The fourth assessment. Copenhagen: European Environment Agency.
11
Fan X. Cheng Y. Li Y. (2023). Multi-scenario land use simulation and land use conflict assessment based on the CLUMondo model: a case study of Liyang, China. Land12:917. doi: 10.3390/land12040917
12
FAO (1976). A framework for land evaluation. Rome: Food and Agriculture Organization.
13
Folke C. (2016). Resilience (republished). Ecol. Soc.21:44. doi: 10.5751/ES-09088-210444
14
Hu L. Xi Y. (2023). Evaluation of effective factors in achieving ecological city in the direction of sustainable development. Sustainability15:7006 (in Chinese). doi: 10.3390/su15087006
15
Hu P. Li F. Sun X. Liu Y. Chen X. Hu D. (2021). Assessment of land-use/cover changes and its ecological effect in Pearl River Delta urban agglomeration, China. Sustainability13:5075. doi: 10.3390/su13095075
16
Jamroz B. F. Williams D. F. (2020). Consistency in Monte Carlo uncertainty analyses. Metrologia57:065008. doi: 10.1088/1681-7575/aba5aa
17
Kang J. Fang L. Li S. Wang X. (2019). Parallel cellular automata Markov model for land use change prediction over MapReduce framework. ISPRS Int. J. Geo Inf.8:454. doi: 10.3390/ijgi8100454
18
Li M. Li B. Feng Q. Wang Y. (2024). A new approach to land-use simulation that integrates macro- and microspatial characteristics: a case study of Wuhan, China. J. Geogr. Sci.34, 2003–2027. doi: 10.1007/s11442-024-2127-0
19
Li J. Xia F. Yang D. Huo J. (2024). Comprehensive evaluation of water resource carrying capacity in Northwest China. Water17:67. doi: 10.3390/w17010067
20
Li X. Yeh A. G. O. Liu X. et al . (2018). A Bayesian network approach for modelling land-use decisions under uncertainty. Landsc. Urban Plan.177, 134–147. doi: 10.1016/j.landurbplan.2018.04.008
21
Li X. Zhou Y. Tong X. (2021). Planning regional integration in the Greater Bay Area: a spatial governance perspective. Cities115:103245.
22
Ligmann-Zielinska A. Jankowski P. (2014). Spatially-explicit integrated uncertainty and sensitivity analysis of criteria weights in multicriteria land suitability evaluation. Environ. Model. Softw.57, 235–247. doi: 10.1016/j.envsoft.2014.03.007
23
Liu Y. Ji J. Zhang Y. F. Yang Y. (2020). Economic resilience and spatial divergence in the Guangdong-Hong Kong-Macao Greater Bay Area in China. Geogr. Res.39, 2029–2043.
24
Ma Y. Xue F. Yang Z. (2022). Coupling study on territory-space suitability evaluation and construction land expansion simulation: a case study of Jiangxi province, China. Environ. Dev. Sustain.25, 8279–8298. doi: 10.1007/s10668-022-02399-z
25
McHarg I. L. (1969). Design with nature. New York: Natural History Press.
26
Ni B. Wei S. (2024). Research on urban land suitability evaluation based on GIS—a case study of Xi'an City. Int. J. Glob. Econ. Manag.2, 65–73. doi: 10.62051/ijgem.v2n2.09
27
Radermacher W. J. (2021). Guidelines on indicator methodology: a mission impossible?Stat. J. IAOS37, 205–217. doi: 10.3233/SJI-200724
28
Ratick S. Schwarz G. (2009). “Monte Carlo simulation” in International encyclopedia of human geography. eds. RKitchinNThrift (Amsterdam: Elsevier), 175–184.
29
Rockström J. Steffen W. Noone K. Radermacher W. J. (2009). Planetary boundaries: exploring the safe operating space for humanity. Ecol. Soc.14:32. doi: 10.5751/ES-03180-140232
30
Steiner F. McSherry L. Cohen J. (2000). Land suitability analysis for the upper Gila River watershed. Landsc. Urban Plan.50, 199–214. doi: 10.1016/S0169-2046(00)00093-1
31
Sun F. Dong C. Zhao L. Chen J. Wang L. Jiang R. et al . (2025). Spatiotemporal variation and influencing factors of ecological quality in the Guangdong-Hong Kong-Macao Greater Bay Area based on the unified remote sensing ecological index over the past 30 years. Land14:1117. doi: 10.3390/land14051117
32
Tariq A. Mumtaz F. (2023). A series of spatio-temporal analyses and predicting modeling of land use and land cover changes using an integrated Markov chain and cellular automata models. Environ. Sci. Pollut. Res.30, 47470–47484. doi: 10.1007/s11356-023-25722-1
33
Turner B. L. II . (2010). Vulnerability and resilience: coalescing or paralleling approaches for sustainability science. Glob. Environ. Chang.20, 570–576. doi: 10.1016/j.gloenvcha.2010.07.003
34
United Nations (2015). Transforming our world: The 2030 agenda for sustainable development. New York: United Nations.
35
van Vliet J. Hagen-Zanker A. Hurkens J. van Delden H. (2013). A fuzzy set approach to assess the predictive accuracy of land use simulations. Ecol. Model.261, 32–42. doi: 10.1016/j.ecolmodel.2013.03.019
36
Wang L. Liu H. (2019) Comprehensive evaluation of regional resources and environmental carrying capacity using a PS-DR-DP theoretical model, J. Geogr. Sci., 29, pp. 363–376. doi: 10.1007/s11442-019-1603-4
37
Weng Z. Zhou J. Zhan Z. (2022). Reliability evaluation of standalone microgrid based on sequential Monte Carlo simulation method. Energies15:6706. doi: 10.3390/en15186706
38
Wu L. (2002). Introduction to the science of human settlements. Beijing: China Architecture & Building Press.
39
Wu W. P. Hu Z. C. Song Y. H. (2018). Optimal sizing of energy storage system for wind farms combining stochastic programming and sequential Monte Carlo simulation. Proceed. CSEE38, 2300–2308. doi: 10.13334/j.0258-8013.pcsee.171140
40
Wu D. Ning S. (2018). Dynamic assessment of urban economy-environment-energy system using system dynamics model: a case study in Beijing. Environ. Res.164, 70–84. doi: 10.1016/j.envres.2018.01.029
41
Xinxin X. (2024). Research on the evaluation of water resources carrying capacity in the Central Plains urban agglomeration based on the PS-DR-DP model. Eng. Technol. J.9, 100–110. doi: 10.47191/etj/v9i08.40
42
Yang J. Ma H. Chen L. (2023). Spatial evolution and governance transformation of cross-border regions in institutional transition: A case study of the Tokyo Bay. Buildings13:2091. doi: 10.3390/buildings13082091
43
Ying C. Yang Y. Liu Y. (2022). Analysis of the marine resource environmental carrying capacity in Zhejiang Province based on the PS-DR-DP model. Front. Mar. Sci.9:1023769. doi: 10.3389/fmars.2022.1023769
44
Yu S. Yang L. Song Z. Li W. Ye Y. Liu B. (2023). Measurement of land ecological security in the middle and lower reaches of the Yangtze River based on the PSR model. Sustainability15:14098. doi: 10.3390/su151914098
45
Zeng C. Liu Y. Wu F. (2020). Urban land expansion and spatial restructuring in the Pearl River Delta, China. Land Use Policy95:104634.
46
Zhang J. Liu Y. Wu K. (2022). Measuring ecological security and spatial conflicts in the Guangdong-Hong Kong-Macao Greater Bay Area. Ecol. Indic.137:108702.
47
Zhang Z. Ou G. Elshkaki A. Liu R. (2022). Evaluation of regional carrying capacity under economic-social-resource-environment complex system: a case study of the Yangtze River Economic Belt. Sustainability14:7117. doi: 10.3390/su14127117
48
Zhao X. B. Qiang W. Huang W. H. Xian S. (2018). Theoretical framework and development strategy of the Guangdong-Hong Kong-Macao Greater Bay Area. Prog. Geogr.37, 1597–1608.
49
Zhao Y. Wang Y. Wang Y. (2021). Comprehensive evaluation and influencing factors of urban agglomeration water resources carrying capacity. J. Clean. Prod.288:125097. doi: 10.1016/j.jclepro.2020.125097
50
Zhong J. Chen Z. (2025). Assessing the riparian squeeze in the Greater Bay Area based on multisource data. J. Hydroinf.27, 178–191. doi: 10.2166/hydro.2025.148
51
Zhou X. Chen X. Zhang T. (2016). Impact of megacity jobs-housing spatial mismatch on commuting behaviors: a case study on central districts of Shanghai, China. Sustainability8:122. doi: 10.3390/su8020122
52
Zhu L. Wang C. Huang N. Fu Y. Yan Z. (2022). Developing an indicator system to monitor city's sustainability integrated local governance: a case study of Zhangjiakou. Sustainability14:5047. doi: 10.3390/su14095047
Summary
Keywords
Monte Carlo model, Guangdong-Hong Kong-Macao Greater Bay Area (GBA), evaluation of land spatial suitability, Markov model, PS-DR-DP model
Citation
Li C, Li X, Sun B, Weng K, Zhan Z and Yang C (2025) Evaluation of land spatial suitability in the Guangdong-Hong Kong-Macao Greater Bay Area. Front. Sustain. Cities 7:1676983. doi: 10.3389/frsc.2025.1676983
Received
03 August 2025
Accepted
10 October 2025
Published
28 October 2025
Volume
7 - 2025
Edited by
Chaozheng Zhang, Hunan Agricultural University, China
Reviewed by
Bwalya Mutale, Kapasa Makasa University, Zambia
Nguyen Tran Tuan, National Economics University, Vietnam
Jiawei Liu, Lanzhou University, China
Updates
Copyright
© 2025 Li, Li, Sun, Weng, Zhan and Yang.
This is an open-access article distributed under the terms of the Creative Commons Attribution License (CC BY). The use, distribution or reproduction in other forums is permitted, provided the original author(s) and the copyright owner(s) are credited and that the original publication in this journal is cited, in accordance with accepted academic practice. No use, distribution or reproduction is permitted which does not comply with these terms.
*Correspondence: Bin Sun, sunbin@ifrit.ac.cn
Disclaimer
All claims expressed in this article are solely those of the authors and do not necessarily represent those of their affiliated organizations, or those of the publisher, the editors and the reviewers. Any product that may be evaluated in this article or claim that may be made by its manufacturer is not guaranteed or endorsed by the publisher.