Abstract
In the Low-Altitude Economy, effective innovation is crucial for sustainable urban development, requiring governance that balances the interests of government, enterprises, and research institutions. This study develops a tripartite evolutionary game model based on the case of Shenzhen as a pioneering city in China to explore this synergy. The findings provide operational policy tools for urban planners: (1) Cooperation stability peaks when technological upgrade benefits are distributed between 0.65 and 0.7; (2) Economic value from technology commercialization drives convergence to an ideal equilibrium, particularly within a range of 20 to 600 million yuan; (3) A critical threshold of approximately 6 million yuan exists for government policy costs—exceeding this significantly reduces willingness to participate. These parameters and mechanisms are essential for effective policy design. In conclusion, the study identifies key mechanisms and conditions that promote collaborative governance in the Low-Altitude Economy based on incentive compatibility principles, making its proposed framework valuable for other cities’ low-altitude economic policies.
1 Introduction
Low-Altitude Economy, an emerging paradigm driven by technological convergence and sustainable development demands, is significantly transforming urban transportation and regional economies. However, its growth faces governance challenges: it relies not only on core technologies like aircraft manufacturing but also on public infrastructure such as airspace management and take-off/landing stations, along with necessary regulatory frameworks. This interplay of “technology—facilities—institutions” necessitates collaboration among government, enterprises, and research institutions—not just for efficiency but as a cornerstone for system success. Yet, mismatched incentives and uncertain cooperative benefits often trap stakeholders in “innovation islands,” hindering the realization of potential synergies.
Significant progress has been made in analyzing the role of unilateral policies, particularly government subsidies, in reducing Research and Development (R&D) risks and stimulating market entry (Peters et al., 2022; Grossman and Helpman, 2021; Huergo and Moreno, 2017). However, most studies adopt a static or bilateral perspective, failing to fully capture the strategic interactions and dynamic feedback among the three core actors: government, enterprises, and research institutions. This gap limits our understanding of policy effectiveness in practice. For instance, some research suggests that without coordinated intellectual property protection and fair benefit-sharing mechanisms, much of the subsidy effectiveness may be lost (Awe et al., 2021). While this assessment is rough and illustrative, it highlights an urgent need for an analytical framework that considers more factors. Consequently, current research cannot systematically address a fundamental question: Under what conditions will these key actors with bounded rationality transition from isolation to cooperation and ultimately form a stable innovation ecosystem?
To address the identified gaps, this study introduces the Triple Helix model as its core theory. This model highlights that the interrelationship and co-evolution among universities (research), industry, and government drive innovation in the knowledge economy era (Etzkowitz and Leydesdorff, 2000). Based on this framework, we develop a tripartite evolutionary game model. This approach aims to capture actors’ limited rationality, strategic learning processes, and system evolution’s path dependence, thereby moving beyond static equilibrium analysis to dynamically reveal conditions for collaboration and evolutionary pathways in governance.
Based on this, the study aims to address the following core questions: (1) What key conditions and mechanisms drive the strategic behaviors of government, enterprises, and research institutions in the low-altitude economic innovation ecosystem towards a stable and sustainable cooperation? (2) How do these conditions—particularly policy cost thresholds, benefit distribution proportions, and technology’s commercial value—quantitatively influence the system’s convergence path and equilibrium outcome?
The main contributions of this paper are twofold: (1) Theoretically, it integrates evolutionary game theory with Triple Helix innovation theory, offering a quantitative framework to analyze the dynamic complexity of multi-agent collaborative governance in the Low-Altitude Economy. (2) Practically, by calibrating the model using empirical data from Shenzhen, China, and conducting scenario simulations, it provides evidence-based decision support for policymakers. Key parameter thresholds identified—such as critical policy cost values and optimal benefit distribution ranges—offer a scientific basis for designing transferable dynamic policy toolkits like an intellectual property sharing framework to align individual rationality with sustainable development goals effectively (Tables 1–3).
Table 1
| Parameter symbol | Meaning |
|---|---|
| C1 | Policy costs borne by government involvement, such as research subsidies and financial support |
| C2 | Basic regulatory costs borne by the government |
| R1 | Basic income that the government receives on a fixed basis |
| H1 | The additional added economic value brought about by the commercialization of the technology |
| V1 | Low-altitude enterprises receive subsidies with the support of government policies |
| R2 | The basic income of low-altitude economic enterprises choosing collaborative R&D |
| C3 | The basic R&D cost that low-altitude economic enterprises choose collaborative R&D to bear |
| R3 | The basic income of low-altitude economic enterprises choosing independent R&D |
| C4 | The basic R&D cost that low-altitude economic enterprises choose independent R&D to bear |
| H2 | Low-altitude economic enterprises and technology R&D institutions after the collaborative writing of technology upgrading benefits |
| V2 | Technology R&D institutions receive financial support with the support of government policies |
| R4 | For fundamental advantages, technology R&D organizations opt for joint R&D. |
| C5 | In order to get R&D expenses, technology R&D organizations choose for collaborative R&D. |
| R5 | Institutions that conduct technology R&D choose for independent study in order to reap the fundamental advantages. |
| C6 | In order to gain R&D expenses, technology R&D organizations choose for independent research |
| F | Taking into account the “free-riding” behavior, low-altitude economic enterprises and technology R&D institutions sign contracts and pay a deposit in advance. When one party breaches the contract, it cannot be recovered and is subject to a penalty |
Description of model parameters.
R&D stands for Research and Development.
Table 2
| Strategy profile | Government revenue | Low—altitude economic enterprise income | R&D institution income |
|---|---|---|---|
| (G1, K1, N1) | Ha1 + R1-C1-C2 | V1 + Hb1 + W2 + R2-C3 | V2 + Hc1 + W1 + R4-C5 |
| (G1, K1, N2) | R1-C1-C2 | V1 + R2 + F-C3 | V2 + R4-F-C5 |
| (G1, K2, N1) | R1-C1-C2 | V1 + R3-C4-F | V2 + R4 + F-C6 |
| (G1, K2, N2) | R1-C1-C2 | V1 + R3-C4 | V2 + R4-C5 |
| (G2, K1, N1) | R1-C2 | W2 + R2-C3 | W1 + R4-C5 |
| (G2, K1, N2) | R1-C2 | R2 + F-C3 | R4-C5-F |
| (G2, K2, N1) | R1-C2 | R3-C4-F | R4 + F-C6 |
| (G2, K2, N2) | R1-C2 | R3-C4 | R4-C5 |
| (G2, K2, N1) | R1-C2 | R3-C4-F | R4 + F-C6 |
Perceived benefit matrix of the tripartite subjects.
a*H1 = Ha1 (the revenue the government gains from technology commercialization); b*H1 = Hb2 (the revenue enterprises gain from technology commercialization); W*H2 = W2 (the revenue enterprises gain from technology upgrading); c*H1 = Hc1 (the revenue R&D institutions gain from technology commercialization); (1-W)*H2 = W1 (the revenue R&D institutions gain from technology upgrading); C3 < C4; C5 < C6. The meanings of other parameters are shown in Table 1.
Table 3
| Equilibrium point | λ1 | λ2 | λ3 |
|---|---|---|---|
| E1(0,0,0) | -C1 | F + R2 + C4-R3-C3 | F + C5-C6 |
| E2(1,0,0) | C1 | F + R2 + C4-R3-C3 | F + C5-C6 |
| E3(0,1,0) | -C1 | R3 + C3-C4-F-R2 | F + W1 |
| E4(0,0,1) | -C1 | F + R2 + W2 + C4-C3-R3 | C6-F-C5 |
| E5(1,1,0) | C1 | R3 + C3-C4-F-R2 | F + W1 + HC1 |
| E6(1,0,1) | C1 | F + R2 + W2 + Hb1 + C4-C3-R3 | C6-F-C5 |
| E7(0,1,1) | Ha1-C1 | R3 + C3-F-R2 -W2 -C4 | -F-W1 |
| E8(1,1,1) | C1-Ha1 | R3 + C3-F-R2 -W2-Hb1 -C4 | -F-W1-HC1 |
Equilibrium points and eigenvalues.
2 Literature review
2.1 Low-altitude economy related literature
The Low-Altitude Economy, as a global emerging frontier, is still evolving in its definition. In international academic discussions, it is often framed within “Urban Air Mobility” (UAM) and its broader concept “Advanced Air Mobility” (AAM). NASA initially described it as “an automated air transportation system serving densely populated areas to safely and efficiently transport people and goods” (Thipphavong et al., 2018). This concept later expanded into AAM, which includes various aircraft applications—from large drones to electric vertical take-off and landing vehicles (eVTOLs)—in both urban and rural settings (Straubinger et al., 2020). In China, the Low-Altitude Economy emphasizes economic attributes, defined as a comprehensive economic form driven by diverse low-altitude flight activities. It centers on general aviation and the drone industry while promoting coordinated development across related fields (Qin, 2023).
Current research emphasizes technological and application-oriented aspects, summarized into three main areas: First, technical feasibility and core systems focus on breakthroughs in aircraft technology, including eVTOL range, battery energy density, and autonomous flight systems (Rajendran and Srinivas, 2023). It also addresses the necessary supporting infrastructure like communication, navigation, and surveillance (CNS) for safe operations (Toreini et al., 2020). Second, market potential and social acceptance involve studies predicting market size, assessing economic impact, and exploring public concerns about noise, privacy, and safety issues (Fu et al., 2022; Al Haddad et al., 2020). Third, airspace management and integration challenges highlight research on integrating high-density heterogeneous aircraft within airspace paradigms as well as traffic management rules and intelligent path planning algorithms (Vascik and Hansman, 2017; Cohen et al., 2021).
It is noteworthy that recent research has shifted from a purely technical focus to exploring governance and coordination mechanisms. For example, Ye et al. (2025) conducted an empirical analysis in Yunnan Province, China, examining how the Low-Altitude Economy promotes regional private sector development. Their findings highlight the interactive relationship between policy coordination and market activation, providing valuable regional insights for this study. However, while these studies acknowledge the need for coordination, most remain at a descriptive level without offering a theoretical model to systematically reveal the strategic interactions among three core actors: government, enterprises, and research institutions. This theoretical gap has resulted in many coordination initiatives facing implementation challenges due to misaligned incentives—this constitutes the central issue this study seeks to address.
2.2 Literature on multi-stakeholder innovation ecosystems and governance frameworks
The healthy development of the Low-Altitude Economy relies on a stable innovation ecosystem. Governance challenges, particularly in coordinating strategies among government, industry, and research institutions, require robust theoretical support. The innovation ecosystem theory posits that technological innovation arises from complex interactions among diverse entities (de Vasconcelos Gomes et al., 2018; Rabelo and Bernus, 2015). Within this framework, the Triple Helix model provides a clear analytical lens, highlighting that the collaboration and co-evolution of universities (research), industry, and government are key drivers of innovation in the knowledge economy era (Etzkowitz and Leydesdorff, 2000).
The contemporary development of this model has integrated specific policy coordination mechanisms, such as designing dynamic subsidies, establishing an intellectual property sharing framework, and implementing adaptive regulation to effectively align the incentive structures across different departments (Cai and Li, 2023). Complementarily, research on profit-sharing arrangements in R&D collaborations provides insights into the stability of synergy. Zhang and Li (2022) found that a fair and clear profit-sharing ratio is crucial for maintaining alliance stability in green technology innovation networks. Further studies have highlighted the importance of dynamically combining contractual governance with relational governance to enhance university-industry cooperation project performance (Bstieler et al., 2018). Regarding policy coordination… Platform ecosystem theory posits that the government can serve as a “platform leader” by creating common infrastructure and standardized interfaces, thereby reducing transaction costs for multi-party collaboration and fostering system-level innovation (Gawer and Cusumano, 2014).
These studies highlight a key insight: A successful policy-driven innovation ecosystem depends on well-designed benefit-sharing mechanisms and flexible policy coordination tools that align individual incentives with collective goals, ensuring the long-term stability of collaborative innovation.
In summary, existing theories have established clear connections among policy coordination, multi-agent dynamics, and sustainable innovation outcomes. This study aims to integrate the tripartite evolutionary game model into this theoretical framework, utilizing its analytical strengths to explain how the triple helix operates within the Low-Altitude Economy, thereby providing methodological justification and enhancing the research’s theoretical relevance.
2.3 Literature on environmental pressure and the resilience of the innovation ecosystem
The evolution of the innovation ecosystem is increasingly influenced by external environmental pressures, in addition to internal policy incentives. Research is focusing on how factors like climate change, stricter regulations, and extreme weather are reshaping enterprises’ innovation strategies and inter-organizational cooperation (Horbach, 2020). Studies show that companies facing higher climate risks are more inclined to develop green technologies in collaboration with research institutions when supported by public funds (Noailly and Shestalovich, 2017). Recently Li et al. (2025) confirmed that even uncertainties from policies can catalyze breakthroughs in green technologies.
Recent studies have deepened the understanding of environmental pressure as a key driver in innovation ecosystems. Chen et al. (2025) argued that strict environmental policies can steer technological change in low-altitude transportation, with their effectiveness reliant on collaboration among government, enterprises, and research institutions. Zhou and Smith (2025) highlighted green finance’s role in stabilizing multi-stakeholder innovation ecosystems under climate pressure, noting that ESG investment channels align incentives across sectors. On a macro level, Liu and Kumar (2025) emphasized governance challenges in aligning urban air mobility with the UN Sustainable Development Goals (SDGs), necessitating policy coordination beyond traditional technological incentives. Davis and Yang (2025) empirical research showed that ESG investment significantly influences enterprise innovation strategies in sustainable aviation, encouraging greater resource allocation to green technology R&D. Additionally, Wang and Li (2025) analyzed resilient innovation ecosystem construction in the Low-Altitude Economy using a systematic approach, stressing dynamic feedback and adaptive governance amid external environmental shocks.
The “Porter Hypothesis” suggests that well-designed environmental regulations can boost enterprise competitiveness through an innovation compensation effect (Popp, 2019). Ullah et al. (2025) expand on this by discussing how enterprises can convert regulatory pressure into development momentum via adaptive innovation strategies. In the transportation sector, such technology shifts driven by pressure rely heavily on cross-sectoral R&D cooperation and flexible policy frameworks (Acemoglu et al., 2021; Garcia and Smith, 2025). Zhang and Zhou (2025) further explore the dynamic feedback mechanism for creating a resilient innovation ecosystem under environmental stress using a system dynamics approach. Empirical studies indicate that in response to external pressures like environmental regulations, enterprises modify their green product innovation strategies, impacting both internal R&D investments and external collaboration models (Berchicci et al., 2021). Additionally, capital markets influence resource allocation through ESG investment channels (e.g., green bonds), prompting firms to allocate more resources to green innovations and indirectly fostering collaborative R&D aimed at mitigating environmental risks (Flammer, 2021).
By integrating these literatures, we situate our research within the broader discourse of sustainable innovation and highlight environmental pressure as a key driver of tripartite coordination, complementing policy incentives.
2.4 Evolutionary game theory
To analyze the complex micro-mechanisms of collaborative governance in the low-altitude economic innovation ecosystem, we need an approach that addresses bounded rationality, strategic interaction, and dynamic evolution. Evolutionary Game Theory (EGT) is a suitable theoretical tool for this analysis. Initially developed in biology to explain the evolution of strategic behavior within populations (Weibull, 1995), EGT has been widely utilized in social sciences to explore institutional change, cooperative evolution, and innovation policy (Friedman, 1998). It relaxes the strict assumption of “perfect rationality” found in classical game theory, allowing participants to adapt their strategies through trial and error, imitation, and learning—better reflecting real decision-making behaviors amid complexity and uncertainty (Hofbauer and Sigmund, 2003).
In innovation and governance research, EGT demonstrates unique advantages in modeling multi-agent coordination. For example, Zhang and Li (2021) developed a government-enterprise game model to illustrate how enterprises adopt green technologies under environmental regulations, highlighting the synergistic effects of subsidies and penalties. Similarly, Yang, J. (2018) applied EGT to demonstrate that sustainable collaboration in strategic emerging industries’ innovation networks can be achieved through self-enforcing agreements and reputation mechanisms, even in the absence of central authority intervention.
However, there is a significant gap in the literature when applying EGT to the emerging field of Low-Altitude Economy. Firstly, most related EGT studies focus on technical aspects, such as task allocation and cooperative control in multi-UAV systems (Gao et al., 2023). These engineering-oriented studies have little connection to governance research that emphasizes institutions and incentives. Secondly, while some studies have begun addressing innovation policies, their models fail to capture essential governance features of the Low-Altitude Economy, including high policy dependence, urgent iterative interactions between technology and regulation, and the distribution of common benefits from technological upgrades.
The mechanisms of key variables such as policy implementation costs, technology commercialization value, and the distribution of technology upgrade benefits in the tripartite collaboration of the Low-Altitude Economy have not been systematically examined or empirically calibrated within evolutionary game theory. This study aims to integrate the core actors defined in the Triple Helix model (Etzkowitz and Leydesdorff, 2000) with the analytical capabilities of evolutionary game theory to construct a tailored tripartite evolutionary game model for Low-Altitude Economy governance. We focus on both equilibrium outcomes and revealing the evolutionary path from “collaboration failure” to “collaboration stability.” Through numerical simulation, we quantitatively analyze how these key parameters influence strategic choices among stakeholders and system convergence efficiency. This research expands EGT’s application in emerging frontier industry governance and deepens collaborative governance theory in the Low-Altitude Economy from conceptual frameworks to computable models.
3 Methodology
3.1 Model assumptions
The successful implementation of technological collaborative innovation in the Low-Altitude Economy’s emerging sector relies on dynamic coordination among governments, businesses, and research organizations. Currently, the global Low-Altitude Economy is rapidly developing, with the interaction between technology advancement and policy support being vital for building an industrial ecosystem. This paper presents seven assumptions to develop an evolutionary game model.
Hypothesis 1: The first participant is the government; the second is a low-altitude business; and the third is a technological R&D organization. The government leads collaborative innovation in low-altitude flight technology by providing policy support, resource coordination, and supervision, while reducing information asymmetry through incentive mechanisms. Low-altitude businesses primarily conduct economic activities and leverage cooperative innovation for technological transformation and market competitiveness. R&D institutes serve as the main source of technology for this collaboration, lowering R&D costs and enhancing technology transfer efficiency. All three parties are bounded rational actors focused on maximizing their own interests, with strategy choices influenced by factors such as information transparency, policy incentives, and penalty coefficients.
Hypothesis 2: The government’s strategic space is (G1, G2) = (participation, non-participation). “Participation” involves the government using policy tools like tax breaks, R&D subsidies, and pilot areas to support collaborative innovation between low-altitude economic enterprises and technology R&D institutions. “Non-participation” means the government maintains minimal oversight without additional financial investment or policies. The strategic space of low-altitude economic enterprises is (K1, K2) = (collaboration, independent R&D). “Collaboration” entails sharing resources and risks with technology R&D institutions for joint research; “Independent R&D” relies on their own resources and capabilities without sharing technological achievements. The strategic space of technology R&D institutions is (N1, N2) = (collaboration, independent R&D). Here, “collaboration” refers to joint research on key technologies with low-altitude economic enterprises while sharing benefits; “Independent R&D” focuses on developing technology based solely on their own capabilities and generating revenue through technology transfer.
Hypothesis 3: When the government adopts a participation strategy, it incurs policy costs such as research subsidies and financial support, quantified as C1 (in ten thousand yuan), alongside basic regulatory costs amounting to C2 (in ten thousand yuan). Conversely, when the government refrains from engaging in collaborative innovation, it does not provide any form of policy or other support and only bears the basic regulatory costs. In this scenario, the government secures a fixed basic income of R1 (in ten thousand yuan). Upon commercialization of the technology, an additional economic value represented by H1 (in ten thousand yuan) is generated, from which the government receives a share denoted as a (dimensionless).
Hypothesis 4: Under government policy support, Low-Altitude Economy enterprises can receive a subsidy of V1 (in ten thousand yuan). For collaborative research and development, they obtain a basic income of R2 (in ten thousand yuan) while incurring a basic R&D cost of C3 (in ten thousand yuan). In independent research and development, the basic income is R3 (ten thousand yuan) with an associated cost of C4 (in ten thousand yuan). Upon commercialization, the additional economic value generated is H1 (in ten thousand yuan), from which Low-Altitude Economy enterprises can claim a proportion b (dimensionless). From the technological upgrades yielding additional income H2 (in ten thousand yuan), they can claim a proportion w (dimensionless).
Hypothesis 5: With government policy support, research and development institutions can receive financial aid of V2 (in ten thousand yuan). For collaborative R&D, they earn a basic income of R4 (in ten thousand yuan) while incurring a basic cost of C5 (in ten thousand yuan). In independent R&D, the income is R5 (in ten thousand yuan) with a cost of C6 (in ten thousand yuan). After commercialization, the technology generates additional economic value H1 (in ten thousand yuan), with research institutions receiving a share c (dimensionless). From the extra income H2 (in ten thousand yuan) due to technology upgrades, their share is 1-w (dimensionless).
Hypothesis 6: Only when the government chooses “participation” (G1), enterprises opt for “collaboration” (K1), and research institutions select “collaboration” (N1) will they jointly commercialize the technology, generating additional economic value H1 (in ten thousand yuan), distributed in proportion (a + b + c ≤ 1). When enterprises choose “collaboration” (K1) and research institutions select “collaboration” (N1), they will collaborate to upgrade the technology, producing additional economic benefits of H2 (in ten thousand yuan), which will also be distributed in a certain proportion.
Hypothesis 7: Considering “free-rider” behavior, Low-Altitude Economy enterprises and R&D institutions will sign contracts with advance payments as deposits. If one party breaches the contract, the deposit is forfeited as a penalty. Thus, the breach of contract cost is set at F (in ten thousand yuan). As shown in the following text, Table 1 is the relevant description of the model parameters.
3.2 Subject strategy
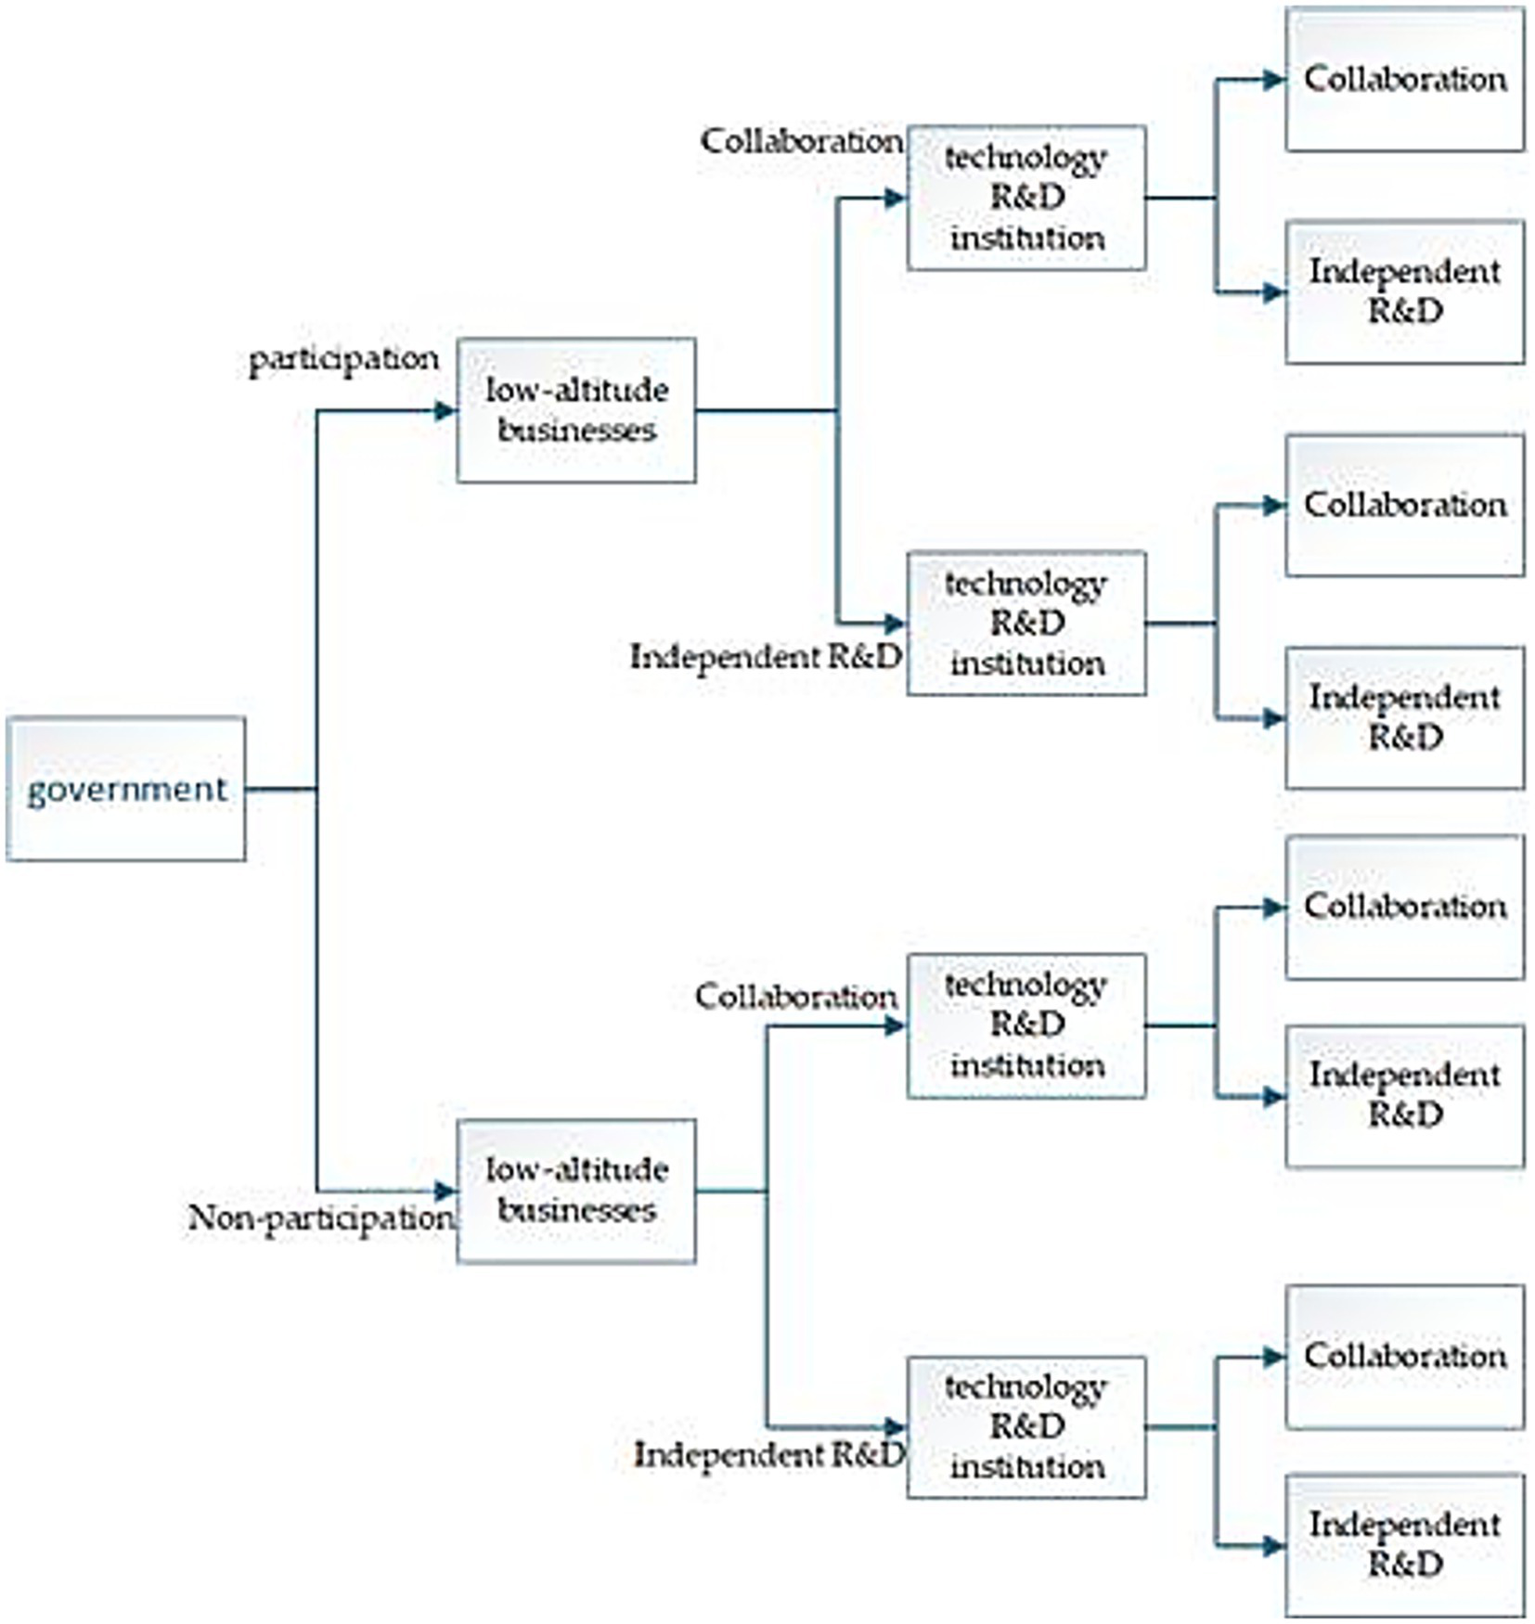
From the strategy set of the government, drone companies, and consumers, it can be seen that there are a total of 8 strategy combinations of the three parties, as shown in Figure 1.
Figure 1
The tripartite strategic combination relationships.
To summarize, the dynamic interactions among the government, low-altitude economic enterprises, and R&D institutions yield eight strategic combinations: I. {G1, K1, N1} = {Participation, Collaboration, Collaboration}. II. {G1, K1, N2} = {Participation, Collaboration, Independent R&D}. III. {G1, K2, N1} = {Participation, Independent R&D, Collaboration}. IV. {G1, K2, N2} = {Participation, Independent R&D, Independent R&D}. V. {G2, K1, N1} = {Non-Participation, Collaboration, Collaboration}. VI. {G2, K1, N2} = {Non-Participation, Collaboration, Independent R&D}. VII. {G2, K2, N1} = {Non-Participation, Independent R&D, Collaboration}. VIII. {G2, K2, N2} = {Non-Participation, Independent R&D, Independent R&D}. According to the main strategy, the perceived benefit matrix of the three main parties is constructed as shown in Table 2 below.
3.3 Model analysis
Assume that the expected return received by the government in selecting the participation strategy is E1, the expected benefit of opting out of the subsidy is E12, and the average return is E1, Equations (1) to (3).
Consequently, the replication dynamic equation for the conduct of government decision-making is as follows Equation (4):
Hypothesis, because, G(z) is about z being a decreasing function.
The partial derivative of F(x) is Equation (5).
The following requirements must be fulfilled in order for the government to accomplish game optimization, based on the differential equation stability theorem: and .
When , , and , so the game is in equilibrium, regardless of the value of x.
When , Let , we know that and are the two steady states of X, respectively. At this point, there are two scenarios:
① When , , , In this case, is the evolutionary stability point, and the government’s policy choice is “not to participate”.
② When, , , In this case, is the evolutionary stability point, and the government’s strategy choice is “participation”.
Corollary 1: Government involvement has a negative correlation with policy cost C1 and a positive correlation with Ha1. The predicted benefits of government participation exceed those of non-participation, leading to convergence at x = 1 as the government’s allocation of Ha1 from technology commercialization increases. Conversely, as shown in Figure 2, the evolutionary stabilization approach will converge to x = 0 when policy costs C1 rise and net income declines.
Figure 2
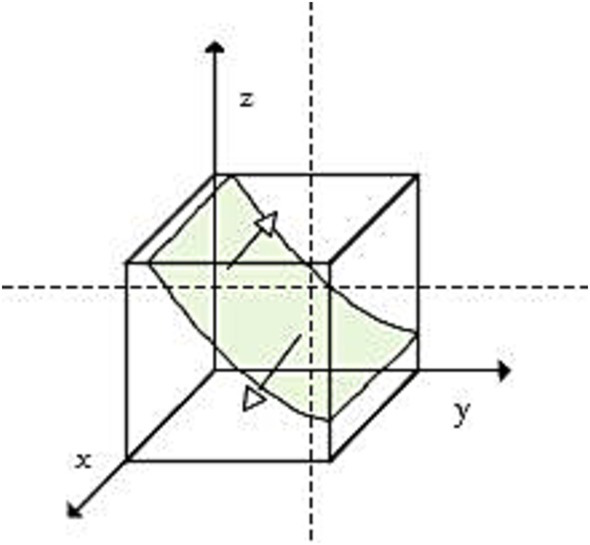
Phase diagram of government decision-making.
Suppose that the expected return obtained by low-altitude economic enterprises choosing collaborative strategy is E21, and the expected income obtained by choosing independent R&D is E22, and the average income is E2 Equations (6) to (8).
Therefore, the replication dynamic equation for the decision-making behavior of low-altitude economic enterprises is as follows Equation (9):
Hypothesis , because , is about x being a decreasing function.
The partial derivative of F(y) is Equation (10).
The following requirements must be fulfilled in order for low-altitude economic firms to attain game optimization, based on the differential equation stability theorem: and .
(1) When , , and , so the game is in equilibrium, regardless of the value of y.
(2) When , Let , we know that and are the two steady states of y, respectively. At this point, there are two scenarios:
① When , , , In this case, is the evolutionary stability point, and the low-altitude economic enterprises’s policy choice is “independent R&D.”
② When , , . In this case, is the evolutionary stability point, and the low-altitude economic enterprise’s strategy choice is “collaboration.”
Corollary 2: The collaborative R&D probability of enterprises positively correlates with policy subsidy V1 and the distribution ratio w of technology upgrading income, while negatively correlating with penalty F and independent R&D cost C4. When the government participates in the policy, businesses’ evolutionary stability strategy converges to X = 1 due to increased benefits from the collaborative strategy provided by subsidy V1. Additionally, collaboration with technology R&D institutions enhances technological upgrading W2, further encouraging cooperation among businesses. Conversely, a reduction in penalty F diminishes the risks associated with independent R&D choices, and lower independent R&D costs C4 lead Low-Altitude Economy enterprises’ evolutionary stabilization strategy to converge towards x = 0. See Figure 3 for details.
Figure 3
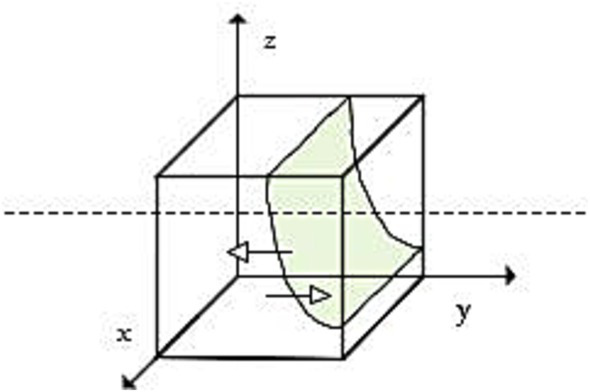
Phase diagram of low-altitude economic enterprises.
The technical R&D institution is expected to receive anticipated returns of E31 from collaboration, E32 from independent R&D, and an average return of E3, Equations (11). to (13).
Consequently, the replication dynamic equation for technological R&D institutions’ decision-making behavior is displayed below Equation (14).
Hypothesis , because , is about y being a decreasing function.
The partial derivative of is Equation (15).
The following requirements must be fulfilled in order for a technology R&D organization to accomplish game optimization, based on the differential equation stability theorem: and .
(1) When , , and , so the game is in equilibrium, regardless of the value of z.
(2) When , Let F(z) = 0, we know that and are the two steady states of z, respectively. At this point, there are two scenarios:
① When , , . In this case, is the evolutionary stability point, and the technology R&D institution’s policy choice is “independent R&D.”
② When ,, . In this case, is the evolutionary stability point, and the technology R&D institution’s strategy choice is “collaboration.”
Corollary 3: The synergistic probability of R&D institutions is positively correlated with government funding support V2 and the technology commercialization revenue distribution ratio c, while negatively correlated with independent R&D costs C6. When the government adopts a participation strategy, the evolutionary stability strategy of technology R&D institutions converges to x = 1 due to increased funding support V2, which reduces collaborative innovation’s marginal cost. Additionally, advantages in technology commercialization enhance collaboration appeal. Conversely, lower independent R&D costs (C6) improve the viability of independent strategies, leading to convergence towards x = 0 for evolutionary stability. See Figure 4 for details.
Figure 4
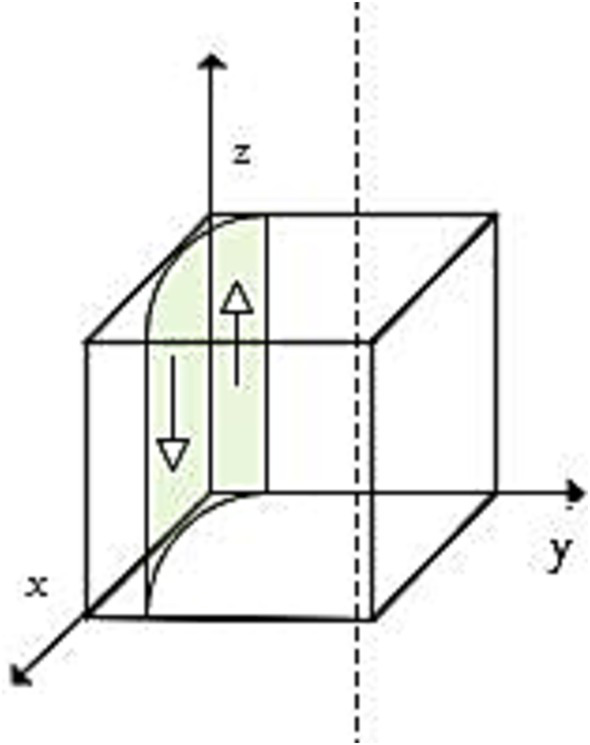
Phase diagram of the technology R&D institution strategy.
3.4 Evolutionary stability analysis of tripartite agent strategy
The replication dynamic system for the tripartite agent is as follows, which can be used to examine the system’s evolutionary stability state: Equation (16)
Only the stability of eight pure strategy equilibrium points is discussed here, as Ritzberger and Weibull (1995) work suggests that many groups’ evolutionary stability strategy must be pure strategy. If , , and , points of equilibrium for pure strategy and mixed strategy equilibrium points are two examples of the several local equilibrium points that we might acquire. First, the system’s Jacobian matrix is solved in order to examine the equilibrium point’s asymptotic stability: Equations (17) and (18).
The equilibrium points exhibit asymptotic stability or evolutionary stability strategy (ESS) when the corresponding eigenvalues are less than 0, as indicated by Lyapunov’s condition for equilibrium point stability (Lyapunov, 1992). An unstable point occurs when the eigenvalues are positive. A saddle point exists when one or both eigenvalues are positive. Table 3 shows the characteristic values of each equilibrium state as follows:
(1) For to be evolutionary equilibrium, the following conditions must be met① –C1<0, ② F + R2 + C4–R3–C3 <0, that is F + R2 + C4<R3 + C3 ③ F + C5–C6 <0, is that F + C5 <C6.
(2) cannot evolve equilibrium for the following reasons:
Among the three eigenvalues of the equilibrium point, is C1 and C1 is the parameter, which is not 0 itself.
(3) cannot evolve equilibrium for the following reasons:
Among the three eigenvalues of the equilibrium point, is , and F and W1 are parameters, which are not 0 themselves.
(4) cannot evolve equilibrium for the following reasons:① –C1<0, ② F+R2+W2+C4–R3–C3 <0, that is, F+R2+W2+C4<R3+C3 ③ The formula is –F–C5+C6 <0, or C6 <F+C5
where C6 is the cost of independent R&D for technology R&D institutions and is the cost of collaborative R&D. This is not consistent with the design because the cost of independent R&D is higher than the cost of collaborative research;
(5) cannot evolve equilibrium for the following reasons:
Among the three eigenvalues of the equilibrium point, is C1 and C1 is the parameter, which is not 0 itself.
(6) cannot evolve equilibrium for the following reasons:
Among the three eigenvalues of the equilibrium point, is C1 and C1 is the parameter, which is not 0 itself.
(7) For to be evolutionary equilibrium, the following conditions must be satisfied:
① , that is ② that is ③.
(8) For to be evolutionary equilibrium, the following conditions must be satisfied:① C1-Ha1<0, that is C1<Ha1 ② R3+C3-F-RW-W2-Hb1-C4 <0 that is, R3+C3<F+R2-W2+Hb1+C4 ③ -F-W1-Hc1<0:
Table 4 clearly shows that the equilibrium point obtained by the previously given derivation is stable, which organizes the equilibrium point analysis in accordance with the model derivation analysis mentioned above.
Table 4
| Equilibrium point | Result | Case |
|---|---|---|
| E1(0,0,0) | ESS | F + R2 + C4 < R3 + C3②F + C5 < C6 |
| E2(1,0,0) | Unstable point | The conditions for the evolutionary stabilization strategy are not met |
| E3(0,1,0) | Unstable point | The conditions for the evolutionary stabilization strategy are not met |
| E4(0,0,1) | Unstable point | The conditions for the evolutionary stabilization strategy are not met |
| E5(1,1,0) | Unstable point | The conditions for the evolutionary stabilization strategy are not met |
| E6(1,0,1) | Unstable point | The conditions for the evolutionary stabilization strategy are not met |
| E7(0,1,1) | ESS | Ha1 < C1②R3 + C3 < F + R2 + W2 + C4 |
| E8(1,1,1) | ESS | C1 < Ha1②R3 + C3 < F + R2 + W2 + C4 + Hb1 |
Results of local equilibrium stability analysis.
ESS: Evolutionary Stability Strategy.
The table shows that stability is satisfied at only three points:, , and .
Scenario 1: The equilibrium point E1(0,0,0) is the system’s stability point when condition ① , ② , ③ is met. From condition ②, it can be seen that the net income of independent R&D is higher than that of collaborative R&D, and enterprises are more inclined to rely on their own resources for R&D and choose independent R&D. From condition③, it can be seen that when the research costs and fines of independent R&D are greater than the R&D costs of collaborative R&D, R&D institutions obtain stable income through independent R&D. At this time, all three parties choose a more conservative strategy, and the system falls into equilibrium, which is an inefficient equilibrium at that time.
Scenario 2: The equilibrium point E7(0,1,1) is the system’s stability point when condition ① , ② , ③ is met. From condition①, it can be seen that the distribution of income obtained by the government from technology commercialization at this time is smaller than the policy cost at the time of participation, and the government still chooses to withdraw from participating in collaborative innovation and only bears regulatory responsibility; From condition②, it can be seen that the net income of low-altitude economic enterprises in independent R&D is lower than that of collaborative R&D, and the fine has a certain influence at this time, and low-altitude economic enterprises choose collaborative R&D; Collaborative R&D will be chosen by technology R&D groups if its net revenue is greater than that of independent R&D. This is evident from condition ③, which highlights the advantages and penalties of technology upgrading under collaborative R&D. The three parties’ current decision demonstrates that, in the event that the government does not engage in collaborative innovation, technology R&D organizations and low-altitude economic enterprises will naturally form collaborative innovation due to the advantages of technological upgrading and high fines. However, the government will not benefit in the long run from this decision, and the balance will be impacted in the future.
Scenario 3: The equilibrium point E8(1,1,1) is the system’s stability point when condition ① , ② , ③ is met. The government will profit more from technological commercialization than the policy cost of engaging in collaborative innovation, as can be observed from condition ①, and the government will typically engage in collaborative innovation. From condition ②, it can be seen that the net income of low-altitude economic enterprises under collaborative innovation is greater than that of independent R&D, and low-altitude economic enterprises tend to collaborative innovation. It is evident from condition ③ that the government’s financial assistance and the advantages of technology commercialization lower the cost of independent R&D, leading technology R&D institutions to opt for joint innovation. At this time, the decision-making of the three parties is to actively participate in collaborative innovation, and the three parties form an efficient coordination mechanism, and policy incentives, penalty constraints and income distribution mechanisms jointly drive technological innovation to achieve a win-win “ideal equilibrium” for all parties.
4 Evolutionary stability strategy’s simulation analysis
Numerical simulations are performed using Matlab2023b to confirm the validity of the evolutionary stability analysis, visualize the evolutionary paths of each equilibrium point, and show how changes in each parameter affect the evolutionary stabilization strategy through the simulation diagrams. The simulation data are based on the example of Shenzhen City, China. The basis of parameter setting: firstly, referring to “Several Measures to Support the High-Quality Development of Low Altitude Economy in Shenzhen”, the scale of low altitude economy industry in Shenzhen reaches 505.95 billion yuan in 2023, so the economic value of commercialization of the technology (H1) is set to 5,000, and secondly, according to the “Regulations on Promotion of Low Altitude Economy Industry in Shenzhen Special Economic Zone”, “the defaulting party needs to return the pre-paid funds and pay a 20% penalty”. The pricing of the contract is set at 10 million RMB. Then, according to the “Shenzhen Low Altitude Economy Industry Innovation and Development Implementation Plan (2022–2025)”, it is proposed that “over 5 billion RMB will be allocated to support the development of the whole industry chain of the low altitude economy within 3 years”, and then focusing on the “special input for collaborative innovation”, the annual input of 200 million RMB will be taken. The annual input is 200 million yuan, so the policy cost (C1) is set at 200. Finally, the remaining parameters are assigned values according to the actual market situation of low altitude economy and the balance relationship between the parameters. All the specific parameters are assigned as follows:
To explore the dynamic interactions and strategic evolution among government, enterprises, and R&D institutions, this study employs an agent-based simulation method—specifically multi-agent modeling—to create a tripartite evolutionary game simulation model. This approach effectively captures the complexity and adaptability of limited rational agents, allowing each to adjust its strategy based on system states and personal benefits. The simulation is conducted in the MATLAB 2023b environment. Each stakeholder—government, Low-Altitude Economy enterprises, and technology R&D institutions—is defined as an autonomous agent. The parameter settings are derived from a thorough analysis of Shenzhen City’s Low-Altitude Economy policy documents, industry market data, and relevant academic literature to accurately reflect real market conditions. Table 5 details all core parameters’ symbols, meanings, benchmark values, and assignment bases. For example: The policy cost is informed by Shenzhen’s three-year special investment plan for the entire industrial chain. The value of technology commercialization corresponds proportionally to Shenzhen’s Low-Altitude Economy industry scale in 2023. Parameters like revenue distribution ratios are grounded in theoretical research on value creation within innovation ecosystems. For further details, please refer to Table 5. Specific parameter assignments are as follows:
Table 5
| Parameter symbol | Reference value | Unit (RMB) | Assignment basis and calculation method | Data sources and theoretical basis | Note |
|---|---|---|---|---|---|
| C1 | 200 | Ten thousand yuan | According to the “Shenzhen Low-Altitude Economy Industry Innovation and Development Implementation Plan (2022–2025)”, over 5 billion yuan will be invested in 3 years to support the entire industrial chain. The focus is on “collaborative innovation,” with an estimated annual investment of 2 billion yuan. Calculation: 5,000 / 3 ≈ 1,667 (average annual total investment). It is assumed that approximately 12% (≈200) of this amount will be specifically allocated for collaborative innovation policies. | Shenzhen’s Implementation Plan for the Innovative Development of the Low-Altitude Economy Industry (2022–2025) | Sensitivity analysis reveals that when C₁ exceeds 600, the government’s willingness to participate drops significantly, indicating a critical threshold effect. |
| H1 | 5,000 | Ten thousand yuan | Referring to the 2023 Low-Altitude Economy industry scale in Shenzhen, which is valued at 505.95 billion yuan (Thipphavong et al., 2018), this figure has been proportionally scaled down to 5,000 units for dimensionless simulation purposes. This adjustment represents the marginal incremental value generated by technology commercialization. | Statistics on the scale of the Low-Altitude Economy industry in Shenzhen City | The system’s convergence speed has the maximum marginal effect within the range of 2,000 to 6,000. Beyond this range, diminishing returns occur. |
| a, b, c | 0.3, 0.5, 0.2 | Dimensionless | The initial framework adheres to the widely accepted allocation principle established in theoretical literature: enterprises, as the primary bearers of commercialization and market risk, are allocated the largest share (b); the government, serving as a coordinator and beneficiary of environmental gains, receives a medium share (a); while research and development institutions, acting as providers of technology, obtain the corresponding share (c). It is stipulated that a + b + c = 1. | The theoretical framework is set up by referring to the literature on value distribution and bargaining power in the innovation ecosystem, such as Bogers et al. (2017). | The key impact of allocation fairness on system stability was verified through multiple sets of comparative experiments (arrays 1–4). |
| w | 0.6 | Dimensionless | Initial benchmark value. Conduct sensitivity analysis within the range of 0.1 to 0.9 by using the method of controlling variables. | Theoretical setting, used for testing the influence of parameters | The simulation results show that the optimal interval is 0.65–0.7, which can maximize the stability and convergence speed of cooperation. |
| V1 | 5 | Ten thousand yuan | Based on the typical scale of government subsidies for enterprise research and development, a reasonable proportion should be formed with the policy cost C₁. | Calibrate based on the internal balance relationship of the model. | The parameter values ensure the attractiveness of the enterprise’s collaborative strategy. |
| F | 2 | Ten thousand yuan | According to the regulation in the “Shenzhen Special Economic Zone Low-Altitude Economy Industry Promotion Regulations” that “the defaulting party shall return the advanced funds and pay a 20% penalty”, if the contract price is 10 million yuan, the penalty would be 2 million yuan. To be consistent with the model scaling ratio, it is set at 2. | Regulations on Promoting the Low-Altitude Economy Industry in the Shenzhen Special Economic Zone | Fines play a significant role in curbing the “free-rider” behavior of enterprises. |
| R2 | 800 | Ten thousand yuan | The set value reflects the stable expected income that an enterprise can obtain through collaborative innovation, which is higher than the income from independent R&D (R₃ = 600), to demonstrate the scale effect and knowledge spillover advantages of collaboration. | Calibrate based on the internal balance relationship of the model. | Improving R₂ can effectively accelerate enterprises’ choice of collaborative strategies, but there may be short-term fluctuations in the medium and low ranges. |
| C4 | 400 | Ten thousand yuan | The set value is higher than the collaborative R&D cost (C₃ = 300), reflecting the diseconomies of scale in independent R&D and the high cost of trial and error. This is one of the key factors driving enterprises to seek cooperation. | The theoretical setting conforms to the basic economic logic that “collaborative research and development can reduce costs”. | Sensitivity analysis indicates that an increase in C₄ would significantly enhance the willingness of enterprises to cooperate. |
Key parameter design table.
To ensure the robustness of the simulation results, we conducted 1,000 independent runs for each scenario, with each run comprising 50 iterations. This number has been verified as sufficient for most cases to reach a stable equilibrium or clearly show long-term strategy trends. The initial strategy selection probabilities of agents were randomly assigned within the range of [0, 1] to promote diversity in initial conditions and avoid biases from specific starting values.
4.1 Technological upgrading, the income distribution ratio w
This study sets the initial technical allocation ratio at 0.6. To systematically explore its impact on game results, five comparison groups were established: w = 0.1, 0.2, 0.7, 0.8, and 0.9, using the control variable method for simulation analysis. Figure 5 illustrates how changes in parameter w affect system evolution: with w = 0.1, low-altitude economic enterprises converge to a coordinated state slowly; as w increases to 0.7, this process accelerates significantly but then slows down again. In this study, the initial technology allocation ratio w is set at 0.6. To systematically investigate its impact on game outcomes, we employ the control variable method to create five comparison groups with w values of 0.1, 0.2, 0.7, 0.8, and 0.9 for simulation analysis. Figure 5 illustrates how variations in parameter w affect the system’s evolutionary trajectory: when w = 0.1, indicated by the red plus sign curve, low-altitude economic enterprises converge towards cooperation slowly. As w increases to 0.7 (green circle dotted line), cooperative evolution accelerates significantly but begins to slow down thereafter. Importantly, once w exceeds the critical value of 0.7, convergence speed exhibits diminishing returns due to structural contradictions in technological factor allocation—this imbalance arises between research institutions and low-altitude economic enterprises. To foster a policy-guided tripartite collaborative innovation system, it is crucial to identify the dynamic balance point for technological factor allocation and establish a fair benefit distribution mechanism that ensures long-term stability in the innovation ecosystem.
Figure 5
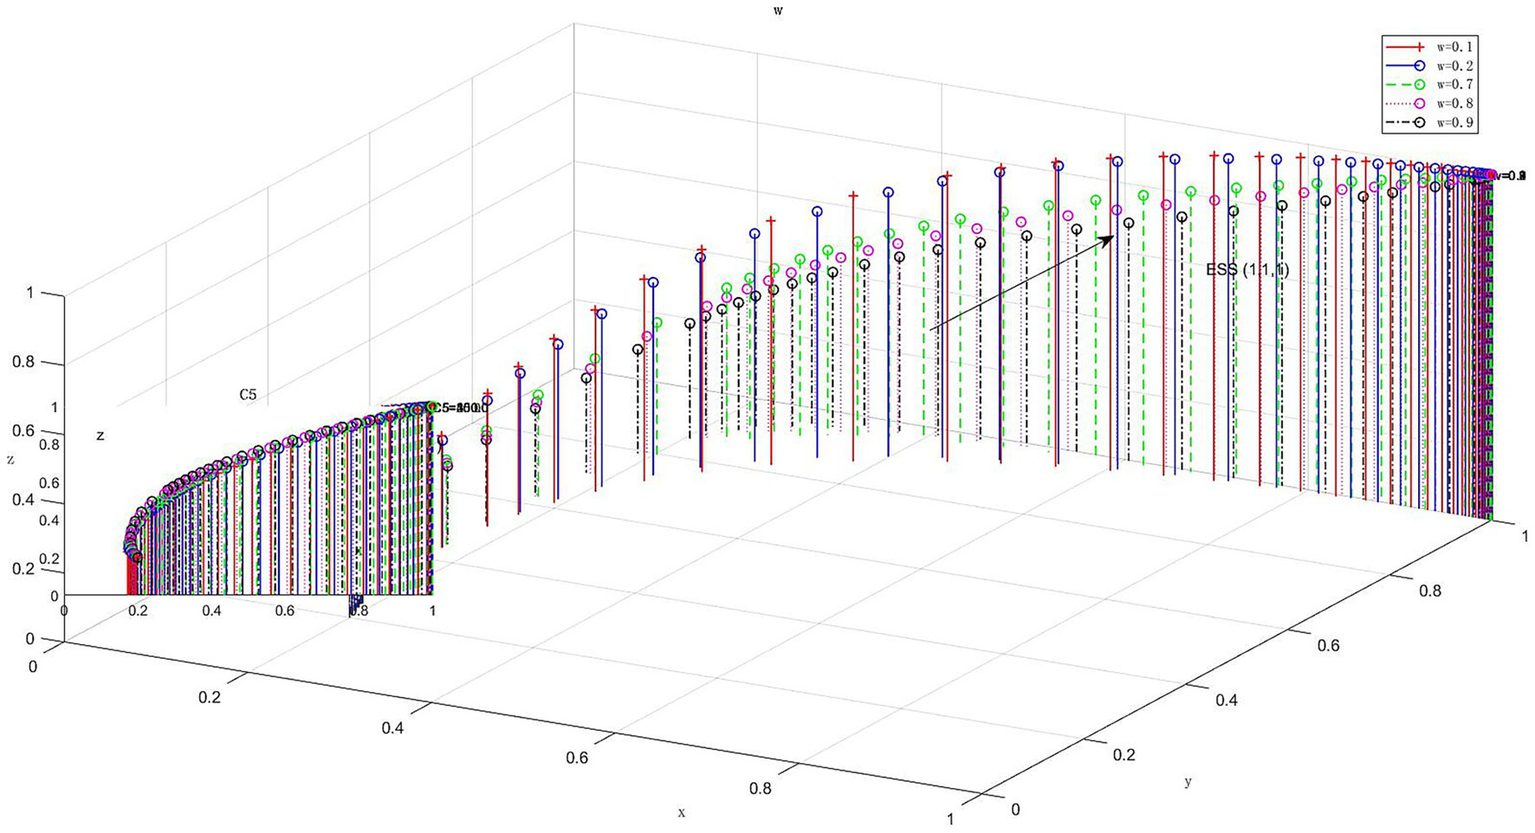
Evolutionary trajectories under different technology upgrade benefit distribution ratios.
4.2 Policy costs C1
In this study, the benchmark policy cost C1 is set at 200 (in ten thousand yuan), with five gradient parameters of 50, 100, 400, 800, and 1,000 (in ten thousand yuan) for sensitivity analysis. As shown in Figure 6, while keeping other parameters constant, the simulation reveals how changes in policy costs affect the collaborative innovation strategies of the government, Low-Altitude Economy enterprises, and technology research institutions. The results indicate that when C1 = 50 (in ten thousand yuan), the government’s choice of independent R&D strategy remains relatively stable. As C1 increases to between 400 and 800 (in ten thousand yuan), a significant critical threshold effect occurs near C1 = 600 (in ten thousand yuan). When C1 exceeds 800 (in ten thousand yuan), the evolution rates of strategies for both government and enterprises align closely. Importantly, once policy costs surpass regional fiscal capacity, governmental willingness to collaborate on innovation reaches saturation. This highlights the need for decision-makers to implement a dynamic compensation mechanism that activates promptly when costs exceed critical thresholds to optimize fiscal resource allocation and sustain collaborative innovation among all parties involved.
Figure 6
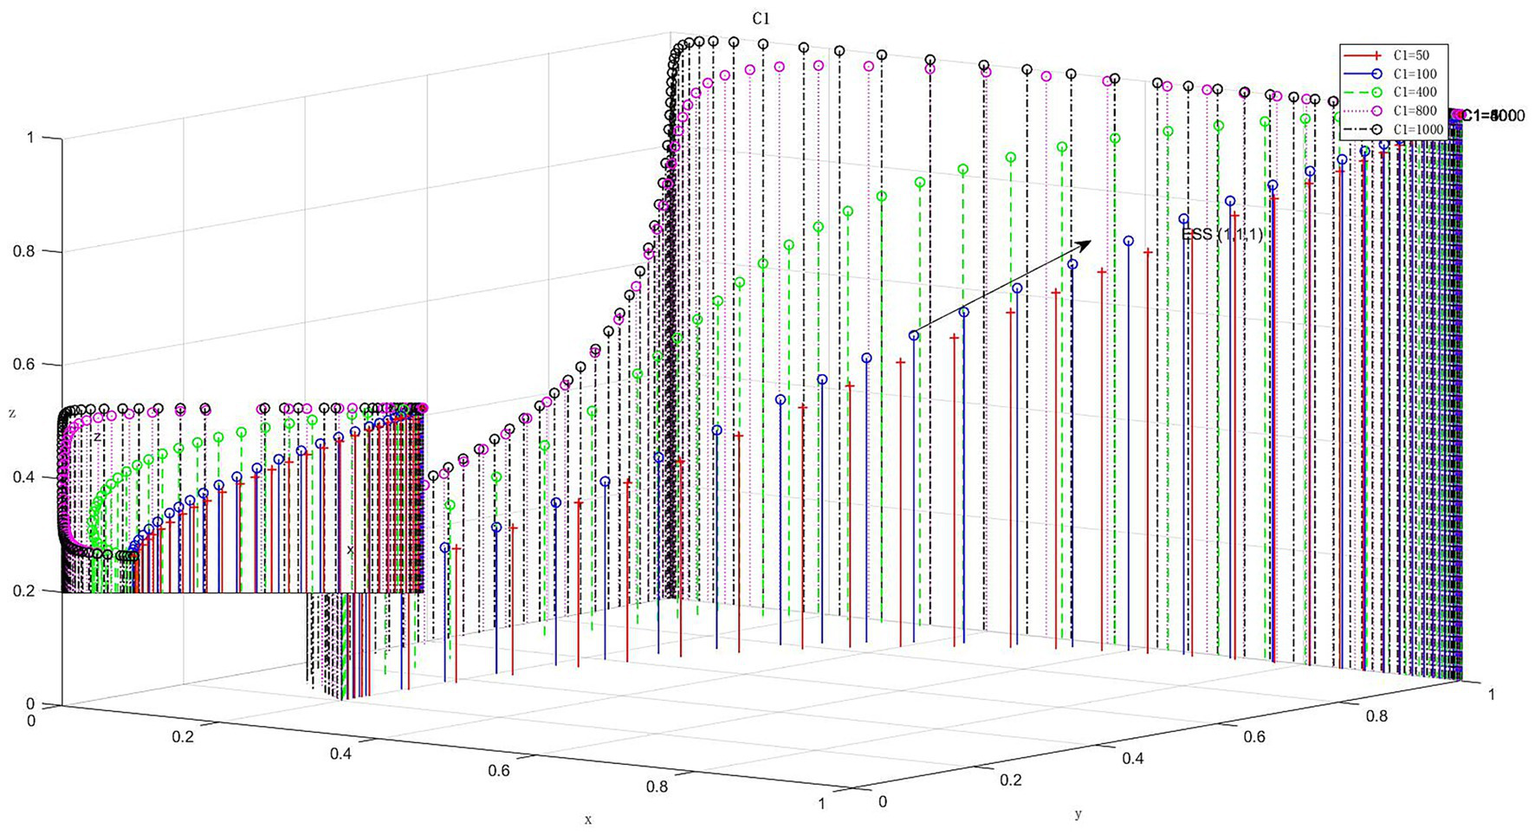
Evolutionary trajectories under different policy costs.
4.3 The additional economic value of technology commercialization H1
In this study, the benchmark value of the additional economic value H1 for technology commercialization is set at 50 million yuan. To explore its influence on game equilibrium, five additional levels of H1—1,000, 2,000, 6,000, 8,000, and 10,000 million yuan—are analyzed. Figure 7 illustrates the evolution characteristics of collaborative innovation strategies among government entities, Low-Altitude Economy enterprises, and technology R&D institutions as H1 varies while other parameters remain fixed. Simulation data indicate that when H1 = 1,000 million yuan (red plus sign curve), Low-Altitude Economy enterprises show the fastest strategy evolution rate and lead in their adjustment process compared to government and R&D institutions. As H1 increases to 6,000 million yuan (green circle dotted line), all subjects’ evolution trajectories flatten; however, the overall system converges to collaborative innovation equilibrium more rapidly. Notably, within the range of 2,000 ≤ H1 ≤ 6,000 million yuan, Low-Altitude Economy enterprises exhibit a positive correlation between strategy response sensitivity and H1 value. However, after exceeding this threshold, the acceleration of evolution shows a slight diminishing trend. This may be due to the marginal benefit inflection point in technology collaborative innovation—when the commercial value of technology surpasses the elastic boundary for enterprise strategy adjustments, the saturation effect of economic incentives weakens the impetus for change. The research confirms that moderate regulation of technology commercialization’s value space can effectively stimulate collaboration among the three innovation subjects, allowing system evolution to achieve dynamic balance within maximum benefit intervals. Therefore, to enhance collaborative innovation speed among all parties, it is beneficial to jointly increase technology commercialization value while staying within a reasonable range.
Figure 7
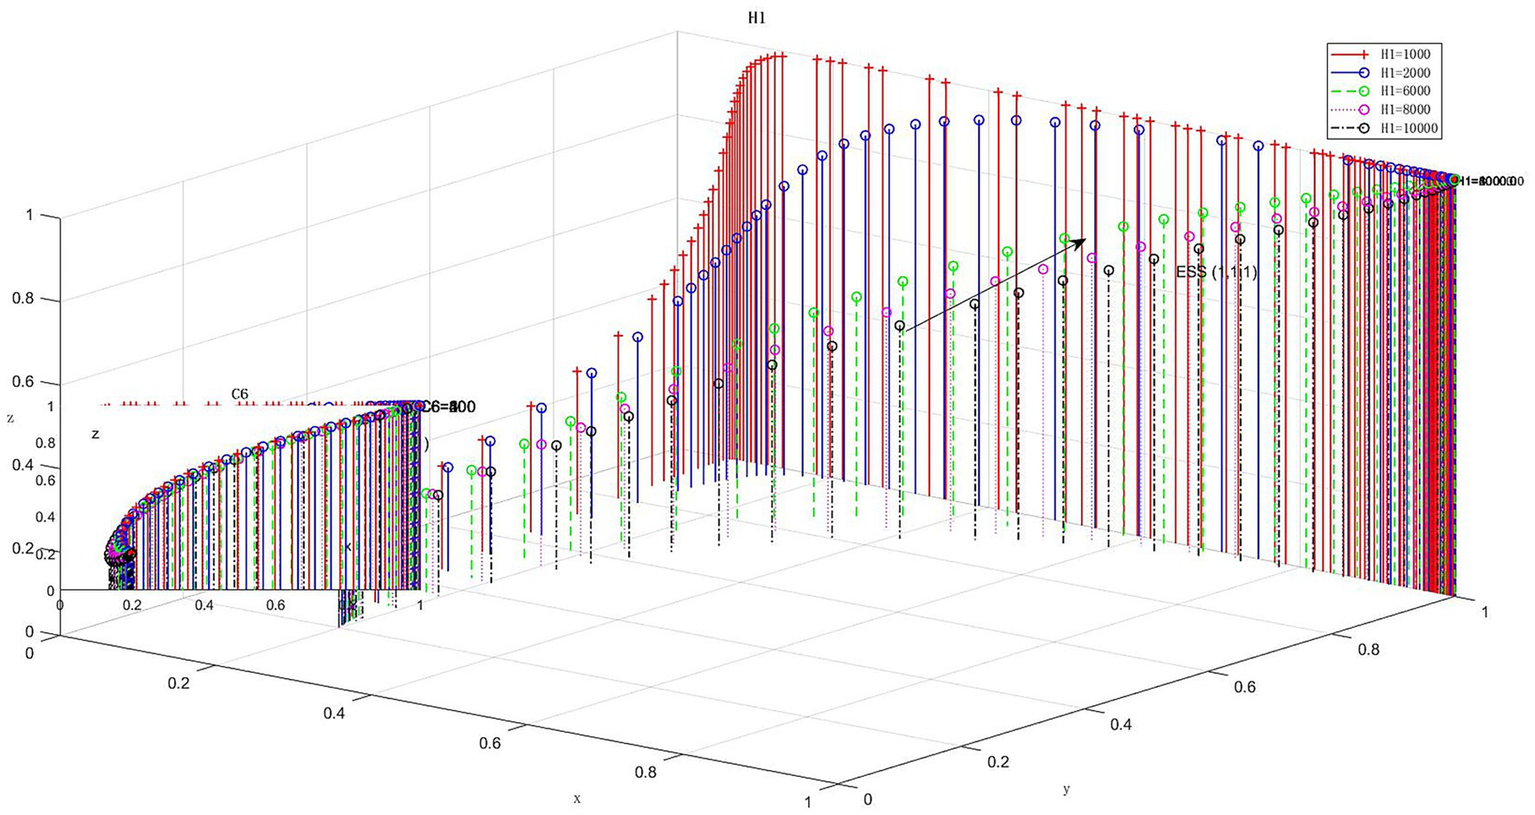
Evolutionary trajectories under different additional economic values of technology commercialization.
4.4 R&D costs C4
In this study, the benchmark for independent R&D cost C4 of enterprises is set at 4 million yuan. To examine its impact on game equilibrium, five control parameters are introduced: C4 = 1 million, 2 million, 6 million, 8 million, and 10 million yuan. Figure 8 illustrates how variations in C4 affect the collaborative innovation strategies of government, Low-Altitude Economy enterprises, and technology R&D institutions while keeping other parameters constant. The analysis shows that when C4 = 1 million yuan (indicated by the red dotted line), Low-Altitude Economy enterprises exhibit a slight upward trend in collaboration; as C4 increases to between 2 and 10 million yuan, the rate of collaborative evolution accelerates significantly. This phenomenon indicates that a marginal increase in independent R&D costs reduces enterprises’ willingness for independent innovation while enhancing their preference for collaborative innovation. Notably, within the C4 range of 2–6 million yuan, the trajectory initially shows an opposite trend—high sunk costs encourage increased investment in independent R&D, as the scale effect of collaborative R&D is not yet fully realized. Once C4 surpasses a critical threshold, technology spillover effects and cost-sharing mechanisms drive enterprises to rethink their R&D decision-making framework. The research suggests establishing a dynamic cost adjustment mechanism to build a tripartite collaborative innovation ecosystem: optimizing the structure of independent R&D costs, guiding innovation entities to form resource-dependent networks, and managing risks associated with sunk costs to achieve optimal resource allocation and technological diffusion.
Figure 8
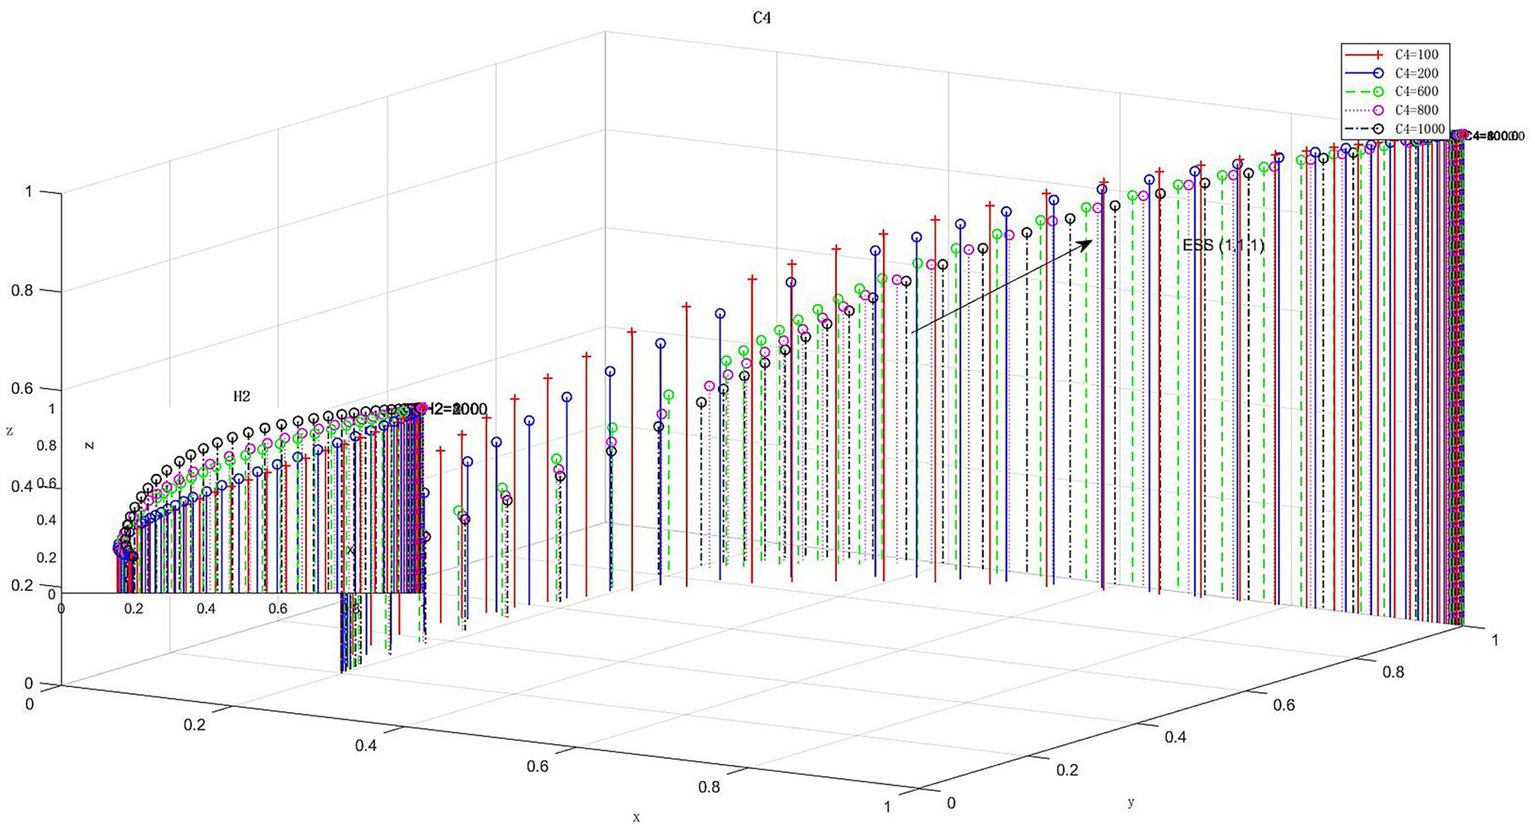
Evolutionary trajectories under different enterprises’ independent R&D costs.
4.5 The basic income of collaborative R&D R2
In this study, the initial basic benefit R2 for enterprise collaborative R&D is set at 8 million yuan. To assess the sensitivity of this parameter to system evolution, a comparative experimental group was created with five gradient values: R2 = 100, 200, 1,000, 2000, and 3,000 (in million yuan). Figure 9 illustrates the dynamic impact of R2 on the collaborative innovation strategies of government, Low-Altitude Economy enterprises, and technology R&D institutions. Simulation data indicate that when R2 = 100 (million yuan) (marked by the red plus sign and dotted line), Low-Altitude Economy enterprises exhibit significant lag in strategy convergence. As R2 increases exponentially, the convergence rate of the evolution trajectory accelerates markedly. Notably, in the medium benefit range of R2 = 200–1,000 (in million yuan), a phase reversal phenomenon occurs early in evolution. While increased basic benefits enhance collaborative motivation among enterprises, insufficient resource matching efficiency leads to significant nonlinear inhibitory effects, resulting in short-term oscillations within the system. When R2 exceeds 2,000 (in million yuan), the scale benefits of collaborative innovation greatly surpass coordination costs, leading to stable convergence in strategy choices among the three parties. Empirical results suggest that enhancing expected benefits of collaborative R&D through policy tools like fiscal incentives and intellectual property protection can effectively overcome bottlenecks in collaborative innovation and foster a virtuous cycle within the innovation ecosystem.
Figure 9
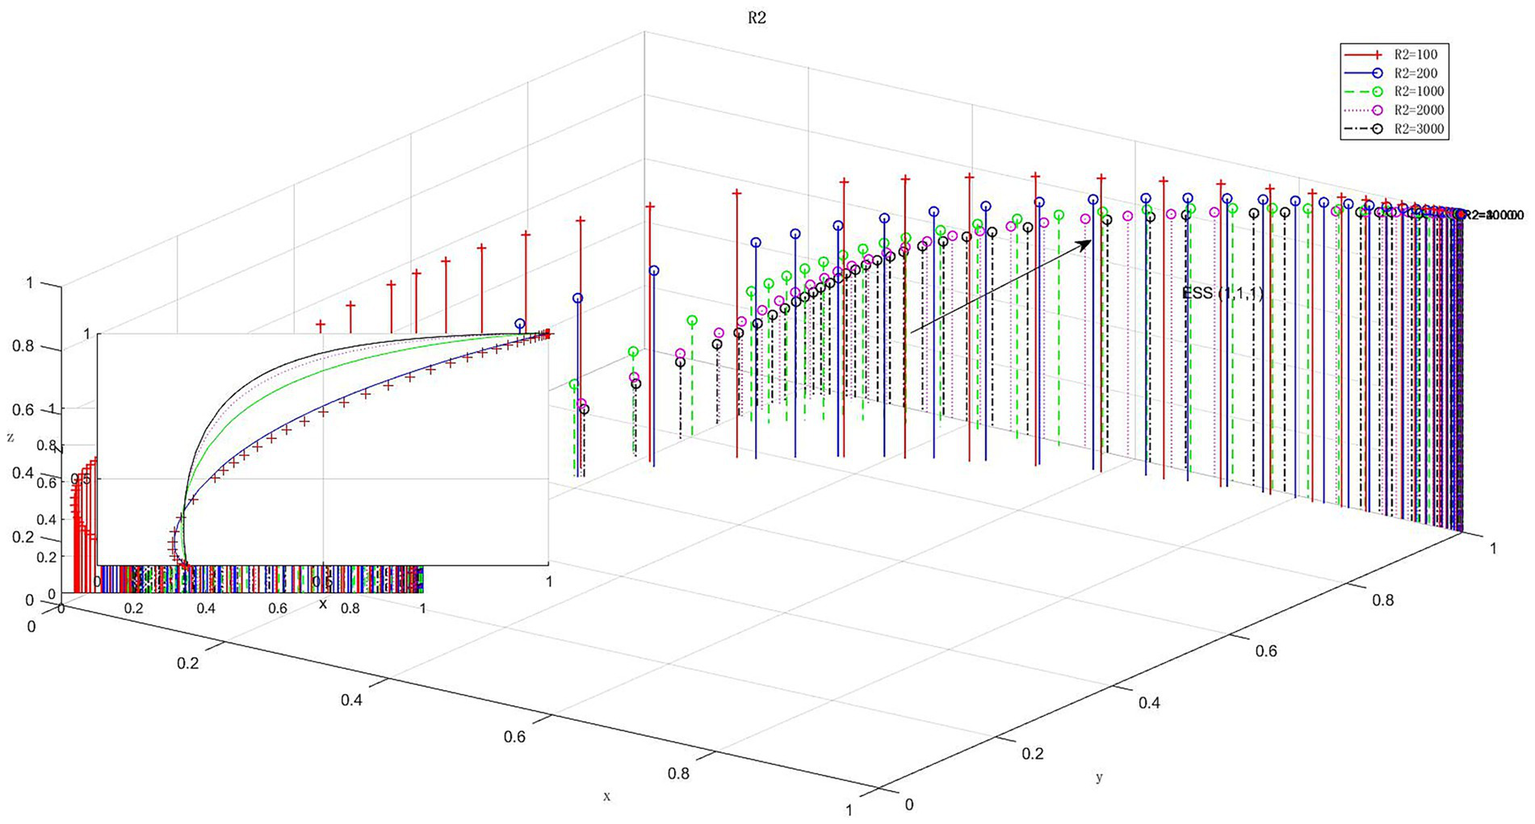
Evolutionary trajectories under different basic benefits of collaborative R&D.
4.6 Different allocation ratios
In this study, the initial benchmark for the revenue distribution ratio of technology commercialization was set as (a,b,c) = (0.3, 0.5, 0.2). To explore how different ratios affect game equilibrium, four additional parameter configurations were introduced: array 1(0.8, 0.1, 0.1), array 2(0.1, 0.8, 0.1), array 3(0.1, 0.1, 0.8), and array 4(0.33, 0.34, 0.33). Figure 10 illustrates the impact of dynamically adjusting the revenue distribution ratios a, b, and c on the collaborative innovation strategies of government entities, Low-Altitude Economy enterprises, and technology R&D institutions while keeping other parameters constant. The simulation results indicate that with configuration from array 1 adopted, the government’s participation strategy converges most rapidly; in Array 2’s context, Low-Altitude Economy enterprises show a steep upward trend in their collaborative strategy evolution; Array 3 significantly speeds up strategic evolution for technology R&D institutions; under array 4 conditions all three main bodies exhibit asymptotic convergence characteristics in their evolution trajectories. Based on the analysis, it is evident that a scientific allocation of revenue distribution coefficients a, b, and c for technology commercialization can significantly enhance collaborative innovation efficiency among the government, Low-Altitude Economy enterprises, and technology R&D institutions. When the distribution ratio falls within a reasonable range, all three parties exhibit an exponential growth trend in their probabilities of choosing collaborative strategies. This confirms a strong positive correlation between revenue distribution fairness and the dynamic stability of the collaborative innovation system. Therefore, during policy-making, the government should carefully consider the interest distribution among these parties to ensure sustainable development of the collaborative innovation ecosystem.
Figure 10
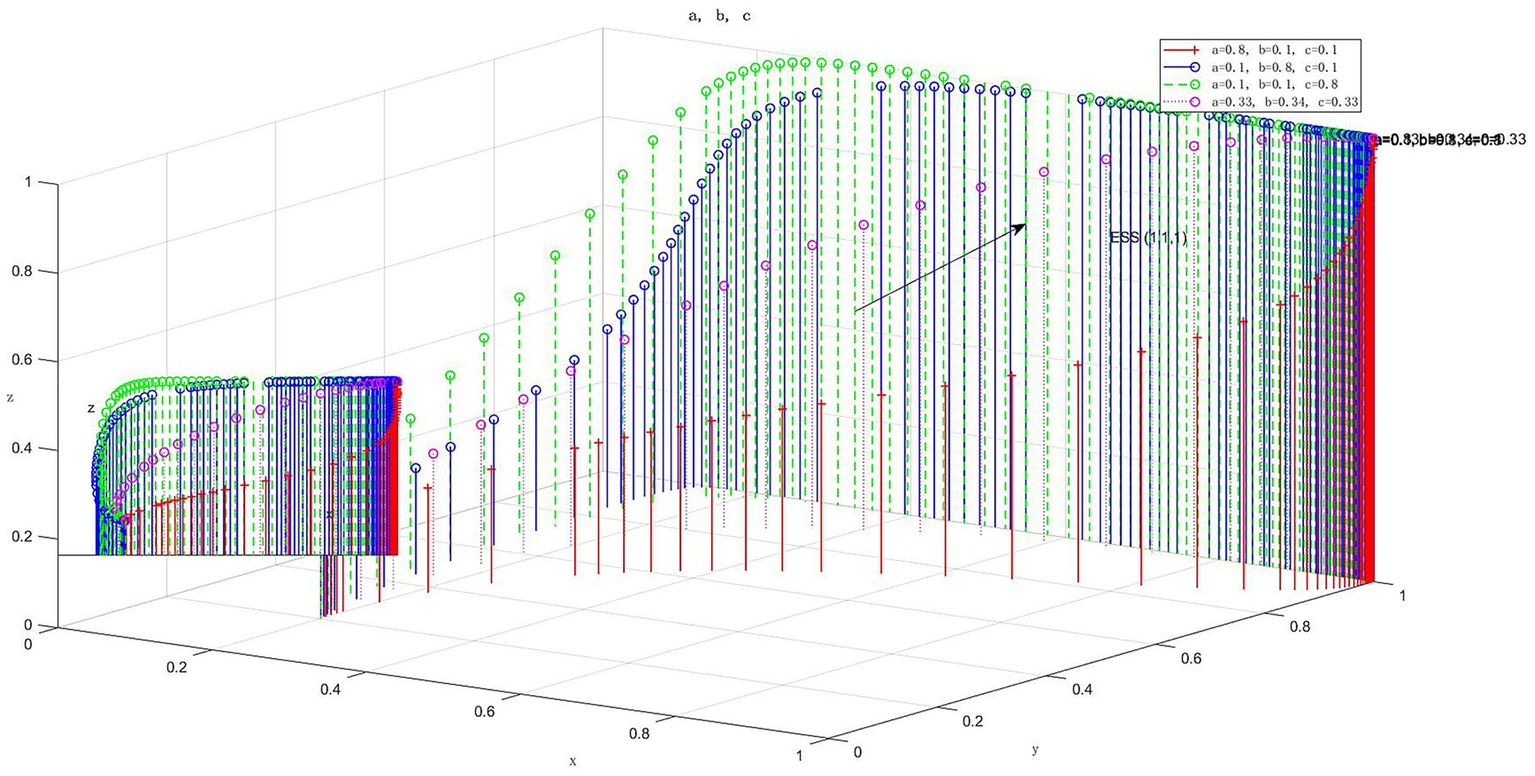
Evolutionary trajectories under different revenue distribution ratio combinations.
4.7 Different initial strategy evolution paths
Figure 11 shows how the stochastic beginning approach influences evolutionary stability in the E8(1,1,1) state. The point (1,1,1) represents the ultimate evolutionary outcome, irrespective of the players’ initial goals. At this stage, low-altitude economic enterprises yield higher net income than independent R&D. Technology R&D institutions adopt a synergy strategy based on technology commercialization allocation and fines, while the government maximizes net income through policy incentives. Consequently, the optimal strategies for the government, low-altitude economic enterprises, and technology R&D institutions are “participation,” “collaboration,” and “collaboration,” respectively.
Figure 11
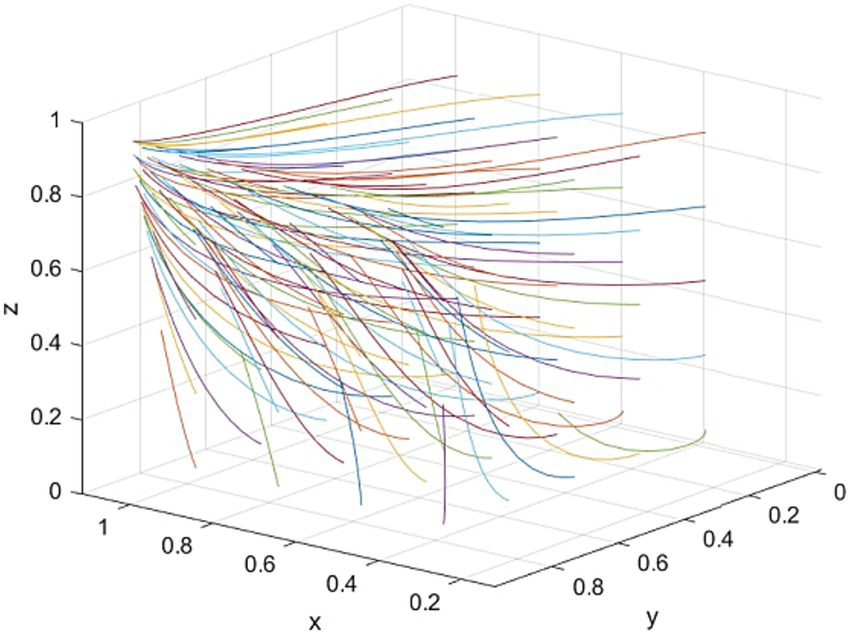
Evolutionary paths from different initial strategies.
5 Conclusion
5.1 Policy implementation framework
Based on the key parameter thresholds and system dynamics from the simulation results, this study has developed a policy implementation framework to convert theoretical findings into practical governance tools. The framework focuses on four core mechanisms:
First, a contract-based benefit-sharing mechanism is proposed. Simulation results show optimal system stability when the distribution ratio of technological upgrade benefits is between 0.65 and 0.70. Therefore, it is recommended to implement a standardized “Collaborative Innovation Benefit Sharing Agreement” for government-funded R&D projects. Contractual terms should allocate 65 to 70% of technological value-added benefits to enterprises that bear commercial risks, with the remainder going to R&D institutions. Additionally, government subsidies can be linked to this agreement, and ownership rules for background and prospective intellectual property rights should be clearly defined to ensure long-term cooperation expectations from a systemic perspective.
Second, a dynamic fiscal incentive mechanism is proposed. Given the critical threshold of approximately 6 million yuan for policy costs, a stepped subsidy plan should be designed. This plan would provide higher start-up funds during the early stages of industrialization and implement a clear subsidy reduction mechanism based on technology maturity and market income. Additionally, a ‘co-innovation risk pool’ can be established to compensate when government coordination costs for individual projects approach this critical value, ensuring continued public sector participation.
Third, a precise triggering mechanism based on commercial value. The simulation revealed that the marginal effect is highest when the technology’s commercial value ranges from 20 to 60 million yuan. Therefore, a “Major Technology Commercialization Award for Low-Altitude Economy” can be established. Projects that successfully achieve commercialization and generate additional economic value within this range could receive a one-time bonus or tax credit. Measures like “Innovation Vouchers” and government priority procurement can directly enhance initial expectations for technology commercialization, creating effective market demand pull.
Fourth, an adaptive resource allocation mechanism is essential. As rising independent R&D costs drive enterprises towards collaboration, varying allocation ratios affect the evolution speed of each entity; thus, policies should be dynamically adjusted. During the industry incubation phase, resources should favor R&D institutions to promote core technology supply; in the scale-up phase, incentives should shift to application-end enterprises to boost market demand. Government investment in shared infrastructure like public test fields and universal certification platforms can systematically lower R&D and collaboration costs for all participants.
5.2 Research conclusions
This study reveals the dynamic mechanisms and stable conditions of low-altitude economic collaborative innovation through a tripartite evolutionary game model involving government, enterprises, and research institutions. The main conclusions are as follows: (1) Fair distribution of technological upgrade benefits is crucial for collaboration stability. When enterprises receive 65–70% of value-added benefits, the system is most likely to achieve and maintain an ideal equilibrium. (2) The additional economic value from technology commercialization serves as the core engine driving convergence towards an ideal state. Specifically, when this value ranges between 20 and 60 million yuan, it accelerates the convergence process. (3) There exists a clear efficiency boundary for government policy costs. A critical threshold around 60 million yuan marks a limit for sustainable public financial input; exceeding it may deter government participation and lead to collaborative failure. (4) Basic benefits from collaborative R&D and independent R&D costs are key factors influencing evolutionary paths and speeds. Increasing basic collaboration benefits or raising independent R&D challenges can effectively encourage enterprises to adopt cooperative strategies.
5.3 Model limitations and future research directions
The tripartite evolutionary game model developed in this study offers valuable insights into policy coordination and strategic interaction within the low-altitude economic innovation ecosystem, leading to several relevant policy conclusions. However, this study has inherent limitations that also suggest promising directions for future research.
First, this model analyzes strategic evolution in a stable technological-institutional environment but does not fully account for disruptive technological breakthroughs or sudden external shocks. Events such as increases in battery energy density, changes in airspace management regulations, or major safety incidents can quickly alter the game’s payoff structure and disrupt the current evolutionarily stable equilibrium. Future research could address this gap by introducing a stochastic game framework that models technological breakthroughs as random events with specific probability distributions to assess system robustness under uncertainty and inform adaptive policy design.
Second, the model lacks clarity in representing the temporal dynamics and evolution stages of the industry. While it describes the relative change rate of strategic proportions through replicator dynamics, it fails to align this with an actual time scale or distinguish between development stages such as “pilot demonstration,” “scale commercialization,” and “mature operation.” This ambiguity complicates accurate assessments of policy intervention urgency and timeliness. A promising direction for improvement is to develop a multi-stage evolutionary game model that divides the time axis into distinct periods corresponding to industry development stages, applying different parameter sets at each stage to better simulate the co-evolution path of policies and strategies throughout the industrial life cycle.
Thirdly, the research treats most key parameters as fixed and exogenous throughout the evolutionary process. However, in reality, factors like policy costs, technology commercialization value, and R&D costs are often endogenous and dynamic. For example, R&D costs decrease along the technology learning curve, while commercialization value fluctuates with market penetration rates. Future models could endogenize these parameters by linking commercialization value to market share or making R&D costs dependent on cumulative investment. This approach would better illustrate the endogenous feedback mechanisms among technology, market, and policy within the innovation ecosystem.
Fourth, this study focuses on the core analysis of three main actors in the Triple Helix model: government, enterprises, and research institutions. However, a complete innovation ecosystem also includes other key stakeholders like end-users and financial institutions. The attitudes and behaviors of these absent stakeholders can significantly impact the decisions of other actors. Therefore, future research could explore a multi-party game model that incorporates these roles to provide a more comprehensive system perspective.
Fifth, the model simplifies the treatment of environmental pressure. While this study focuses on sustainable development goals, it mainly views environmental benefits as part of technology’s commercial value or implicit government gains. It does not explicitly address how environmental regulation pressure or green market preferences influence strategic choices. To better align with the academic discourse on “environmental pressure driving innovation,” future research should incorporate an explicit environmental module—such as a carbon emission cap or linking enterprise profits to their environmental performance—to more accurately simulate the dynamics of green technological innovation and diffusion.
Statements
Data availability statement
The raw data supporting the conclusions of this article will be made available by the authors, without undue reservation.
Author contributions
QX: Writing – review & editing. QC: Writing – original draft. CH: Writing – review & editing. XX: Writing – review & editing.
Funding
The author(s) declare that no financial support was received for the research and/or publication of this article.
Acknowledgments
The author would like to express sincere gratitude to Professors Xu Qun, He Chan and Xu Xu. From the establishment of the research topic, the design of the research plan, to the revision of the simulation analysis, the three professors have always provided the author with meticulous guidance with their profound knowledge and rigorous academic attitude.
Conflict of interest
The authors declare that the research was conducted in the absence of any commercial or financial relationships that could be construed as a potential conflict of interest.
Generative AI statement
The authors declare that no Gen AI was used in the creation of this manuscript.
Any alternative text (alt text) provided alongside figures in this article has been generated by Frontiers with the support of artificial intelligence and reasonable efforts have been made to ensure accuracy, including review by the authors wherever possible. If you identify any issues, please contact us.
Publisher’s note
All claims expressed in this article are solely those of the authors and do not necessarily represent those of their affiliated organizations, or those of the publisher, the editors and the reviewers. Any product that may be evaluated in this article, or claim that may be made by its manufacturer, is not guaranteed or endorsed by the publisher.
References
1
Acemoglu D. Aghion P. Hemous D. (2021). The environment and directed technical change. Am. Econ. Rev.111, 1315–1348. doi: 10.1257/aer.20180349
2
Al Haddad A. Chaniotakis E. Straubinger A. Plötner K. Antoniou C. (2020). Factors affecting the adoption and use of urban air mobility. Transp. Res. Part A Policy Pract.132, 696–712. doi: 10.1016/j.tra.2019.10.006
3
Awe O. I. Okuwa O. B. Olanipekun I. O. (2021). Does government funding of R&D catalyze innovation in the service sector? Evidence from Nigeria. Technol. Forecast. Soc.162:120373. doi: 10.1016/j.techfore.2020.120373
4
Berchicci L. King A. Tucci C. L. (2021). The role of external pressures in green product innovation. Res. Policy50:104322. doi: 10.1016/j.respol.2021.104322
5
Bogers M. Zobel A. K. Afuah A. Almirall E. Brunswicker S. Dahlander L. et al . (2017). The open innovation research landscape: established perspectives and emerging themes across different levels of analysis. Ind. Innov.24, 8–40. doi: 10.1080/13662716.2016.1240068
6
Bstieler L. Faems D. Heimeriks K. H. (2018). The impact of contractual and relational governance on project performance in university-industry collaborations: a dynamic perspective. J. Eng. Technol. Manag.47, 28–42. doi: 10.1016/j.jengtecman.2018.01.002
7
Cai W. Li G. (2023). Orchestration in innovation ecosystems: the role of modular governance and policy coordination. Technovation119:102567. doi: 10.1016/j.technovation.2022.102567
8
Chen L. Wang Y. Zhang K. (2025). Environmental policy stringency and directed technical change in low-altitude mobility: a triple-helix perspective. Technol. Soc.73:102828. doi: 10.1016/j.techsoc.2025.102828
9
Cohen A. Shaheen S. Farrar E. (2021). Urban air mobility: history, ecosystem, market potential, and challenges. IEEE Trans. Intell. Transp. Syst.22, 5374–5387. doi: 10.1109/TITS.2021.3066240
10
Davis R. Yang H. (2025). ESG investing and corporate innovation in sustainable aviation. Financ. Res. Lett.70:100002. doi: 10.1016/j.finr.2025.100002
11
de Vasconcelos Gomes L. A. Facin A. L. F. Salerno M. S. Kazuo Ikenami R. (2018). Unpacking the innovation ecosystem construct: evolution, gaps and trends. Technol. Forecast. Soc.136, 30–48. doi: 10.1016/j.techfore.2018.04.011
12
Etzkowitz H. Leydesdorff L. (2000). The dynamics of innovation: from National Systems and "mode 2" to a triple Helix of university–industry–government relations. Res. Policy29, 109–123. doi: 10.1016/S0048-7333(99)00055-4
13
Flammer C. (2021). Corporate green bonds. J. Financ. Econ.142, 499–516. doi: 10.1016/j.jfineco.2021.01.016
14
Friedman D. (1998). Evolutionary economics goes mainstream: a review of the theory of learning in games. J. Evol. Econ.8, 423–432. doi: 10.1007/s001910050068
15
Fu M. Rothfeld R. Antoniou C. (2022). Exploring preferences for transportation modes in an urban air mobility environment: a Munich case study. Transp. Res. Part C Emerg. Technol.145:103921. doi: 10.1016/j.trc.2022.103921
16
Gao J. Ye W. Guo J. Li Z. (2023). Multi-UAV task allocation based on evolutionary game theory. IEEE Trans. Veh. Technol.72, 5695–5709. doi: 10.1109/TVT.2023.3235520
17
Garcia M. Smith R. (2025). Sustainability transitions in the transportation sector: the role of policy and collaboration. Transp. Res. Part D Transp. Environ.130:103456. doi: 10.1016/j.trd.2025.103456
18
Gawer A. Cusumano M. A. (2014). Industry platforms and ecosystem innovation. J. Prod. Innov. Manag.31, 417–433. doi: 10.1111/jpim.12105
19
Grossman G. M. Helpman E. (2021). A general purpose technology as a generalized externality. J. Eur. Econ. Assoc.19, 1801–1841. doi: 10.1093/jeea/jvab029
20
Hofbauer J. Sigmund K. (2003). Evolutionary game dynamics. Bull. Am. Math. Soc.40, 479–519. doi: 10.1090/S0273-0979-03-00988-1
21
Horbach J. (2020). Empirical determinants of eco-innovation in European countries using the community innovation survey. Environ. Innov. Soc. Transit.35, 1–13. doi: 10.1016/j.eist.2020.01.004
22
Huergo E. Moreno L. (2017). Subsidies or stability? The effect of R&D policy on R&D investment by Spanish firms. Small Bus. Econ.49, 1087–1112. doi: 10.1007/s11187-017-9881-7
23
Li X. Wang Y. Zhang T. (2025). The impact of climate policy uncertainty on green technology innovation: evidence from the manufacturing sector. J. Environ. Econ. Policy14, 1–15. doi: 10.1080/21606544.2024.2345678
24
Liu F. Kumar S. (2025). Aligning urban air mobility with sustainable development goals: a governance challenge. Sustain. Dev. doi: 10.1002/sd.70309
25
Lyapunov A. M. (1992). The general problem of the stability of motion. Int. J. Control.55*(3), 531–534. doi: 10.1080/00207179208934253
26
Noailly J. Shestalovich V. (2017). Do tech clusters promote green innovation?Environ. Resour. Econ.67, 1–28. doi: 10.1007/s10640-015-9982-1
27
Peters M. Schneider M. Griesshaber T. Hoffmann V. H. (2022). The impact of technology-push and demand-pull policies on technical change – does the locus of policies matter?Res. Policy51:104563. doi: 10.1016/j.respol.2021.104563
28
Popp D. (2019). Environmental policy and innovation: a decade of research. Rev. Environ. Econ. Policy13, 1–20. doi: 10.1093/reep/rey017
29
Qin R. (2023). Revisiting low-altitude economy: conceptual definitions and structural analysis. J. Civ. Aviat. Univ. China41, 1–10. Available online at: https://kns.cnki.net/kcms2/article/abstract?v=DJp2nd4LPS2NdRrl0Sj67SYNDkG9aj-EW5H1TewwsZsKQmAW8I428IBekxx-40-a2DpgfhvD8Lzw3JQaxeJjvAsQe_mcn3bRCUNUaHL8eD0AEa5cbeTJtNujRuUfqsEKUiZFrzadznsZOB1u0KtFiMaImwAt4tAlZcVDbp4zf0uvxU6viuzZVw==&uniplatform=NZKPT&language=CHS
30
Rabelo R. J. Bernus P. (2015). A holistic model of building innovation ecosystems. IFAC48, 2250–2257. doi: 10.1016/j.ifacol.2015.06.423
31
Rajendran S. Srinivas S. (2023). A review on the key technologies and challenges in electric vertical take-off and landing (eVTOL) aircraft. Prog. Aerosp. Sci.141:101003. doi: 10.1016/j.paerosci.2023.101003
32
Ritzberger K. Weibull J. W. (1995). Evolutionary selection in normal-form games. Econometrica63, 1371–1399. doi: 10.2307/2171774
33
Straubinger A. Rothfeld R. Shamiyeh M. Büchter K. D. Kaiser J. Plötner K. O. (2020). An overview of current research and developments in urban air mobility – setting the scene for UAM introduction. J. Air Transp. Manag.87:101852. doi: 10.1016/j.jairtraman.2020.101852
34
Thipphavong D. P. Apaza R. Barmore B. Battiste V. Burian B. Dao Q. et al . (2018). Urban air mobility airspace integration concepts and considerations. In 2018 aviation technology, integration, and operations conference. Atlanta, GA: American Institute of Aeronautics and Astronautics.
35
Toreini P. Langbein J. Amoretti M. (2020). A survey on communication and navigation technologies for urban air mobility. J. Intell. Robot. Syst.100, 1463–1486. doi: 10.1007/s10846-020-01252-7
36
Ullah A. Zhao K. Memon B. A. (2025). Environmental regulations and corporate innovation: a resilience perspective. Technol. Forecast. Soc.200:123456. doi: 10.1016/j.techfore.2025.123456
37
Vascik P. D. Hansman R. J. (2017). “Constraint identification in the development of urban air mobility,” in 2017 Aviation technology, integration, and operations conference. Denver, CO: American Institute of Aeronautics and Astronautics.
38
Wang J. Li M. (2025). A systems approach to resilient innovation ecosystems in low-altitude economy. Systems13:306. doi: 10.3390/systems13050306
39
Weibull J. W. (1995). Evolutionary game theory. Cambridge, Massachusetts: MIT Press.
40
Yang W. (2018). The evolutionary game theoretic analysis for sustainable cooperation relationship of collaborative innovation network in strategic emerging industries. Sustainability, 10, 4585. doi: 10.3390/su10124585
41
Ye R. Zou M. Yang Z. Shao G. Chen Y. Li T. (2025). “Research on the relationship between urban development and the private economy in Yunnan under the context of low-altitude economy,” In 2025 3rd international academic conference on management innovation and economic development (MIED 2025) (Atlantis Press), 173–193.
42
Zhang H. Li L. (2021). Research on the evolutionary game of enterprise green technology innovation under environmental regulation policy. Environ. Sci. Pollut. Res.28, 64498–64510. doi: 10.1007/s11356-021-15585-9
43
Zhang Y. Li X. (2022). Benefit-sharing mechanisms in public–private R&D collaborations: an evolutionary game approach. Technol. Forecast. Soc.174:121290. doi: 10.1016/j.techfore.2021.121290
44
Zhang Y. Zhou Q. (2025). Dynamics of resilient innovation ecosystems under environmental pressures: a system dynamics approach. J. Clean. Prod.475:143210. doi: 10.1016/j.jclepro.2025.143210
45
Zhou X. Smith J. (2025). The role of green finance in stabilizing multi-stakeholder innovation ecosystems under climate stress. Technol. Soc.74:102882. doi: 10.1016/j.techsoc.2025.102882
Summary
Keywords
low-altitude economy, technological innovation, evolutionary game, tripartite synergy, policy tools
Citation
Xu Q, Cai Q, He C and Xu X (2025) Tripartite evolutionary game analysis of collaborative innovation in the low-altitude economy: a case study of Shenzhen. Front. Sustain. Cities 7:1679964. doi: 10.3389/frsc.2025.1679964
Received
05 August 2025
Accepted
29 October 2025
Published
19 November 2025
Volume
7 - 2025
Edited by
Farhat Abbas, University of Doha for Science and Technology, Qatar
Reviewed by
Sumran Ali, University of Science and Technology of China, China
Xue Lei, Shanghai University, China
Updates
Copyright
© 2025 Xu, Cai, He and Xu.
This is an open-access article distributed under the terms of the Creative Commons Attribution License (CC BY). The use, distribution or reproduction in other forums is permitted, provided the original author(s) and the copyright owner(s) are credited and that the original publication in this journal is cited, in accordance with accepted academic practice. No use, distribution or reproduction is permitted which does not comply with these terms.
*Correspondence: Qiwei Cai, 24600004120102@st.sdju.edu.cn
Disclaimer
All claims expressed in this article are solely those of the authors and do not necessarily represent those of their affiliated organizations, or those of the publisher, the editors and the reviewers. Any product that may be evaluated in this article or claim that may be made by its manufacturer is not guaranteed or endorsed by the publisher.